Assessing Crown Fire Potential by Linking Models of Surface and Crown Fire Behavior - Joe H. Scott Elizabeth D. Reinhardt
←
→
Page content transcription
If your browser does not render page correctly, please read the page content below
United States
Department
of Agriculture
                   Assessing Crown Fire Potential
Forest Service      by Linking Models of Surface
Rocky Mountain
Research Station      and Crown Fire Behavior
Research Paper
RMRS-RP-29

September 2001

                                Joe H. Scott
                           Elizabeth D. Reinhardt
Abstract

            Scott, Joe H.; Reinhardt, Elizabeth D. 2001. Assessing crown fire potential by linking models of
              surface and crown fire behavior. Res. Pap. RMRS-RP-29. Fort Collins, CO: U.S. Department
              of Agriculture, Forest Service, Rocky Mountain Research Station. 59 p.

               Fire managers are increasingly concerned about the threat of crown fires, yet only now are
            quantitative methods for assessing crown fire hazard being developed. Links among existing
            mathematical models of fire behavior are used to develop two indices of crown fire hazard—the
            Torching Index and Crowning Index. These indices can be used to ordinate different forest stands
            by their relative susceptibility to crown fire and to compare the effectiveness of crown fire mitigation
            treatments. The coupled model was used to simulate the wide range of fire behavior possible in a
            forest stand, from a low-intensity surface fire to a high-intensity active crown fire, for the purpose of
            comparing potential fire behavior. The hazard indices and behavior simulations incorporate the
            effects of surface fuel characteristics, dead and live fuel moistures (surface and crown), slope
            steepness, canopy base height, canopy bulk density, and wind reduction by the canopy. Example
            simulations are for western Montana Pinus ponderosa and Pinus contorta stands. Although some of
            the models presented here have had limited testing or restricted geographic applicability, the
            concepts will apply to models for other regions and new models with greater geographic applicability.

            Keywords: canopy fuels, hazard assessment, fireline intensity, rate of spread, crown fraction
                 burned, fire potential

Authors

Joe H. Scott has been a Forester with Systems for Environmental Management, a nonprofit research group based in Missoula,
MT, since 1996. He has a B.S. degree in forestry and resource management from the University of California at Berkeley and
an M.S. degree in forestry from the University of Montana. Joe has participated in investigations of surface and canopy fuels,
fire behavior modeling, and crown fire hazard assessment.

Elizabeth D. Reinhardt is a Research Forester in the Prescribed Fire and Fire Effects Project at the Rocky Mountain Research
Station, Missoula Fire Sciences Laboratory, Missoula, MT. She has degrees in English (A.B., 1978, Harvard University) and
forestry (M.S., 1982, and Ph.D., 1991, University of Montana). Her research has included studies of fuel consumption, tree
mortality, and prescription development.

                                  You may order additional copies of this publication by sending your
                                  mailing information in label form through one of the following media.
                                  Please specify the publication title and series number.

                                                 Fort Collins Service Center

                                               Telephone       (970) 498-1392

                                                      FAX      (970) 498-1396

                                                    E-mail     rschneider@fs.fed.us

                                                 Web site      http://www.fs.fed.us/rm

                                         Mailing Address       Publications Distribution
                                                               Rocky Mountain Research Station
                                                               240 West Prospect Road
                                                               Fort Collins, CO 80526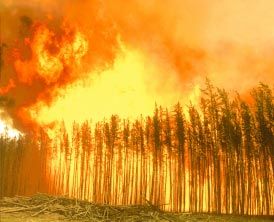
Assessing Crown Fire Potential by
     Linking Models of Surface and
          Crown Fire Behavior

                                 Joe H. Scott
                            Elizabeth D. Reinhardt

USDA Forest Service                                  September 2001
Research Paper RMRS-RP-29
Acknowledgments
We thank Mark A. Finney and Patricia Andrews of the Missoula Fire Sciences Laboratory, Rocky Mountain Research Station;
David B. Sapsis of the University of California at Davis and California Department of Forestry and Fire Protection; and Jim K.
Agee of the University of Washington for thoughtful reviews of an earlier draft of this report.
This research was supported by funds provided by the Interior Fire Coordination Committee, United States Department of
the Interior; the Rocky Mountain Research Station, United States Department of Agriculture, Forest Service; Seymour Johnson
Air Force Base, United States Department of Defense; and Systems for Environmental Management, under cooperative
agreements (RJVA 96-094 and RJVA 98-575).
Software Availability
The NEXUS spreadsheet and its documentation can be obtained at www.fire.org/nexus/nexus.html. Information about other
fire modeling systems described in the text can be obtained at the Fire Management Tools Online Web site at www.fire.org/
perl/tools.cgi.
iiContents
INTRODUCTION .......................................................................................................................... 1
CHARACTERIZING CANOPY FUELS ................................................................................................. 4
EXISTING MODELS OF SURFACE AND CROWN FIRE BEHAVIOR .......................................................... 7
QUANTIFYING THE HAZARD ....................................................................................................... 15
SIMULATING OVERALL SPREAD RATE AND INTENSITY ..................................................................... 19
HYSTERESIS IN CROWN FIRE: THE CONDITIONAL SURFACE FIRE ...................................................... 21
EXAMPLE SIMULATIONS USING THE COUPLED MODEL .................................................................... 27
DISCUSSION ........................................................................................................................... 34
REFERENCES .......................................................................................................................... 34
APPENDIX A: CROWN FRACTION BURNED ............................................................................... 39
APPENDIX B: GLOSSARY ...................................................................................................... 43
APPENDIX C: ENGLISH/METRIC UNIT CONVERSION FACTORS ..................................................... 47
APPENDIX D: NOMOGRAMS .................................................................................................. 49
iiiAssessing Crown Fire Potential by
Linking Models of Surface and
Crown Fire Behavior
Joe H. Scott and Elizabeth D. Reinhardt
INTRODUCTION
Crown fires present special problems to managers. Crown fires are more difficult
to control than surface fires. Their rate of spread is several times faster than surface
fires (Rothermel 1983). Spotting is frequent and can occur over long distances. Larger
flames from crown fires dictate larger firefighter safety zones (Butler and Cohen
1998). Spotting and increased radiation make structures more difficult to defend from
crown fire than surface fire (Cohen and Butler 1998). Effects of crown fire are more
severe and lasting than surface fire. Near total tree mortality should be expected.
Smoke production will be greater, and foliar nutrients may be lost from the site.
Crown fires can occur in a wide variety of forest types throughout the United
States (Agee 1996). Increasingly, crown fires are taking place in forest types not
historically prone to crown fires, such as ponderosa pine forests (Mutch and others
1993). A significant risk to life and property exists wherever forest stands prone to
crown fire lie in proximity to residential or recreational development. Therefore, as-
sessing the susceptibility of forest stands to crown fire and designing fuel and silvi-
cultural treatments to reduce susceptibility have become priorities for many land
management agencies.
Accepted methods exist for predicting surface fire behavior (Rothermel 1972,
1983) and crown fire behavior (Rothermel 1991a), but not for predicting the
transition between them. In this paper we explore the use of Van Wagner’s crown
fire transition criteria (Van Wagner 1977, 1989, 1993), elements of which are
used in the Canadian Forest Fire Behavior Prediction (FFBP) System (Forestry
Canada Fire Danger Group 1992), to link Rothermel’s separate surface fire and
crown fire spread models. By linking these models we derive indices of crown
fire hazard and simulate the full range of potential fire behavior possible in a
forest stand—surface through active crowning.
Other models of surface fire behavior (Catchpole and others 1998) and crown
fire behavior (Albini 1996; Grishin 1997; Gomes da Cruz 1999) and transition
to crown fire (Alexander 1988; Gomes da Cruz 1999) are in various stages of
development and testing. Until a robust fire behavior model is developed that
internally simulates surface fire behavior, transition to crown fire, and crown
fire behavior, we will need to rely on the links between these separate models.
From the array of available models, we chose to couple the most widely used for
this analysis: Rothermel’s (1972) surface and (1991a) crown fire models, and Van
Wagner’s (1977) models of transition to crown fire. The concepts we present, solv-
ing for critical environmental conditions that lead to crown fire and producing full-
range estimates of fire behavior, can be applied to other models in the future.
USDA Forest Service Research Paper RMRS-RP-29. 2001. 1The coupled model produces seamless, full-range estimates of fire behavior
(whether surface or crown). However, the purpose of those fire behavior esti-
mates is to compare the relative susceptibility of different stands to crown fire,
not to predict the behavior of an actual fire. The method we developed allows
direct, quantitative comparison of the relative crown fire potential of different
stands from a description of surface fuels, canopy fuels, site characteristics, and
environmental conditions.
Conceptual Approach to Quantifying Crown Fire Hazard
The concept of hazard has been defined many ways in the wildland fire litera-
ture (Bachman and Allgöwer 1999). Fire hazard is sometimes referenced to the
specific fuel element that most contributes to the potential fire behavior of a
given site. For example, the increased potential fire behavior caused by activity
fuels left behind after timber harvesting is sometimes referred to as a “slash haz-
ard.”
The field of technical risk engineering defines hazard more generally as a
physical situation with a potential for human injury, damage to property, or
damage to the environment. Crown fire hazard, therefore, is a physical situa-
tion (fuels, weather and topography) with potential for damage or injury caused
by crown fires. The nature of crown fires—intense, fast-moving, and destruc-
tive—suggests that potential for damage is great whenever a crown fire occurs.
Assessing the hazard posed by crown fire is therefore a matter of assessing
the potential for their occurrence—of identifying the physical situations that
lead to crown fire occurrence.
The potential for crown fire occurrence does not depend on any single element of
the fuel complex, nor on any one element of the fire environment. Rather, crown fires
result from certain combinations of fuels, weather, and topography that lead to the
development and continued spread of crown fires. The concepts and models we dis-
cuss in this paper are geared toward determining those combinations, without attempt-
ing to determine which component contributes most to the hazard.
This is not the first attempt to assess crown fire potential. Fahnestock (1970)
developed a heuristic key to rate crowning potential based largely on canopy
closure, (individual tree) crown density, and the presence or absence of ladder
fuels. Kilgore and Sando (1975) showed a decrease in crown fire potential fol-
lowing prescribed burning in a giant sequoia/mixed-conifer forest by comparing
canopy fuel weight, crown volume ratio, mean height to canopy base, and the
vertical profile of canopy fuel packing ratio before and after a prescribed fire.
Taylor and others (1998) assessed temporal changes in crown fire hazard at the
landscape scale by noting the change in relative frequency of different types of
crown fire in different time periods.
The mathematical nature of surface and crown fire models allows us to link them
together and solve for the critical conditions that lead to crown fires. The crown fire
hazard assessment method we develop in this paper is based on the determination of
critical environmental conditions that lead to different types of crown fire activity.
In the next two sections we review fire behavior concepts and models perti-
nent to quantitative crown fire hazard assessment. In later sections we present the
derivation and interpretation of two indices of stand-level crown fire hazard,
discuss methods of obtaining the necessary canopy fuel inputs, and introduce
seamless surface/crown fire behavior simulations that can be used to assess the
likely range of fire behavior at a site and the nature of the transition from surface
to crown fire. In addition, we introduce the concept of hysteresis in the crown fire
phenomenon.
2 USDA Forest Service Research Paper RMRS-RP-29. 2001Types of Wildland Fire
Fire scientists and managers recognize three general types of wildland fire, de-
pending on the fuel stratum in which the fire is burning. A ground fire is one that burns
in ground fuels such as duff, organic soils, roots, rotten buried logs, and so forth.
Ground fuels are characterized by higher bulk density than surface and canopy fuels.
Ground fires burn with very low spread rates but can be sustained at relatively high
moisture contents (Frandsen 1987, 1991). Fuel consumption through ground fire can
be great, causing significant injury to trees and shrubs. Although ground fuels can be
ignited directly, they are most commonly ignited by a passing surface fire.
A surface fire is one that burns in the surface fuel layer, which lies immedi-
ately above the ground fuels but below the canopy, or aerial fuels. Surface fuels
consist of needles, leaves, grass, dead and down branch wood and logs, shrubs,
low brush, and short trees (Brown and others 1982). Surface fire behavior varies
widely depending on the nature of the surface fuel complex.
A crown fire is one that burns in the elevated canopy fuels. Canopy fuels
normally consumed in crown fires consist of the live and dead foliage, lichen,
and fine live and dead branchwood found in a forest canopy. They have higher
moisture content and lower bulk density than surface fuels. We generally recog-
nize three types of crown fire: passive, active, and independent (Van Wagner
1977).
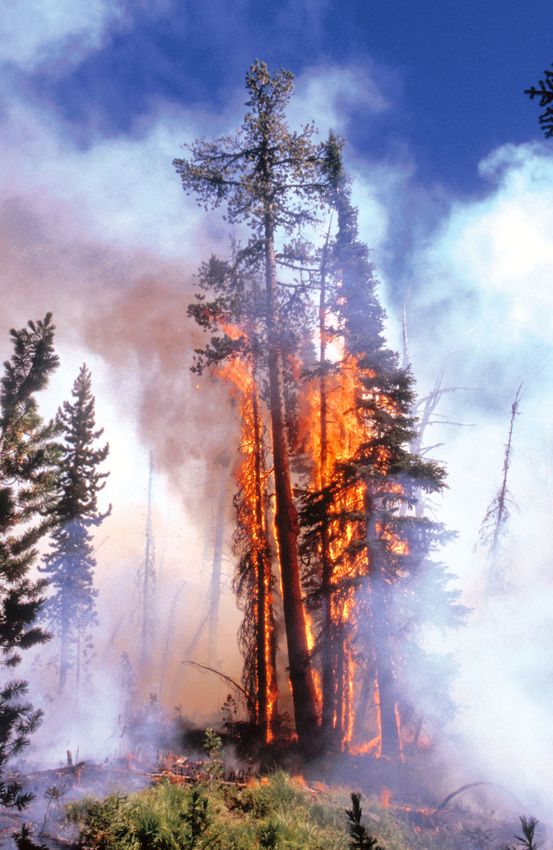
A passive crown fire, also called torching or candling, is one in which individual
or small groups of trees torch out, but solid flame is not consistently maintained in the
canopy (fig. 1a). Passive crowning encompasses a wide range of fire behavior, from
the occasional tree torching out to a nearly active crown fire. The increased radiation
a
b
Figure 1—Passive crowning (a) involves individual or small groups of trees, whereas during active crowning (b) the whole fuel complex
burns as a unit. Photo (a) by Duncan Lutes; photo (b) by Jim Kautz.
USDA Forest Service Research Paper RMRS-RP-29. 2001. 3to surface fuels from passive crowning increases flame front spread rate, especially at
the upper end of the passive crown fire range. Embers lofted during passive crowning
can start new fires downwind, which makes containment more difficult and increases
the overall rate of fire growth. Passive crowning is common in many forest types,
especially those with an understory of shade-tolerant conifers.
An active crown fire, also called a running or continuous crown fire, is one in
which the entire surface/canopy fuel complex becomes involved (fig. 1b), but the
crowning phase remains dependent on heat from the surface fuels for continued
spread. Active crown fires are characterized by a solid wall of flame extending
from the fuel bed surface through the top of the canopy. Greatly increased radia-
tion and short-range spotting of active crown fires lead to spread rates much
higher than would occur if the fire remained on the surface. Medium and long-
range spotting associated with active crowning leads to even greater rates of fire
growth.
An independent crown fire is one that burns in canopy fuels without aid of a
supporting surface fire. Independent crown fires occur rarely and are short lived
(Van Wagner 1993), requiring a combination of steep slope, high windspeed, and
low foliar moisture content. Many apparently independent crown fires may actu-
ally be active crown fires in which the canopy phase is momentarily pushed ahead
of the surface phase under the influence of steep slope or strong wind.
Few cases of independent crown fire have been documented. The 1987 South
Mowich fire occurred over a spring snowpack on the slopes of Mount Rainier,
WA (Huff 1988). However, the primary mechanism of fire spread during that fire
was crown-to-crown spread in which lichens ignited first, then the foliage after
being preheated by burning lichen. Radiation from the torching tree then ignited
lichen on an adjacent tree. Spread rate was low—the fire took 2 days of uncontained
spread to reach 25 ha.
We do not address independent crown fires in this paper because they occur
so rarely and because no model of their behavior is available.
The Canadian Forest Fire Behavior Prediction System (Forestry Canada Fire Danger
Group 1992) uses the term “intermittent crown fire” to describe a fire that alternates
in space and time between continuous crowning and surface fire or passive crowning.
Such a phenomenon could result from spatial variability in surface and canopy fuels,
or temporal variability in windspeed, especially when conditions are near the thresh-
old for active crowning.
CHARACTERIZING CANOPY FUELS
Assessing crown fire potential requires the most accurate estimates of canopy fuel
characteristics possible. However, the literature provides little guidance for determin-
ing these characteristics at the stand level. A rich body of literature does exist on quan-
tification of tree crown and forest canopy characteristics for purposes other than fuel
characterization for crown fire modeling.
Reinhardt and others (2000) are attempting to accurately measure canopy fuel
characteristics in a range of forest types and stand densities. These accurate mea-
surements will then be compared with estimates made using two indirect ap-
proaches: instrument-based optical techniques and inventory-based techniques.
The indirect techniques have proven useful in a modeling framework. They now
need to be calibrated and verified for operational use. In addition, photographs
made of the sample stands will provide a good start for a canopy fuel photo
guide.
Three main characteristics of canopy fuels must be quantified to use the coupled
models: canopy bulk density, canopy base height, and foliar moisture content.
Canopy bulk density is the mass of available canopy fuel per unit canopy vol-
ume. It is a bulk property of the stand, not an individual tree. We use the term
4 USDA Forest Service Research Paper RMRS-RP-29. 2001crown bulk density for reference to the bulk fuel properties of an individual tree.
Canopy base height is more difficult to define, but it too is a bulk property of a
stand, whereas crown base height is a property of an individual tree.
Alternative techniques for estimating canopy bulk density and base height are
described below. We do not yet know the relative accuracy of these methods.
Inventory-based techniques hold promise for highest accuracy, but other meth-
ods are better for mapping large areas. Pending further research, we suggest us-
ing inventory-based techniques where possible.
Canopy Bulk Density
With Rothermel’s (1972) surface fire model we specify the fuels that may
potentially be consumed in the flaming fire front (Wo), and the model then esti-
mates what portion of that fuel actually contributes to propagation of the fire
front. However, with canopy bulk density (CBD) we specify, before the fact, the
canopy fuels that would be consumed in the flaming front of a fully active crown
fire. It is reasonable to assume that the foliage, lichen, and moss are consumed in
the flaming front of a fully active crown fire. Some portion of the live and dead
branch wood less than 6 mm diameter should also be consumed in the flaming
front (Brown and Bradshaw 1994; Brown and Reinhardt 1991; Reinhardt and
others 1997). A model by Call and Albini (1997) suggests that 65 percent of
canopy fuel 0 to 6 mm diameter at 100 percent moisture content would be con-
sumed in a crown fire. However, Call and Albini acknowledge that their model
overpredicts consumption in small size classes.
For uniform stands, CBD can be computed as the available canopy fuel load
divided by canopy depth (Keane and others 1998). This method carries the im-
plicit assumption that canopy biomass is distributed uniformly within the stand
canopy, which is unlikely to be true even in stands with simple structures;
multistoried stands are probably even more poorly represented by this proce-
dure.
Following Sando and Wick (1972), the Fire and Fuels Exten-
25
sion to the Forest Vegetation Simulator (FFE-FVS, Beukema
and others 1997) uses a technique to estimate “effective” CBD
in nonuniform stands from a stand inventory that does not as-
sume a uniform vertical distribution of canopy fuel. Therefore,
20
CBD does not necessarily equal canopy load divided by canopy
Height above ground, m
depth. In FFE-FVS, CBD was defined as the maximum 4.5-m
deep (15-foot) running mean of canopy bulk density for layers
15 0.3 m (1 ft) thick (fig. 2). This method yielded encouraging and
realistic results when applied to stand exam data on the Idaho
5-m running mean
foliage and fine branches
Panhandle National Forests. However, we have no way of know-
10 ing if the results are accurate because canopy fuels have never
fine bra
been measured directly.
folia
nches
A number of studies exist that predict foliar and branch bio-
ge
mass from tree dimensions, typically diameter, sometimes in
fine
folia ranch
5
b
ge
combination with height, crown ratio, or sapwood thickness.
and s
Brown (1978) provides predictive equations for the common co-
e
0
nifer tree species of the Inland West; Snell and Brown (1980)
0.0 0.1 0.2 0.3 provide similar methods for Pacific Northwest conifers. A large
number of allometric equations of this type from many research
Canopy bulk density, kg m-3 studies are summarized in the computer software BIOPAK
(Means and others 1996). These equations, together with a list
Figure 2—Vertical profile of canopy bulk density in a
lodgepole pine (Pinus contorta) stand on the Bit- of trees representing a stand, may be used to estimate foliage
terroot National Forest, Montana. Effective canopy load, as well as the load of branchwood of various sizes.
bulk density is taken to be the maximum 5-m run-
ning mean (0.21 kg m-3).
USDA Forest Service Research Paper RMRS-RP-29. 2001. 5An alternative method of estimating foliage load is to first estimate leaf area index
(LAI) using onsite measurement. Several optical instruments are available for esti-
mating LAI (Fassnacht and others 1994; Smith and Somers 1993; Welles 1990). Leaf
area index can be converted to an estimate of foliar biomass using specific leaf area
factors (for example, Keane and others 1996). Published values for specific leaf area
exist for many conifer species.
A canopy fuel photo guide would help managers quantify canopy bulk den-
sity in the field. Further research into the nature and properties of canopy fuels is
needed before we can fully exploit existing and future models of crown fire be-
havior.
Canopy Base Height
Crown base height is a simple characteristic to measure on an individual tree.
Canopy base height (CBH ) is not well defined or easy to estimate for a stand.
Neither the lowest crown base height in a stand nor the average crown base height
is likely to be representative of the stand as a whole. Canopy base height is diffi-
cult to measure in multistory stands and stands with ladder fuels. Van Wagner
(1993) reduced observed CBH to account for ladder fuels in a two-story stand.
Defined in terms of its consequences to crown fire initiation, CBH is the lowest
height above the ground at which there is sufficient canopy fuel to propagate fire
vertically through the canopy. Using this definition, ladder fuels such as lichen,
dead branches, and small trees are incorporated. Sando and Wick (1972) esti-
mated canopy base height of nonuniform stands based on the height at which a
minimum bulk density of fine fuel (100 lb acre-1 ft-1, 0.037 kg m-3) is found.
The Fire and Fuels Extension to the Forest Vegetation Simulator (Beukema
and others 1997) uses the Sando and Wick approach in combination with Brown’s
(1978) equations to estimate canopy base height and canopy bulk density. Canopy
base height was defined as the lowest height above which at least 30 lb acre-1 ft-1
(0.011 kg m-3) of available canopy fuels is present.
Ladder fuels that increase the intensity of the surface fire, such as short under-
story trees, shrubs, and needle drape, are best accounted through custom surface
fuel modeling or by simple adjustment of simulated surface fire intensity to in-
clude their effect.
Foliar Moisture Content
Foliar moisture content (FMC) has less influence over crown fire initiation
than CBH , but its theoretical effect on crown fire spread rate through the foliar
moisture effect (Van Wagner 1993) is much stronger (Scott 1998). Numerous
studies of FMC have been conducted throughout North America (Alexander 1988).
Moisture content of conifer foliage varies among species and seasons (Philpot
and Mutch 1971), but not from day to day (Hartford and Rothermel 1991) or year
to year (Philpot and Mutch 1971). The Forestry Canada Fire Danger Group (1992)
related the timing of seasonal changes in FMC to latitude, longitude, and eleva-
tion.
In old foliage (at least 1 year old), the lowest moisture contents have been
found in Picea mariana (Chrosciewicz 1986; Springer and Van Wagner 1984),
and Picea glauca, Picea banksiana, and Abies balsamea (Chrosciewicz 1986),
each with a low FMC near 75 percent (though the lowest FMC may occur outside
the fire season). Highest old-foliage moisture content was found in Pinus clausa
(Hough 1973) and Abies balsamea (Kozlowski and Clausen 1965; Little 1970),
with values near 150 percent. The range of old-foliage FMC for most species
straddles 100 percent, so this value has been used as a default FMC if no other
information is available (Finney 1998; Scott 1998). Future research should be
6 USDA Forest Service Research Paper RMRS-RP-29. 2001directed at compiling existing FMC data for Western conifers, then conducting
field research to fill in gaps in the data. Larger errors in estimating effective FMC
probably result from variable amounts of dry dead fuels and lichen in the canopy.
Van Wagner (1993) estimated effective FMC by computing the loading-weighted
average moisture content of the foliage and fine dead canopy fuels. Until better
data exist, using 100 percent for FMC is a reasonable approach, especially given
the relative insensitivity of the models to this parameter.
EXISTING MODELS OF SURFACE AND CROWN FIRE BEHAVIOR
The basic behavior of surface and crown fires can be described by fireline
intensity (I), forward rate of spread (R), and heat (release) per unit area (HPA). (A
complete list of symbols used in this paper can be found in table 1.) Fireline
intensity is the rate of heat release in the flaming front per unit length of fire
front. Byram (1959) defines fireline intensity, I, as
HW f R
I= (1)
60
where H is the heat yield of the fuel (kJ kg-1), Wf is the weight of fuel consumed
in the flaming front (kg m-2), R is the forward rate of spread of the fire (m min -1),
and 60 is a conversion factor so that the units for I reduce to kW m-1(kJ m-1 min-1).
Byram uses the term “available fuel” to describe Wf, but he evidently refers to the
weight of fuel available to the flaming fire front, not the total amount consumed
in flaming and smoldering combustion. In the remainder of this paper, intensity
should be taken to mean Byram’s fireline intensity as defined in equation 1.
Heat (release) per unit area is the product of the heat yield of fuels, H, and the
weight of fuel consumed in the flaming front, Wf. Therefore, HPA is identical to
the quantity HWf in equation 1. Heat per unit area can also be expressed (Andrews
and Rothermel 1982) as
HPA = I R t R (2)
where IR is reaction intensity (kJ min-1 m-2) and tR is residence time in minutes
(Anderson 1969)
12.595
tR = (3)
σ
where σ is the characteristic surface-area-to-volume ratio (cm-1) of the fuel bed.
Neither Rothermel’s (1972) model nor BEHAVE (Andrews 1986) explicitly
computes Wf, but because HWf in equation 1 is equivalent to HPA, Wf can be
computed as
HPA
Wf = (4)
H
Fuel Consumption at the Flaming Front
Conflicting and ambiguous terminology has led to confusion in determining
Wf for use in equation 1 and its variants (see table 2). Total fuel load, Wt, is the
maximum amount of fuel, including duff and large woody fuels (>76 mm diam-
eter), that could possibly be consumed in a hypothetical fire of the highest inten-
sity in the driest fuels (Byram 1959). Available fuel, Wa, is that portion of the
USDA Forest Service Research Paper RMRS-RP-29. 2001. 7Table 1—Symbols and variables used in the text.
Symbol Definition
s
B,C,E Terms in Rothermel’s (1972) model, all functions of
CBD Canopy bulk density, kg m-3
CBH Canopy base height, m
CFB Crown fraction burned
FMC Crown foliar moisture content, percent
FME Foliar moisture effect
HPA Heat (release) per unit area, kJ m-2
H Heat yield of fuel, kJ kg-1
I Byram’s fireline intensity, kW m-1
I'initiation Critical I for initiating a crown fire, kW m-1
IR Reaction intensity, kW m-2
O Open (6.1-m) windspeed, km hr-1
O'active Critical open windspeed for sustaining fully active crown fire, km hr-1
O'cessation Critical open windspeed for crown fire cessation, km hr-1
O'initiation Critical open windspeed for crown fire initiation, km hr-1
Qig Heat of preignition, kJ kg-1
R Forward rate of spread, m min-1
Ractive R for a fully active crown fire, m min-1
R'active Critical R for sustaining an active crown fire, m min-1
Rfinal R for any type of fire: surface, passive crown, or active crown, m min-1
R'initiation Critical R for initiating a crown fire, m min-1
Rsurface R for a surface fire, m min-1
S Mass-flow rate of crown fuel, kg m-2 s-1
tR Flame residence time, min
U Midflame windspeed, km hr-1
Wa Available fuel, or total fuel consumption, kg m-2
Wc Fuel available for convection, kg m-2
Wcanopy Weight of available canopy fuel, kg m-2
Wf Weight of fuel consumed in the flaming front, kg m-2
Wn Wo with the mineral content removed, kg m-2
Wo Fine fuel that can potentially contribute to flaming front, kg m-2
Wt Total fuel load, kg m-2
WRF Wind reduction factor
b Fuelbed packing ratio
bop Optimum fuelbed packing ratio
e Effective heating number
x Propagating flux ratio
rb Oven-dry fuel bed bulk density, kg m-3
s Surface-area-to-volume ratio of fuel particles, cm-1
fs Slope factor
fw Wind coefficient
f'w (initiation) Critical wind coefficient for crown fire initiation
total fuel load that is consumed in a given fire; it must always be less than or
equal to Wt (fig. 3). Unless otherwise specified, Wa includes the consumption of
duff and large woody fuels, most of which takes place after passage of the fire
front. Equation 1 requires Wf, the usually much smaller quantity of fuel that is
consumed in the flaming fire front. The Forestry Canada Fire Danger Group
(1992) uses equation 1 to define frontal fire intensity (as opposed to Byram’s
fireline intensity) in the Canadian Forest Fire Behavior Prediction System by
using Wa (total fuel consumption) in place of Wf. In forest fuel complexes with
duff and coarse fuels, Wa can be many times larger than Wf, so values of frontal
8 USDA Forest Service Research Paper RMRS-RP-29. 2001Table 2—Definition of fuel loading, consumption and availability terms and variables. All quantities are
measured in mass per unit area (kg m-2).
Term Symbol Definition
Total biomass The total amount of living and dead vegetation per unit
area, including vegetation that is never consumed in a
fire, such as live tree boles and large live branches.
Total fuel load Wt The maximum amount of fuel per unit area that can
possibly be consumed in a fire of the highest possible
intensity in the driest possible fuels.
Available fuel Wa The total amount of fuel per unit area that is consumed by
a fire, including the post-frontal consumption of duff,
organic soils, and large woody fuels like logs.
Fuel available for Wc The amount of fuel per unit area that is consumed in a
convection short enough time and with enough intensity to contribute
to the convection column. It is usually larger than Wf but
smaller than Wa because only a fraction of postfrontal
combustion contributes to convection.
Fuel consumed Wf The amount of fuel per unit area that is consumed within
within the and contributes to fire behavior in the flaming front of the
flaming front fire. In Rothermel’s (1972) surface fire model this only
includes fuels less than 7.6 mm diameter.
Total fine fuel loada Wo The amount of surface fuel per unit area less than 7.6 mm
diameter. This term is used in the Rothermel (1972)
surface fire spread model.
Net fuel load Wn The net amount of surface fuel per unit area less than 7.6 mm
diameter after the mineral fraction has been sub
tracted. It is always slightly less than Wo. Wn is also a term
from the Rothermel spread model.
a
This term was originally called total fuel load in the Rothermel (1972) model; we modified it here to avoid conflict with
Byram’s definition of Wt.
Fuel load terms
Wt
Wo
Wn
Fuel consumption
crown fire Figure 3—Comparison of fuel
Wa loading, consumption, and avail-
Wc ability terms for a hypothetical
fuel complex under conditions of
Wf (a) high dead fuel moisture that
leads to surface fire, and (b) low
surface fire
dead fuel moisture that leads to
Wa
active crown fire. Terms are de-
duff
Wc fined in table 2.
surface < 7.6cm
Wf surface > 7.6cm
canopy fuel
0 2 4 6 8 10 12 14
Fuel load, kg m-2
USDA Forest Service Research Paper RMRS-RP-29. 2001. 9fire intensity should also be many times larger than the fireline intensity used in
this paper. Values of frontal fire intensity from the Canadian FFBP System are
therefore not directly comparable to values of fireline intensity reported here.
Rothermel (1991a) resurrected Byram’s concept of the “power of the fire” to
identify potential plume-dominated fire conditions. To compute the power of the
fire, Rothermel (1991a) estimated the amount of fuel consumed in a short enough
time and with enough intensity to contribute to the convection column, Wc.
Rothermel refers to the energy produced by Wc (that is, H * Wc) as the unit en-
ergy, which is analogous to heat per unit area in the surface fire model. Rothermel’s
analysis using Albini’s (1976) BURNOUT model indicated that Wc was only
slightly greater than Wf.
Further confusion is brought about by variable names from the Rothermel
surface spread model (1972). In that model, Wo, which Rothermel called total
fuel load, is actually a subset of the total fuel load defined by Byram. Unlike Wt,
Wo includes only those fuel components that contribute significantly to fire be-
havior at the flaming front. By convention, only the dead fuels less than 76 mm
diameter and live fuels less than 6 mm diameter are included in Wo (Rothermel
1972). In the Rothermel (1972) model, Wn is the net weight of Wo after the min-
eral fraction has been subtracted. Mineral fraction is usually held constant at
0.055, so Wn = Wo (1 – 0.055). Some authors have incorrectly used Wn in place of
Wf (for example, Bessie and Johnson 1995, equation 12). This error can result in
a many-fold over-calculation of intensity, because the Rothermel model predicts
that Wf is only a small fraction of Wn in forest fuels.
For crown fires, Wf is the combined weight of surface and canopy fuels con-
sumed in the flaming front. An active crown fire consumes nearly all of the fine
crown fuels in a given area, while a passive or intermittent crown fire consumes
only a portion (Van Wagner 1993).
It will later be necessary to estimate the spread rate that leads to a given fireline
intensity by rearranging equation 1. The difficulty of determining Wf for use in
equation 1 and its derivatives can be avoided by replacing HWf with HPA in equa-
tion 1.
HPA * R
I= (5)
60
The Rothermel surface fire spread model was developed to predict spread
rate; only through combination with a model of residence time (Anderson 1969)
can the Rothermel spread model be used to estimate HPA and I (Andrews and
Rothermel 1982). As such, estimates of I are not as reliable as those of R from the
Rothermel model. However, the Rothermel model is the best choice currently
available for estimating the fireline intensity in surface fires. With testing, the
BURNUP model (Albini and Reinhardt 1995; Albini and others 1995) may prove
useful in estimating fuel consumed in the flaming front of surface fires.
Surface Fire Behavior
For this analysis surface fire spread rate is simulated with Rothermel’s (1972)
model as adjusted by Albini (1976) and implemented in BEHAVE (Andrews 1986),
FARSITE (Finney 1998), NEXUS (Scott 1999), and other fire modeling sys-
tems. Headfire rate of spread for upslope winds is expressed (Rothermel 1972)
I R ξ (1 + φw + φs )
Rsurface = (6)
ρbεQig
10 USDA Forest Service Research Paper RMRS-RP-29. 2001The Rothermel model has many input factors. Fuelbed characteristics have
been combined into standard fuel models (Anderson 1982) that represent styl-
ized fuelbeds. Custom fuel models can be created from a fuel inventory or by
adjusting one of the standard fuel models (Burgan 1987; Burgan and Rothermel
1984). As employed in this analysis, the Rothermel model can be used with ei-
ther standard or custom fuel models to simulate surface fire behavior. Standard
fuel models often do not accurately simulate both spread rate and fireline inten-
sity simultaneously for a given simulation. Even custom models are difficult to
calibrate so that both rate of spread and fireline intensity are accurately simulated
over a range of environmental conditions. For assessing crown fire hazard using
the models outlined in this paper, accurate simulation of surface fireline intensity
is more important than spread rate accuracy. The selection of a standard model or
calibration of a custom model should reflect this importance.
Crown Fire Behavior
Foresters and ecologists use the term crown in reference to the branches and
foliage of individual trees, and the term canopy when referring to the aggregation
of crowns at the group or stand level. Technically, a crown fire is one that con-
sumes the crowns of individual trees (a passive crown fire), while a canopy fire
would be one that burns in the whole canopy stratum as a unit (active or continu-
ous crowning). However, we customarily refer to both types of fires as crown
fires. We will continue to use the term crown fire to refer to both crown and
canopy fires because the modifiers passive and active distinguish the two types.
Several models of active crown fire spread rate are now available (Albini 1996;
Gomes da Cruz 1999; Grishin 1997; Rothermel 1991a). Each model carries prob-
lems or assumptions that limit its application. Despite its shortcomings, we use
the Rothermel (1991a) procedure to estimate crown fire spread rate because it is
the most widely used of the available models.
The Rothermel (1991a) correlation was intended for the Northern Rocky Moun-
tains and other areas with similar fuels, climate, and topography. He used linear re-
gression to relate coarse-scale observed crown fire spread rates to predictions made
with his surface fire model using fuel parameters from Fire Behavior Fuel Model
(FM) 10 (Anderson 1982). Midflame windspeed was set to 40 percent of the ob-
served 6.1-m (20-ft) windspeed. In simple form, the Rothermel (1991a) correlation
for average crown fire spread rate is
Ractive = 3.34(R10 )40% (7)
where (R10)40% is the spread rate predicted with Rothermel’s (1972) surface fire
model using the fuel characteristics for FM 10 and midflame windspeed set at 40
percent of the 6.1-m windspeed.
The input factors from FM 10 must be used to predict crown fire spread rate
using Rothermel’s method, not the actual surface fuel characteristics. Bessie and
Johnson (1995) used actual surface fuel characteristics, which can result in errors
of nearly an order of magnitude, depending on the nature of the actual surface
fuels. However, the mandatory use of FM 10 applies only to simulating crown
fire spread rate with Rothermel’s (1991a) correlation—surface fire spread rate
can still be simulated with any appropriate standard or custom fuel model. The
midflame windspeed for use in the correlation must be set at 40 percent of the
open windspeed, not at the midflame wind that would be used for simulating
surface fire behavior. For surface fires, midflame winds are estimated by multi-
plying the open wind (6.1-m in the United States) by a wind reduction factor,
WRF, the ratio of midflame to open windspeeds. In forest stands on level ground,
USDA Forest Service Research Paper RMRS-RP-29. 2001. 11Albini and Baughman (1979) estimate WRF from stand height and crown filling
fraction (the fraction of the canopy volume that is occupied by tree crowns). The
WRF for forest stands is most often in the range 0.10 to 0.3 (Rothermel 1983).
Rothermel’s correlation is limited to wind-driven crown fires—plume-domi-
nated crown fires are not predicted by this or any other crown fire spread model.
We must make additional assumptions before applying Rothermel (1991a) to
the coupled model. First, we assume the Rothermel crown model estimates the
spread rate of fully active crown fires, though some of his fires, such as the 1989
Black Tiger fire (NFPA 1990), were likely not fully active. In that respect the
Rothermel correlation might underestimate the spread rate of a true fully active
crown fire. Second, we assume that the correlation simulates the flame front
spread rate alone, without the effect of spotting. However, the observed spread
rates used in the correlation included the effect of short- and medium-range spot-
ting on overall fire spread rate. In that respect the correlation should overpredict
spread rate of the flame front itself. Last, we use the average spread rate from
Rothermel (1991a) rather than the maximum he observed. Therefore, crown fire
runs with spread rates faster than the coarse-scale average are possible and will
be underpredicted in our method. The combined effects of fires with significant
spotting and less than fully active crowning in the Rothermel correlation on simu-
lated active crown fire spread rate is uncertain.
Despite these limitations, the lack of practical alternative models requires
that we use Rothermel’s (1991a) method to simulate spread rate of a fully active
crown fire flame front. Different models of active crown fire spread rate—an
improved empirical model (Gomes da Cruz 1999) or a metamodel derived from
a physical model—can be substituted as they become available.
To derive an index of crown fire potential, equation 7 must be written in its
mathematical form
I ξ (1 + φw + φs )
Ractive = 3.34 R (8)
ρbεQig FM 10
where all terms are evaluated for the characteristics of FM 10. In Rothermel’s
correlation, crown fire rate of spread depends only on open windspeed, surface
fuel moisture contents, and slope steepness, but not on actual surface or canopy
fuel characteristics. Active crown fire spread rate probably also varies with other
canopy characteristics such as foliar moisture content (Van Wagner 1974, 1989)
and canopy bulk density. However, the models that include canopy bulk density
show contradictory effects of canopy bulk density on spread rate. Grishin’s (1997)
physical model indicates increasing spread rate with decreasing canopy bulk den-
sity, whereas the empirical model developed by Gomes da Cruz (1999) shows a
direct relationship. Albini’s crown fire model has not yet been exercised suffi-
ciently to determine how it will respond to variation in canopy bulk density. Until
the conflicting effects of canopy bulk density on crown fire spread rate can be
resolved, using a model that does not include this variable is not unreasonable.
Foliar Moisture Effect
The Rothermel correlation can be extended to include the theoretical effect of
foliar moisture content, FMC, on crown fire spread rate using the foliar moisture
effect, FME, defined by Van Wagner (1974, 1989, 1993) as
(15
. −.00275FMC )
4
FME = (9)
460 + ( 25.9 FMC )
12 USDA Forest Service Research Paper RMRS-RP-29. 2001The FME is always applied as a ratio of FME to a normal value, FMEo, which
is based on the FMC in the data used to construct the crown spread rate model.
The FMC of the fires used in the Rothermel correlation was not documented and
surely varied among the fires. Therefore, using the FME concept with Rothermel’s
model will require a derivation of FMEo based on some alternative FMC, such as
an overall average FMC among all species during the fire season in the Northern
Rocky Mountains. Taking the range of FMC to be 85 to 120 percent and assum-
ing an average of 100 percent, the ratio FME/FMEo would range from 0.714 to
1.31. Incorporating the FME concept, equation (8) becomes
FME I R ξ (1 + φ w + φ s )
Ractive = 3.34 (10)
FME o ρ b εQig FM 10
where FMEo is 0.0007383 for a reference FMC of 100 percent. The foliar mois-
ture effect will not be used further in this paper. However, FME is included as an
option in NEXUS; interested readers can examine its effect on crown fire spread
rate and the Torching and Crowning Indices themselves.
Criterion for Crown Fire Initiation
Several models of crown fire initiation are available. Most are semiempirical
with a basis in convection theory (Alexander 1998; Van Wagner 1977;
Xanthopoulous 1990) that consequently need estimates of heat release rate (fireline
intensity) for determining the upward heat flux. Gomes da Cruz (1999) devel-
oped a logistic regression model based largely on fuel strata gap (similar to canopy
base height) and total surface fuel consumption (as a surrogate for Wf). Gomes da
Cruz used total surface fuel consumption to avoid difficulties in estimating fireline
intensity. However, surface fuel consumption is itself difficult to estimate.
Alexander’s model is similar to Van Wagner’s, but accounts for the effects of
flaming residence time, plume angle, and fuel bed characteristics. While these
additional inputs may improve predictions, they are difficult to estimate, so their
inclusion is of dubious value. Because of the lack of high quality observations,
none of these crown fire initiation models has been rigorously tested against
independent data.
We selected Van Wagner’s (1977) model of crown fire initiation because it is the
most widely used of the potential models, if only because it is one of the oldest. Van
Wagner (1977) theorized that canopy fuels ignite when heat supplied by a surface fire
drives off their moisture and raises them to ignition temperature. He identified the
critical (minimum) fireline intensity of a surface fire, I'initiation, that will initiate a crown
fire. Van Wagner’s (1977) separate equations can be combined as follows to compute
I'initiation in kW m-1:
CBH (460 + 25.9 FMC )
3
2
′
I initiation = (11)
100
where CBH is the canopy base height (m). The coefficient 100 in the denomina-
tor is an empirical constant based on a single observation.
For further analysis, I'initiation is converted to its equivalent rate of spread, R'initiation,
by rearranging equation 5 and substituting I'initiation for I, following the concepts in
the Canadian FFBP System (Forestry Canada Fire Danger Group 1992) and Van
Wagner (1993)
′
60 I initiation
′
Rinitiation = (12)
HPA
USDA Forest Service Research Paper RMRS-RP-29. 2001. 13(a) (b)
I'initiation, kW hr -1
10000 6
FMC FMC
Critical flame length, m
0
12 5 120
8000
100
0 80
10 4
6000
80 3
4000
2
2000 1
0 0
0 2 4 6 8 10 12 0 2 4 6 8 10 12
Crown base height, m Crown base height, m
Figure 4—Van Wagner’s crown fire initiation criterion (following Alexander 1988) expressed
as critical surface fireline intensity (a), and critical flame length using Byram’s (1959) flame
length model (b). Note that critical flame length is less than canopy base height ( CBH) for
CBH greater than about 1 m. Example: a stand with CBH of 3 m and 100 percent FMC
requires surface fireline intensity of 875 kW m -1 (flame length 1.7 m) to initiate crowning.
Because HPA is a function of fuel characteristics, R'initiation will also vary with
surface fuel characteristics, even if I'initiation is the same.
Van Wagner’s crown fire initiation criterion has not been well tested, but it
includes the major variables important to initiating a crown fire—height of canopy
fuels above the ground, their moisture content, and the intensity of the surface
fire (fig. 4). I'initiation depends on foliar moisture content and canopy base height.
In the Rothermel surface fire model, surface fire intensity depends on surface
fuel characteristics (load, surface-area-to-volume ratio, heat content, packing ra-
tio, and moisture contents), midflame windspeed, and slope steepness. Different
fuel complexes can have the same value of I'initiation (for example, similar CBH
and FMC) but different surface fire intensities.
Criterion for Active Crown Fire Spread
By rearranging a basic heat balance equation applicable to fire spread in any
fuel complex, Van Wagner (1977) theorized that solid flames would form in the
canopy (active crowning) if a critical horizontal mass-flow rate of fuel into the
flaming zone, S, is exceeded
S = Ractive CBD (13)
where Ractive is the after-crowning forward rate of spread and CBD is the canopy
bulk density (kg m-3). Van Wagner (1977) found a critical mass flow rate of 0.05
kg m-2 sec-1 for one fire in a red pine plantation, slightly lower than the values
given for experimental fuel beds by Thomas (1963). Until more data on the criti-
cal mass flow rate for crown fires in a wide range of forest types are available we
will rely on Van Wagner’s critical mass-flow rate of 0.05 kg m-2 sec-1. Rearrang-
ing equation 12, substituting Van Wagner’s value of 0.05 for S, and multiplying
by 60 to compute R'active in m min-1 (Alexander 1988), the critical (minimum) rate
of spread for active crowning, R'active, is
3.0
′ =
Ractive (14)
CBD
The only factor affecting the critical spread rate needed to sustain an active
crown fire is CBD (fig. 5).
14 USDA Forest Service Research Paper RMRS-RP-29. 2001100
80
R'active, m min -1
active crown fire possible
60 Figure 5—Van Wagner’s criterion for sustained
active crown fire spread based on a minimum
horizontal mass-flow rate of 0.05 kg m-2 min-1.
40 Example: a stand with CBD of 0.2 kg m-3 re-
quires a spread rate of 15.0 m min-1 to sustain
active crowning.
20
active crown fire
not possible
0
0.0 0.1 0.2 0.3 0.4
-3
Canopy bulk density, kg m
Quantitative Crown Fire Classification
Following Van Wagner (1977) and Alexander (1988), we use the criteria for
initiation and sustained spread of crown fires to classify a fire as surface, passive
crown, or active crown fire. In the classification, two criteria must be met in
order to have an active crown fire. First, a surface fire of sufficient intensity must
ignite the canopy fuels; Isurface must exceed I'initiation. Using equation 11, the re-
quired intensity is a function of foliar moisture content and height to the base of
the canopy. If this criterion cannot be met, the fire will remain on the surface.
Second, if a crown fire can indeed initiate, the potential crown fire spread rate for
the conditions specified must be sufficient to meet the mass-flow requirement
(equation 13).
The expected type of fire then follows from simulated surface fire intensity
and crown fire spread rate (fig. 6). If the classification is followed strictly, all
situations in which the surface fire intensity criterion is not met are classified as
surface fires. However, an alternative classification splits the surface fire class
into two subclasses. These will be discussed later in the section on hysteresis.
high
Crown fire spread rate, Ractive
Figure 6—Fire classification based on Van
Active Wagner (1977) and Alexander (1988). A fire
crown fire for which surface fire intensity (Isurface) is less
than critical (I'initiation) falls in the surface fire
R'active class; one for which Isurface exceeds I'initiation
is either a passive or active crown fire de-
pending on the crown fire spread rate cri-
Passive
I'initiation
Surface terion. Passive crowning occurs where a
crown crown fire initiates (Isurface > I'initiation) but can-
fire
fire not be sustained (Ractive < R'active). An active
crown fire occurs where both criteria are
exceeded.
low
low high
Isurface
QUANTIFYING THE HAZARD
Our objective is to produce a method of quantitatively assessing the relative
crown fire hazard of different stands by coupling the existing fire behavior mod-
USDA Forest Service Research Paper RMRS-RP-29. 2001. 15els presented above. At any given site, fuels and topography can be considered
constant in the short term. Weather, however, varies significantly throughout a
day, from day to day, and throughout a season.
In the fire behavior models presented above, weather is manifested in two
basic inputs: windspeed and dead fuel moisture content. From a description of
the surface fuels, canopy fuels, and site characteristics needed for the above mod-
els, we can define critical combinations of dead fuel moisture and windspeed that
result in surface, passive crown, and active crown fires. Consider a simulation
for a hypothetical stand with the characteristics shown in table 3. The passive
crown fire region is fairly narrow (fig. 7), and active crowning can occur under
moderate burning conditions.
While it is possible to compute all combinations of dead fuel moisture and
windspeed that lead to crown fire activity for a given fuel complex, for purposes
of a relative hazard assessment it is sufficient to set fuel moistures constant at
values that represent some moisture condition of interest (for example, actual,
typical, or extreme moisture conditions). Windspeed is highly variable and prob-
ably the most important environmental factor affecting crown fire initiation, sus-
tained active spread, and final rate of spread. Therefore, we will determine the
critical open wind, O (6.1-m above the canopy), that leads to crown fire activity
for a set of site characteristics, surface and canopy fuel characteristics, and fuel
moisture conditions. Sites that can initiate or sustain a crown fire at lower
windspeeds are more prone to crown fire. Critical open windspeeds for crown
fire initiation and active spread are stand-specific indicators of crown fire haz-
ard. Note that although we use critical windspeeds as indices, the site conditions
(surface and canopy fuels, slope steepness, and so forth), not the weather, are
being rated.
σφ
Table 3—Simulation inputs for a hypothetical stand to be
used in examples throughout this paper.
Input Value
Fuel model 10 (timber litter)
Slope 0 percent
Canopy bulk density 0.15 kg m-3
Canopy base height 1.5 m
Foliar moisture content 100 percent
Wind reduction factor 0.15
Live fuel moisture Normal summer a
a
See table 4 for a listing of fuel moisture content by size class.
70
60
Open windspeed, km/hr
active crown fire
Figure 7—Van Wagner’s (1977) crown fire clas-
50
sification under varying open windspeed and
dead surface fuel moisture conditions for the
40
example stand. For this example, a passive
n fire crown fire region separates surface fire and
30 e crow
passiv active crown fire. Inputs: fuel model 10 (tim-
ber litter and understory, Anderson 1982),
20 surface fire
canopy base height = 1.5 m, canopy bulk den-
sity = 0.15 kg m-3, foliar moisture content =
10
100 percent, live surface fuel moisture = 78
percent, and wind reduction factor = 0.15.
0
4 6 8 10 12 14
Weighted-average dead
fuel moisture content, percent
16 USDA Forest Service Research Paper RMRS-RP-29. 2001Two Indices of Crown Fire Hazard
The Torching Index (TI) is the 6.1-m windspeed at which crown fire is expected to
initiate based on Rothermel’s (1972) surface fire model and Van Wagner’s (1977)
crown fire initiation criteria. TI is a function of surface fuel characteristics (fuel model),
surface fuel moisture contents, foliar moisture content, canopy base height, slope steep-
ness, and wind reduction by the canopy.
The Crowning Index (CI) is the 6.1-m windspeed at which active crowning is
possible, based on Rothermel’s (1991a) crown fire spread rate model and Van Wagner’s
(1977) criterion for active crown fire spread. CI is a function of canopy bulk density,
slope steepness and surface fuel moisture content.
The Torching and Crowning Indices can be determined graphically by plot-
ting Rsurface, Ractive, R'initiation and R'active over a range of open windspeeds (fig. 8),
holding moisture content at some specified level—in this example we use
Rothermel’s (1991a) normal summer condition (table 4). The TI is the windspeed
where the lines for Rsurface and R'initiation cross. The CI is where the lines for Ractive
and R'active cross. Van Wagner’s fire classification is also shown on the chart. At
windspeeds less than TI a surface fire is expected. If the windspeed is greater
than TI but less than CI we expect a passive crown fire. Finally, windspeeds
greater than CI result in active crown fire.
Crown fire assessment chart
50
passive active
surface fire crown crown
45 Figure 8—The Torching and Crowning Indices can
fire fire
be determined graphically on a crown fire assess-
Torching index (O'initiation)
Crowning index (O'iactive)
40 ment chart. The open windspeed at which Rsurface
exceeds R'initiation (same as Isurface > I'initiation) is the
35 Torching Index (TI). The open windspeed at which
σφ
Spread rate, m min-1
Ractive exceeds R'active is the Crowning Index. A sur-
30 face fire is expected at windspeeds below TI.
e
tiv Windspeeds greater than TI but less than CI lead
R ac
25 to passive crowning. Active crown fire is expected
R'active at windspeeds above CI. The theoretical surface
20
fire spread at CI ( R'SA) is shown; that quantity will
be used later in the paper. Inputs: fuel model 10
15
(timber litter and understory, Anderson 1982),
canopy base height = 1.5 m, canopy bulk density
10
R'SA = 0.15 kg m-3, foliar moisture content = 100 per-
cent, normal summer surface fuel moisture con-
5
R'initiation Rsurface dition (Rothermel 1991, table 4), and wind reduc-
tion factor = 0.15.
0
0 5 10 15 20 25 30 35 40 45 50
Open (6.1-m) windspeed, km hr-1
Table 4—Fuel moisture content values (percent) by size class for five seasonal moisture condi-
tions, from Rothermel (1991a).
Seasonal moisture condition
Early spring Late spring Normal Drought Late summer
Class before greenup after greenup summer summer severe drought
1-h 8 9 6 4 3
10-h 14 11 8 5 4
100-h 18 15 10 7 6
live 65 195 117 78 70
USDA Forest Service Research Paper RMRS-RP-29. 2001. 17You can also read