A spatially explicit database of wind disturbances in European forests over the period 2000-2018
←
→
Page content transcription
If your browser does not render page correctly, please read the page content below
Earth Syst. Sci. Data, 12, 257–276, 2020
https://doi.org/10.5194/essd-12-257-2020
© Author(s) 2020. This work is distributed under
the Creative Commons Attribution 4.0 License.

             A spatially explicit database of wind disturbances
               in European forests over the period 2000–2018
             Giovanni Forzieri1 , Matteo Pecchi1,2 , Marco Girardello1 , Achille Mauri1 , Marcus Klaus3 ,
              Christo Nikolov4 , Marius Rüetschi5 , Barry Gardiner6,7 , Julián Tomaštík8 , David Small9 ,
         Constantin Nistor10 , Donatas Jonikavicius11 , Jonathan Spinoni1 , Luc Feyen1 , Francesca Giannetti2 ,
        Rinaldo Comino12 , Alessandro Wolynski13 , Francesco Pirotti14 , Fabio Maistrelli15 , Ionut Savulescu16 ,
                    Stéphanie Wurpillot-Lucas17 , Stefan Karlsson18 , Karolina Zieba-Kulawik19 ,
         Paulina Strejczek-Jazwinska19 , Martin Mokroš8,20 , Stefan Franz21 , Lukas Krejci22 , Ionel Haidu23 ,
             Mats Nilsson24 , Piotr Wezyk19 , Filippo Catani25 , Yi-Ying Chen26 , Sebastiaan Luyssaert27 ,
                          Gherardo Chirici2 , Alessandro Cescatti1 , and Pieter S. A. Beck1
                                1 European            Commission, Joint Research Centre, Ispra, Italy
           2 Department          of Agriculture, Food, Environment and Forestry, University of Florence, Florence, Italy
      3 Department of Forest Ecology and Management, Swedish University of Agricultural Sciences, Umeå, Sweden
                                4 National Forest Centre, Forest Research Institute Zvolen, Zvolen, Slovakia
                                  5 Department of Land Change Science, Swiss Federal Institute for Forest,

                                         Snow and Landscape Research WSL, Birmensdorf, Switzerland
                        6 Institute National de la Recherche Agronomique (INRA), Villenave d’Ornon, France
                                      7 EFI Planted Forests Facility, 69 Route D’Arcachon, Cestas, France
                             8 Department of Forest Resource Planning and Informatics, Faculty of Forestry,

                                                Technical University in Zvolen, Zvolen, Slovakia
             9 Remote Sensing Laboratories, Department of Geography, University of Zurich, Zurich, Switzerland
                                     10 Faculty of Geography, University of Bucharest, Bucharest, Romania
                                11 Laboratory of Geomatics, Institute of Land Management and Geomatics,

                                                 Vytautas Magnus University, Kaunas, Lithuania
       12 Regione Autonoma Friuli Venezia Giulia, Direzione centrale risorse agricole, forestali e ittiche, Udine, Italy
          13 Provincia autonoma di Trento, Ufficio Pianificazione, Selvicoltura ed Economia forestale, Trento, Italy
                14 Department of Land, Environment, Agriculture and Forestry, University of Padua, Padua, Italy
                           15 Provincia Autonoma di Bolzano, Ufficio pianificazione forestale, Bolzano, Italy
                                     16 Faculty of Geography, University of Bucharest, Bucharest, Romania
                    17 Institut National de l’Information Geographique et Forestiere, IGN, Saint Mandé, France
                           18 Swedish Forest Agency, Department of Policy and Analysis, Jönköping, Sweden
            19 Department of Forest Management, Geomatics and Forest Economics, Institute of Forest Resources

                               Management, Faculty of Forestry, University of Agriculture, Kraków, Poland
       20 Czech University of Life Sciences Prague, Faculty of Forestry and Wood Sciences, Prague, Czech Republic
                   21 Landesbetrieb Wald und Holz, North Rhine-Westphalia Forest Service, Munster, Germany
             22 Department of Geoinformatics, Faculty of Science, Palacky University, Olomouc, Czech Republic
                            23 Laboratoire LOTERR-EA7304, Université de Lorraine, Metz CEDEX, France
         24 Southern Swedish Forest Research Centre, Swedish University of Agricultural Sciences, Umeå, Sweden
                                    25 Department of Earth Sciences, University of Florence, Florence, Italy
                    26 Research Center for Environmental Changes, Academia Sinica, Nankang, Taipei, Taiwan
           27 Department of Ecological Sciences, Faculty of Sciences, VU University, Amsterdam, the Netherlands

                                   Correspondence: Giovanni Forzieri (giovanni.forzieri@ec.europa.eu)

                                Received: 13 August 2019 – Discussion started: 5 September 2019
                     Revised: 20 December 2019 – Accepted: 10 January 2020 – Published: 10 February 2020

Published by Copernicus Publications.
258                                  G. Forzieri et al.: A spatially explicit database of wind disturbances in European forests

       Abstract. Strong winds may uproot and break trees and represent a major natural disturbance for European
       forests. Wind disturbances have intensified over the last decades globally and are expected to further rise in
       view of the effects of climate change. Despite the importance of such natural disturbances, there are currently
       no spatially explicit databases of wind-related impact at a pan-European scale. Here, we present a new database
       of wind disturbances in European forests (FORWIND). FORWIND is comprised of more than 80 000 spatially
       delineated areas in Europe that were disturbed by wind in the period 2000–2018 and describes them in a har-
       monized and consistent geographical vector format. The database includes all major windstorms that occurred
       over the observational period (e.g. Gudrun, Kyrill, Klaus, Xynthia and Vaia) and represents approximately 30 %
       of the reported damaging wind events in Europe. Correlation analyses between the areas in FORWIND and land
       cover changes retrieved from the Landsat-based Global Forest Change dataset and the MODIS Global Distur-
       bance Index corroborate the robustness of FORWIND. Spearman rank coefficients range between 0.27 and 0.48
       (p value < 0.05). When recorded forest areas are rescaled based on their damage degree, correlation increases
       to 0.54. Wind-damaged growing stock volumes reported in national inventories (FORESTORM dataset) are gen-
       erally higher than analogous metrics provided by FORWIND in combination with satellite-based biomass and
       country-scale statistics of growing stock volume. The potential of FORWIND is explored for a range of chal-
       lenging topics and scientific fields, including scaling relations of wind damage, forest vulnerability modelling,
       remote sensing monitoring of forest disturbance, representation of uprooting and breakage of trees in large-
       scale land surface models, and hydrogeological risks following wind damage. Overall, FORWIND represents
       an essential and open-access spatial source that can be used to improve the understanding, detection and pre-
       diction of wind disturbances and the consequent impacts on forest ecosystems and the land–atmosphere system.
       Data sharing is encouraged in order to continuously update and improve FORWIND. The dataset is available at
       https://doi.org/10.6084/m9.figshare.9555008 (Forzieri et al., 2019).

1   Introduction                                                   area (FAOSTAT, 2019). In 2007, windstorm Kyrill caused
                                                                   the loss of 49 millon cubic metres of timber in Germany and
Natural forest disturbances represent a serious peril for main-    the Czech Republic. In 2009 and 2010, windstorms Klaus
taining productive forests. Studies indicate that their occur-     and Xynthia hit forests in France and Spain and caused tim-
rence can reduce primary production and partially offset car-      ber losses totalling approximately 45 million cubic metres.
bon sinks or even turn forest ecosystems into carbon sources       In 2018, windstorm Vaia hit the northeastern regions of Italy
(Kurz et al., 2008; Yamanoi et al., 2015; Ziemblińska et al.,     causing a damaged growing stock volume of about 8.5 mil-
2018). This is particularly critical for windthrow and tree        lion cubic metres.
breakage due to strong winds, which represents a major nat-           The socio-economic consequences of wind disturbances
ural disturbance for European forests (Schelhaas et al., 2003;     can be especially critical for local economies highly depen-
Seidl et al., 2017). Such disturbances are intensifying glob-      dent on the forest sector. Countries in Northern Europe, Cen-
ally, a trend that is expected to continue with further climate    tral Europe and Eastern Europe, where the forest sector may
change (Bender et al., 2010; Knutson et al., 2010; Seidl et al.,   cover up to 6 % of the national GDP (Forest Europe, 2015),
2014).                                                             are, therefore, potentially more vulnerable to wind-related
   European windstorms are associated with areas of low at-        impacts.
mospheric pressure that typically occur in the autumn and             Despite the risks they pose, spatially explicit databases of
winter months (Martínez-Alvarado et al., 2012). Deep low-          wind disturbances across Europe currently do not exist. Re-
pressure areas frequently track across the northern Atlantic       cent assessments of current and future forest damage due to
Ocean towards Western Europe, passing the northern coasts          windstorms at a European scale are based on catalogues of
of Great Britain and Ireland and into the Norwegian Sea.           disturbances collected at country level (Gregow et al., 2017;
However, when they track further south, they can poten-            Schelhaas et al., 2003; Seidl et al., 2014). Such databases
tially hit any country in Europe. In 1999, windstorm Lothar        (e.g. FORESTORM) are subject to multiple sources of bias
damaged approximately 165 million cubic metres of tim-             and uncertainty associated with the diversity of the under-
ber mainly in France, Germany and Switzerland (Gardiner            lying inventories. Furthermore, estimates of forest damage
et al., 2010), which is equivalent to about 140 % of the av-       aggregated at a national scale may only partially represent
erage annual roundwood harvested in the countries affected         the spatial variability of the phenomenon. In fact, the coarse
(FAOSTAT, 2019). In 2005, 75 million cubic metres were             spatial resolution of such data hampers inferential analysis of
damaged by windstorm Gudrun in Sweden (Gardiner et al.,            potential drivers of forest vulnerability and their use in spa-
2010), equivalent to about 1 year of cuttings in the same          tially explicit models to monitor or forecast wind-related im-

Earth Syst. Sci. Data, 12, 257–276, 2020                                            www.earth-syst-sci-data.net/12/257/2020/
G. Forzieri et al.: A spatially explicit database of wind disturbances in European forests                                      259

pacts (Masek et al., 2015; Phiri and Morgenroth, 2017). De-              – Literature review and data gathering. We searched
spite the lack of systematic mapping of wind disturbances in               PubMed and Scopus for articles published up to Jan-
European forests, a multitude of local, national and transna-              uary 2019, with no language restrictions, using the
tional initiatives have accurately mapped forest areas affected            search terms “wind disturbance”, “windthrow”, “for-
by wind over the last decades. These data represent highly                 est damage”, “wind damage”, or “forest disturbance”
informative observational records for characterizing spatial               and “Europe” or a single country name in the publica-
patterns of forest damage. However, they are collected by                  tion title or abstract. The identified studies had mainly
different institutes and are often difficult to retrieve or poorly         mapped the effects of wind on forests for single events
documented. Since 2012, the Copernicus Emergency Man-                      and/or for a limited areal extent. We then retrieved
agement Service (https://emergency.copernicus.eu/, last ac-                the spatial delineation of the observed wind damage
cess: 20 December 2019) has produced maps of natural dis-                  from the corresponding authors or contact persons re-
asters throughout the world based on the analysis of satellite             sponsible for the data acquisition. The collected data
images and other geospatial data. While this important initia-             were originally recorded by different research institutes
tive can help map wind-affected areas, it only covers recent               and international initiatives across Europe using diverse
years and, being an on-demand service, it is not comprehen-                methodologies. Table 1 lists the data providers and the
sive, as it depends on the interests of individual authorized              acquisition methods.
users of the service to map a given forest disturbance.
   In this study, we try to fill the above-mentioned gap. To             – Coordinate system transformation. The wind distur-
achieve this, we collected and harmonized 89 743 forest areas              bances were transformed to the same geographical
damaged by wind into a consistent geospatial dataset. The                  unprojected coordinate system (World Geodetic Sys-
work was carried out through a unique joint effort of 27 re-               tem 1984, WGS84, EPSG:4326).
search institutes and forestry services across Europe. This              – Spatial segregation. The spatial segregation of each
collaboration led to the first spatially explicit database of              record was verified. In cases where multiple features for
wind disturbances in European forests over the period 2000–                the same event overlapped, they were merged.
2018, hereafter referred to as the FORWIND database. We
believe that it provides essential spatial information for im-           – Harmonization of the degree of damage. A damage clas-
proving our understanding of forest damage from wind and                   sification for forest disturbances was originally recorded
can assist in large-scale systematic monitoring and mod-                   for windstorms that occurred in France in 2009, in
elling of forest disturbances and their effects on the land–               Lithuania in 2010, in Germany in 2017, and in Italy
atmosphere system. In the following sections, we describe                  in 2015 and – for part of the records – in 2018. In order
the data collection, the harmonization process and the cross-              to make these records comparable in terms of the sever-
comparison performed against satellite retrievals of changes               ity of damage, the original classes were harmonized into
in vegetation cover and data from national inventories of for-             a single damage metric following the rationale reported
est disturbances. We conclude the data description with some               in Table 2. The resulting degree of damage varies be-
examples of the possible usage of the FORWIND database.                    tween 0 (no damage) and 1 (full destruction of the forest
                                                                           patch). Information on the degree of damage is available
2   Methods                                                                for ∼ 48 % of records and is included as a basic attribute
                                                                           when available (Table 3).
We collected wind disturbance events caused by windstorms
or tornadoes that occurred in Europe between 2000 and 2018.
A wind disturbance event is represented by a geo-referenced          3    Data records
polygon that delineates the damaged forest stand, regardless
of the degree of damage. The original acquisition of the poly-       The FORWIND database is the final output of the
gons was made by aerial and satellite photointerpretation or         data collection procedure and it is publicly available at
field survey (Table 1). Therefore, the polygons are delineated       https://doi.org/10.6084/m9.figshare.9555008 (Forzieri et al.,
when a reasonably homogeneous patch of damaged forest is             2019). The FORWIND dataset contains records as polygon
detected from the ground or remotely. The data were man-             features in shapefile format (.shp). The geometry of a fea-
aged mostly on the Google Earth Engine platform (Gorelick            ture is stored as a shape comprising a set of vector coordi-
et al., 2017) to efficiently quantify the extent of disturbances     nates corresponding to the boundaries of the area of a given
over large scales and extract additional informative attributes      wind disturbance. Records are geo-referenced in geograph-
(e.g. Hansen et al., 2013; McDowell et al., 2015). We struc-         ical coordinates, i.e. latitude and longitude, following the
tured the data collection process in four main phases, de-           WGS84 standard (EPSG:4326). Basic attributes of each dis-
scribed below.                                                       turbance (Table 3) are provided in an associated table, stored
                                                                     in a .dbf file.

www.earth-syst-sci-data.net/12/257/2020/                                                Earth Syst. Sci. Data, 12, 257–276, 2020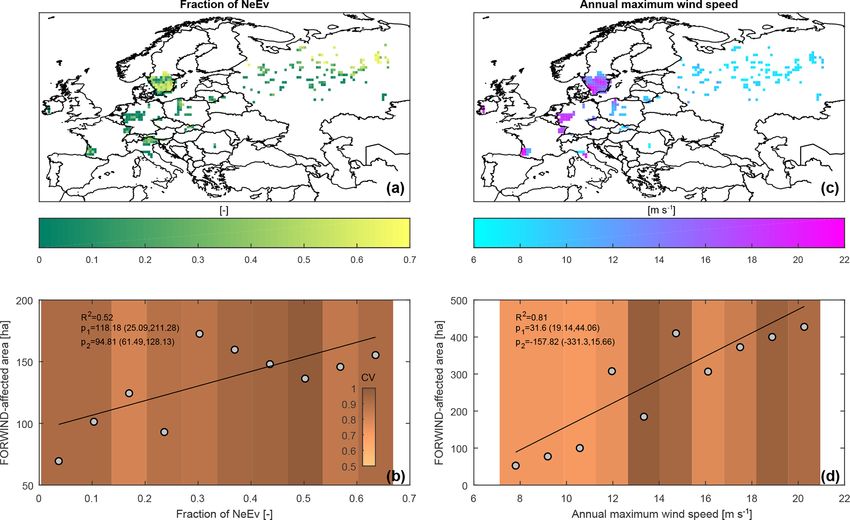
260                                                   G. Forzieri et al.: A spatially explicit database of wind disturbances in European forests

Table 1. List of institutions responsible for wind disturbance mapping and the corresponding number of records collected and acquisition
methods employed.

 Data provider                                                                                        Number         Event type         Acquisition method
                                                                                                    of records
 Alto Adige province forest service, Italy                                                                 1457      Windstorm          Aerial photointerpretation and field survey
 AVEPA – Agenzia Veneta per i Pagamenti in Agricoltura, in                                                 1526      Windstorm          Aerial and satellite photointerpretation + field
 collaboration with U. O. Forestale of the Veneto region,                                                                               surveys
 revisited by TESAF Department, University of Padua
 Copernicus Emergency Service                                                                              4425      Windstorm          Aerial photointerpretation
 Department of Cartography and Geoinformatics, Perm State                                                  3056      Tornado            Satellite data classificationa
 University, Perm, Russia
 Department of Forest Management, Geomatics and Forest                                                      321      Windstorm          Aerial photointerpretation
 Economics, Institute of Forest Resources Management,
 Faculty of Forestry, University of Agriculture in Kraków,
 Poland
 Department of Forest Resource Planning and Informatics,                                                      14     Windstorm          Aerial photointerpretation and field survey
 Faculty of Forestry, Technical University in Zvolen, Slovakia
 Department of Geoinformatics, Faculty of Science, Palacky                                                 1175      Windstorm          Aerial photointerpretation
 University, Czech Republic
 Department of Land Change Science, Swiss Federal Institute                                                   64     Windstorm          Aerial photointerpretation
 for Forest, Snow and Landscape Research WSL, Birmensdorf,
 Switzerland
 Department of Forestry Mecklenburg-Vorpommern,                                                            2073      Windstorm          Aerial photointerpretation
 Germany
 Swedish Forest Agency, Sweden                                                                          19 673       Windstorm          Semi-automatic classificationb
 Friuli Venezia Giulia forest service, Italy                                                                191      Windstorm          Aerial photointerpretation and field survey
 GeoLAB – Laboratory of Forest Geomatics, Department of                                                    1271      Windstorm          Field survey
 Science and Technology in Agriculture, Food, Environment
 and Forestry, University of Florence, Italy
 IGN – Institut National de information geographique et forestiere, France                              21 691       Windstorm          Aerial photointerpretation
 Laboratory of Geomatics, Institute of Land Management and                                              14 571       Windstorm          Aerial photointerpretation
 Geomatics, Aleksandras Stulginskis University, Lithuania
 National Forest Centre, Forest Research Institute, Slovakia                                                555      Windstorm          Aerial photointerpretation
 North Rhine-Westphalia forest service, Germany                                                         13 642       Windstorm          Aerial photointerpretation
 Trento province forest service, Italy                                                                     3596      Windstorm          Aerial photointerpretation and field survey
 University of Bucharest, Faculty of Geography, Romania                                                     186      Windstorm          Aerial photointerpretation and field survey
 University of Lorraine, France                                                                             256      Windstorm          Aerial photointerpretation
a Spatial delineation of tornado-related impacts on forests have been based on a semi-automatic algorithm and every record has been singularly validated based on visual inspection of high-resolution
satellite images (Shikhov and Chernokulsky, 2018). b Areas subject to wind disturbances have been retrieved for FORWIND by intersection of the 2005 registered forest clear-cuts between
7 January and 31 December 2005 (http://skogsdataportalen.skogsstyrelsen.se/Skogsdataportalen/, last access: 20 December 2019), with the spatial delineation of windstorm Gudrun (Gardiner et al.,
2010). The use of forest clear-cuts as proxy for wind-affected areas is reasonable because the morning after the storm all normal felling activity stopped and moved to storm-damaged areas (Swedish
Forest Agency, personal communication, 2019).

   Overall, FORWIND includes 89 743 records, correspond-                                              by the high heterogeneity of forest and landscape character-
ing to a million hectares of forest area affected by wind dis-                                        istics. Figure 1 shows the spatial and temporal variations of
turbances during the 2000–2018 period. Each record should                                             records in the FORWIND database. In order to better visu-
not be viewed as independent as a single storm may cause                                              alize the data, we summed the areas affected by wind dis-
multiple, geographically disjunct disturbances. At a Euro-                                            turbances in 0.5◦ cells (Fig. 1a). A similar aggregation was
pean level, the median forest disturbance patch caused by                                             used to show the timing of the disturbances, here expressed
wind measures 1.07 ha (Table 4). However, there is substan-                                           as the year in which the most area was disturbed within a
tial variability across disturbances and countries likely driven                                      given cell (Fig. 1b). The current release of FORWIND in-

Earth Syst. Sci. Data, 12, 257–276, 2020                                                                                         www.earth-syst-sci-data.net/12/257/2020/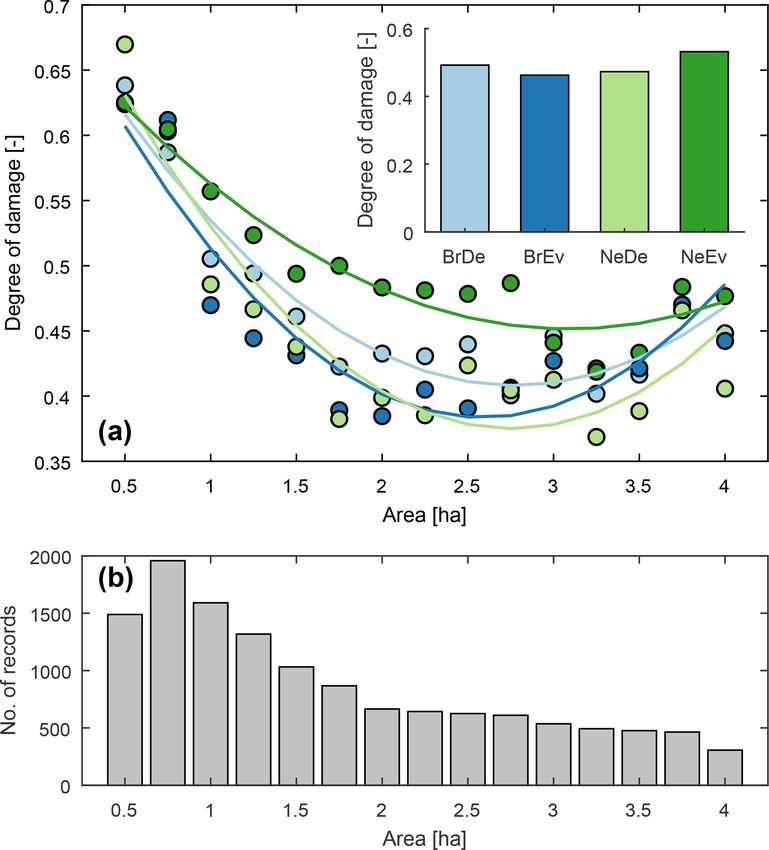
G. Forzieri et al.: A spatially explicit database of wind disturbances in European forests                                          261

Table 2. Conversion table for passing data from class of damage to degree of damage. Records of windstorms that occurred in Italy in 2015
(Toscana) and in 2018 (Veneto) are already expressed as damage degree in a consistent range between 0 (no damage) and 1 (full destruction
of forest pattern).

                                        Class of      Definition of damage (D)                        Degree of
                                        damage                                                        damage
                          France,            0        no forest area (not included in FORWIND)
                          2009               1        D ≤ 20 %                                        0.1
                                             2        20 % < D ≤ 40 %                                 0.3
                                             3        40 % < D ≤ 60 %                                 0.5
                                             4        60 % < D ≤ 80 %                                 0.7
                                             5        80 % < D ≤ 100 %                                0.9
                                             6        marginally affected                             missing data
                                             7        missing data                                    missing data
                          Lithuania,         0        no damage (not included in the FORWIND)
                          2010               1        D ≤ 25 %                                        0.125
                                             2        25 % < D ≤ 50 %                                 0.375
                                             3        50 % < D ≤ 75 %                                 0.625
                                             4        D > 75 %                                        0.875
                          Germany,           1        D ≤ 50 %                                        0.25
                          2017               2        50 % < D ≤ 90 %                                 0.7
                                             3        90 % > D                                        0.95
                          Italy, 2018        1        D ≤ 30 %                                        0.15
                          (Trentino-         2        30 % < D ≤ 50 %                                 0.4
                          Alto               3        50 % < D ≤ 90 %                                 0.7
                          Adige)             4        D > 90 %                                        0.95

Table 3. Attribute table of the FORWIND database. The name and description of the attributes associated with each wind disturbance in
FORWIND and listed in the .dbf file are given. Missing data are reported as −999.

                            Attribute name       Description
                            Id_poly              Identifier code
                            EventDate            Date of event (MM/DD/YYYY)
                            StormName            Storm name
                            EventType            Type of event, i.e windstorm or tornado
                            Country              Country where the wind disturbance occurred
                            Area                 Area affected by wind disturbance (in ha)
                            Perimeter            Perimeter of the forest area affected by wind disturbance (in m)
                            Damage_deg           Damage degree (–)
                            Methods              Acquisition method
                            Dataprovid           Data provider responsible of the wind disturbance mapping
                            Source               Original source of the data

cludes wind disturbances that occurred in Austria, Switzer-               exhaustively represent the damaged forest areas caused by
land, the Czech Republic, France, Germany, Ireland, Italy,                those specific events. However, some known damaging wind
Lithuania, Poland, Romania, Russia, Slovakia and Sweden.                  events are currently missing in the database. In order to pro-
The major windstorms that occurred over the last 2 decades                vide a more comprehensive assessment of the representative-
are included in FORWIND: Gudrun in 2005 (Sweden), Kyrill                  ness of FORWIND, for each country we derived the ratio
(Germany) in 2007, Klaus in 2009 (France), Xynthia in 2010                between the number of wind events included and the num-
(Germany) and Vaia in 2018 (Italy). The high spatial detail               ber of all wind events that occurred and are known to have
of FORWIND is illustrated in Fig. 2 for some key wind-                    caused forest damage (Table 5). The number of known dam-
storms. According to the institutions responsible for the data            aging events is derived by summing up the number of dis-
acquisition, the wind disturbances recorded in FORWIND                    tinct events recorded in FORESTORM (http://www.iefc.net/

www.earth-syst-sci-data.net/12/257/2020/                                                     Earth Syst. Sci. Data, 12, 257–276, 2020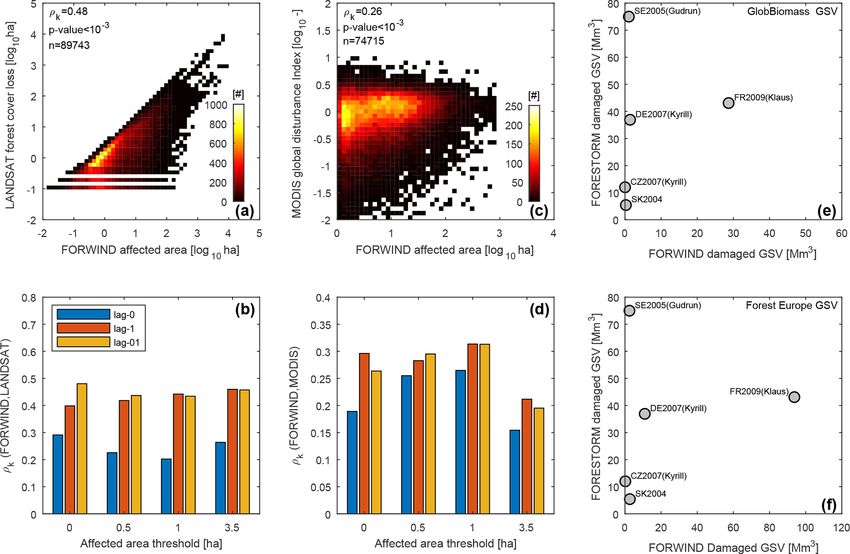
262                                    G. Forzieri et al.: A spatially explicit database of wind disturbances in European forests

Figure 1. Spatial and temporal distribution of wind disturbances in the FORWIND database. (a) The total area affected by wind disturbances
over the multi-year observational period (2000–2018) in 0.5◦ cells. (b) Wind disturbance occurrence year in the same cells. Red circles in (a)
refer to site locations shown in Fig. 2.

storm/, last access: 20 December 2019) and FORWIND dur-                  Table 4. Statistics of wind disturbance records collected in the
ing the 2000–2018 period. Therefore, the temporal represen-              FORWIND database aggregated at country level and for all of Eu-
tativeness ranges between 0 (all known wind disturbances                 rope.
are missing in FORWIND) and 1 (all known wind distur-
bances are included in FORWIND). Estimates of representa-                   Country    Number      Accumulated       Median       Standard
tiveness ranges between 0.13 and 1 amongst the countries                    code            of     affected area     affected    deviation
included in FORWIND, with an average value of 0.63 at                                  records              (ha)    area (ha)   of affected
                                                                                                                                  area (ha)
the European level (see Table 5). However, when countries
currently missing in FORWIND are also accounted for, the                    AU              646         1222.15         0.78          5.69
average representativeness decreases to 0.30. These values                  CH               64            41.28        0.26          0.79
should be viewed with caution as the estimated number of                    CZ            1175            540.98        0.14          1.67
total damaging wind events resulting from FORWIND and                       DE           18 909        34 075.95        0.64          5.33
FORESTORM could likely deviate from the actual ones. Fu-                    FR           21 947       875 407.23        8.79        993.80
                                                                            IE              561           541.03        0.36          1.60
ture efforts should be aimed at populating FORWIND with
                                                                            IT            8041         33 991.67        1.06         14.20
the damaging wind events known to be missing.                               LT           14571         13 378.80        0.53          1.28
                                                                            PL              345        46 065.34       24.03        573.29
4     Comparison of FORWIND with satellite-based                            RO              186           417.59        0.80          4.92
      metrics and national inventories                                      RU            3056         17 188.38        0.85         25.41
                                                                            SE           19 673        24 496.26        0.81          1.73
The lack of alternative datasets with the same spatially ex-                SK              569         9150.24         0.65        118.65
                                                                            Europe       89743      1 056 516.91        1.07        493.20
plicit mapping of wind disturbances as in FORWIND does
not allow for a standard validation exercise. Therefore, we
evaluated the validity of FORWIND based on the plausibil-
ity of the collected spatial delineations of wind disturbances           based on time series analysis of Landsat images. Forest
with respect to two satellite-based proxies of forest distur-            cover loss is defined as an area that has changed from a state
bances and estimates of forest damage reported in national               of forest to non-forest following a given disturbance event
inventories.                                                             (natural or anthropogenic). The change detection is based on
                                                                         the variation in the spectral properties of the land surface.
                                                                         Windstorm events in Europe often occur in autumn and at
4.1    FORWIND versus Landsat-based forest cover loss
                                                                         the beginning of winter, when the availability of cloud-free
FORWIND was initially compared with satellite-                           images is typically much more limited than in summer.
based estimates of forest cover loss derived from                        Hence, satellite retrievals of forest cover loss may miss the
the Global Forest Change maps (Hansen et al.,                            exact timing of the disturbance. Therefore, the GFC-based
2013)     (GFC,     https://earthenginepartners.appspot.com/             forest cover loss may only record wind disturbances the year
science-2013-global-forest, last access: 20 December 2019).              after the event occurred. In addition, fallen trees following a
GFC maps characterize the annual forest coverage at global               windstorm or tornado often maintain their leaves for months.
scale during the period 2000–2018 at 30 m spatial resolution             This may lead to limited or no change in land reflectance

Earth Syst. Sci. Data, 12, 257–276, 2020                                                    www.earth-syst-sci-data.net/12/257/2020/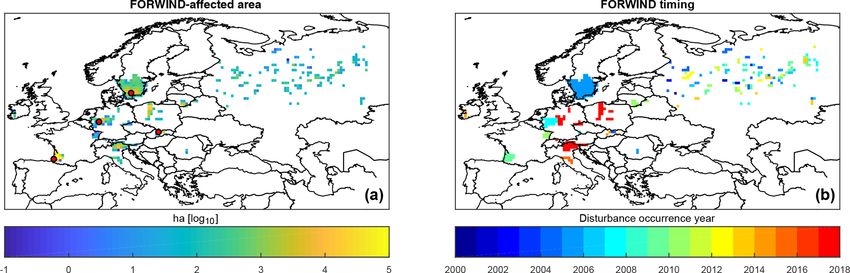
G. Forzieri et al.: A spatially explicit database of wind disturbances in European forests                                          263

Figure 2. Examples of wind disturbances recorded in the FORWIND database. (a, b) Tatra Mountains, Slovakia, affected by a windstorm
in 2004. (c, d) Southern Sweden, affected by windstorm Gudrun in 2005. (e, f) Western Germany, affected by windstorm Kyrill in 2007.
(g, h) Western France, affected by windstorm Klaus in 2009. Wind disturbances recorded in the FORWIND database are shown as red
polygons. Background colours show forest and non-forest areas derived from the 25 m forest cover map from 2000 (Pekkarinen et al., 2009),
while water bodies are derived from the 25 m land cover type map from 2006 (Kempeneers et al., 2011) (https://forest.jrc.ec.europa.eu/en/
past-activities/forest-mapping/#Downloadforestmaps, last access: 20 December 2019). Site locations in (a, c, e, g) are shown in Fig. 1a,
whereas the zoomed plots in (b, d, f, h) refer to black boxes in (a, c, e, g).

www.earth-syst-sci-data.net/12/257/2020/                                                  Earth Syst. Sci. Data, 12, 257–276, 2020
264                                   G. Forzieri et al.: A spatially explicit database of wind disturbances in European forests

Table 5. Representativeness of FORWIND. The first estimate of representativeness at the European level accounts for damaging wind events
that occurred during the 2000–2018 period in the countries currently included in FORWIND. The second estimate of representativeness at
the European level accounts for all damaging events occurring during the 2000–2018 period, including those countries currently missing in
FORWIND.

      Country   Dates of damaging wind               Dates of               Damaging wind events                 FORWIND
      code      events recorded in                   damaging wind          recorded in FORESTORM                representativeness
                FORESTORM during the                 events recorded        during the 2000–2018 period          (–)
                2000–2018 period                     in FORWIND             and missing in FORWIND
      AU        Jan 2008, Mar 2008                   Oct 2018               Jan 2008, Mar 2008                   0.333
      BE        Feb 2010                             none                   Feb 2010
      BG        none                                 none                   none
      CH        Jan 2002, Jan 2003, Jan 2004,        Aug 2017               Jan 2002, Jan 2003, Jan 2004,        0.125
                Jan 2007, Dec 2008, Jan 2009,                               Jan 2007, Dec 2008, Jan 2009,
                Feb 2009                                                    Feb 2009
      CY        none                                 none                   none
      CZ        Jan 2007, Mar 2008                   Jan 2007               Mar 2008                             0.500
      DE        Oct 2002, Feb 2006, Nov 2006,        Jan 2007, Nov 2017,    Oct 2002, Feb 2006, Nov 2006,        0.300
                Jan 2007, Jan 2008, Feb 2008,        Jan 2018               Jan 2008, Feb 2008, Mar 2008,
                Mar 2008, Feb 2010                                          Feb 2010
      DK        Jan 2000, Jan 2005, Nov 2006,        none                   Jan 2000, Jan 2005, Nov 2006,        0.000
                Jan 2008, Feb 2008                                          Jan 2008, Feb 2008
      EE        Jan 2005, Feb 2008                   none                   Jan 2005, Feb 2008                   0.000
      ES        Jan 2009, Feb 2010                   none                   Jan 2009, Feb 2010                   0.000
      FI        2001 (month unknown)                 none                   2001 (month unknown)                 0.000
      FR        Oct 2000, Jul 2003, Dec 2004,        Jan 2009, Feb 2010     Oct 2000, Jul 2003, Dec 2004,        0.286
                Oct 2006, Jan 2009, Feb 2010                                Oct 2006, 2013 (month unknown)
                2013 (month unknown)
      GR        none                                 none                   none                                 none
      HR        none                                 none                   none                                 none
      HU        none                                 none                   none                                 none
      IE        Jan 2005, 2014 (month unknown)       Feb 2014               Jan 2005                             0.500
      IS        none                                 none                   none                                 none
      IT        none                                 Mar 2015, Oct 2018     none                                 1.000
      LT        Jan 2005, Feb 2008                   Aug 2010               Jan 2005, Feb 2008                   0.333
      LU        Feb 2010                             none                   Feb 2010                             0.000
      LV        Jan 2005, Jan 2007, Feb 2008         none                   Jan 2005, Jan 2007, Feb 2008         0.000
      MT        none                                 none                   none                                 none
      NL        Oct 2002, Jan 2007                   none                   Oct 2002, Jan 2007                   0.000
      NO        Nov 2000, Dec 2000, Aug 2001,        none                   Nov 2000, Dec 2000, Aug 2001,        0.000
                Nov 2001, Dec 2003, Nov 2006,                               Nov 2001, Dec 2003, Nov 2006,
                Jan 2007, Jan 2008                                          Jan 2007, Jan 2008
      PL        Jan 2007, Jan 2008, Feb 2008,        Dec 2013, Aug 2017     Jan 2007, Jan 2008, Feb 2008,        0.333
                Mar 2008                                                    Mar 2008
      PT        Feb 2010                             none                   Feb 2010                             0.000
      RO        none                                 Jun 2005               none                                 1.000

Earth Syst. Sci. Data, 12, 257–276, 2020                                                 www.earth-syst-sci-data.net/12/257/2020/
G. Forzieri et al.: A spatially explicit database of wind disturbances in European forests 265
Table 5. Continued.
Country Dates of damaging wind Dates of Damaging wind events FORWIND
code events recorded in damaging wind recorded in FORESTORM representativeness
FORESTORM during the events recorded during the 2000–2018 period (–)
2000–2018 period in FORWIND and missing in FORWIND
RU none multiple tornado events none 1.000
SE Nov 2001, Jan 2002, Jan 2005 Nov 2001, Jan 2002, 0.125
2003 (month unknown), Jan 2005, 2003 (month unknown), Nov 2006,
Nov 2006, Jan 2007; Jan 2007, Jan 2008,
Jan 2008, Feb 2008 Feb 2008
SI none none none none
SK Nov 2004 Nov 2004, May 2014 none 1.000
UK Oct 2000, Oct 2002, none Oct 2000, Oct 2002, 0.000
(8) Jan 2005, (11) Jan 2005, (8) Jan 2005, (11) Jan 2005,
Nov 2006, (18) Jan 2007, Nov 2006, (18) Jan 2007,
(25) Jan 2007, Jun 2007, (25) Jan 2007, Jun 2007,
Nov 2007 Nov 2007
Europe 0.626|0.297
properties, even when cloud-free images are available. For each selected FORWIND record we computed the area
Therefore, satellite-based products may underestimate forest of affected forest based on the spatial delineation of the poly-
cover loss in the short-term (interannual scale). In order to gon and the corresponding Landsat-derived forest cover loss
account for these effects, we considered the forest cover and calculated the correlation between the two sets of esti-
loss by summing up the forest loss over the year of a given mates. In order to account for the spatial dependence struc-
event together with that of the following year (lag-01). The ture of FORWIND data, correlation values were derived for
loss estimate was quantified with respect to the pre-event 100 subsets of 1000 records randomly selected from the en-
conditions (the forest cover in the year before the event). tire dataset. The final estimate of correlation was then quanti-
To reduce potential contamination effects from other distur- fied as the average of the correlation values derived from the
bances in the resulting total forest cover loss, we removed 100 subsets.
areas affected by fires the year following a wind event. Results for the whole dataset are shown in Fig. 3a. Overall,
Information on forest areas affected by fires were retrieved we found a modest but significant Spearman rank correlation
from the European Forest Fire Information System (EFFIS, coefficient (ρk = 0.48; p value < 10−3 ), which supports the
http://effis.jrc.ec.europa.eu/, last access: 20 December 2019). validity of FORWIND in mapping areas subject to changes
Insect outbreaks, which may be triggered by large numbers of forest coverage due to wind disturbances. We point out
of dead trees following wind disturbances (Stadelmann et that for this calculation we did not mask the data based on
al., 2013), generally lead to a slow change in tree cover, the degree of damage because such information is available
which may only marginally affect the 1-year temporal lag only in some countries. However, a similar correlation anal-
used for our estimates of forest cover loss. Furthermore, ysis performed by rescaling the recorded areas based in their
forest logging following a wind event can be considered a damage degree (for those records that report the informa-
secondary effect of the strong winds, as it is often employed tion) led to higher correlation values up to 0.54. We fur-
to reduce the risk of other forest disturbances (specifically ther tested the sensitivity of our results to the temporal lag
insect outbreaks and fires). Therefore, the resulting estimates used to quantify the forest cover loss. To achieve this, we
of forest cover loss for the selected areas should reflect complemented the previous analysis (lag-01) using Landsat-
wind disturbances first and foremost. We emphasize that based forest cover loss estimated for the year of the event
Landsat-derived estimates of forest cover loss are affected by only (lag-0) and the following year only (lag-1). In order to
the uncertainty in satellite retrievals and do not represent the investigate possible scaling relations, the correlation analysis
true impacts. However, their suitability for detecting forest was performed accounting for the FORWIND records with
disturbances over large scale has been widely recognized a spatial extent above a given threshold derived from the
(Curtis et al., 2018; Hansen et al., 2013) and, therefore, they percentiles 0, 0.25, 0.50 and 0.75 of the full dataset (corre-
are here considered a good proxy of forest loss. sponding to about 0, 0.5, 1 and 3.5 ha, respectively). Results
show that correlation values between FORWIND affected ar-
www.earth-syst-sci-data.net/12/257/2020/ Earth Syst. Sci. Data, 12, 257–276, 2020266 G. Forzieri et al.: A spatially explicit database of wind disturbances in European forests
eas and lag-0 forest cover loss tends to slightly decrease with country level in the FORESTORM database for five wind-
an increasing size of the wind disturbance (Fig. 3b). The op- storm events: Slovakia in 2004, Sweden in 2005 (windstorm
posite pattern is observed for correlation values with lag-1 Gudrun), Germany in 2007 (windstorm Kyrill), the Czech
forest cover loss. The forest cover loss accumulated over the Republic in 2007 (windstorm Kyrill) and France in 2009
2 years considered (lag-01) appears dominated by the contri- (windstorm Klaus). We derived the damaged GSV by mul-
bution of lag-1 forest cover loss. We argue that such contrast- tiplying the estimated GSV by the percentage damaged, both
ing tendencies may be linked to the scale and climatology of of which are reported in FORESTORM. An analogous met-
extreme winds. Wind-related forest impacts of limited areal ric was derived from FORWIND data by first calculating, for
extent originate from local windstorms or tornadoes that may each FORWIND record, the amount of GSV lost by multi-
occur throughout the year. For these events, most of the dam- plying the areal average GSV by the damage level reported
age is probably well captured by lag-0 effects, as it is more for the record. As the damage level was only reported for
likely that cloud-free images are available after the event. In windstorm Klaus, for the other events we assumed a dam-
contrast, the larger and more damaging windstorms, which age level equal to the average level reported for windstorm
affect larger forest areas, typically occur in autumn and early Klaus weighted on the spatial extent of each record. The GSV
winter (decreasing the likelihood of cloud-free images after was retrieved from the GlobBiomass dataset (Santoro et al.,
the storm and before the end of the year). For these events, 2018; https://doi.org/10.1594/PANGAEA.894711), which is
the inclusion of the lag-1 effect is key to characterize the im- based on multiple remote sensing products and is considered
pact on forest cover. the state-of-the-art global biomass product. This satellite-
based GSV estimate refers to the year 2010 and has a spa-
4.2 FORWIND versus MODIS Global Disturbance Index
tial resolution of 100 m. The damage to GSV were then
summed by event and country. Event-scale FORWIND dam-
FORWIND was also compared with an independent dataset aged GSVs were then compared with estimates derived from
of satellite-based estimates of forest disturbance as expressed FORESTORM.
by the MODIS-based Global Disturbance Index (Mildrexler Overall, results show that the magnitude of damage esti-
et al., 2009) (MGDI, http://files.ntsg.umt.edu/data/NTSG_ mated from FORWIND and FORESTORM are largely dif-
Products/MGDI/, last access: 20 December 2019). MGDI ferent, except for windstorm Klaus in 2009 in France, for
maps quantify the overall annual forest disturbance globally which we found a very good agreement (Fig. 3e). For most
for the period 2004–2012 at 500 m spatial resolution. The of the events, however, FORESTORM tends to systemati-
disturbance retrieval is based on the variations in the en- cally give higher forest damage estimates than FORWIND,
hanced vegetation index and land surface temperature fol- with differences exceeding 90 %. We note that such differ-
lowing a given sudden change in forest cover. Consistent ences persist when we derive FORWIND estimates of dam-
with the previous Landsat-based analysis – the total change aged GSV assuming a 100 % damage degree for all records
in MGDI potentially related to a given wind disturbance was (not shown). Therefore, the uncertainty in the damage de-
computed as the accumulated net change in MGDI over the gree in FORWIND does not substantially affect the differ-
event year and the following year (lag-01). The change was ence between FORWIND and FORESTORM. We recognize
quantified with respect to the pre-event conditions (MGDI in that estimates of forest damage based on FORWIND are fully
the year before the event). The technique used to disentangle dependent on the GSV derived from GlobBiomass. Indeed,
the fire signal, as well as the correlation and sensitivity anal- any deviations of the mapped GSV from the true forest state
yses with respect to the temporal lags and wind disturbance are inherently translated into our damaged GSV estimates. In
size, were performed analogously to the previous validation particular, the GSV map refers to the year 2010; therefore, it
exercise (Sect. 4.1). is very likely that it largely reflects the biomass conditions
Overall, we found a low but significant correlation coeffi- following, rather than preceding, the windstorm events (all
cient (ρk = 0.27; p value < 10−3 ) (Fig. 3c). The lower corre- five events considered in this validation exercise occurred be-
lation compared to the Landsat-based dataset is presumably fore 2010).
due to the coarser spatial resolution of MGDI that probably In order to disentangle such source of bias, we derived
does not fully capture the changes in land surface proper- country-scale estimates of average GSVs for the year 2000
ties due to wind disturbances (Mildrexler et al., 2009). This (pre-event conditions) from the State of Europe’s Forest
seems to be supported by the generally increasing correlation dataset (Forest Europe, 2015) (https://www.foresteurope.org/
values up to 0.31 for wind disturbances of 1 ha consistently docs/SoeF2015/OUTPUTTABLES.pdf, last access: 20 De-
across the different temporal lags (Fig. 3d). cember 2019). We then derived the damaged GSVs by mul-
tiplying Forest Europe-derived GSVs by the total forest area
4.3 FORWIND versus FORESTORM
affected for each of the considered wind events by assum-
ing a 100 % degree of damage. Furthermore, as wind dis-
FORWIND data were finally compared with estimates of turbance typically affects taller forest patches and probably
damaged growing stock volume (GSV) that are recorded at more productive trees compared to the country-scale aver-
Earth Syst. Sci. Data, 12, 257–276, 2020 www.earth-syst-sci-data.net/12/257/2020/G. Forzieri et al.: A spatially explicit database of wind disturbances in European forests 267 Figure 3. Validation of the FORWIND database. (a) Density plot of FORWIND-affected area versus Landsat-derived forest cover loss, both expressed in logarithmic scale and for lag-01 effects. The colour reflects the number of records, and the legends report the Spearman rank correlation coefficient (ρk ), the significance (p value) and the sample size (n). (b) Spearman rank correlation coefficients for different affected area thresholds (on the x axis) and different lagged effects are displayed in colour bars. Lagged effects considered include the forest cover loss cumulated over the event of a given year together with that of the following year (lag-01), forest cover loss estimated for the year event only (lag-0) and forest cover loss estimated for the following year only (lag-1). Panels (c) and (d) are the same as (a) and (b) but for the MODIS-derived Global Disturbance Index instead of the Landsat-derived forest cover loss. (e) Scatter plot of damaged growing stock volume estimated from FORWIND (on the x axis) and FORESTORM (on the y axis) for five windstorms: Slovakia in 2004 (SK2004), Sweden in 2005 (SE2005 – Gudrun), Germany in 2007 (GE2007 – Kyrill), the Czech Republic in 2007 (CZ2007 – Kyrill) and France in 2009 (FR2009 – Klaus). FORWIND estimates are derived using GlobBiomass-derived estimates of GSVs and reported damage degree information. Panel (f) is the same as (e) but with estimates of GSVs derived from Forest Europe national inventories and assuming a 100 % damage degree for all FORWIND records. age, we rescaled previous estimates of damaged GSVs based from aerial photointerpretation or difficulties in mapping in- on the ratio between the average tree height computed over accessible areas by ground surveys. However, according to wind-affected areas and the average tree height computed the institutions responsible for the data acquisition, the forest over all of whole vegetated land in the country. Tree height areas affected by the windstorm events considered in this val- values where retrieved from 1 km spaceborne light detec- idation exercise were exhaustively mapped. Therefore, possi- tion and ranging (lidar) data acquired in 2005 by the Geo- ble residual omissions are expected to only marginally affect science Laser Altimeter System (GLAS) aboard ICESat (Ice, our results. We, therefore, argue that a possible source of er- Cloud and land Elevation Satellite), (https://webmap.ornl. ror may be associated with the FORESTORM database. Es- gov/wcsdown/dataset.jsp?ds_id=10023, last access: 20 De- timates of forest damage from FORESTORM originate from cember 2019) (Simard et al., 2011). different sources and are collected by multiple actors. Hence, Similar to the previous results, we found higher values the loss figures should be viewed in light of their potential bi- of damaged GSVs in FORESTORM than in our estimates ases, including a possible overestimation of the true impacts. based on the integration of FORWIND and country values of GSVs (Fig. 3f), except for windstorm Klaus. We recognize that FORWIND could miss some wind damage occurrences, for instance due to incomplete detection of wind disturbance www.earth-syst-sci-data.net/12/257/2020/ Earth Syst. Sci. Data, 12, 257–276, 2020
268                                 G. Forzieri et al.: A spatially explicit database of wind disturbances in European forests

5     Possible applications of the FORWIND database

For demonstration purposes, we show a series of possible ap-
plications of the FORWIND database. We recognize that the
examples described in the following sections are an over-
simplification of the relationships observed in nature and
of the biomechanical processes that may cause wind distur-
bances or that can be triggered by wind disturbances. More
sophisticated approaches could be employed to better ex-
plore and predict the forest response functions to wind distur-
bances. For example, multiple variables, susceptibility fac-
tors and drivers (e.g. tree species, tree dimension, manage-
ment regimes, planting patterns, soil depth and snow cover)
contribute concurrently to modulate the forest response to
wind disturbances (Hart et al., 2019; Klaus et al., 2011;
Mitchell, 2013), and their contribution should be analysed
in a multidimensional space (e.g. Sect. 5.1 and 5.2). There-
fore, the approaches described here should not be considered
a reference methodology but only as informative applications
for exploring the usefulness of the FORWIND database.

5.1    Scaling relations of severity of wind disturbances

The exploration of the relations between forest dynamics and      Figure 4. Scaling relations of the degree of damage. (a) Re-
scale can reveal important information on ecosystem spatial       lation between the area affected by wind disturbance (on the
                                                                  x axis) and degree of damage (on the y axis) as derived from
organization by addressing preservation of information in-
                                                                  the FORWIND database for different PFTs, including broadleaf
tegrity in upscaling and downscaling procedures of land sur-      deciduous (BrDe), broadleaf evergreen (BrEv), needleleaf decid-
face parameterization for ecological modelling applications       uous (NeDe) and needleleaf evergreen (NeEv). PFT-specific av-
(Forzieri and Catani, 2011). Here, we explore – in a simpli-      eraged values, visualized in circles of different colour, were de-
fied approach – the scaling relations of the degree of damage     rived using bins that spanned the sampled range and using their
of wind disturbances collected in FORWIND. To achieve this        cover fractions as weights. The fitted quadratic polynomial func-
we estimated, for each record, the cover fractions of differ-     tions are shown by a continuous line, while their parameters and
ent plant functional types (PFTs) including broadleaf decid-      performances are reported in Table 5. The inset box shows the aver-
uous (BrDe), broadleaf evergreen (BrEv), needleleaf decid-        age degree of damage computed separately for each PFT using the
uous (NeDe) and needleleaf evergreen (NeEv). Cover frac-          whole set of records. (b) Frequency distribution of the samples (on
tions were retrieved from the annual land cover maps of the       the y axis) over the gradient of area affected by wind disturbance
                                                                  (on the x axis).
European Space Agency’s Climate Change Initiative (ESA-
CCI, https://www.esa-landcover-cci.org/, last access: 20 De-
cember 2019). The degree of damage of each record was             with R 2 ranging between 0.84 and 0.90 across the PFTs (Ta-
then spatially averaged over the sampled interquartile range      ble 6). Compared to the other PFTs, NeEv generally has a
of affected areas (bin size of 0.25 ha). The spatial averages     higher degree of damage that is related to the affected area
were computed separately for each PFT, utilizing their cover      by a quasi-monotonic pattern. The relationships found for the
fractions as weights. Quadratic polynomial functions were         other PFTs show a stronger link between the degree of dam-
finally used to fit the observations and retrieve the relation-   age and affected area compared to NeEv, particularly over
ship between the degree of damage and affected area for the       the range with larger samples (affected areas < 2 ha, Fig. 4b),
considered PFTs.                                                  as visualized by the steeper slopes of the fitting functions.
   Results show that all considered PFTs generally have a         For BrDe, BrEv and NeDe a prominent parabolic pattern
higher degree of damage for wind disturbances with small          emerges distinctly driven by records with a large spatial ex-
spatial extent (Fig. 4a). This may reflect a better delineation   tent and a relatively high degree of damage.
of small affected areas when the damage is typically higher
and homogeneous. Furthermore, the declining scaling rela-
tions suggest potential spatially varying dampening effects
of wind severity due to landscape heterogeneity over large ar-
eas compared to more homogeneous patterns in small forest
patches. Model fitting shows reasonably good performances,

Earth Syst. Sci. Data, 12, 257–276, 2020                                            www.earth-syst-sci-data.net/12/257/2020/
G. Forzieri et al.: A spatially explicit database of wind disturbances in European forests 269
Table 6. Parameters and performance of fitting regression models expressing the degree of damage as a function of the area affected. The
relationship between the degree of damage (y) and the area affected by wind disturbance (x) is expressed by the following general quadratic
polynomial function: y = p1 ·x 2 +p2 ·x +p3 , where p1 , p2 and p3 are the coefficients of the equation. Coefficients are listed in the table with
their 95 % confidence interval in brackets. Model performance is quantified in terms of coefficient of determination (R 2 ). Models and the
corresponding parameters and performance are evaluated separately for broadleaf deciduous (BrDe), broadleaf evergreen (BrEv), needleleaf
deciduous (NeDe) and needleleaf evergreen (NeEv) data.
Plant Model parameters Coefficient of
functional p1 p2 p3 determination
type (R 2 )
BrDe 0.040 (0.028, 0.052) −0.223 (−0.279, −0.167) 0.718 (0.662, 0.773) 0.905
BrEv 0.051 (0.034, 0.068) −0.265 (−0.344, −0.187) 0.727 (0.649, 0.805) 0.842
NeDe 0.050 (0.031, 0.070) −0.277 (−0.367, −0.188) 0.757 (0.668, 0.846) 0.848
NeEv 0.025 (0.015, 0.036) −0.157 (−0.206, −0.108) 0.695 (0.646, 0.743) 0.902
5.2 Forest vulnerability to wind disturbances aged at bin level, simple linear regression models show a
reasonably good fit, with R 2 values of 0.52 and 0.81 for
The vulnerability of forests to natural disturbances is a key the fraction of NeEv and annual maximum wind speed, re-
determinant of risk and reflects the propensity of a for- spectively. Emerging patterns are largely consistent with ex-
est to be adversely affected when exposed to hazardous pectations and previous studies. An increasing fraction of
events (IPCC, 2014). Vulnerability is largely controlled by NeEv leads to an increase in wind disturbance area (grow-
local environmental conditions, such as climate and forest ing rate of 12 ha of affected forest per 0.1 increase in NeEv
characteristics, which regulate the sensitivity of ecological fraction, Fig. 5b). The emerging relation is likely driven by
processes to disturbance agents (Lindenmayer et al., 2011; the relatively high abundance of Picea abies in the sampled
Seidl et al., 2016; Turner, 2010). Here, we employ FOR- forest areas. This tree species is typically characterized by
WIND records to quantify the forest vulnerability as a func- shallower rooting systems, often due to the type of soils on
tion of the fraction of evergreen needleleaf forest and an- which it is planted (Mason and Valinger, 2013). Combined
nual maximum wind speed. The fraction of NeEv was de- with the limited flexibility of its branches (Mayhead, 1973)
rived from the ESA-CCI product aggregated at 0.5◦ spa- and relatively low rupture strength of its trunk (Lavers, 1969)
tial resolution. Annual maximum wind speeds were com- this makes Picea abies prone to uprooting and breakage by
puted from NCEP/NCAR Reanalysis 2 data (Saha et al., strong winds (Colin et al., 2009; Nicoll et al., 2006). A sim-
2010) (NCEP2, https://www.esrl.noaa.gov/psd/data/gridded/ ilar pattern emerges with respect to annual maximum wind
data.ncep.reanalysis2.html, last access: 20 December 2019). speed (Seidl et al., 2011). Wind disturbance area tends to in-
Daily average wind data at 0.5◦ spatial resolution were ac- crease with rising wind speed (growing rate of 32 ha of af-
quired and the two horizontal components combined to de- fected forest per 1 m s−1 increase in wind speed, Fig. 5d).
rive the magnitude of the wind vector. For each cell, the frac- Maximum wind speeds are the primary determinant of wind
tion of NeEv and the annual maximum wind concomitant disturbances. However, we point out that the coarse spa-
with a wind disturbance were then selected from the time tial and temporal resolution on NCEP2 data largely under-
series and used in our experiment as potential drivers of vul- estimate the speed of wind gusts and may completely miss
nerability (Fig. 5a and c). The values of fraction of NeEv peak winds originating from tornados. This is clearly ev-
and annual maximum wind speed (predictors) were linked ident from the range of values of annual maximum wind
with the corresponding FORWIND affected area (response speed (6–22 m s−1 ), which are far lower than the wind speeds
variable) within each 0.5◦ cell. The high spatial variability reported in country-scale inventories of forest disturbance
of the considered metrics and the potential effects of addi- (e.g. 42 m s−1 for windstorm Gudrun, FORESTORM) and
tional environmental factors not considered in this exercise in the Extreme Wind Storms (XWS) catalogue (Roberts et
may potentially mask the functional relations between the re- al., 2014) (http://www.europeanwindstorms.org/, last access:
sponse variable and predictors. In order to reduce such poten- 20 December 2019) (e.g. 39 m s−1 for windstorm Gudrun,
tial sources of noise, response variables and predictors were XWS).
spatially averaged over the sampled range of the predictors
(bin sizes of 10 % and 2 m s−1 for the fraction of NeEv and
annual maximum wind speed, respectively).
Wind disturbance areas manifest a substantial variabil-
ity, as evident from the generally high values of the coef-
ficient of variation. However, when data are spatially aver-
www.earth-syst-sci-data.net/12/257/2020/ Earth Syst. Sci. Data, 12, 257–276, 2020270 G. Forzieri et al.: A spatially explicit database of wind disturbances in European forests
Figure 5. Susceptibility factors and drivers of forest vulnerability to wind disturbances. (a) Spatial map of the fraction of evergreen needleleaf
forest (NeEv). (b) Relation between the fraction of NeEv (on the x axis) and area affected by wind disturbances (on the y axis) as derived
from the FORWIND database. Averaged values, shown in grey circles, were derived using bins that spanned the sampled range. Colour
patterns reflect the coefficient of variation within each bin. The fitted linear regression model is shown with a black line, and the coefficient
of determination (R 2 ), slope (p1 ) and intercept (p2 ) are reported in the labels. The 95 % confidence interval for each of the coefficients is
shown in brackets. (c) Spatial map of annual maximum wind speed; panel (d) is the same as (b) but for annual maximum wind speed in place
of the fraction of NeEv. The grid cells in (a) and (c) where no wind disturbances occurred over the 2000–2018 period are masked out.
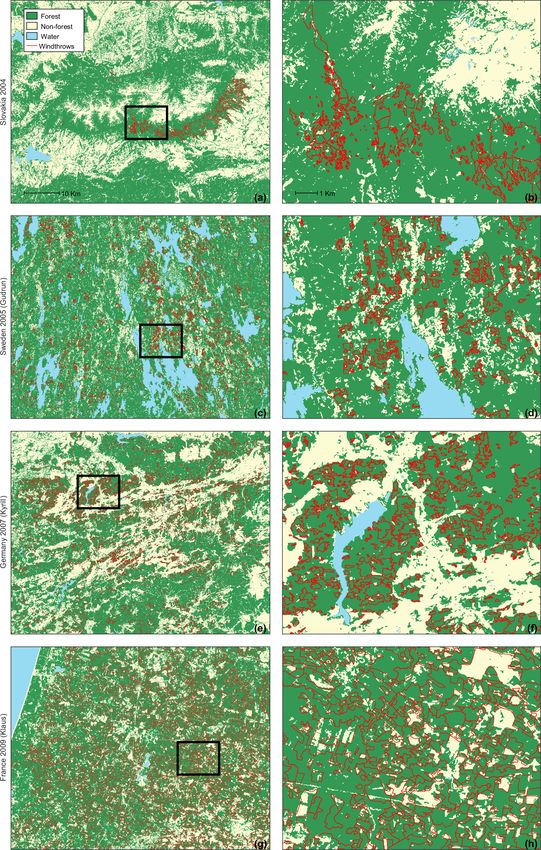
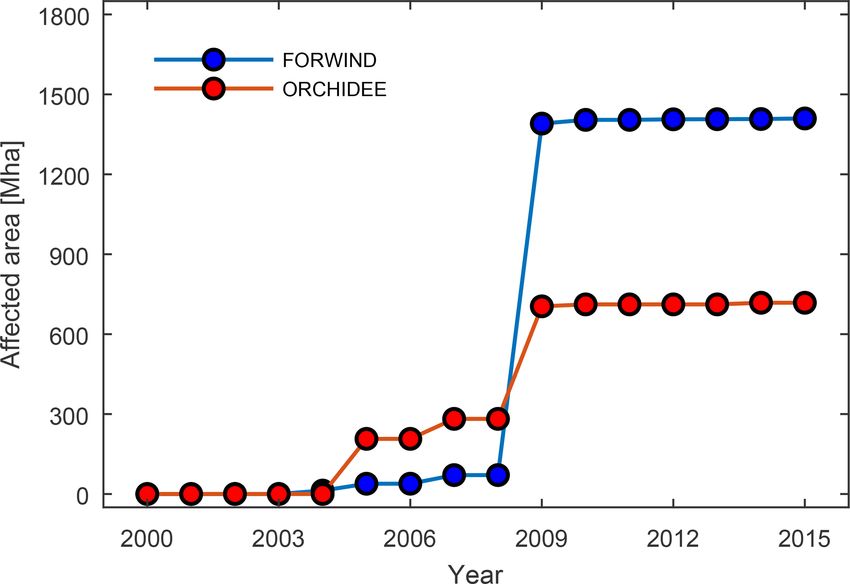
5.3 Remote sensing detection and attribution of wind Sentinel-2 imagery and the FORWIND database to automat-
disturbances ically map wind disturbances that occurred following wind-
storm Vaia in October 2018 in the Dolomites in northern Italy
(Pirotti et al., 2016). Google Earth Engine was used to cre-
Natural disturbances are accelerating globally, but their full
ate a single image composite from a stack of cloud-free pix-
impact is not quantified because we lack an adequate mon-
els (11 and 28 images acquired before and after the wind-
itoring system. Remote sensing offers a means to quantify
storm event, respectively). The median was used as a reducer
the frequency and extent of disturbances over landscape-to-
over the vector of pixel values derived from each image, af-
global scales (McDowell et al., 2015). For instance, some
ter masking cloudy pixels using the cloud probability raster
pioneering studies have begun producing classification maps
delivered from atmospheric, terrain and cirrus correction of
of various forest disturbance agents based on remote sensing
the Sen2Cor processor (Louis et al., 2018). Further masking
data (Cohen et al., 2016; Hermosilla et al., 2015; Potapov
was applied to process only pixels covered by forest, using
et al., 2015; White et al., 2017). However, the attribution of
the 2018 estimated forest cover map from the Global For-
forest change to windstorms remains challenging. Previous
est Change 2000–2018 dataset (Hansen et al., 2013). Binary
systematic monitoring has been performed only over lim-
classification, i.e. damaged versus non-damaged, was applied
ited areal extents and showed considerable uncertainty (Bau-
over a set of 1000 completely damaged areas retrieved from
mann et al., 2014; Schroeder et al., 2017) mostly due to the
FORWIND and 1000 non-damaged areas. Half of these were
limited number of sampled wind-affected areas available for
used for training and validation, the other half for unbiased
training and testing classification algorithms (Schroeder et
testing of the model performance. The feature vector used for
al., 2017). In this respect, FORWIND data can be used to
predictors included reflectance values recorded by Sentinel-2
enhance our capability to detect and attribute forest damage
after radiometric and atmospheric correction (i.e. bottom of
due to windstorms from remote sensing data. Here, we tested
atmosphere) and a tasselled cap (TC) transform of reflectance
different types of classification trees in combination with a
Earth Syst. Sci. Data, 12, 257–276, 2020 www.earth-syst-sci-data.net/12/257/2020/You can also read