Rapid attribution of heavy rainfall events leading to the severe flooding in Western Europe during July 2021
←
→
Page content transcription
If your browser does not render page correctly, please read the page content below
Rapid attribution of heavy rainfall events
leading to the severe flooding
in Western Europe during July 2021

Contributors
Frank Kreienkamp1, Sjoukje Y. Philip2, Jordis S. Tradowsky1,4, Sarah F. Kew2, Philip Lorenz1, Julie
Arrighi7,8,9, Alexandre Belleflamme16, Thomas Bettmann18, Steven Caluwaerts13,19, Steven C. Chan14,
Andrew Ciavarella22, Lesley De Cruz13, Hylke de Vries2, Norbert Demuth18, Andrew Ferrone17, Erich
M. Fischer6, Hayley J. Fowler14, Klaus Goergen16, Dorothy Heinrich7, Yvonne Henrichs18, Geert
Lenderink2, Frank Kaspar10, Enno Nilson15, Friederike E L Otto11, Francesco Ragone13,20, Sonia I.
Seneviratne6, Roop K. Singh7, Amalie Skålevåg, Piet Termonia13,19, Lisa Thalheimer11, Maarten van
Aalst7,8,21, Joris Van den Bergh13, Hans Van de Vyver13, Stéphane Vannitsem13, Geert Jan van
Oldenborgh2,3, Bert Van Schaeybroeck13, Robert Vautard5, Demi Vonk8, Niko Wanders12

1 - Deutscher Wetterdienst (DWD), Regionales Klimabüro Potsdam, Potsdam, Germany; 2 - Royal Netherlands
Meteorological Institute (KNMI), De Bilt, The Netherlands; 3 - Atmospheric, Oceanic and Planetary Physics,
University of Oxford, UK; 4 - Bodeker Scientific, Alexandra, New Zealand; 5 - Institut Pierre-Simon Laplace,
CNRS, Paris, France; 6 - Institute for Atmospheric and Climate Science, Department of Environmental Systems
Science, ETH Zurich, Zurich, Switzerland; 7 - Red Cross Red Crescent Climate Centre, The Hague, the
Netherlands; 8 - Faculty of Geo-Information Science and Earth Observation (ITC), University of Twente,
Enschede, the Netherlands; 9 - Global Disaster Preparedness Center, American Red Cross, Washington DC,
USA; 10 - Deutscher Wetterdienst, Nationale Klimaüberwachung, Offenbach, Germany; 11 - School of
Geography and the Environment, University of Oxford, UK; 12 - Department of Physical Geography, Faculty of
Geosciences, Utrecht University, the Netherlands; 13 - Royal Meteorological Institute of Belgium, Brussels,
Belgium; 14 - Newcastle University, Newcastle-upon-Tyne, UK; 15 - Federal Institute of Hydrology (BfG),
Koblenz, Germany; 16 - Institute of Bio-and Geosciences (IBG-3, Agrosphere), Research Centre Jülich, Jülich,
Germany; 17 - Administration of Technical Agricultural Services, Luxembourg, Luxembourg; 18 - Federal State
Office for the Environment, Rhineland Palatinate, Germany; 19 - University of Ghent, Ghent, Belgium; 20 -
Université Catholique de Louvain, Louvain-la-Neuve, Belgium; 21 - International Research Institute for Climate
and Society, Columbia University, New York, USA; 22 - Met Office, UK
Rapid attribution of heavy rainfall events in Western Europe July 2021

Main findings
● The severe flooding was caused by very heavy rainfall over a period of 1-2 days, wet
 conditions already before the event and local hydrological factors. While river discharge
 and water levels are the physical components most directly linked to the impacts of the
 event, we focus our assessment on the main meteorological driver, the heavy rainfall
 event. This is due to the fact that some hydrological monitoring systems were destroyed
 during the flood and data of sufficiently high quality and quantity is not currently
 available.
● The observed rainfall amounts in the Ahr/Erft and the Belgian part of the Meuse
 catchment broke historically observed rainfall records by large margins. In regions of
 that size the robust estimation of return values and the detection and attribution of trends
 is challenging and thus pushes the limits of what current methods of extreme event
 attribution are designed for.
● Therefore we broadened the analysis by assessing the influence of climate change on
 similar types of events that could occur anywhere in Western Europe in a large region
 between the north of the Alps and the Netherlands. We found that in the current climate,
 for a given location within this larger region, we can on average expect one such event
 every 400 years. That also means we expect such events to occur more frequently than
 once in 400 years within the larger Western European region.
● Climate change increased the intensity of the maximum 1-day rainfall event in the
 summer season in this large region by about 3 - 19% compared to a global climate 1.2 °C
 cooler than today. The increase is similar for the 2-day event.
● The likelihood of such an event to occur today compared to a 1.2 °C cooler climate has
 increased by a factor between 1.2 and 9 for the 1-day event in the large region. The
 increase is again similar for the 2-day event.
● These numbers are based on an assessment including observations, regional climate
 models and very high resolution climate models that directly simulate convection. The
 changes in intensity and likelihood are larger in the observation-based assessment
 compared to all models.
● In a climate 2 °C warmer than in preindustrial times models suggest that the intensity of
 a 1-day event would increase by a further 0.8-6% and the likelihood by a factor of 1.2-
 1.4. The increase is again similar for the 2-day event.
● The July 2021 floods resulted in extreme impacts including over two hundred deaths.
 Given the rarity of the event it is clear this is a very extreme event that is reasonably
 likely to cause negative impacts. However, especially given events like this will occur
 more frequently in the future, examining how vulnerability and exposure can be reduced
 becomes critical to reducing future impacts.

 Page 1 of 51
Rapid attribution of heavy rainfall events in Western Europe July 2021

1 Introduction
The 6th Intergovernmental Panel on Climate Change (IPCC) assessment report (IPCC, 2021) states that
extreme precipitation, pluvial and fluvial floods have been observed to increase in Western and Central
Europe and will increase with high confidence in case global warming reaches 2 °C, expected to occur
by mid-century in case greenhouse gas emissions reduction do not take place quickly. However,
attribution of specific local extreme precipitation events to climate change remains difficult due to the
high year-to-year or decade-to-decade variability of extreme precipitation. Furthermore, the limited
availability of finely-resolved climate model simulations and long-term observations provides
challenges to attribution studies of local-scale events.

Extreme rainfall occurred in Germany, Belgium, Luxembourg and neighbouring countries during the
period 12 to 15 July 2021, leading to severe flooding particularly in North Rhine-Westphalia and
Rhineland-Palatinate in Germany and along the river Meuse and some of its tributaries in Belgium and
the Netherlands. The flooding resulted in at least 184 fatalities in Germany 1 and 38 in Belgium2 and
considerable damage to infrastructure, including houses, roads, communication, motorways and railway
lines as well as bridges. A variety of livelihoods were severely disrupted by the flood event, including
local businesses in the affected regions and wine growers that make up the backbone of the Ahr Valley
region (Tafel and Szolnoki, 2020). Road closures left some places inaccessible for days, cutting off
some villages from evacuation routes and other forms of emergency response. The most affected areas
are around the rivers Ahr and Erft as well as the Vesdre in the basin of the Meuse. An estimate by the
German Insurance Association (GDV) describes the cost of the event at €4.5 to €5.5 billion for Germany
alone while damage in Belgium is estimated to exceed €0.35 billion2. The devastating impacts of the
July 2021 extreme precipitation event that struck Germany and Benelux provides an impetus to carry
out an event attribution analysis to investigate the role of anthropogenic climate change in the extreme
rainfall event. This analysis follows the standard structure of WWA event attribution analysis (van
Oldenborgh, et al. 2021) by defining the event, describing data and models used, assessing trends,
attributing the event, synthesis of the results which are put in the context of vulnerability and exposure.

1.1 Meteorological Situation

The extreme precipitation occurred in connection with the slowly-moving low-pressure system
"Bernd"3. As reported by DWD (Junghänel et al., 2021), MeteoLux 4 and RMI5, the meteorological
situation during the 12 to 15 July period was mainly characterised by a cut-off low pressure system over
Central Europe (Figure 1), supplying very moist air to the wider region, see Figure 2. In conjunction
with the low pressure system slowly approaching from France towards Germany, the troposphere was
increasingly unstably stratified. Surface air over the Mediterranean and Northern Europe was very

1
 EM-Dat, 10.08.2021, https://public.emdat.be/data (retrieved 10 August 2021)
2
 Crisiscenter Belgium, 19.09.2021.
3
 The naming of the low and high pressure systems here follows the German naming convention. Information on
this can be found under http://www.met.fu-berlin.de/adopt-a-vortex/ .
4
 MeteoLux, 19.07.2021, https://www.meteolux.lu/de/aktuelles/ruckblick-auf-den-ergiebigen-dauerregen-vom-
14-und-15-juli-2021/?lang=fr
5
 RMI, 16.07.2021 , https://www.meteo.be/nl/info/nieuwsoverzicht/eerste-cijfers-en-duiding-bij-de-hevige-
neerslag-van-14-en-15-juli (Dutch) and https://www.meteo.be/fr/infos/actualite/ce-que-lon-sait-sur-les-pluies-
exceptionnelles-des-14-et-15-juillet-2021 (French)

 Page 2 of 51
Rapid attribution of heavy rainfall events in Western Europe July 2021

warm, feeding the atmosphere’s water holding capacity. Warm, and very humid, air masses reached
Central Europe from the Mediterranean in a rotating movement around the low pressure system
"Bernd". Forced uplift (orographic and dynamic) and slight damming effects in the western low
mountain ranges (Ardennes, Sauerland, Westerwald and Eifel) then led to recurrent or persistent heavy
rain, first regionally and later over large areas. This initially led to localised overflow of small
watercourses and flash floods. As the precipitation continued, medium-sized and larger rivers such as
(in Germany) the Ahr, Emscher, Erft, Kyll, Lippe, Prüm, Ruhr, Rur, Sieg and Wupper also overflowed
their banks. This resulted in an extensive flood situation from the Eifel (Rhineland-Palatinate) through
the Rhineland and the Ruhr region to southern Westphalia (North Rhine-Westphalia). In Belgium, the
worst floods occurred in the Ardennes along the Vesdre and Ourthe rivers and then downstream along
the Meuse. In the days after 15 July, the high pressure system "Dana" pushed the low pressure system
"Bernd" towards south-eastern Europe. This again led to further heavy rainfall events in Germany
(Eastern Erzgebirge and Lausitz, as well as in the Berchtesgadener Land, 17 July 2021).

Figure 1: Analysis of the meteorological situation on 14 July 2021 0 UTC. The rights for the
 illustration are held by Berliner Wetterkarte e.V. (https://berliner-wetterkarte.de/)

 Page 3 of 51
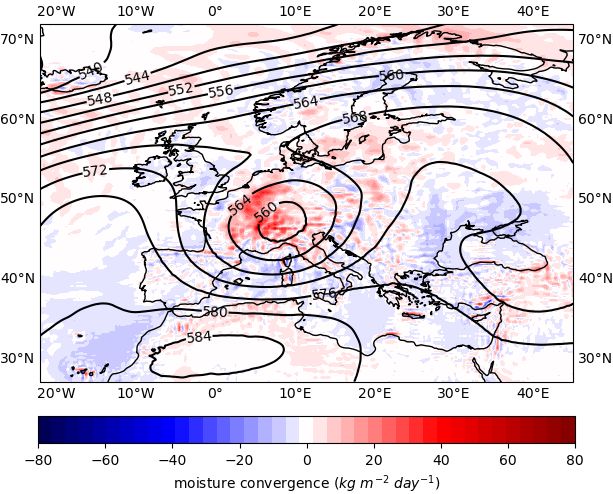
Rapid attribution of heavy rainfall events in Western Europe July 2021

Figure 2: Meteorological situation during the event. Contour lines show the 500 hPa geopotential
 averaged over the 12-15 July 2021 period (in 102 m2 s-2). Colors show the vertical integral of
 the convergence of moisture flux, averaged over the 12-15 July 2021 period (in kg m-2 day-1).
 Data from the ERA5 reanalysis. The data show a nearly stationary cut-off low over central
 Europe, associated with moisture convergence over the region and divergence over the
 Mediterranean region and the Atlantic ocean south 40° N.

In addition to the amount of precipitation, the antecedent soil moisture content is also relevant in the
context of flooding. The three weeks before the flood event were marked by recurring precipitation
events throughout a broader Western Europe region including both affected regions in Germany and
Belgium (overall moderately wet conditions over the Belgian Meuse basin in the month before). The
soils were therefore already near saturation in some parts of the area affected by heavy rainfall
associated with low-pressure system "Bernd" (see Figure 2 in Junghänel et al., 2021). While in
Rhineland-Palatinate and in South Westphalia the soils could hardly absorb any additional water
regionally (in some cases they had less than 10 mm free soil water storage), the soils in the south-west
of North Rhine-Westphalia were still capable of absorbing water to a certain extent (over 75 mm free
soil water storage).

 Page 4 of 51
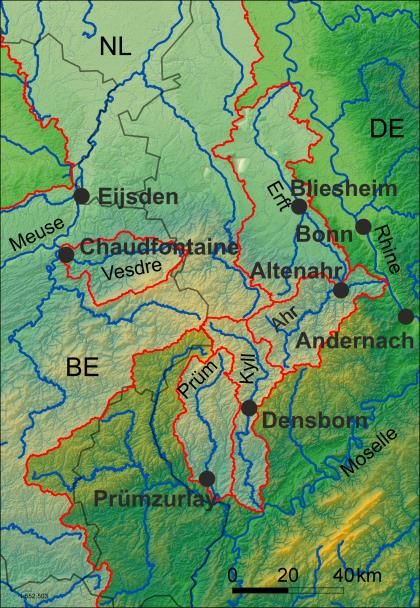
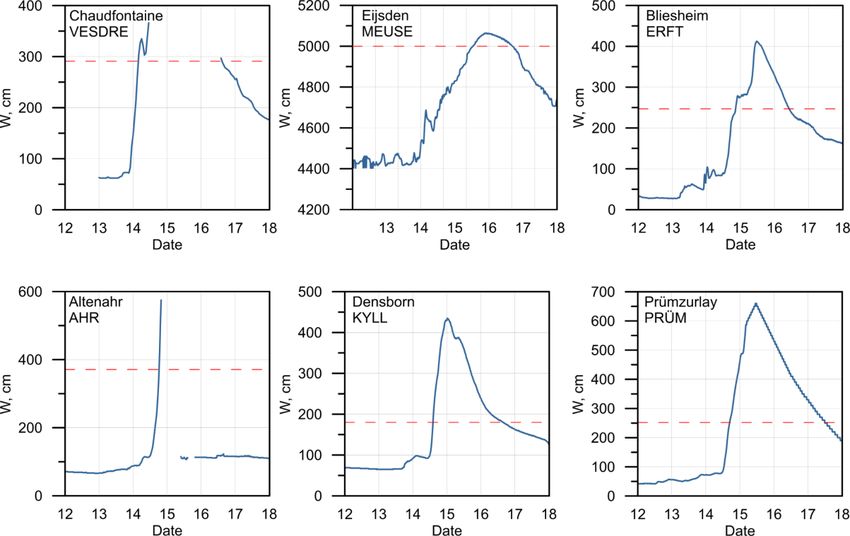
Rapid attribution of heavy rainfall events in Western Europe July 2021

1.2 Hydrological analysis
This section provides background on the hydrological setting of the affected areas and attempts to
provide first estimates of the hydrological extremes associated with the extreme hydrometeorological
conditions and thereby also linking the first-order drivers (rainfall) with their effects (flooding). Special
focus is put on the Meuse (gauge Eijsden, middle Meuse) and the Ahr (gauge Altenahr, lower Ahr).
Due to limited high-quality data availability and decreased reliability as well as complexity of
hydrological drivers, a full hydrological attribution study is considered not possible at this point for the
hydrological time series.

1.2.1 Hydrological characteristics of the affected areas
The affected catchments selected for this study (see metadata Table 1 and Figure 5) are located in the
Ardennes and the Eifel mountains in the north-western part of the Central European low mountain
range. This region is geologically characterised by paleozoic siliciclastic sedimentary rocks, regionally
also limestones, locally interbedded with paleogene and neogene volcanic rocks. Relatively shallow
soils have often developed on these siliceous rocks. They have a low water capacity also due to their
high skeletal content. Topographically, it is an elevated plain (mostly 200 to 500 m) surmounted by
individual mountain ranges (up to 700 m), into which the river network has cut deeply during an ongoing
phase of tectonic uplift, often in the form of V-shaped notch valleys. The valleys are locally very narrow
with steep slopes leading to funnel-like effects in the event of floods.
These hydrogeological, pedological, and topographical characteristics pre-condition the area to be
prone to an overall high and rapid hydrological responsiveness. In combination with the extreme hydro-
meteorological situation in July 2021, characterized by high soil saturation levels, low saturated
conductivity and high and sustained precipitation intensities over a widespread area set the scene for
the extreme and destructive hydrological event.
It should be noted that the winter is the usual flood season, i.e. the time of the highest annual discharge,
in the region, when relatively high precipitation, low evapotranspiration, possibly in combination with
snowmelt, cause high discharges. Nevertheless, many large floods caused by heavy rainfall have
occurred in past summers, e.g. 1804, 1888, 1910, 2016 in the Ahr region (Roggenkamp & Herget,
2014).
In addition to many common features of the catchments, there are also differentiating characteristics
that have a modifying effect on the flood. At the level of the various catchments, in addition to the
location relative to the precipitation area and regional hydrological, topographical and pedological
details, different land cover (arable and grassland use, degree of forestation, viticulture) and water
management measures (dams, flood retention) should be mentioned. At the level of the individual rivers,
the respective valley cross-sections, river construction, building development near the river and effects
during the event itself (backwater, surges) cause large differences in the local flooding.
Figure 3 shows hydrographs of selected gauging stations during the event period. The catchments of
the Vesdre, Ahr, and Kyll responded particularly fast. At all gauging stations pre-existing water level
maxima (red lines in Figure 3) were significantly overtopped, including the station Eijsden at the
relatively large basin of the Meuse. For Belgium (Meuse catchment) out of the 118 stations where
discharge is measured, the discharge exceeded the threshold corresponding to the 25 year return period
in more than half of the locations, and the threshold corresponding to the 100 year return period was
exceeded in 29 locations. Additionally, preliminary reporting indicates that, out of the 262 Walloon
communities, 197 received excessive rainfall.

 Page 5 of 51
Rapid attribution of heavy rainfall events in Western Europe July 2021

Table 1 gives some general statistics and data sources for the stations. Locations can be found in Figure
4.

Figure 3: Water levels between 12 and 18 July 2021 at selected gauging stations. Red hatched line
 shows the highest observed water levels according to pre-July 2021 hydrological statistics
 (except for Eijsden/NL showing a "extreme" scenario). Plot: Federal Institute of Hydrology
 (BfG). Sources: Table 1.

Figure 4: Map of the catchments and locations of gauging stations.

 Page 6 of 51
Rapid attribution of heavy rainfall events in Western Europe July 2021

 Table 1: Selected catchment areas, gauging stations and hydrological parameters. MQ (mean
 discharge), MHQ (mean of highest annual discharge), HHQ (highest observed discharge),
 HQ100 (statistical discharge with return period of 100 years). Sources: DGJ (Deutsches
 Gewässerkundliches Jahrbuch), LfU RLP (Federal State Office for the Environment, Rhineland
 Palatinate), LANUV (Federal State Office for Nature, Environment and Consumer Protection),
 RWS (Rijkswaterstaat, the Netherlands), SPW-MI (Service Publique de Wallonie - Mobilité et
 Infrastructures, Belgium).
 River Gauging station Catchment area Time period MQ MHQ HHQ HQ100 Source
 (at gauging (quality [m3 s-1] [m3 s-1] (before [m3 s-1]
 2
 station) [km ] checked data) July 2021)
 [m3 s-1]
 DGJ, LfU
Ahr Altenahr (DE) 746 1946 - 2019 6,86 90,3 236 241
 RLP
 DGJ, LfU
Kyll Densborn (DE) 472 1973 - 2019 6,7 89,5 180 190
 RLP
 DGJ, LfU
Prüm Prümzurlay (DE) 574 1973 - 2019 7,78 110 252 278
 RLP
 DGJ,
Erft Bliesheim (DE) 604 1964 - 2020 2,47 26,48 55,8 71
 LANUV

Vesdre Chaudfontaine (BE) 683 1992 - 2020 10.63 119.3 274.5 SPW-MI

Meuse Eijsden (NL) ~20500 1911 - 2021 255 1473 3050 2779 RWS

1.2.2 Hydrological data availability
A precise reconstruction and classification of the hydrological and hydrodynamic processes of 14 and
15 July 2021 will require additional surveys because in many places the extreme floods not only far
exceeded any previous event but also led to a failure or even destruction of the gauging stations.
Therefore, only sparse water-level measurements are available for some catchments (e.g. Ahr, Vesdre).
Instead of water level data, discharge data would be more suitable to describe the hydrological
phenomenon and to evaluate the 2021 event against the background of long term measurements.
However, existing discharge values can also only be used to a limited extent. Even if water level data
has been recorded, existing water level-discharge relationships in most cases do not cover the extremely
high water levels of the July 2021 event and/or the event has strongly changed the water level-discharge
relationships due to considerable morphological effects in the valleys and river beds. An enormous
transport of sediment and suspended matter has not only changed the properties of the water but is not
accounted for in the existing water level-discharge relationships. Especially the entrainment of large
amounts of sediment and flotsam led to shifts in the discharge cross-section and to pulsating backwater
and surge processes in the watercourse. These non-stationary hydraulic processes cause major
difficulties in plausibility checks of measured sediment lines or the reconstruction of discharges.
For the current rapid assessment, it is therefore necessary to rely on the available preliminary and
relatively uncertain observational data, initial estimates based on individual water level marks or
indirect methods such as hydrological models or a balance based on neighbouring gauges of larger
rivers. Table 2 provides an overview of the currently available data sources and discharge estimates for
the middle Meuse and lower Ahr.

 Page 7 of 51

Rapid attribution of heavy rainfall events in Western Europe July 2021

Table 2: Overview of preliminary data for a peak flow (m3 s-1) reconstruction in selected catchments at
 the time of compilation and unpublished approximate peak flow values.
 River Method Temporal Q-Peak Remarks Source
 (spatial) (m3/s)
 resolution

 Ahr Observation 15 Min. 555 Raw data, based Federal State Office for the
 Altenahr on last Environment, Rhineland
 measurement and Palatinate (LfU RLP)
 extrapolated water
 level-discharge
 relationships
 low estimate

 Ahr Hydrological Model 1 h (lumped) 565,37 Update run of a Federal Institute of
 HBV, Altenahr forecasting model Hydrology (BfG)
 for the Rhine River
 (not optimised for
 the Ahr)
 low estimate

 Ahr Local flood mark in none (peak) 1300 high estimate University of Bonn;
 Walporzheim (4 km Roggenkamp & Herget
 upstream of Altenahr) 1200 low estimate (pers. comm.)

 Ahr Local flood mark in none (peak) 1200 high estimate University of Bonn;
 Dernau (6 km Roggenkamp & Herget
 upstream of Altenahr) 1000 low estimate (pers. comm,)

 Ahr Hydraulic model 15 min 1250 Indirect information Federal Institute of
 SOBEK Rhein based based on Rhine hydrology (BfG)
 on measurements at gauges (raw data)
 Andernach and Bonn

 Ahr Hydrological model 1h 1191 Uncalibrated, Research Centre Jülich
 ParFlow, Altenahr physically based, (FZJ), Kollet & Maxwell
 integrated (2006, 2008), Kuffour et al.
 hydrology model (2020)

 Ahr Estimate based on shift 15 min 1130 Rough estimate Federal Institute of
 and subtraction of time based on raw data Hydrology (BfG)
 series at Bonn (-3h)
 and Andernach (+ 3h)

 Meuse/Maas Gauging data Eijsden 10 min/daily 3179 Gauging data Rijkswaterstaat (RWS)

1.2.3 Estimation of peak flows
Based on the available data, we choose two gauging stations and two different hydrological settings for
further estimation of peak flows and return periods: Altenar (lower Ahr, fast reacting relatively small
catchment), and Eijsden (middle Meuse, slower reacting larger catchment).

1.2.3.1 Meuse (Eijsden)
 ● Peak flow: 3179 m3 s-1 ; 15 July 2021 (17:30)
 ● Day mean: 2794 m3 s-1; 15 July 2021

 Page 8 of 51
Rapid attribution of heavy rainfall events in Western Europe July 2021

The currently available data have to be regarded as raw data which did not pass all necessary quality
checks. For example, Figure 3 shows some noise in the data of gauge Eijsden/Meuse which may be
reduced in the final time series. Nevertheless, under the given conditions, the data situation at larger
rivers such as the Meuse can be regarded as good. Especially since no overbank flooding occurred and
thus the discharge-water level relationship is still reliable.
The Eijsden gauging station offers a continuous and long time series at a daily temporal resolution.
These data, as well as the peak flows, can be directly interpreted. The peak flow of the Meuse at the
border between Belgium and the Netherlands is estimated as 3179 m3 s-1 (15 July 2021, 17:30). The
highest daily mean discharge was 2794 m3 s-1 (15 July 2021).
High water levels in the Meuse normally occur in the winter period when the upstream catchment is
fully saturated due to prolonged rain periods or rain-on-snow runoff events. The flood on 15 July 2021
is exceptional as it was the highest on record summer flood event. Previous events in summer never
exceeded 2016 m3 s-1 (22 July 1980), putting 2021 outside of the expected flood volumes based on the
historic summer floods records for the Meuse with a 40% increase compared to the previous summer
flood record.
Water management interventions, like intentional flooding of wetlands, prevented downstream floods
and kept the Meuse river within its banks. However, it must be noted that the current flood levels were
equal to the design levels (return period 1 in 250 years) of the major dike systems that were put in place
after the winter floods of 1993 and 1995. These adaptation measures prevented the widespread flooding
of the river Meuse during this event.

1.2.3.2 Ahr (~Altenahr, lower Ahr)
 ● Ahr peak flow: 1000 m3 s-1 (+/- 200 m3 s-1); 15 July 2021 (03:00)
 ● Ahr day mean: 600 m3 s-1 (+/-50 m3 s-1); 15 July 2021
Compared to the Meuse, the data situation is much more complicated for the Ahr as measurements are
fragmentary. High-resolution measured data (up to 15 minutes) from the Ahr are available e.g. from
gauging station Ahrweiler until 14 July 2021, 19:45:00 only, the time the station was destroyed. At this
time discharge was 555 m3 s-1 (LfU RLP). The peak flow occured early on 15 July 2021 and must have
been much higher. First peak flow estimates based on local water level surveys in connection with
preliminary cross-section surveys (Univ. Bonn, Dr. Thomas Roggenkamp, pers. comm.) point to flows
higher than 1200 m3 s-1 (Walporzheim) and higher than 1000 m3 s-1 (Dernau), 4 km and 6 km upstream,
respectively. A peak flow higher than 1100 m3 s-1 is consistent with estimates from gauging stations at
the Rhine (Andernach, Bonn) flanking the mouth of the Ahr river. These estimates account for the
volumes and wave travel times in this section of the Rhine (Duong et al., 2021). Furthermore,
hydrological model outputs - simulations driven by observed meteorological data of the event - were
taken into account. It must be noted however, that due to simplifications, these models are not optimised
to simulate extreme situations in small rivers such as the July 2021 event. For example, wave routing
routines are not able to account for flooding effects such as backwater at bridges and other bottlenecks
or surges following infrastructure breakdown. Nevertheless, accounting for hydrological aspects of the
event (precipitation, pre-conditions on the ground) modelled data give a range of about 600 to 1200 m3
s-1.
In this preliminary multi-evidence reconstruction we give high weight to the results of water level /
cross section surveys and the estimates based on continuous observations on the Rhine river. This leads
us to a rough estimate of peak flow of the Ahr in the order of 1000 m3 s-1 (+/- 200 m3 s-1) which must
have occurred early on 15 July 2021 (03:00). For this day, mean discharge is estimated to 600 m 3 s-1

 Page 9 of 51
Rapid attribution of heavy rainfall events in Western Europe July 2021

(+/-50 m3 s-1) based on the routed difference of gauging stations Andernach and Bonn (Rhine) shifted
to the timing of the wave at Ahrweiler (Ahr).
The estimated peak flow of 1000 m3 s-1 (+/-200 m3 s-1) was by a factor 4.2 (3.4 to 5.0) higher than the
highest peak on record since 1947 before the event (236 m3 s-1, June 2, 2016). It is almost as high as the
highest peak flow documented and quantified so far (summer 1804, about 1200 m3 s-1 in Walporzheim,
4 km upstream of Altenahr; Roggenkamp & Herget, 2014, 2015). Preliminary estimations of the return
period for the hydrological event by the Federal State Office for the Environment Rhineland Palatinate
(LfU RLP) lead to values of 1 in more than 500 years for the July 2021 event. For this analysis, the
sample of peak values since 1947 was extended by the event 2021 and historical events of 1804, 1888,
1910, 1918, and 1920 as documented by Roggenkamp & Herget (2014).
The estimated daily mean of 600 m3 s-1 (+/-50 m3 s-1) on Jul 15 was by a factor 3.7 (3.4 to 4.0) higher
than the highest daily mean observed before (162 m3 s-1 on 21 December 1993). A first rough
approximation of the return period of the daily mean including the recorded HQ values (daily means
since 1947) leads to a return period 1 in more than 500 years. Historical flood marks can not be used
here because they are not conclusive for daily mean flows.

1.2.4 Conclusions and Discussion of the hydrological analysis
The July 2021 flood in the regions investigated (lower Ahr and middle Meuse) here
 a) Was significantly higher than any flood since the beginning of systematic records.
 b) Overtopped not only the records but also the extreme values HQ100 and higher determined
 from the recorded data.
 c) Is in some catchments comparable only to the highest historically documented and quantified
 events (Ahr).
 d) Has an initial and very uncertain estimated return period of 1 in more than 500 years (Ahr) for
 the hydrological event.

Although some first estimates could be given on the hydrological characteristics of the event, the data
situation is very poor. Evaluating floods over long periods of time (as necessary for a hydrological
attribution study) is hampered by the overall complexity and heterogeneity of flood-generating
processes in the Eifel/Ardennes region, given the topographic and hydrogeologic properties of the
catchments and water management measures (e.g. Karst in the upper Meuse, reservoirs in some Meuse
tributaries, fast reacting topographic/hydrogeological settings of the Ahr). Annual flow maxima usually
occurs during the winter season. Summer events have occured and have been destructive but were
relatively rare in pluvial flow regimes of central Europe. Also the pre-conditions (at least weeks before
the event) play a significant role.
In the Eifel region, annual highest river flows (MHQ) have increased by to +8 to +10% from the 1950’s
until today (based on observations; Nilson & Iber, 2021). Future changes amount to about +10%
(ensemble median, ensemble range +5% to +20%, based on RCP8.5), mostly due to winter floods.
Overall, attribution of changes in extreme river flood occurrence is hampered by several factors,
including the contribution of local surface characteristics as well as human water management. These
issues are also noted in the recent IPCC 2021 report (Chapter 11: Seneviratne et al., in press), which
assesses that regional changes in river floods are more uncertain than changes in pluvial floods because
complex hydrological processes and forcings, including land cover change and human water
management, are involved. Adding to the overall uncertainties associated with the discharge data of the
event and the simulation data, the sample of data is too small to allow an appropriate determination of

 Page 10 of 51
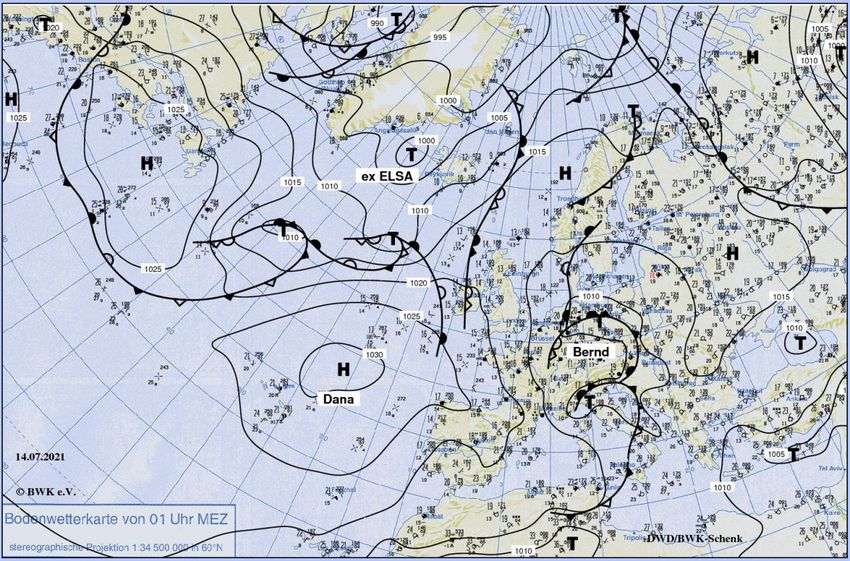
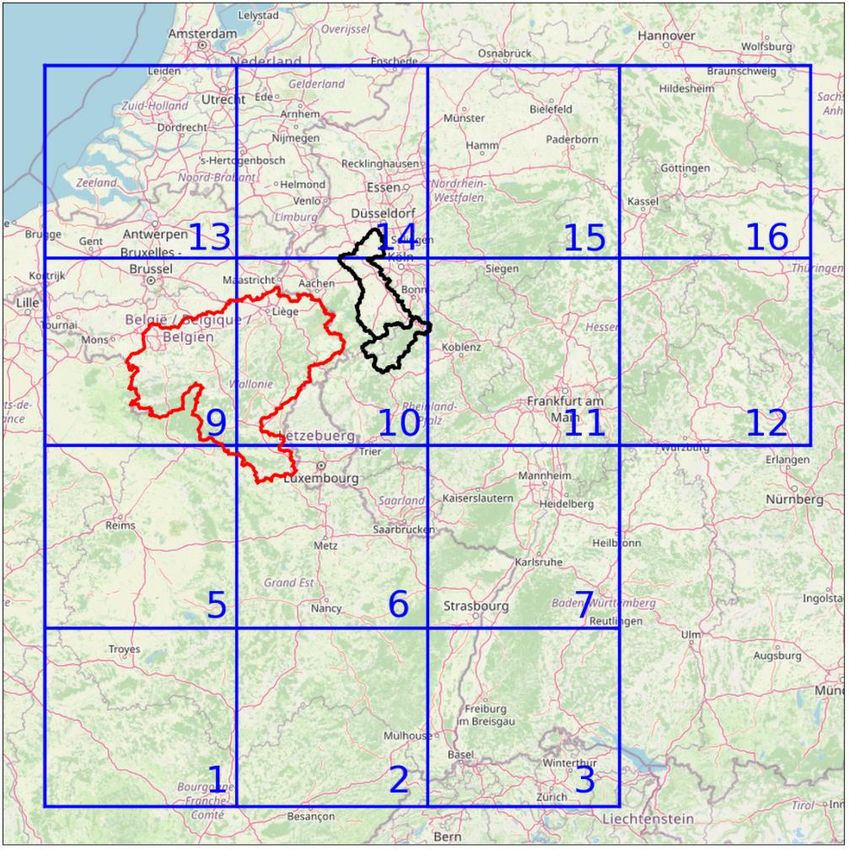
Rapid attribution of heavy rainfall events in Western Europe July 2021

the return periods for rare and extreme events such as the flood of July 2021. Statistical weather
generators and simulations with improved hydrological models could be used to obtain better estimates.
Due to all these aspects and effects, focussing on hydrological phenomena (floods, discharge) seems
not to be a good choice for this attribution study. We therefore focus the attribution study presented in
the following chapters on the meteorological phenomena, i.e. heavy precipitation accumulated over the
course of one and two days.

1.3 Analyzed Regions

While the extreme precipitation in Germany and Belgium was embedded into the same large-scale
precipitation system, the characteristic differed between the regions and thus we have decided to analyse
several regions (see Figure 5) with impact-relevant meteorological indices characterizing the event. In
addition to hydrological differences between the affected catchments, the regions we analyse in this
study also differ in their spatial extent.
In this study, we (1) consider two severely impacted catchment-shaped regions for which we ask the
attribution question of how much climate change made the event more intense or more probable, and
(2) also address a more general question of how much climate change altered the probability and
intensity of similar events to occur anywhere in Western/Central Europe (from north of the Alps to the
Netherlands), an area characterised by precipitation climatologies similar to those in the regions affected
by flooding in July 2021.

The regions which we are analysing in the following are:
 ● Ahr/Erft; combined black polygons in Figure 5: A region that covers the catchment areas of the
 Ahr and Erft. Since we did not have a shape file of the Ahr-Erft catchments at the beginning,
 we used a simple polygon shape, which describes the region very roughly, for the analysis of
 observational data and model simulations.
 ● Belgian Meuse catchment upstream of Eijsden; red polygon in Figure 5.
 ● “Pooling Region” (covering the region north of the Alps to the Netherlands); we considered the
 event as the occurrence of an extreme precipitation event in any of the 14 blue tiles in Figure
 5. This has the advantage of increasing the amount of data available for the statistical evaluation
 of the event, and enables us to study more generally extreme precipitation at the larger scale
 (130 km) in a region from north of the Alps to the Netherlands. For this approach we pool 14
 non-overlapping rectangular tiles of dimension 130 km x 130 km. The 14 rectangular regional
 tiles were carefully selected after checking the mean and extreme precipitation statistics
 (parameters of the GEV fitted distribution) to make sure that the set was homogeneous and can
 be considered as belonging to the same statistical population.

The severe flooding in the Ahr and Erft region was caused by a short intensive precipitation period, i.e.
most of the rainfall fell on 14 July 2021 as can be seen in Figure 6. Therefore, we will analyse the
maximum daily precipitation accumulation in April to September (Apr-Sep; RX1day [mm/day]) for the
Ahr and Erft region. For the Belgian Meuse catchment the precipitation leading to the extreme impact
accumulated over a longer time frame leading to the analysis of the maximum two-day precipitation
accumulation in Apr-Sep (RX2day [mm/day]). Please note that RX2day values are also expressed in
[mm/day] which means the accumulation has been averaged over the two days. Multiplication of
RX2day with two gives the total amount of rain that fell within 48 hours. For the Pooling Region, we
are analysing RX1day as well as RX2day (both for Apr-Sep).

 Page 11 of 51
Rapid attribution of heavy rainfall events in Western Europe July 2021

Figure 5: Regions analysed within this study. Area of the Meuse catchment is shown in red, the
 combined Ahr and Erft catchment shown in black and the tiles/regions used within the pooling
 approach are shown in blue.
 Copyright of underlying map: © OpenStreetMap-Mitwirkende.

The events analysed here are small-scale extremes, and therefore challenging to attribute using climate
models with coarse model resolution. Thus, this study does not directly use any Global Climate Model
(GCM) simulations and furthermore disregards Regional Climate Models (RCMs) that have a
horizontal resolution coarser than 12.5 km, which results in a much smaller set of simulations than is
typically used within World Weather Attribution analyses of an event. As a result, we use RCM
simulations that have a resolution equal to or finer than 12.5 km, including simulations from EURO-
CORDEX which downscale a variety of GCMs. Furthermore some convection-permitting model
(CPM) simulations which are not typically used within attribution studies, but can represent small-scale
extreme precipitation events more vividly, are included into this study. However, all of these CPM
models provide simulations from just one ensemble member and for a fairly limited amount of years
(up to 15 decades of data). Probabilistic event attribution is based on solid statistics of extreme values.
The limited availability of data for the reasonably small-scale event analysed here makes this attribution

 Page 12 of 51
Rapid attribution of heavy rainfall events in Western Europe July 2021

challenging and requires the use of new datasets. In order to broaden the attribution question for such
types of events which may occur elsewhere in Western/Central Europe, and to increase statistical
significance of trends, the pooled regions approach considers regions of the same order or slightly larger
than the areas most-strongly affected by the July 2021 event (~130 km, see Figure 6). The underlying
attribution question for the pooling approach is that of the influence of climate change on probability
and intensity of similar extreme precipitation events that could occur anywhere in an area from north
of the Alps to the Netherlands regardless of the exact location. Time series for each of the 14 tiles are
pooled together in the analysis. However, we estimated that, due to spatial correlation, the number of
degrees of freedom of the ensemble is not 14 times that of a single tile, but rather 3-4 times only. The
pooling approach was also used for extreme precipitation in the Cévennes mountains (Vautard et al.,
2015; Zeder and Fischer 2020), albeit using a rain gauge station pooling. By contrast, the spatial-pooling
approach is applied here to area-averaged rainfall data for 14 different rectangular tiles, situated between
north of the Alps and the Netherlands (see Fig. 5).

 Figure 6: Accumulated precipitation over two days (48h hour accumulation 13 July 00:00 UTC
 - 15 July 2021, 00:00 UTC) and accumulated over 24 hours for each of the individual days of
 the extreme precipitation event. The figure is based on an E-OBS dataset extended by numerous
 stations. For details please refer to Section 2.1.

Independent of the region we focus on the rainfall extremes that occur during the northern hemisphere
summer half-year (April to September) as the characteristics of extreme precipitation events, as well
as the preconditions, such as antecedent precipitation sums and the water holding capacity of the ground,
differ between the seasons.

 Page 13 of 51
Rapid attribution of heavy rainfall events in Western Europe July 2021

2 Data and methods

2.1 Observational data

2.1.1 E-OBS
E-OBS (version 23.1e), is a 0.25° × 0.25° gridded temperature and precipitation dataset covering
Europe, formed from the interpolation of station‐derived meteorological observations (Cornes et al.,
2018). E-OBS v23.1e was used to produce the climatology and the trend analyses, including the
estimates of the return periods. This dataset is used for the model validation for the pooled regions (see
Section 4). An enhanced, non-public E-OBS dataset that includes more observational data in the most
recent years (mostly additional data starting in 2004 or 2008), and additional data from regional and
federal authorities was produced specifically for the analysis of the heavy precipitation discussed here.
This enhanced dataset is used to produce maps of the event, however, as it is less homogeneous in time
than E-OBS v23.1e, it is less suitable for the trend analyses and estimation of the return periods.

2.1.2 REGNIE
For the Ahr and Erft catchment the REGNIE6 dataset of DWD is used. REGNIE (Regionalised
Precipitation Heights) is a daily gridded precipitation dataset with a resolution of 1 km 2 for Germany
derived from station data. It is publicly available for the period since 1st January 1931.

2.1.3 Belgian gridded dataset
For the Belgian Meuse catchment, the observations are interpolated on a grid of 5 km x 5 km. The data
used are collected from different observation networks: the Royal Meteorological Institute of Belgium
(RMI) climatological raingauge network, the network of Service Publique de Wallonie - Mobilité et
Infrastructures (SPW-MI) in Wallonia, and the network of Hydrologisch Informatie Centrum (HIC) of
Waterbouwkundig Laboratorium in Flanders. The data were quality controlled by the RMI before
interpolation on the grid. The interpolation has been done using a weight as the inverse of the distance
to the stations. Time series of 24 stations over Belgium have also been incorporated into the non-public
E-OBS dataset.

2.1.4 GISTEMP
As a measure of anthropogenic climate change we use the (4-year low-pass filtered) global mean surface
temperature (GMST), where GMST is taken from the National Aeronautics and Space Administration
(NASA) Goddard Institute for Space Science (GISS) surface temperature analysis (GISTEMP, Hansen
et al., 2010 and Lenssen et al. 2019).

6
 Deutscher Wetterdienst, Climate Data Center: REGNIE data set description:
https://opendata.dwd.de/climate_environment/CDC/grids_germany/daily/regnie/DESCRIPTION_gridsgermany
_daily_regnie_en.pdf

 Page 14 of 51
Rapid attribution of heavy rainfall events in Western Europe July 2021

2.2 Model and experiment descriptions

2.2.1 Regional climate models

2.2.1.1 RACMO
The RACMO regional climate model ensemble was developed at KNMI by downscaling 16 initial-
condition realizations of the EC-Earth2.3 coupled climate model in the CMIP5 RCP8.5 scenario
(Lenderink et al., 2014). The RACMO model (van Meijgaard et al. 2012) uses a 0.11° (12.5 km)
resolution and output includes daily precipitation. RACMO simulations are available for the 1950-2100
period.

2.2.1.2 EURO-CORDEX
A few years ago, the EURO-CORDEX Group defined a framework for the preparation of regional
climate projections (Giorgi et al., 2009; Jacob et al., 2014; Jacob et al., 2020). Following this
framework, a large number of research institutions and weather services have carried out climate
projection runs in various projects. Many simulations were in particular carried out thanks to the
PRINCIPLES C3S project, resulting in a set of 75 combinations of 12 RCMs downscaling nine GCMs
for the historical period and the RCP8.5 scenario [1951/1971 to 2100] (see Vautard et al. (2021) and
Coppola et al. (2021) which describe and assesses the ensemble even though it’s size has increased
since these publications). However, a subset of these model simulations were first validated based on a
comparison of the historical simulation with recent-year observations. For details on the validation see
Bayerisches Landesamt für Umwelt (2020), Zier Ch. et al. (2021). Following the conclusions of this
evaluation, we removed all simulations downscaling the CanESM and the HadGEM2-ES GCMs.
Simulations using the REMO RCM model were also removed. Each simulation was bias corrected using
the Cumulative Distribution Function transform method as described in Bartok et al. (2019).

2.2.2 Convection permitting models (CPMs)
The study uses climate simulations from five CPMs: the UK Met Office Unified model (UM), COSMO-
CLM, WRF, ALARO-0 and HCLIM38-AROME (HCLIM38). In the following, we will briefly
introduce the model simulations and provide information about the driving model scenarios.

The UM simulations are European-wide 2.2km experiments (EUR2.2) from the Met Office Hadley
Centre (MOHC). The EUR2.2 runs are designed to be comparable, with 1536x1536 grid points, and
span most of Western and Central Europe (~3800x3500km). EUR2.2 integrations are available for a
historical period (1998-2008) and a future scenario (10yrs, ~2100 under the RCP 8.5) both based on a
HadGEM3 model run.

The HCLIM38 simulations were carried out by the nonhydrostatic model HCLIM38-AROME (Belusic
et al. 2020) at 2.5km horizontal resolution on a domain ranging from the UK to Poland and Mid-Italy
to Southern Scandinavia. The HCLIM38 simulations consist of three GCM-forced runs (historic 1996-
2005, RCP 8.5 2041-2050 and 2090-2099, forced using EC-Earth). HCLIM38 is run in a double-nested
way, with RACMO RCM in between the host model and the CPM.

 Page 15 of 51
Rapid attribution of heavy rainfall events in Western Europe July 2021

The WRF-ME-3km simulation are from a one-way double-nested WRF v3.6.1 simulation, consisting
of a 12.2km EURO-CORDEX domain (EUR-11) and a 3.1km mid-European domain centered over
Germany (ME-3km) with 480x456 grid points. The model results used here are from a downscaling of
the CMIP5 Earth System Model of the Max-Planck-Institute (MPI-ESM-LR r1i1p1) GCM for three
time slices of 12 years each, the historical period (1994-2005), and RCP4.5 projections (2039-2050,
2089-2100). Details of the model configuration, an evaluation of (extreme) precipitation w.r.t. to in-situ
observations (using an ERA-Interim driven evaluation run), and a study on future changes of Clausius-
Clapeyron scaling are given in Knist et al., 2020.

The ALARO-0 climate projections cover the continuous periods 1950-2100 at 4-km for a wide region
centered over Belgium (Termonia et al, 2018) and has undergone thorough validation (Van de Vyver et
al., 2021) and investigation (Helsen et al., 2020) with respect to extreme rainfall. The runs were
performed in a double (one-way) nesting setup where the Belgian domain was nested in an ALARO-0
run over the EURO-CORDEX domain, which was driven by either CNRM-CM5 (historical, RCP 2.6,
RCP 4.5, RCP 8.5). In this attribution study we use RCP 4.5 and RCP 8.5 simulations. The model
domain covers the Ahr/Erft region, the Meuse region as well as 7 of the 14 tiles (i.e. 4,5,7,8,10,11,12
of the regions shown in Figure 5).

Several time slice experiments of the COSMO-CLM (https://www.clm-community.eu; Rockel et al.,
2008) at convection permitting scales have been analyzed within this study, all using the RCP8.5
emission scenario for the future. At the Karlsruhe Institute of technology (KIT) three simulations at
2.8km horizontal resolution have been conducted, driven by the global earth system models EC-
EARTH, HadGEM2, and MPI-ESM-LR respectively (EC-EARTH-KIT, HadGEM2-KIT, MPI-ESM-
KIT); the model domain covered the Ahr/Erft region, as well as 7 of the 14 tiles (i.e. 2,3,6,7,10,11,12
of the regions shown in Figure 5). At DWD a simulation at 3km horizontal resolution driven by
MIROC-MIROC5 was conducted (DWD-CCLM5-MIROC5) within the first phase of the project
„Expertennetzwerk (Network of Experts)“ (2016-2019), funded by the German Ministry of Transport
and Digital Infrastructure (BMVI); here both small regions and all 14 tiles were covered by the model
domain.

As a measure of anthropogenic climate change in the models we use the (4-year low-pass filtered)
GMST if we only have one realization of the GMST from the driving GCM model at hand, and an
ensemble-mean GMST if several ensemble members are available.

2.3 Statistical methods

A full description of the statistical methods used for this event attribution is given in Philip et al. (2020)
and van Oldenborgh et al. (2021). Here we give a summary.
As discussed in the introduction we analyse the Apr-Sep maxima of 1-day and 2-day averaged
precipitation (RX1day or RX2day) averaged over the regions defined above. The same analysis is
applied and the same metric used for both gridded observational data and climate model output. We
follow the steps outlined in the WWA protocol for event attribution (Philip et al. 2020). The analysis
steps include: (i) trend calculation from observations; (ii) model validation; (iii) multi-model attribution;
and (iv) synthesis of the attribution statement.
For the event under investigation we calculate the return periods, probability ratio (PR) and change in
intensity as a function of GMST. The two climate conditions we compared are defined as the current

 Page 16 of 51
Rapid attribution of heavy rainfall events in Western Europe July 2021

2021 climate and a GMST value representative of the climate of preindustrial
level, −1.2 ºC relative to 2021 (1850-1900, based on the Global Warming
Index https://www.globalwarmingindex.org). Later we refer to this reference as the past-
to-present. To statistically model the selected event, we use a GEV distribution that scales exponentially
with GMST, as inspired by the Clausius-Clapeyron relation (See equation 2 in Philip et al., 2020), with
location parameter and scale parameter σ varying such that their ratio is constant, and a constant shape
parameter ξ. These assumptions might be less robust here than in analyses of large-scale precipitation
events and they are also less robust when combining annual maxima and much more extreme events.
Next, results from observations and from the models are synthesized into a consistent attribution
statement. In the validation and trend analysis of model simulations, we use all available model data up
to 2030 to study changes between the past and the current climate to increase the availability of data
points. Based on the model simulations we additionally analyse the intensity change and PR between a
future climate at +2°C above the preindustrial reference, which is equivalent to +0.8°C above the current
climate of 2021. Later we refer to this reference as the present-to-future. For this analysis we use all
available model data up to the end of the model runs. The decisions on the years included in the analyses
deviate somewhat from the standard procedure and are a compromise between the standard procedure,
in which we use data up to the present GMST for the past-to-present analysis, and having sufficient
data for a good fit. Confidence intervals for the individual model or observation datasets express the
statistical-model uncertainty, obtained using a non-parametric bootstrap procedure.

3 Observational analysis: return time and trend

3.1 Ahr and Erft catchments

The analysis of the REGNIE dataset for the Ahr and Erft catchment indicates a RX1day precipitation
value of 93 mm/day for the 2021 event, see Figure 7. Note, this value is a spatial average over the
analysed region. The best estimate of the return period of this event is so large, i.e. in the order of 1 in
15000 yr - much larger than the length of the time series - that we cannot give a precise value, see Figure
8.
Note that the GEV fit to quantify the return period does not include the event itself as the area was
chosen as having an extreme event and the extreme value occurring in this year is therefore drawn from
a much larger distribution than the historical time series. Whilst we use the best estimate of the return
period in the other event definitions, here we opt for the most conservative approach to use the lower
return period estimate of 700 years for the model analysis. With this conservative choice, it is possible
to analyse observational and model data for the Ahr/Erft region based on a return period that avoids
extrapolation too far into the tail of the distribution, which would make results much less reliable and
interpretable. From the observational data we can neither prove there is a trend nor prove the absence
of a trend as the climate noise is too large, i.e. the fit indicates a change in intensity with a large
confidence interval (CI) around zero (95% CI -20% to 29%), and the uncertainty in the probability ratio
permits such a large range of values that providing a best estimate is no longer meaningful. The absence
of a significant trend at the scale of a small catchment is consistent with theoretical expectations (Li et
al. 2020; Aalbers et al. 2018, Fischer et al. 2014) given the very large internal variability and the small
spatial scale of the relevant events, which may mask or amplify local trends and prevents robust
conclusions about the existence of local trends in this type of precipitation events. At global scale for

 Page 17 of 51
Rapid attribution of heavy rainfall events in Western Europe July 2021

most larger subcontinental regions with sufficient observations, an observed increase in heavy
precipitation is well established in the literature, including medium confidence in an increase in a larger
region including West-Central Europe (IPCC 2021, Chapter 11; Seneviratne et al, in press).

Figure 7: Apr-Sep block maximum of the daily accumulated precipitation (RX1day) of the Ahr/Erft
 basin-averaged rainfall (red line) and a 10-yr running mean (green line) obtained with the
 REGNIE dataset. (Data source: Deutscher Wetterdienst, Climate Data Center:
 https://opendata.dwd.de/climate_environment/CDC/grids_germany/daily/regnie)

Figure 8: GEV fit with constant dispersion parameters, and location parameter scaling proportional to
 GMST of the index series for the Ahr/Erft region (based on REGNIE data). Left: the observed
 RX1day as a function of the smoothed GMST. The thick red line denotes the location
 parameter, the thin red lines the 6 and 40-yr return times. The July 2021 observation is
 highlighted with the magenta box. Right: Return time plots for the climate of 2021 (red) and a
 climate with GMST 1.2 ºC cooler (blue). The past observations are shown twice: once scaled
 up to the current climate and once shifted down to the 1.2 ºC cooler climate of the late nineteenth
 century. The magenta line shows the magnitude of the 2021 event analysed here. No
 information from 2021 is included to obtain the fit.

 Page 18 of 51
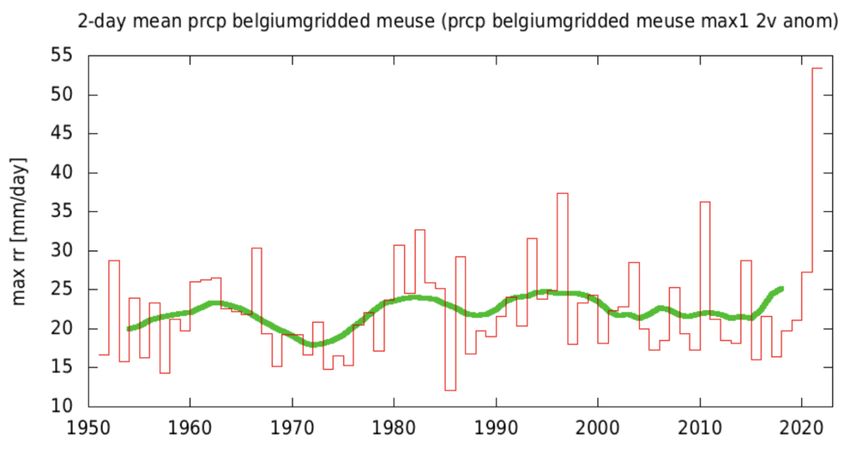
Rapid attribution of heavy rainfall events in Western Europe July 2021

3.2 Belgian part of Meuse catchment upstream of Eijsden

Over the eastern Belgian part of the Meuse catchment, precipitation accumulation locally reached
values up to more than 270 mm/3-day.
The analysis of the two-day precipitation spatially-averaged over this part of the Meuse catchment using
the Belgian gridded dataset indicates a value for RX2day of 53 mm/day for 2021 (see Figure 9) with a
corresponding return period of about 1000 years (95% CI 200 to 1.2E+05 years, see Figure 10).
Similarly to the observational data analysis for the Ahr/Erft region, it is not possible to base a confident
statement about the existence or lack of a trend in RX2day for this region on the available observational
data, as natural variability is too high compared to the signal on this small scale (see discussion within
Section 3.1). Thus, the fit does not indicate a significant change visible over natural variability, with a
probability ratio of 0.90 (95% CI 0.17 to 6.27) and a change in intensity of -1.6% (95% CI -20% to
29%). As for the Ahr/Erft catchment the GEV fit does not include the event itself as the area was chosen
as having an extreme event. The conclusions from this analysis of the Belgian gridded dataset fully
agree with a similar analysis using the enhanced E-OBS data including additional observations as
described in Section 2.

Figure 9: As Fig. 7 but for the gridded Belgian RX2day (2-day average) dataset.

 Page 19 of 51
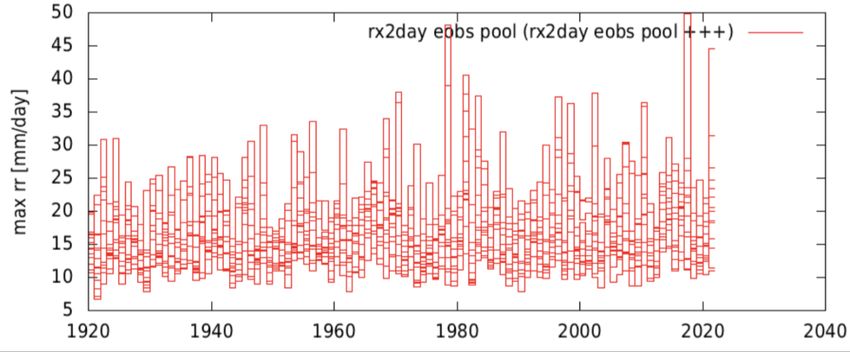
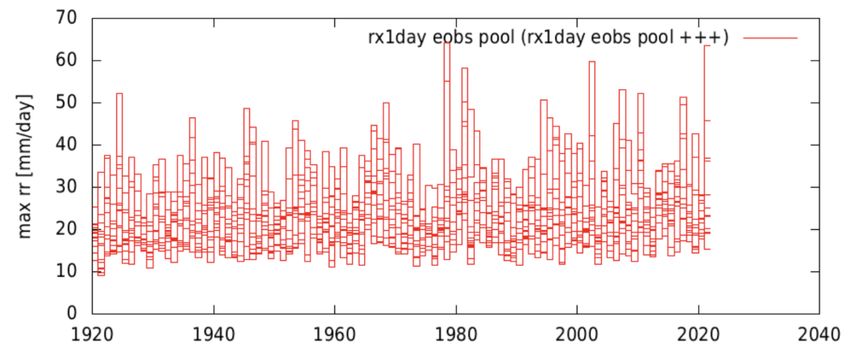
Rapid attribution of heavy rainfall events in Western Europe July 2021

Figure 10: As Fig. 8 but for the gridded Belgian RX2day dataset.

3.3 Pooling Region

The individual tiles in the Pooling Region are treated similarly to how several members of an ensemble
can be treated when analysing model simulations. The observational analysis indicates a value for
RX1day of 64 mm/day for the tile that observed the maximum precipitation within the summer months
of 2021 to date (see Figure 11). Fitting of a GEV distribution to the one year block maxima indicates
that the tail of the fit behaves differently from the rest (figure not shown here). Therefore, and as we
have sufficient data due to the pooling approach, we opt to analyse the extreme values using a block
size of 5 years7 instead of one year that was selected for the analysis of the Ahr/Erft region and for
Belgian Meuse catchment. That means we select and study the most extreme value within each tile for
every 5-year block. This choice is a compromise between looking further into the tail (larger blocks)
and retaining enough data points for a good fit (smaller blocks and therefore more data). The event year
was included in the fit, as we do not select the tiles based on the event, rather span a much wider region.
Figure 12 shows the GEV fit to the extreme values based on 5-year block maxima. The return period of
this event is about 400 years (95% CI 170 to 2500 years).
A return period of 400 years means that you would expect one event per tile per 400 years. That means
we would have more than one such event per 400 years in the larger European region (Pool). The fit
indicates that there is a significant change in the RX1day index, with a probability ratio of 7.7 (95% CI
2.0 to 52) and a change in intensity of 22% (95% CI 6.7 to 34%). Using other block lengths for the
block maxima does not affect the results much.

A similar analysis for RX2day (See bottom rows of Figure 11 and 12), with a value of 45 mm/day,
shows similar behavior. Using the 5-year block maxima for the pooled time series indicates a return
period of 300 years (95% CI 130 to 1200 years). Again, there is a significant trend towards heavier
precipitation, with a probability ratio of 5.9 (95% CI 1.6 to 12) and a change in intensity of 24% (95%
CI 7.7 to 30%).

7
 5-year block means here that only the highest value from a 5-year block is used.

 Page 20 of 51
Rapid attribution of heavy rainfall events in Western Europe July 2021

Figure 11: Apr-Sep maximum of the E-OBS RX1day (top) and RX2day (bottom) pooled time series
 showing 1-year block maxima for all 14 boxes. Source: E-OBS.

 Page 21 of 51
Rapid attribution of heavy rainfall events in Western Europe July 2021

Figure 12: Top: As Fig. 8 but for the pooled E-OBS RX1day dataset with 5-year blocks. Bottom, same
 but for RX2day. Source: E-OBS.

 Page 22 of 51
Rapid attribution of heavy rainfall events in Western Europe July 2021

4 Model evaluation
In this section we show the result of the model evaluation which is performed per region. The tables
show the model evaluation results. Any noteworthy detail or decision related to the evaluation are
incorporated in a 'comments' column.
The labels for the seasonal cycle are obtained by comparing the timing of the peaks in the seasonal
cycle of the daily time series. A similar check on whether the model spatial pattern resembles the
observed one has only been done if the spatial pattern was readily available (where this was not possible
as part of this rapid study we mark this with a “-” in the respective column). Several of the convection
permitting models (HCLIM38, UKMO-CPM2p2, WRF-EUR-11-EURO-CORDEX, WRF-ME-3km)
had only ~10 years of historical data available for the historical climate period (here defined as pre-
2030), which is insufficient to reliably calculate confidence intervals for the statistical fit parameters.
For these models, all data, including the future period, is used for evaluation and to specify the event
magnitude from the chosen return period. These models are marked with a star (*) in the evaluation
tables here and in the tables showing the results in Section 5. Only results for the present-to-future are
calculated for these events. For DWD-CCLM5-MIROC5 only results for the future have been used
because results for the past were likely based on a too short time series to achieve reliable results for
past changes.

Table 3: Evaluation of the model simulations for the Ahr and Erft.
Model (ensemble
members) / Spatial Shape
Observations Seasonal cycle pattern Dispersion parameter Conclusion

 0.277 0.0050
REGNIE, 1931- (0.234 ... 0.311) (-0.14 ... 0.13)

 0.306 0.12
ALARO-0 RCP4.5 (1) good - (0.247 ... 0.350) (-0.074 ... 0.25) good

 good, mean and 97.5
 percentile follow same 0.303 0.080
ALARO-0 RCP8.5 (1) pattern as observed - (0.241 ... 0.346) (-0.18 ... 0.21) good

DWD-CCLM5- 0.343 0.12
MIROC5 (1) good - (0.245 ... 0.419) (-0.086 ... 0.27) reasonable, high dispersion

 0.282 0.24 reasonable, seasonal cycle
EC-EARTH-KIT (1) reasonable - (0.212 ... 0.342) (-0.032 ... 0.40) and high shape parameter

 0.297 0.033
eurocordex (54) good good (0.288 ... 0.302) (0.012 ... 0.057) good

 0.271 0.11
HadGEM2-KIT (1) bad - (0.206 ... 0.316) (-0.15 ... 0.25) bad, seasonal cycle

 0.240 0.027
HCLIM38* (1) good - (0.167 ... 0.279) (-0.24 ... 0.25) good, future only

 0.228 0.22 reasonable, seasonal cycle
MPI-ESM-KIT (1) reasonable - (0.171 ... 0.282) (-0.022 ... 0.38) and low dispersion
 0.311 0.12
racmo (16) good good (0.300 ... 0.323) (0.078 ... 0.15) good

 0.241 0.13 reasonable, high shape,
UKMO-CPM2p2* (1) reasonable - (0.106 ... 0.320) (-0.12 ... 0.39) future only

WRF-EUR-11- 0.326 0.086 reasonable, seasonal cycle,
EURO-CORDEX* (1) reasonable - (0.239 ... 0.388) (-0.073 ... 0.25) future only

 Page 23 of 51
You can also read