Unicorns Analysis: An Estimation of Spotify's and Snapchat's
←
→
Page content transcription
If your browser does not render page correctly, please read the page content below
Unicorns Analysis:
An Estimation of Spotify’s and Snapchat’s
               Valuation

   Author:                                         Supervisors:
   Dimitri Bozovic                   Prof. Dr. Didier Sornette
                                         Dr. Spencer Wheatley

                         Master Thesis
     Department of Management, Technology and Economics
                 Chair of Entrepreneurial Risks

                         January 2017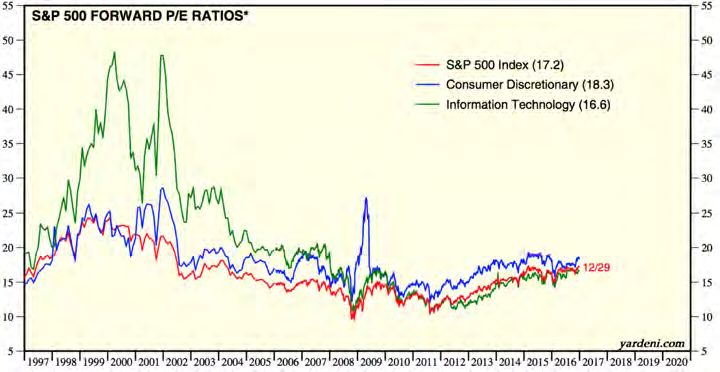
Acknowledgments

   I would like to express my gratitude to Prof. Dr. Didier Sornette for his patience while dis-
cussing topic ideas for this master thesis and for his help, comments and very helpful reviews along
the research process. I would also like to sincerely thank Dr. Spencer Wheatley with whom hours
were spent discussing this work, potential improvements and extensions, and whose support was
extremely valuable.

I would also like to thank my great roommates Colin and Balthasar for reviewing thoroughly this
work, Julian for giving interesting insights on Twitter’s valuation, Aless for the lessons in accounting
and finally my brother and sister, Gavrilo and Tamara, for their priceless criticisms and advises.

Finally, my profound gratitude goes to my mother, who reminded me every week that I had a
master thesis to work on, which I would have most probably forgotten without her.

                                                   1
Abstract

   The rise of smartphones and social media meant amongst others the boom of unicorns, name
given to the start-ups that are valued over $1 billion. A potential tech bubble, already called ”the
start-up bubble”, is firstly discussed indicating current overvaluations of unicorns. It is shown that
unicorns going public tend to be over-valued, but are also quickly sanctioned if revenue don’t fit
expectations. Facebook and Twitter are then analyzed, with the aim to illustrate two development
paths that can be considered as best and worst case scenarios of growths and product development.
Finally, Spotify’s and Snapchat’s cases are analyzed, based on the valuation methodology introduced
by Peter Cauwels and Didier Sornette [43]. We examine the conditions that they should fulfill, in
terms of revenue and profit margin, to fit their respective current valuations. The findings suggest
that Snapchat seems to have a bright future with an optimistic valuation that isn’t inconceivable.
Spotify’s case is more problematic considering the many barriers the company is facing on its way
towards profitability.

                                                  2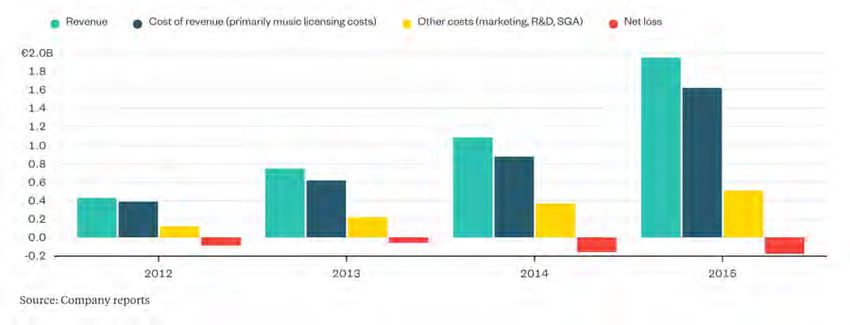
Contents

1 Introduction                                                                                             5

2 Context                                                                                                  8

3 User Growth Prediction Methods                                                                          13
  3.1   Logistic Function . . . . . . . . . . . . . . . . . . . . . . . . . . . . . . . . . . . . . .     13
  3.3   Internet Users Growth Analysis . . . . . . . . . . . . . . . . . . . . . . . . . . . . . .        18

4 Analysis of Grown-Up Unicorns                                                                           22
  4.1   Facebook And Twitter User Growths . . . . . . . . . . . . . . . . . . . . . . . . . . .           22
  4.2   Revenue . . . . . . . . . . . . . . . . . . . . . . . . . . . . . . . . . . . . . . . . . . .     29

5 Spotify                                                                                                 33
  5.1   Description . . . . . . . . . . . . . . . . . . . . . . . . . . . . . . . . . . . . . . . . .     33
  5.2   Financials and User Growth . . . . . . . . . . . . . . . . . . . . . . . . . . . . . . . .        34
  5.3   Valuation . . . . . . . . . . . . . . . . . . . . . . . . . . . . . . . . . . . . . . . . . .     39
  5.4   Conclusion    . . . . . . . . . . . . . . . . . . . . . . . . . . . . . . . . . . . . . . . . .   44

6 Snapchat                                                                                                46
  6.1   Description . . . . . . . . . . . . . . . . . . . . . . . . . . . . . . . . . . . . . . . . .     46
  6.2   User Growth . . . . . . . . . . . . . . . . . . . . . . . . . . . . . . . . . . . . . . . .       47
  6.3   Revenue . . . . . . . . . . . . . . . . . . . . . . . . . . . . . . . . . . . . . . . . . . .     49
  6.4   Valuation . . . . . . . . . . . . . . . . . . . . . . . . . . . . . . . . . . . . . . . . . .     53

7 Conclusion                                                                                              56

                                                    3
CONTENTS 4
Acronyms and Vocabulary
• DCF: Discounted Cash Flow
• NPV: Net Present Value
• Start-up: Private company whose main characteristic is to scale very quickly[27].
• Unicorn: Private company - or in this case, start-up - valued at more than $1 billion[31].
• P/E ratio: Price of a share divided by earnings it brings
• EBIT: Earnings Before Interest and Taxes
• EBITDA: Earnings Before Interest, Taxes, Depreciation and Amortization
• MAU: Monthly Active Users. Key metric for social medias representing the total of users
active at least once a month on a certain service.
• DAU: Daily Active Users, the number of unique visitors in 24 hours.
• DAU/MAU: Ratio used to measure the frequency of use of an app or website. A DAU/MAU
of 50% means that an average user visits the platform 15 days a month.
• IPO: Initial Public Offering
• Q1,Q2,Q3,Q4: First, second, third or fourth quarter (respectively, end of March, June, Septem-
ber, December of a certain year)
• ARPU: Average Revenue Per UserChapter 1
Introduction
The goal of this thesis is to analyze and discuss the valuations of Snapchat and Spotify. They are
taken as examples of growing unicorns having a high assumed market value. Their upcoming IPOs
makes such analyses required. Rumors and news about valuations can be found daily basis in main
tech media, but are too rarely discussed in depth. Different valuation techniques are first introduced
and the Discounted Cash Flow method explained. This method is used for the valuation calculations.
The current technological context is then described and discussed with a specific focus on the current
practices in the valuations of companies. The analysis of the current financial context should be
pushed much further in order to have definite conclusions on the existence of a bubble for instance.
However, the different financial ratios analyzed for related companies (such as Facebook, Twitter,
Linkedin or Renren) give a snapshot of the financial context in which unicorns are developing. Com-
panies such as the ones quoted previously are examples of grown-up unicorns. Their valuations are
examined, outlining the role and importance of expectations.
The logistic function used to describe diverse growing populations is then explained and detailed.
The growth of Internet users is modeled to assess the growth of big social media players. Facebook
and Twitter are then analyzed. As examples of diametrically opposed user growths, they inform the
analysis methodology of currently growing unicorns. Although many factors explain the evolution, a
hypothesis that is brought forward in this thesis, is that technological improvement of the product is
probably the main growth driver. Furthermore, the ARPU for each company are analyzed. Despite
very different users’ growth, the revenues of both companies have been evolving exponentially for
the last years, suggesting a decoupling between the growths of revenue and users.
Finally, valuations for Spotify and Snapchat are assessed. Instead of giving exact figures, their
5CHAPTER 1. INTRODUCTION 6
future value on the stock market is discussed, based on their current valuations and on their po-
tential performances. For both companies, user growth scenarios are calculated. Assumptions are
made to predict their future revenue and profit margin needed for reasonable cash flows.
1.1 Valuation Methods
Fernandez classified the companies valuation methods into four main categories [18]:
1. Balance Sheet: the company’s value is determined by analyzing the value of its assets. This is
irrelevant when it comes to valuing unicorns such as Facebook, because it gives a static value
of the current assets belonging to the company.
2. Income Statement-based methods: based on analyzing the size of the sales, earnings or other
indicators of a company. They help comparing easily companies with each other and are
relevant when it comes to valuing internet-related unicorns. They will be used to compare
unicorns that became publicly traded companies.
3. Goodwill-based methods: methods valuing intangible assets such as quality of the customer
portfolio, brands or strategic alliances, which isn’t relevant for emerging companies.
4. Cash Flow discounting-based methods: methods aiming at determining the company’s value
by predicting the future cashflows and discounting them to determine the present value. As
Fernandez states, cash flow discounting methods are nowadays mostly used because they are
”the only conceptually correct valuation methods. In these methods, the company is viewed
as a cash flow generator and the companys value is obtained by calculating these flows present
value using a suitable discount rate.”
Similar classifications have been determined by other scholars [17] [2]. Discounted cash flow meth-
ods, as part of the fourth category, have been determined as most relevant by many([57][18]) and
numerous variations of these have been discussed and described([37] [3] [5]).
To assess and discuss the value of Spotify and Snap Inc., a DCF methodology introduced by Peter
Cauwels and Didier Sornette [43] is firstly introduced and discussed. Facebook’s and Twitter’s cases
are then analyzed. Several examples of such fast growing user based companies exist. Learnings
from Facebook’s and Twitter’s analyses provide valuable elements for discussing the assumptions
made for future valuations.
1.2 Discounted Cash Flow (DCF) Method
The valuations in this thesis will be assessed by the Discounted Cash Flow (DCF) technique. It is
aimed here to highlight its key assumptions that one should bear in mind while seeing the valuationsCHAPTER 1. INTRODUCTION 7
obtained with this method. The goal is to calculate the present value difference between the future
cash inflows and the future cash outflows. Future cash flows are discounted with a discount rate, in
order to take into account the time value of money (assumption that money made in 10 years has
less value than money that will be made in one year)[25]. An important assumption of this method
is that the company is depicted by its cash flows only and no other parameter is taken into account.
This assumption is critical in the case of unicorns’ valuation because it translates the expectations
into hard facts.
The formula for the DCF is given by:
T
X CFt
DCF = (1.1)
t=1
1 + rt
where CFt is the cashflow computed for each period t and r the discount rate. The time horizon
is an important factor influencing the valuation calculated. As executed in [43], to be on the high
side, a fifty years time frame will be taken into account, meaning that the cash flows for the fifty
next years will be calculated and discounted. Furthermore, it is generously assumed that the real
interest rates are essentially null for these future years. Those assumptions simplify the procedure
and push the valuations to the high side.
Finally, the discount factor is the last main variable of the method. Fernandez [19] determined
in 2011 that the equity risk premium, over a large study, averaged around 5%. Valuations for a
larger range of discount factors will be calculated and 5% will be used as a benchmark.Chapter 2
Context
In 1995, as Netscape went public, the valuation of the initial public offerings (IPOs) started to be
questioned. Until then, most companies had to exhibit proven earnings and a certain experience of
operations. Netscape didn’t and its valuation was based solely on future expectations. As a result,
the company, that had one tenth of the earnings that Microsoft had when it went public in 1986,
saw its shares boom from twenty-eight dollars per share to seventy-one dollars [24].
It would require an entire thesis to list the similarities and differences between the current tech-
nological era and the Dot-Com bubble and to draw conclusions on whether we’re seeing a bubble
or not. Nevertheless, discussing similarities is needed, to inform the overall companies’ valuation
process. Here, the goal isn’t to draw a conclusion on whether there is a proper Tech Bubble or not.
It is rather to analyze the current big financial picture as the context of the future IPOS.
To begin with, there is a technological incremental step happening. The rise of smartphones and the
evolution into the Web 2.0, allowed many start-ups to grow based on the users contributions[23]. The
magnitude will most certainly be lesser than the outreach of the Internet, but it can be considered
as a major milestone in the Internet’s history. According to David Einhorn, a famous hedge-fund
manager at Greenlight Capital, there is a clear consensus that we are witnessing our second tech
bubble in 15 years [49]. What is uncertain is how much further the bubble can expand, and what
might pop it. There are many factors at play.
Start-ups aren’t limited to Internet, but Internet facilitated scalability and therefore quick growths.
Valuations are much more reasonable and rational now than they were during the dot-com bubble,
according to a chief strategist [47], but analysts suggest they are moving closer to bubbly levels: in
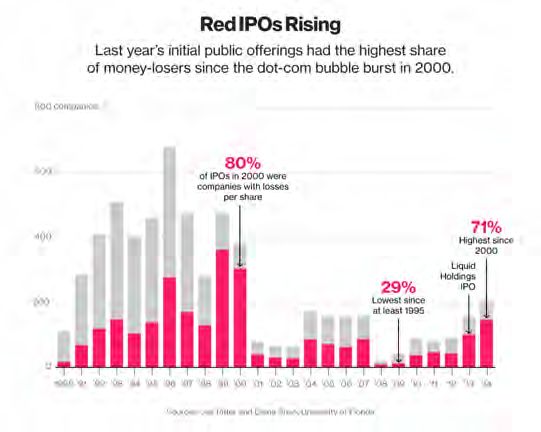
the first quarter of 2014, 83% of the companies that went public were not profitable. As a matter of
comparison, there were 84% of the newly created IPOS that weren’t profitable in the first quarter
8CHAPTER 2. CONTEXT 9
Figure 2.1: The share of money-losing IPOS is rising. The
amount of companies makes it hard to make conclusions
since it is still far from 2000’s levels, but it is a sign.
Source: https://assets.bwbx.io/images/users/iqjWHBFdfxIU/
iZe2v74tre6E/v3/-1x-1.jpg
of 2000, at the peak of the dot com bubble [48]. Figure 2.1 presents the evolution of this share
calculated on a yearly basis.
P/E Ratio
The P/E Ratio (also called PER) is obtained by dividing a company’s equity value by its annual net
income [18]. It is an important indicator of the stock market and also more specifically to evaluate
a company’s valuation (established by the market) against its actual earnings. A high P/E ratio
means that the price of the share is high compared to the earnings it brings.
The evolution of P/E ratios, as represented on Figure 2.2 doesn’t show any behavior similar to
what happened during the Dot-Com bubble. Nevertheless, this bubble would concern companies
within a tighter scope than ”Information Technology”. If we therefore analyze selected companies
(Figure 2.3), a different behavior can be observed. This isn’t an exhaustive list, but a sample of
companies with user-generated content. The P/E analysis for this specific category of companies
helps mapping the context in which Spotify and Snapchat will enter and gives insights about what
can be excepted for their IPO.CHAPTER 2. CONTEXT 10
Figure 2.2: P/E Ratios over Time for different sectors [58]. The IT sector overall
doesn’t show any behavior close to what has been experienced during the Dot-
Com bubble.
P/E Ratio
3000
FB
TW
2500 Li
Ren
Google
Amazon
2000 Netflix
eBay
1500
1000
P/E Ratio
500
0
-500
-1000
-1500
1998 2000 2002 2004 2006 2008 2010 2012 2014 2016 2018
Timeline
Figure 2.3: P/E Ratio Calculated for selected Tech Companies. It is notable
that companies such as Amazon or Netflix experience high variance in their PE
ratio after a long period of stability [58].
Revenue Multiple
Another interesting ratio is the Price to Sales ratio (also called sales or revenue multiple). The goal
here is to calculate the factor by which sales are multiplied to get the valuation or by which theCHAPTER 2. CONTEXT 11
annual revenue is multiplied to get the market capitalization. This gives an idea of the value given
to each dollar of revenue [28]. Therefore, a high sales multiple means that a very high value is given
to the sales made, meaning either that it is over-valued or that there are very high expectations in
the growth of sales.
Revenue Multiple
60
Facebook
Twitter
Renren
Linkedin
50
Google
Amazon
Netflix
eBay
40
Revenue Multiple
30
20
10
0
2011 2012 2013 2014 2015
Timeline
Figure 2.4: Revenue multiple calculated for selected Tech Companies. There is a
clear difference between the first four group of social media companies (Facebook,
Twitter, RenRen and LinkedIn) and the other ”older” IT companies
In Figure 2.4, it is interesting to see how such a simple indicator can give information about the
valuation. The first interesting observation is how the social medias (namely Facebook, Twitter,
Renren and LinkedIn) have a revenue multiple much larger than other confirmed internet-oriented
companies (Google, Amazon, eBay and Netflix). Twitter even reached a near 60X multiple in 2013.
Although high expectations were put in those companies, Twitter and LinkedIn came back to ”nor-
mal”. Renren’s large revenue multiple in 2015 is due to a decrease in revenue (compared to what
was expected) that hasn’t been reflected in the valuation. It came down to a 10X in 2016.
The main explanation to this is: expectations. Indeed, if the revenue is expected to be multi-
plied by α and the valuation stays the same, the revenue multiple is to be divided by α. [56]. Here
is the key point of this master thesis: are the expectations valid or not? It is clear here that hopes
put in Twitter in 2013 were disproportionate considering its results afterwards. Twitter’s revenuesCHAPTER 2. CONTEXT 12 increased but its revenue multiple dropped because its valuation decreased. This is also why Google’s, Amazon’s and eBay’s revenue multiples are lower, because those are companies that proved to be profitable. There is of course hope for growth, but it is smaller than the one put in current tech unicorns, especially social media companies. Another important factor is the companies’ maturity. More historical data are now available for their valuation, unlike social media channels that are rather new and which future isn’t clear. This phenomenon was of utmost importance during the Dot-Com bubble, where the lack of hind- sight led to surrealistic expectations for companies having a ”Dot Com” in their name. We can nevertheless observe a key difference with the Dot-Com bubble. The revenue multiple of Twitter and LinkedIn went back to ”normal” in 2015. This shows that market may put unreasonable hopes in companies but is also able to correct very quickly. Twitter’s revenue multiple has been corrected in 2015 as soon as it showed signs of decreasing growth of users. As a conclusion, markets tend to over-estimate current tech companies, especially social media players. The P/E ratios calculated for selected companies seem to indicate that there may be a bubble around such companies. Although they may be over-valuated at start, if future growth looks promising, their valuation is corrected when the growth rates decline. This indicates that Snapchat and Spotify will probably get high expectations and therefore high valuation. Nevertheless, their future quarterly reports may very quickly correct those valuations if growth expectations aren’t met.
Chapter 3

User Growth Prediction Methods

Predicting the growth of users will be of utmost importance to calculate a reasonable net present
value for a given company. Different techniques can of course be used to achieve this. The logistic
function or S-shaped curves have been widely used to describe growth of various phenomena, such
as sells of of telephones, tractors or chemical products but also in biological sciences to analyze the
growth of different living organisms[36]. As it will shown with the numerous examples analyzed,
this function is adapted to the start-ups analyzed here. This chapter explores the characteristics of
this function, its advantages and its limitations.

3.1        Logistic Function
Discussing the logistic function is important to understand the model used to approximate the
evolution of users. Sigmoid functions (because of its singular ”S” shape), or logistic function 1 , is
typically written:
                                                                     L
                                                 f (x) =                                          (3.1)
                                                           1+    e−k(x−x0 )
This equation describes a standard logistic function. With respect to the model used for population
growths, f (x) is replaced by P (t), that stands for the population over time. L is replaced by K, the
carrying capacity and Kk replaced by r the initial growth rate:

                                                                K
                                                 P (t) =                                          (3.2)
                                                           1 + e−r(t−t0 )

Defining P (0) = P0 :
                                                                 K
                                                     ert0 =         −1                            (3.3)
                                                                 P0
  1 The   different terminologies will be used indifferently.

                                                                13
CHAPTER 3. USER GROWTH PREDICTION METHODS 14
Replacing this in (3.2) gives:
KP0 ert
P (t) = (3.4)
K + P0 (ert − 1)
Where:
P (t) = The population over time (also written N(t))
K = The curve’s maximum value or the Carrying Capacity in a real life example
r = The steepness of the curve or the initial growth rate
t = The time
The influence of these parameters is illustrated in Figure 3.1. Equation 3.4 will be used ex-
tensively throughout this thesis to approximate populations and by extension, the growth in users.
3.2 Discrete Growth Rate
The differential equation describing the relationship between the exponential discrete growth
rate and the population is given by:
dP 1 P
= r(1 − ) (3.5)
dt P K
As illustrated in Figure 3.2, the differential equation represents a linear function of the growth
rate as a function of the population. Initially, the growth rate equals r, which allows the initial
exponential growth of the logistic curve. The growth rate decreases then linearly zero, giving the
carrying capacity K.
3.2.1 Fitting Methods
Discrete Growth Rate Calibration
The first method to approximate the users evolution uses the discrete growth analysis, to deter-
mine K and r. The principle is rather easy. Having a set of data like the number of Facebook users
over time, we can then calculate the discrete exponential growth rate between each point:
ln( PPi−1
i
)
Rid = (3.6)
ti − ti−1
With a simple linear regression, the growth rates obtained with Equation 3.6 can be interpolated.
Detailed explanations can be found in [43]. In, Figure 3.3 the linear regression fitting the discrete
growth rate can be observed. In such an example, the carrying capacity is easily determined and isCHAPTER 3. USER GROWTH PREDICTION METHODS 15
Base case with K=10, P0=0.1 and r=0.2 Variations of K [0:10] with P0=1 and r=0.1
10 10
K=0
8 8 K=0.1
Population
Population
6 6
4 4
2 2
0 0
0 10 20 30 40 50 0 10 20 30 40 50
Timeline Timeline
Variations of r[0:1] with P0=1 and K=10 Variations of P0 [0:10] with r=0.2 and K=10
10 10
8 8
Population
Population
6 6
4 4
2 r=0 2 P=0
r=0.1 P=0.1
0 0
0 10 20 30 40 50 -50 0 50
Timeline Timeline
Figure 3.1: a)b)c)d) Influence of the parameters on the S-Curves shapes. The
carrying capacity has an impact on the amplitude. The initial growth rate
influences how quickly the carrying capacity will be achieved. Finally P0 shifts
the curve horizontally.
reached once the discrete growth rate equals to zero. Twitter’s complete analysis can be found in
subsection 4.1.
Once r and K has been determined, P0 can be found by rearranging terms in (3.4). The following
equation is obtained:
Pi K
P0,i = (3.7)
Pi (eri t − 1) − Keri
As such, by calculating the average of the discrete P0 obtained, a fit for P0 is determined. It will be
shown later on that this methodology has its limitations depending on the population data that is
fitted.CHAPTER 3. USER GROWTH PREDICTION METHODS 16
Base case with K=10 and r=0.2 Variations of K [0:10] with r=0.1
0.2 0.2
K=0
K=10
0.15 0.15
Growth Rate
Growth Rate
0.1 0.1
0.05 0.05
0 0
0 2 4 6 8 10 0 2 4 6 8 10
Population Population
Variations of r[0:1] with K=10
1
r=0
0.8 r=1
Growth Rate
0.6
0.4
0.2
0
0 2 4 6 8 10
Population
Figure 3.2: a)b)c) The analysis of the exponential discrete growth rate gives
good insights on whether the logistic curve will be a good fit or not. If the discrete
growth rate decreases linearly as a function of the population, the logistic curve
is most probably a great fit.
Function Optimization
Another straightforward method is to fit directly the logistic function to the observed population
data. This method is especially helpful when the discrete growth rate data is present too much noise
or is too limited to fit significantly a linear regression. The difference of outputs between the two
methods is shown in the population predictions, such as Figure 3.7.
Logistic Function Variations
The logistic function described previously is a simple function and a convenient way to approximate
growth behaviors influenced by a very large amount of factors. A simple improvement of the function
would be to let K grow as a function of time. This especially makes sense, in cases where population
is for example, using an app or social media channel. Firstly, because the overall population in theCHAPTER 3. USER GROWTH PREDICTION METHODS 17
Twitter: Discrete Growth Rate - Population
1.2
1
0.8
Discrete Growth Rate
0.6
0.4
0.2
0
-0.2
0 50 100 150 200 250 300 350
Population [M]
Figure 3.3: Discrete exponential growth rate as a function of Twitter’s population, in terms of MAU.
The discrete exponential growth rate is a linear function of the population: y = 0.96 − 3.04 · 10−9 · x.
r 8
Therefore, r = 0.96 and K = −3.04·10 −9 = 3.17 · 10
world is growing. Secondly, because the percentage of people using Internet grows as well. These
two arguments are illustrated in Facebook’s analysis in subsection 4.1. The rise of smartphones and
of people having access to Internet increases the amount of potential users. It then becomes obvious
that having a fixed carrying capacity would be a not realistic simplification. The question is then:
how does the carrying capacity grow? The choice of the function must be discussed and backed up
by strong hypotheses. A way to bypass this issue is to model the growth of the overall population
and normalize our concerned population. This way, instead of analyzing the growth of users, we
analyze the growth of the penetration (namely the percentage of the total potential population using
the product instead of the absolute number).CHAPTER 3. USER GROWTH PREDICTION METHODS 18
3.3 Internet Users Growth Analysis
Evaluating the growth of the overall Internet users is needed to account for the growing carrying
capacity of a certain service. This allows to analyze whether the user growth of a company observed
is due to an increasing penetration or simply related to more people having access to Internet.
Predicting the future number of Internet users is certainly not trivial because it is driven by multiple
factors and uncertainty (which is discussed hereunder). Nevertheless, this exercise will be used to
discuss the different fitting methods and models that will be used for predicting the unicorns’ users
evolution.
Internet Users Evolution
5 50
Internet Users
Discrete Growth Rate
4.5 45
4 40
3.5 35
Discrete Growth Rate [%]
Internet Users [B]
3 30
2.5 25
2 20
1.5 15
1 10
0.5 5
0 0
2000 2002 2004 2006 2008 2010 2012 2014 2016 2018
Timeline
Figure 3.4: Evolution of Internet users with exponen-
tial discrete growth rates computed. Data Source:
http://www.internetlivestats.com/internet-users/
3.3.1 Exponential Growth Rate Analysis
As Figure 3.5 shows, we apply the same methodology that was done for Figure 3.3. Again, the
regression isn’t accurate on the whole data sets and fits poorly the extreme points. Therefore, the
two first points are ignored and the regression is applied again. Different key aspects can be drawn
out of this simple manipulation, that will also be observed in other users predictions.
Firstly, the empirical points calculated don’t form a line, but rather a curve that tends to a horizontal
asymptote. A first argument to explain this is that the world population is growing. Which means
that the carrying capacity, or in other words, the maximum amount of people that could potentially
use Internet grows. Assuming that the carrying capacity is fixed and equals K is certainly simplistic.CHAPTER 3. USER GROWTH PREDICTION METHODS 19
Internet Users: Discrete Growth rate vs population
0.3
Empirical Data
All Data
2 First Data Ignored
0.25
0.2
Discrete Growth Rate 0.15
0.1
0.05
0
0 0.5 1 1.5 2 2.5 3 3.5
Population ×10 9
Figure 3.5: Evolution of Internet users. Ignoring first data
helps fitting latest points. All data: r = 0.21, K = 4.6 · 109 ,
Two first data ignored: r = 0.18, K = 5.5 · 109
As described previously, to tackle this issue we can either use another logistic function (by al-
lowing K to grow) or normalize the data by, in this case, dividing by the world population over
time. Nevertheless, the different methods provide a similar fit, as shown in Figure 3.7.
Although the idea of normalizing the data should provide a better fit by allowing a growing carrying
capacity, it doesn’t entirely explain the shape of the discrete growth rate’s graph. Indeed, Figure 3.6
looks very similar to one showing the population not normalized (Figure 3.5).
Many other factors can explain why the curve flattens. A hypothesis brought in this thesis and
that will be emphasized with the example of Facebook and Twitter, is the technological evolution.
Indeed, the Internet was not fifteen years ago the same as it is now. It evolved from a tool for a
niche of scientists to become something of an everyday one-stop-shop for virtually everything. The
technological evolution is a key element, because if internet hadn’t evolved and had remained as
basic as it was at the beginning, the various uses observed nowadays, in particular the social media,
would most certainly not have emerged. It kept evolving, becoming easier to use, more user friendly
and also more useful. The positive feedback loop generated by the network effect has of course a
big role in this, in the sense that the more people are using it, the more value it has.
Another important factor is the heterogeneity of the population. Indeed, when Internet started,
the whole world wasn’t ready to adopt it. While the European and North American markets are
soon to be saturated [52], Africa’s users start growing with the rise of smartphones. This can be
assimilated to a whole new population that can become potential Internet users, which wasn’t theCHAPTER 3. USER GROWTH PREDICTION METHODS 20
Internet Users: Discrete Growth rate vs population
0.3
Empirical Data
All Data
2 First Data Ignored
0.25
0.2
Discrete Growth Rate
0.15
0.1
0.05
0
0 0.05 0.1 0.15 0.2 0.25 0.3 0.35 0.4 0.45 0.5
Penetration
Figure 3.6: Discrete growth rate as a function of the normalized population
penetration. Normalizing the data doesn’t explain the plateau that the curve is
forming. All data: r = 0.2; K = 0.59, Two first data ignored: r = 0.17; K = 0.7
case 10 years ago. Nevertheless, as it will be shown by the example of Facebook, taking into account
the heterogeneity of growths for different regions doesn’t necessarily increase the precision of the
model fit.CHAPTER 3. USER GROWTH PREDICTION METHODS 21
9 Internet Users: Overall Population Evolution and Approximations
×10
6
5
4
Population
3
2
1 Empirical Data
Standard Logistic Function, r and K calculated through growth rate
Logistic Function with K exp, r and K calculated through growth rate
Logistic Function on Normalised Population, r and K calculated through growth rate
Logistic Function Fit on Data
Logistic Function Fit on Normalised Data
0
2000 2005 2010 2015 2020 2025 2030
Time
Figure 3.7: Illustration of the fitting difference with different assump-
tions. Allowing K to grow exponentially doesn’t show an improvement.
On the other hand, getting r and K for the internet penetration and
then multiplying it by the world population smoothens the curve. Op-
timizing Logistic Function denotes the fit of the logistic function on
the data, without calculating r and K by analyzing the discrete growth
rate in the first place. The difference is minimal. All the R-Square
obtained are > 0.99.Chapter 4
Analysis of Grown-Up Unicorns
One problem Cauwels and Sornette faced in their work [43] was the lack of comparison for discussing
Facebook’s future income. In 2011, Facebook was a one-of-a-kind type of company. Nowadays,
many companies followed similar paths. Here, we will use Facebook and Twitter, a similar company
maturity-wise, to base hypothesis for examining Snapchat and Spotify. LinkedIn’s revenue is also
discussed. Nevertheless, no valuation will be made here. Valuing these two now big companies with
a rather simple methodology like the one we are using is certainly too ambitious. Facebook’s value
is for instance not only dependent on its users, but also on Instagram’s user base and future sales
of Oculus Rift (a virtual reality company acquired by Facebook in 2014 [60]). But analyzing the
evolution of their user bases and ARPU will help take right assumptions concerning Spotify and
Snapchat’s evolution. This analysis shows two very different user evolution, but highlights a trend
in the revenue growth.
4.1 Facebook And Twitter User Growths
In this section,the in depth analysis Facebook and Twitter will be detailed. The two companies
exhibit two extremes: in the first case, an example of a perfect growth and it the second case, an
example of a predictably limited growth.
4.1.1 Facebook
Facebook allows people to interact with friends and other people,to share pictures, thoughts, articles
or videos. It was, in 2016, the most popular social media worldwide, in term of MAU [16]. In 2011,
Facebook was becoming the number one social media on the Internet. Back then, the discrete growth
rate plotted with respect to the population appeared linear (see 4.1). Different aspects weren’t taken
into account, that made the projections made back then wrong:
22CHAPTER 4. ANALYSIS OF GROWN-UP UNICORNS 23 • 1. The growth of Internet users • 2. The popularization of smartphones • 3. Facebook’s technological improvements, increasing the target market The growth of Internet users is important especially for a social media such as Facebook. Its penetration within Internet users is nowadays massive (about 35%) making the overall growth of Internet users particularly significant and of utmost importance in order for describing its evolution. Secondly, the popularization of smartphones gave a big push to Facebook’s growth. It is on one hand linked to the general growth of internet users, because it provided whole new populations with a connection. The growth in smartphone use and mobile computing made in turn Facebook easier and more convenient to use, unrestricted to laptops and desktop computers. Interestingly, the pattern of Facebook’s growth started to diverge from the logistic function around 2011, influenced by the two reasons invoked earlier. Instead of heading towards zero, (as it had to be expected), it progressively stabilized around a value of 10%. The growth of Internet users and the rise of smartphones should be covered by normalizing the population by the overall internet users. In Figure 4.2, we see that the prediction is better but still flawed. The last thing that should be accounted is Facebook’s product evolution. Indeed, as it evolves, it seduces more people. The Facebook of 2011 is not what it used to be in 2016. This change reflects in the multiple ways the social media is used (for instance to chat, read news or watch videos), which wasn’t the case years ago. It diversified to reach out to new segments of the population. This effect goes beyond the logistic curve. The case of Facebook outlines the importance of additional factors. Two of the three identified are quantifiable and proved to improve notably the prediction. The successful product evolution hasn’t been modeled here but probably contributes to the empirical values exceeding the adjusted prediction. The heterogeneous growth between the World regions has been examined as a potential additional factor informing Facebook’s growth1 . However, it appears that it doesn’t help to fit a logistic curve in a better way. Examining different regions separately shows that some regions have reached the saturation while others haven’t. A regional analysis could determine to what extent the penetration is tending and help fine tuning the curve and obtaining better fits. This goes beyond the spectrum of this master thesis, due to the lack of data for emerging unicorns. Finding Facebook’s optimal fit by analyzing each region in depth wouldn’t help predicting the user growth of emerging companies. 1 Facebook’s case is convenient because it provides a large data set to analyze
CHAPTER 4. ANALYSIS OF GROWN-UP UNICORNS                                                                                                                                                    24

      Facebook MonthyActive Users [M]                                               Facebook: Users Evolution
                                        2500                                                                                                               200
                                                                                                                          Monthly Active Users

                                                                                                                                                                 Discrete Growth Rate [%]
                                        2000                                                                              Discrete Growth Rate of MAU
                                                                                                                                                           150

                                        1500
                                                                                                                                                           100
                                        1000

                                                                                                                                                           50
                                                 500

                                                  0                                                                                                         0
                                                  2004      2006           2008            2010          2012         2014             2016              2018
                                                                                                  Timeline

                                                                 Discrete Growth Rate as a Function of the number of Users
                                                 200
                                                                                                                                  Empirical Data
                      Discrete Growth Rate [%]

                                                                                                                                  Model Fitted in 2011
                                                 150

                                                 100

                                                 50

                                                  0
                                                       0   200       400          600        800        1000       1200        1400       1600           1800
                                                                                        Monthly Active Users [M]

Figure 4.1: a) MAU and discrete growth rate evolution. b) Discrete growth rate fitted by a linear
regression in 2011. Facebook’s current situation is not even close to what was predicted in 2011 (red
curve on the second graph). Impressively, FB managed to maintain a user growth rate of about
10%.

4.1.2                                            Twitter
   Like Facebook, Twitter became a major social media. Twitter’s main characteristic is that it
provides a platform where people can share thoughts, pictures or articles and follow current trends
or hot news via the so-called hashtags. It’s major difference to FB is that it isn’t a real directory.
Sharing ideas is more important than sharing details about one’s personal life (celebrities taken
apart). Twitter’s user base evolution is diametrically opposed to Facebook’s and fits greatly the
logistic curve, without normalizing the population, as Figure 4.4 shows. Calculating a linear regres-
sion on the discrete growth rate works here perfectly, as the data fits the logistic curve, with discrete
growth rate forming a constantly decreasing line (linear regression: R2 = 0.89 and logistic curve
obtained: R2 = 0.99).
CHAPTER 4. ANALYSIS OF GROWN-UP UNICORNS 25
×10 9 Facebook: Prediction from 2011 on
2
1.8
1.6
1.4
1.2
Population
1
0.8
0.6
0.4
Empirical Data
0.2
Logistic Function on Normalised Users
Logistic Function on Overall Users
0
2000 2005 2010 2015 2020 2025 2030
Time
Figure 4.2: Facebook users evolution as it could be predicted in 2011.
Clearly, the simple logistic curve under-estimated Facebook’s potential.
Normalizing the population corrects the prediction, but still doesn’t give a
perfect fit, highlighting Facebook’s tremendous growth
In this case, taking into account the growth of Internet users helps retaining a plateau and not
having a decrease of users. Indeed, Twitter’s users curve clearly declines when normalized. How-
ever, it is difficult to know whether new users replace users leaving or if all the users simply stay
on the social media, with very few newcomers. A way to answer this question is to analyze Twit-
ter’s announcement: consider that each day there are millions of people that come to Twitter to
sign up for a new account or reactivate an existing account that has not been active in the last 30
days, as interestingly highlighted by the analyst Jan Dawson[11]. What may sound as an appealing
announcement is actually an unsatisfactory news for Twitter. That means that at least 90 M users
per quarter are new users or users coming back (in the statement, millions is written in the plural
form, meaning at least one million times ninety days). Knowing that in the last quarter, Twitter
added only four million MAU, that highlights that a lot of people are coming and leaving, showing
the difficulties Twitter faces in retaining its users. The central aspect to explain this behavior is
Twitter’s lack of improvement and competition. This is a strong hypothesis, but Twitter’s improve-
ments were minimal, while FB included major changes (video viewing, live filming).CHAPTER 4. ANALYSIS OF GROWN-UP UNICORNS 26
Facebook: Normalised Populations Facebook: Logistic Curves On Normalised Populations
100 3000
North America:Empirical Data North America:Empirical Data
North America:S-Curve North America:S-Curve
90 Europe:Empirical Data Europe:Empirical Data
Europe:S-Curve 2500 Europe:S-Curve
80 Asia-Pacific:Empirical Data Asia-Pacific:Empirical Data
Asia-Pacific:S-Curve Asia-Pacific:S-Curve
70
Penetration [%]
Rest of World:Empirical Data
Population [M]
2000 Rest of World:Empirical Data
Rest of World:S-Curve Rest of World:S-Curve
60 Total:Empirical Data Total:Empirical Data
Total:S-Curve Total:S-Curve
50 1500 Sum of Unnormalised Regions
40
1000
30
20
500
10
0 0
2000 2005 2010 2015 2020 2025 2030 2000 2005 2010 2015 2020 2025 2030
Time Time
Facebook: Overall Facebook Users Evolution and Approximation
3000
2500
Population [M]
2000
1500
1000
Empirical Data
500 Sum of regions, Normalisation
Sum of regions, no Normalisation
Normalisation over World Population
0
2000 2005 2010 2015 2020 2025 2030
Time
Figure 4.3: a) Logistic curve applied on normalized regional populations. b) Logistic curves obtained
in a) multiplied by the regional populations. c) Sum of the regional model fits. The regional analysis
doesn’t help improving the fitness. Applying the logistic curve on each region in order to take into
account the heterogeneity of diffusion doesn’t give a better match than fitting the overall data.CHAPTER 4. ANALYSIS OF GROWN-UP UNICORNS 27
Twitter: Discrete Growth Rate - Monthly Active Users
TwitterMonthy Active Users [M]
400 120
Discrete Growth Rate [%]
MAU
100
Discrete Growth Rate
300
80
200 60
40
100
20
0
0
2010 2011 2012 2013 2014 2015 2016 2017
Timeline
Twitter: Discrete Growth Rate - Population Twitter: Discrete Growth Rate - Penetration
1.5 1.5
Discrete Growth Rate
Discrete Growth Rate
1 1
0.5 0.5
0 0
-0.5 -0.5
0 50 100 150 200 250 300 350 0 0.02 0.04 0.06 0.08 0.1
Population [M] Population
Twitter: Overall Population Evolution and Approximations Twitter: Penetration Evolution and Approximations
400 0.1
0.08
300
Population [M]
Population
0.06
200
0.04
100
0.02
0 0
2000 2005 2010 2015 2020 2025 2030 2000 2005 2010 2015 2020 2025 2030
Time Time
Figure 4.4: Twitter’s user base evolution is completely different than Facebook’s.
By normalizing the population (graphs on the right), we even see the penetration
decreasing. In this case, the logistic function fits perfectly.
Competition is certainly a key factor. Twitter is a more specific social media than FB, that es-
pecially seduces journalists, while FB, as said previously, is a proper directory that can benefit wide
users’ groups. Facebook evolved to convince a huge range of people, from teenagers to elderly, from
housewives to politics. Facebook also copied Twitter by including the hashtags principle which can
be referred as Twitter’s trademark. Twitter’s lack of evolution can be hypothesized from Figure 4.5.
The predictions that could be done 3 years ago are still valid. The different regressions in the first
graph are extremely similar. The contrast between this graph and Facebook’s is striking: for Face-
book, the regression was evolving into a flatter and flatter line, which is not the case here. TheCHAPTER 4. ANALYSIS OF GROWN-UP UNICORNS 28
Twitter: Discrete Growth Rate of Normalised Population
120
2013
Discrete Growth Rate [%]
100 2013
2014
80 2014
2015
60 2015
2016
2016
40
Empirical Data
20
0
0 2 4 6 8 10 12
Penetration [%]
Twitter: Userbase Evolution
500
Empirical Data
2013: Normalisation
400 2013: No Normalisation
2014: Normalisation
2014: No Normalisation
Users [M]
300
2015: Normalisation
2015: No Normalisation
200 2016: Normalisation
2016: No Normalisation
100
0
2000 2005 2010 2015 2020 2025 2030
Timeline
Figure 4.5: a)Twitter’s discrete growth rate as a function of the popula-
tion forms a perfect line, which is a bad sign because it means that the
carrying capacity that could be predicted couple of years ago didn’t change.
r2013 = 0.78; K2013 = 13.2%; r2014 = 0.97; K2014 = 9.9%; r2015 = 0.97; K2015 =
9.9%; r2016 = 1.1; K2016 = 9.6% b) S-curves obtained from different points of
view in term of years. Taking the Internet users growth into account lead to too
optimistic predictions.
carrying capacity that could be predicted 3 years ago remains therefore unchanged.
This analysis of grown up unicorns suggests that targeted product evolution allows reaching out
to new market segments and drives growth. Furthermore, Twitter’s case indicates that if a product
doesn’t evolve much, the growth will slowly decrease until all the potential people are interested.
On the other hand, Facebook managed to improve its product to attract an ever growing part of the
population. Facebook turned from a social media made for students into a tool for everybody: 13%
of Facebook current North American users are over 60 years old [51]. Of course, not many products
can attract all kind of people. However, it is notable that the product was shaped in order to fitCHAPTER 4. ANALYSIS OF GROWN-UP UNICORNS 29
everybody. It became a very diversified tool that can be used in multiple ways. Twitter most likely
isn’t. This is therefore something that should be kept in mind while assessing the valuation of such
companies. To calculate a net present value, it is assumed that the product will remain the same.
Although clever improvements and diversification can increase the potential carrying capacity and
therefore the company’s value.
4.2 Revenue
Two important components are driving revenue in digital companies:
1. The user base.
2. The revenue per user or ARPU (Average Revenue Per User).
The user base evolution and characteristics have been described previously. ARPU is driven firstly,
by the monetization or how well the platform manages to sell advertisement slots to publishers.
Secondly, by the user engagement or in other words, the time spent by each user on the platform.
The main metric is for describing users is the number of MAU. Nevertheless, there is a large gap
between someone checking the platform ten minutes a month and ten minutes a day. In details, as
mentioned by Jan Dawson, an analyst, the formula for the revenue is [10]:
Revenue = U sers · T imeSpent · AdLoad · P riceP erAd (4.1)
Such in depth analysis goes beyond the boundaries of this thesis, especially because precise metrics
on time spent, ad load or price per ad are usually not publicly disclosed measures. However, these
three factors are included in the ARPU and it is necessary to be aware of these components while
discussing the evolution of the ARPU. After having given key elements of user base evolution, this
section will discuss the ARPU and compare how well Twitter, Facebook and LinkedIn do. It will
be concluded by a broader view on social media evolution.
ARPU
ARPU is an indicator easily calculated, especially for public companies. It is calculated by dividing
the quarterly (or yearly) revenue by the number of users (MAU generally) at the end of the period
accounted. LinkedIn has been included in the comparison, although its business model is fairly dif-
ferent. It primarily makes money by providing valuable information to recruiters[29]. Ad sales is a
secondary way of making money, unlike Facebook and Twitter. Nevertheless, it is worth mentioning
that all three companies follow similar trends. The main question is whether there is an overall
economical wave that pushes such businesses together or whether they are simply performing well at
the same time. This question is important to answer, because it will give an idea of what a growing
company (such as Snapchat or Spotify) can expect. In other words, will the company need to followCHAPTER 4. ANALYSIS OF GROWN-UP UNICORNS 30
the same path, or will it very quickly have an ARPU close to the other companies?
Comparison of Revenue in Function of Time, normalised by the last data available
1.2
Revenue divided by the current Revenue (Q3 2016)
1
0.8
0.6
0.4
0.2
Twitter
Facebook
Linkedin
0
2008 2009 2010 2011 2012 2013 2014 2015 2016 2017
Timeline
Figure 4.6: By plotting revenue over time of FB, Twitter
and LinkedIn and normalizing it by their current revenue,
one can observe their similar evolution although the three
companies are different and went public at a different times.
This could be a sign showing that there is an overall increas-
ing interest in social medias. The dashed lines represent the
period where the companies were private (before IPO).
In Figure 4.6, revenue normalized by the most recent revenue (Q3 2016) plotted over time for
the three companies shows similar behaviors. Time is fixed, but the three companies are in different
stages. LinkedIn went public in May 2011, Facebook one year later, in May 2012 and finally Twitter
went public in November 2013. Although these companies don’t have the same maturity, they’ve
experienced very similar evolution of revenue. For instance, all three of them were making about
40% of their current revenue in 2014. The analysis can be pushed further, by dividing by the revenue
at different times. Different evolution can be expected. In the case of Facebook, where the user
base grows linearly, an exponential evolution is observed. Twitter’s curve isn’t linear, due to its
decreasing growth of users. According to these two pieces of evidence, it is fair to say that the three
companies manage to increase their monetization steadily.
The results for Facebook, Twitter and LinkedIn are summarized in Figure 4.8. Before analyzing
these results more in depth, interesting observations can already be made at this stage. Firstly, all
companies have peaks, especially in Q4 for Facebook and Twitter, which is something common for
ad companies [12].
Secondly and most importantly, they seem to follow the same pattern. This is especially the caseCHAPTER 4. ANALYSIS OF GROWN-UP UNICORNS 31
ARPU Divided by Q4 ARPU of Different Years, as a Function of Time
ARPU divided by Q4 ARPU of different years
10 0
Twitter
Facebook
Linkedin
2011 2012 2013 2014 2015 2016
Timeline
Figure 4.7: ARPU divided by the last quarterly ARPU of different years (2011-
2016), plotted on a logscale. Twitter and Facebook both show an exponential
growth in ARPU, while having completely different growths.
Quarterly Revenue Per User Quarterly Revenue Per User, Normalised by the Last ARPU
4 1.2
3.5
1
3
Normalised ARPU
0.8
2.5
ARPU
2 0.6
1.5
0.4
1
Twitter 0.2 Twitter
0.5 Facebook Facebook
LinkedIn LinkedIn
0 0
2008 2010 2012 2014 2016 2018 2008 2010 2012 2014 2016 2018
Timeline Timeline
Figure 4.8: Current situation of the ARPU for Facebook, Twitter and LinkedIn. Although the three
companies are different and have different user bases, revenues follow the same tendency.
for Facebook and Twitter, whose curves look the same with the exception of a two years delay. Al-
though they look the same, the ARPU are driven in different ways. Facebook’s late growth remainedCHAPTER 4. ANALYSIS OF GROWN-UP UNICORNS 32 steady (or even increasing) because of Instagram’s contribution [21]. Indeed, from September 2015 on, Facebook’s latest huge acquisition started generating revenue at a growing pace. The problem is that Facebook is rather non-transparent with respect to Instagram’s share of revenue, it is therefore not possible to separate the two of them. Nevertheless, it is likely that Facebook’s ARPU’s growth in the last year and a half is linked to Instagram. Twitter on the other hand, managed, surprisingly, to grow its revenues at an impressive pace (considering its decreasing database). This means that it monetization is growing, considering its rather stagnant user engagement and decreasing user base [12]. Facebook and Twitter show promising growth of ARPU. Furthermore, this growth is probably not going to slow down in the foreseeable years. Indeed, if Facebook had an annual ARPU of $12, its ARPU for the second quarter of 2016 passed $50 for the North American market [9]. This means that there is potential growth possible in the other regions of the World.
Chapter 5

Spotify

5.1      Description
Spotify is a Swedish music streaming service launched in 2008 [54]. Spotify provides its users the
possibility to listen to songs from a large catalog by streaming them instead of buying them, which
represent a major switch in how music is consumed.

Spotify operates with a freemium business model, which is a new way of monetizing the music.
On one hand, one can use Spotify for free with many limitations - such as having advertisements,
not being able to choose freely the song to listen to, no ”offline streaming” etc. On the other hand,
for $10/month (price varies from country to country), the user can access the Premium tier, without
any limitations nor advertisements.

Spotify’s sources of revenue are mainly:

  1. Advertisement that non-paying users see

  2. Subscription paid by every Premium users ( $10/month)

Spotify is valued at $8.53 B after its last $1B raised in convertible debt [55]. This last round didn’t
technically change Spotify’s valuation but showed signs of an upcoming IPO because ”if Spotify
holds a public offering in the next year, TPG and Dragoneer will be able to convert the debt into
equity at a 20% discount to the share price of the public offering, according to two people briefed on
the deal” according to the Wall Street Journal, in March 2016 [34]. Furthermore ”after a year, that
discount increases by 2.5 percentage points every six months”, said the aforementioned sources. In
other words, the longer Spotify waits to go public, the cheaper it will be forced to sell its shares to
the last round’s investors. Many analysts think that the IPO will take place in the second semester
of 2017 [40].

                                                  33
CHAPTER 5. SPOTIFY 34 5.2 Financials and User Growth Before the evolution of Spotify’s user base, their financials must be analyzed in order to understand how valuable each kind of user is and therefore, what metric is most relevant to use. Figure 5.1 gives an overview of Spotify’s annual financial situation, from 2012 to 2015. While its revenue is growing rapidly, costs evolve at similar pace. To see how Spotify is planning to turn its business into a profitable one, revenue and then costs are analyzed further. Figure 5.1: Overview of Spotify’s financial situation. Spotify’s costs are above their revenues and it is not likely they will be able to reduce them in the foreseeable future [1]. 5.2.1 Revenue Figure 5.2 shows that approximately 90% of the revenue is generated by the 35% of premium users paying monthly fees. Two important things can be concluded at this stage. First, a disproportionate portion of Spotify’s revenue comes from premium users. Indeed, Spotify, earns roughly e85/year 1 per premium user and only roughly e2.5/year per free user. As a reference, Twitter has a yearly ARPU of about 10$/year. The ads shown in Spotify are very invasive. They are of course way dif- ferent than Facebook or Twitter that manage to target ads specifically to your taste and which are less interfering. Furthermore, Spotify is far from having a monopoly (unlike Facebook and Twitter in their own kind of service). Increasing the amount of advertisement could therefore easily push users to switch to a competing platform or way of listening to music. Considering this, it will be very challenging for Spotify to increase their ARPU through advertisement revenues. The second important key point is that, although its user base is growing steadily, Spotify has 1 As it is explained and calculated in section 5.3 concerning the valuation), it isn’t equal to the monthly rate (e10) times 12 because the monthly rate is different from country to country and because Spotify’s offers family deals and promotions that decrease this revenue
CHAPTER 5. SPOTIFY                                                                                                                                                                             35

                  Spotify: Freemium - Premium Users                                                                              Spotify: Subscription and Ads Revenue
            150                                            100                                                            2000                                           100

                                                                                                                                                                               Ad Revenue Compared to Total Revenue [%]
                              Freemium and Premium Users                                                                              Subscriptions
                              Premium Users                90                                                             1800        Ads                                90

                                                                 Percentage of Premium Users [%]
                              Portion of Paying Users                                                                                 Ads/Total Revenue
                                                           80                                                             1600                                           80

                                                                                                   Revenue in Euros [M]
                                                           70                                                             1400                                           70
            100
                                                           60                                                             1200                                           60
Users [M]

                                                           50                                                             1000                                           50

                                                           40                                                              800                                           40
             50
                                                           30                                                              600                                           30

                                                           20                                                              400                                           20

                                                           10                                                              200                                           10

              0                                            0                                                                 0                                           0
                  2013      2014       2015       2016                                                                                2012     2013       2014   2015
                               Timeline                                                                                                           Timeline

Figure 5.2: The rather steady share of premium users compared to freemium users is shown in the
left plot. On the right plot, the money earned from subscription and ads is shown. Spotify depends
on its minority of premium users for revenue and isn’t able to monetize efficiently the freemium
ones.

been unable to raise their percentage of paid users. Although it lately lately grew to surpass the
threshold of 30% of all users being premium, it isn’t an easy task for Spotify, for whom a premium
user is more valuable than a free user. It is impossible to speculate what part of the free users would
accept to pay if it were no longer possible to use it freely or if the ads became too invasive.

For those reasons, paying subscribers will be considered as the key metric for Spotify’s valuation,
because they are the key driver of Spotify’s revenue.

5.2.2               User growth
Data about Spotify’s premium subscribers are available from July 2010 to September 2016 and can
be found in the appendix 7. Unlike the MAU or the DAU, measuring the number of paying users
is very straightforward, which makes the data reasonably trustworthy. Although the data comes
directly from Spotify, cheating on this crucial data would have disastrous consequences for the com-
pany’s image with investors. Spotify obviously isn’t the same nowadays as it was six years ago and
the challenge here is to analyze what range of data will be taken into account. One way to do it
is to fit a logistic curve to all the points, and then delete the first points one by one by applying a
logistic fit and while analyzing the evolution of the R-Square.
        Considering Figure 5.3, it is clear that Spotify had different regimes. These purely statistical
observations can (and should) be backed up by evidence from Spotify’s evolution as a product. The
You can also read