BEHAVIORAL PATTERNS IN SMARTPHONE USAGE PREDICT BIG FIVE PERSONALITY TRAITS - PSYARXIV
←
→
Page content transcription
If your browser does not render page correctly, please read the page content below
Behavioral Patterns in Smartphone Usage Predict Big Five Personality
                                 Traits
    Clemens Stachl1 , Quay Au2 , Ramona Schoedel1 , Daniel Buschek3 , Sarah Theres Völkel3 , Tobias
  Schuwerk4 , Michelle Oldemeier1 , Theresa Ullmann2 , Heinrich Hussmann3 , Bernd Bischl2 , & Markus
                                               Bühner1
             1
               Department of Psychology, Methods and Assessment, Ludwig-Maximilians-Universität München
               2
                 Department of Statistics, Computational Statistics, Ludwig-Maximilians-Universität München
                          3
                            Media Informatics Group, Ludwig-Maximilians-Universität München
            4
              Department of Psychology, Developmental Psychology, Ludwig-Maximilians-Universität München
                      The understanding, quantification and evaluation of individual differences in behavior, feelings
                     and thoughts have always been central topics in psychological science. An enormous amount of
                     previous work on individual differences in behavior is exclusively based on data from self-report
                     questionnaires. To date, little is known about how individuals actually differ in their objectively
                     quantifiable behaviors and how differences in these behaviors relate to big five personality
                     traits. Technological advances in mobile computer and sensing technology have now created the
                     possiblity to automatically record large amounts of data about humans’ natural behavior. The
                     collection and analysis of these records makes it possible to analyze and quantify behavioral
                     differences at unprecedented scale and efficiency. In this study, we analyzed behavioral data
                     obtained from 743 participants in 30 consecutive days of smartphone sensing (25,347,089
                     logging-events). We computed variables (15,692) about individual behavior from five semantic
                     categories (communication & social behavior, music listening behavior, app usage behavior,
                     mobility, and general day- & nighttime activity). Using a machine learning approach (random
                     forest, elastic net), we show how these variables can be used to predict self-assessments of the
                     big five personality traits at the factor and facet level. Our results reveal distinct behavioral
                     patterns that proved to be differentially-predictive of big five personality traits. Overall, this
                     paper shows how a combination of rich behavioral data obtained with smartphone sensing and
                     the use of machine learning techniques can help to advance personality research and can inform
                     both practitioners and researchers about the different behavioral patterns of personality.

                     Keywords: mobile-sensing, smartphones, behavior, machine learning, interpretable machine
                     learning, big five personality, trait-prediction
                     Word count: 10,621

The systematic assessment and understanding of individual                tant behaviors and life outcomes such as job performance,
human differences in behavior and experience had already                 well-being, and mental health (Ozer & Benet-Martínez, 2006;
proved useful in first rudimentary tests in ancient China in             Paunonen & Ashton, 2001; Roberts, Kuncel, Shiner, Caspi,
2200 BC (Gregory, 2013). Over the time of millennia, this                & Goldberg, 2007; M. Ziegler et al., 2014). Big five person-
objective has led to the creation of multiple terminologies for          ality traits have also proven useful in many practical appli-
the exhaustive description of psychologically relevant individ-          cations such as the personalization of advertisements (Matz,
ual differences. However, only in the last few decades, the big          Kosinski, Nave, & Stillwell, 2017), the clinical assessment
five personality trait theory (Goldberg, 1990; McCrae & John,            of psychopathology (P. T. Costa & Widiger, 1994), and the
1992) has emerged as the most widely acknowledged taxon-                 selection of personnel (Barrick & Mount, 1991). As person-
omy in the field of psychological science (De Raad, 2000).               ality traits are thought to manifest themselves in behavior,
The big five taxonomy describes human personality on five                researchers have aimed to investigate which behaviors are
broad and relatively stable dimensions: emotional stability,             most indicative of individual personality trait levels. However,
extraversion, openness, conscientiousness, and agreeableness.            traditionally, it has proven difficult to collect valid data about
Furthermore, these dimensions consist of a larger number                 individual differences in human behavior without the use of
of underlying facets that describe more narrow aspects of                self-report questionnaires (Baumeister, Vohs, & Funder, 2007;
personality. The big five structure has been successfully repli-         Furr, 2009). Only recently, the increased availability of rich
cated across several cultures and contexts (Ching et al., 2014;          data about human behavior in the form of social network
P. Costa Jr, Terracciano, & McCrae, 2001). Moreover, it                  and website profiles has provided new perspectives for the
has been shown that personality traits are related to impor-             investigation of individual differences (Wilson, Gosling, &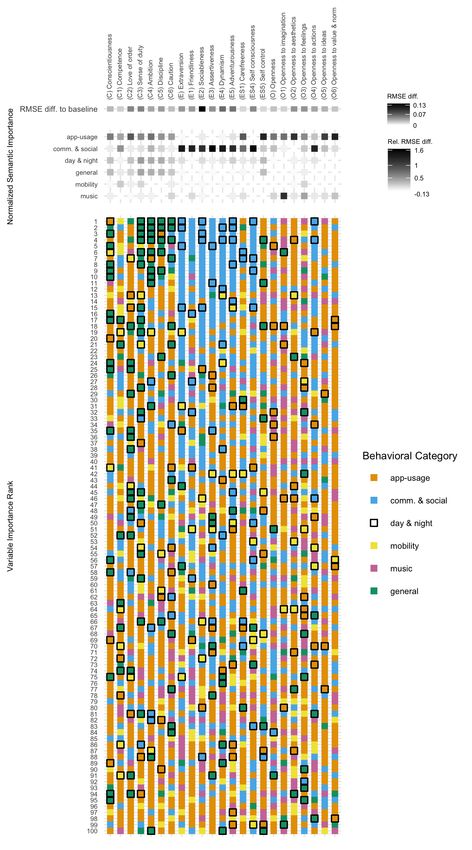
2                                                             STACHL ET AL.

Graham, 2012). In particular, these new data allow scientists         convenience and effectiveness, and has transformed mobile
to conduct research using larger datasets of higher quality           phones into highly personal devices. Thus, the capability to
and finer data-granularity (Mahmoodi, Leckelt, Zalk, Geukes,          collect data about these activities allows for the investigation
& Back, 2017). Using this potential, some researchers have            of systematic variations in human behaviors, feelings, and
demonstrated that online records of human behavior can be in-         preferences at unseen scale and with unprecedented precision
formative about intimate traits such as personality, sexual ori-      (Harari et al., 2016). In addition to the traceability of active
entation, and political attitudes (Gladstone, Matz, & Lemaire,        behaviors, sensors in smartphones also allow for the passive
2019; Kosinski, Stillwell, & Graepel, 2013; Park et al., 2015;        collection of situational data (e.g., environmental illumination
Schwartz et al., 2013; Youyou, Kosinski, & Stillwell, 2015).          and noise, GPS etc.), making them especially suited for the
See Azucar, Marengo, and Settanni (2018) for a recent review          investigation of individual differences in behavior across dif-
of personality prediction from social media data.                     ferent situations (Harari, Gosling, Wang, & Campbell, 2015).
                                                                      Finally, it can be assumed that behavioral data from smart-
However, beyond the usage of pre-existing data from social            phones have a high ecological validity because they can be
networks, it has been more difficult to investigate associations      collected automatically and unobtrusively in the field.
of personality and behavior and to make personality judg-
ments about people who do not provide much data online (e.g.,         Behavior and Personality. Only few studies have investi-
are inactive or not registered on social networks). As peoples’       gated how personality traits are manifested in smartphone
activity is shifting from traditional social network platforms        usage. Most of theses studies have primarily focused on
(e.g., Facebook) to mobile-first social networks (e.g., Insta-        associations of communication behavior with levels of big
gram, Anderson & Jiang, 2018), it is a logical and necessary          five personality traits. In that regard, extraversion was found
step to use mobile phones for the collection of behavioral data       to be positively related to the frequency and duration of calls,
(Miller, 2012; Wrzus & Mehl, 2015). The mobile phone has              the number and frequency of text messaging, the frequency
become the most popular device with global mobile cellular            and duration of conversations, and the frequency of commu-
subscription rates exceeding 70% and 100% (more subscrip-             nication app usage on smartphones (Chittaranjan, Blom, &
tions than people) in developed countries (Union, 2018). Pop-         Gatica-Perez, 2013; Harari et al., 2019; Montag et al., 2014,
ular due to their enormous versatility, modern smartphones            2015; Stachl et al., 2017).
can be used for listening to music, using social networks,            In addition to communication behavior, some of these studies
navigating new environments, shopping, photography, and of            have also investigated associations of big five personality
course communication. This channeling of behavior trough              traits with the usage of other applications (apps) (Chittaranjan
a single device has led to an enormous increase in personal           et al., 2013; Kim, Briley, & Ocepek, 2015; Stachl et al.,
                                                                      2017). Kim et al. (2015) found higher levels of self-reported
                                                                      conscientiousness to be negatively associated with the use of
   Clemens Stachl, Department of Psychology, Psychologi-              e-commerce related applications (e.g., shopping, banking). In
cal Methods and Assessment, Ludwig-Maximilians-Universität            their study, Chittaranjan et al. (2013) reported negative corre-
München; Quay Au, Department of Statistics, Computational             lations between extraversion scores and app usage related to
Statistics, Ludwig-Maximilians-Universität München; Ramona            gaming, web-browsing, and camera usage. Additionally, they
Schoedel, Department of Psychology, Psychological Meth-               found the usage of office-related applications to be positively
ods and Assessment, Ludwig-Maximilians-Universität München;           related to levels of extraversion. Furthermore, they reported a
Daniel Buschek, Media Informatics Group, Ludwig-Maximilians-          number of negative correlations between agreeableness and
Universität München; Sarah Theres Völkel, Media Informat-             the usage of office-, internet-, mail-, calendar-, and media
ics Group, Ludwig-Maximilians-Universität München; Tobias
                                                                      applications. Additionally, conscientiousness was found to be
Schuwerk, Department of Psychology, Developmental Psychol-
ogy, Ludwig-Maximilians-Universität München; Michelle Olde-
                                                                      negatively related to the usage of media applications. Finally,
meier, Department of Psychology, Psychological Methods and As-        emotional stability showed negative associations with apps
sessment, Ludwig-Maximilians-Universität München; Theresa Ull-        related to office activities. Stachl et al. (2017) found that
mann, Department of Statistics, Computational Statistics, Ludwig-     higher levels of conscientiousness were associated with a
Maximilians-Universität München; Heinrich Hussmann, Media In-         decreased usage of gaming applications. Furthermore, they
formatics Group, Ludwig-Maximilians-Universität München; Bernd        found that higher levels of agreeableness were associated with
Bischl, Department of Statistics, Computational Statistics, Ludwig-   increased usage of apps related to transportation. Finally, they
Maximilians-Universität München; Markus Bühner, Department            reported that on average, the usage of photography-related
of Psychology, Psychological Methods and Assessment, Ludwig-          applications was increased for people with higher scores in
Maximilians-Universität München                                       extraversion.
    Correspondence concerning this article should be addressed to
Clemens Stachl, Leopoldstr. 13, 80802 München, Germany, EU.           While most of these studies highlight the potential of
E-mail: clemens.stachl@psy.lmu.de                                     smartphone-sensing methods for research, their results are
BEHAVIORAL PATTERNS PREDICT PERSONALITY 3
also limited in generalizability as analyses have mostly been The Prediction of Personality. While digital footprints
performed on small samples without cross-validation. Fur- from social media data have successfully been used to predict
thermore, the mixed pattern of previous findings hints at previ- personality traits (Settanni, Azucar, & Marengo, 2018), only
ously reported differences between self-reported and actually few studies have started to consider the usage of data from
observed behaviors (Ellis, 2019; Gosling, John, Craik, & smartphones to achieve this goal (Chittaranjan et al., 2013;
Robins, 1998). To overcome these limitations, we aim to De Montjoye, Quoidbach, Robic, & Pentland, 2013; Møn-
include a broad range of behaviors which can nowadays be sted, Mollgaard, & Mathiesen, 2018; Schoedel et al., 2018).
sensed via smartphones. This approach builds on previous Earlier studies have reported relatively high performance in
studies which have reported on behavioral manifestations of the prediction of big five personality traits from smartphone
personality traits in various types of behavior (in non-digitized usage, despite limited data and rather small sample sizes
contexts). (Chittaranjan et al., 2013; De Montjoye et al., 2013). Later
studies reported larger sample sizes but lower predictive per-
Music preferences for example, have repeatedly been linked formances for both the big five personality dimensions (Møn-
to individual personality traits. Most importantly, the per- sted et al., 2018) and the personality dimension of sensation
sonality dimensions of extraversion and openness have been seeking (Schoedel et al., 2018). However, as demonstrated
repeatedly associated with preferences for specific types of by Mønsted et al. (2018), results of earlier works most likely
music. Langmeyer, Guglhör-Rudan, and Tarnai (2012) found have been overly optimistic, due to model over-fitting (Chit-
that on average, people with higher scores in extraversion pre- taranjan et al., 2013; De Montjoye et al., 2013). Mønsted et al.
fer conventional and energetic music. People scoring higher (2018) concluded that only the factor of extraversion could
on the dimension of openness were found to prefer more so- be reliably predicted from smartphone usage parameters. The
phisticated, complex-, non-conventional and classical music authors argued that this is related to phones being mainly
(Dunn, Ruyter, & Bouwhuis, 2012; Langmeyer et al., 2012; used for communication, which in turn, is related to extraver-
Nave et al., 2018). Beyond genre-based analyses, Green- sion (e.g., Montag et al., 2015). Although this logic seems
berg et al. (2016) loosely linked individuals’ preference for intuitive, we argue that the predictability of other personality
three musical attribute dimensions to individual personality dimensions might not have been fully evaluated, as Mønsted
traits. In addition to correlational results of earlier works, et al. (2018) almost exclusively used predictors related to
latest studies using machine learning suggest that personality individual communication behavior. First, smartphones can
trait scores can partially even be predicted from self-reported be used for various purposes and are therefore not limited
music preferences and Facebook likes (Nave et al., 2018). to making calls and sending messages. Second, according
Individual differences in personality have also been found to big five personality theory, personality should be reflected
with regard to the temporal distribution of behaviors through- in the broad spectrum of an individual’s behaviors (Funder,
out the day. In the field of sleep-research, scientists have inves- 2001). Hence, it is likely that the utilization of behavioral
tigated associations of various self-reported diurnal activities patterns across a range of activities will make it possible to
with levels of big five personality traits (Randler, Baumann, & predict other big five personality traits, besides extraversion.
Horzum, 2014). According to meta-analytical findings, con- This notion is also supported by a recent meta-analysis on
scientiousness has most robustly been related to a preference personality prediction from social media data, showing that
for morning activities (Tsaousis, 2010). Whereas Duggan, on average, a combination of different data types increased
Friedman, McDevitt, and Mednick (2014) found low emo- prediction performance in previous studies (Settanni et al.,
tional stability to be related to early wake-up times and poor 2018).
sleep quality, Randler et al. (2014) found extraversion to be
positively related to a preference for nightly activity. Taken together, few and inconclusive results from past re-
search motivate our efforts to more intensively explore the pos-
A relatively new area of research for the investigation of sibility of personality trait prediction from a wide range of ob-
individual differences is the analysis of data about individual jective behaviors, collected via smartphone-sensing. We first
mobility and physical activity. Although little research exists extract behavioral predictors from a wide range of daily behav-
about possible associations between personality traits and iors. Second, we use these variables to predict self-reported
individual mobility patterns (Mehrotra et al., 2017; Schoedel big five personality scores on factor and facet levels with
et al., 2018), affective states have been successfully linked a machine learning approach. During model-evaluation, we
to reduced physical activity and gyration (Lathia, Sandstrom, apply appropriate nested cross-validation procedures and com-
Mascolo, & Rentfrow, 2017; Saeb, Lattie, Schueller, Kord- pare the prediction performance of different models against
ing, & Mohr, 2016; Saeb et al., 2015). Differences in the a common guessing-baseline. Third, we inspect the most-
experience of negative affect in turn have been found to be promising machine learning models and investigate which
related to the personality dimensions of emotional stability patterns of behavior are most important for the prediction
and extraversion for a long time (P. T. Costa & McCrae, 1980). of each individual personality trait dimension. Finally, we4 STACHL ET AL.
discuss the influence of these variables with regard to previous study 2, participants were rewarded 25e to 35e, dependent
findings and highlight opportunities for further, confirmatory on their participation in the experience sampling scheme of
research. the study (see, Schuwerk et al., 2018). Additionally, the
participants could enter a lottery to win a smartphone (value
400e). In study 3, individualized personality and user activity
Method
feedback and optional course credit were provided to the
participants (Schoedel et al., 2018) as reimbursement. Similar
The dataset used in this study was composed of three dis- to study 2, participants could also enter a lottery to win 10 ×
tinct datasets, collected in three separate studies within the 50e.
context of the PhoneStudy research project at the Ludwig-
Maximilians-Universität München (LMU) (Stachl et al.,
2018). Although, small parts of the data have been used Self-Reported Personality Measures & Demographics
in other publications (Schoedel et al., 2018; Schuwerk, Kalte-
fleiter, Au, Hösl, & Stachl, 2018; Stachl et al., 2017), the
Big five personality dimensions were measured with the Ger-
joint dataset of common parameters has not been analyzed
man version of the Big Five Structure Inventory (BFSI) on
before. Procedures for all three studies have been approved
factor and facet level, via 30 subscales. The BFSI was used
by institutional review boards and have been conducted ac-
due to its good psychometric properties and relatively short
cording to EU-laws and ethical standards. See Table 1 for an
test-duration (Arendasy, 2009). The test consists of 300 items
overview of the included datasets. Although it is not possible
(adjectives and short phrases) and measures the Big Five per-
to provide the raw data files to the research community (due
sonality dimensions (emotional stability, extraversion, open-
to unsolved privacy implications), we provide the final dataset
ness to experience, conscientiousness, and agreeableness) on
of aggregated variables, the code for variable-extraction, pre-
five factors and 30 facets. Agreement to single items was
processing, predictive-modeling and a data dictionary, includ-
stated on a four-point Likert scale ranging from untypical
ing descriptions and additional explanations as additional
for me to rather untypical for me to rather typical for me
resources in the project’s repository (Stachl et al., 2019).
to typical for me. In contrast to more common personality
inventories such as the NEO-PI-R or the more current ver-
Participants sion NEO-PI-3 (McCrae, Costa, & Martin, 2005), the BFSI
uses adjectives and short statements and has been developed
We recruited a combined number of 743 participants from using item response theory rather than classical test theory.
the academic population at LMU, from forums, social media, The authors report psychometric benefits over other similar
blackboards, flyers, and direct recruitment in the streets of questionnaires due to conformity with the partial credit model
Munich, Germany, between September 2014 and January (Masters, 1982). In study 1, questionnaires were administered
2018. During the pre-processing of the data, the sample was via desktop computers. In study 2, questionnaires were ad-
reduced to 624 participants. First we excluded participants ministered two times, once via desktop computer and once
with less than 15 days of logging data (29). Furthermore, 39 via smartphone. In this study we used the lab version scores
participants that did not use any apps and 51 participants that from study 2. In study 3, all questionnaires were provided via
did not complete the necessary questionnaires were excluded smartphone to the participants. In all three studies identical
from further analysis. personality items and answer formats were used. Descriptive
statistics including confidence intervals of internal consisten-
The final sample consisted of 377 women, 243 men, and 4 cies for all scales are provided in Table 2.
participants that chose not to disclose their gender. The partic-
ipants average age was 23.56 (SD = 6.63). Furthermore, most In addition to the personality scores we collected age, gender,
of the participants (91%) had successfully completed A-levels and the level of completed education. Gender was recorded
and 20% reported a finished university degree. See Table 2 dichotomously, age was measured as the birth-date and later
and the project’s repository for more descriptive statistics. All converted to age in years. The level of education was subdi-
subjects participated willingly and gave consent prior to their vided in five categories from no education to compulsory edu-
participation in the study. The participants could withdraw cation to vocational training to A-levels to finished university
their participation at any time during the ongoing data collec- degree. Please note that for data from study 3, a sixth category
tion period. Additionally, they could demand the deletion of finished PhD/habilitation was re-coded into finished univer-
their data for as long as their re-identification was possible sity degree. In addition to measures used in this manuscript,
(during ongoing data collection). Dependent on the respective participants completed a number of other questionnaires that
study, different rewards for participation were provided to the were used for other research projects in the respective studies.
participants. In study 1, an individualized personality profile In the present study, we only included measures that had
and 30e or course credit (3h) for students were offered. In been collected across all studies and that were relevant for theBEHAVIORAL PATTERNS PREDICT PERSONALITY 5
Table 1
Datasets used in this study
Data Set N Collection Period Events References
Study 1 137 09/2014 - 08/2015 1,776,317 Stachl et al. (2017), Harari et al. (2019)
Study 2 242 08/2016 - 08/2017 4,236,022 Schuwerk et al. (2018)
Study 3 245 10/2017 - 01/2018 19,334,750 Schoedel et al. (2018)
Combined 624 09/2014 - 01/2018 25,347,089
Note. Overview of datasets used in this study. Events represent the total amount of logged
activities across all participants and days before variable extraction.
research question at hand. Although additional measures will at least once and naturalistic smartphone usage in the field
not be further described here, more information can be found was automatically recorded over a period of 30 days. In all
in the respective online-repositories and articles (Harari et al., three studies, the collected user data was regularly transferred
2019; Schoedel et al., 2018; Schuwerk et al., 2018; Stachl et to our server using SSL-encryption, during times participants
al., 2017). were connected to a wireless network. Data was stored in
encrypted form on the servers. In study 1, participants did
not have to complete any tasks during data collection in the
Behavioral Data from Mobile Sensing
field. In study 2, participants had to answer experience sam-
pling questionnaires during the data collection period on their
We used the PhoneStudy smartphone research app for the
smartphones (Schuwerk et al., 2018). Participants in study 3
Android mobile operating system to collect behavioral data
also had to complete the demographic and BFSI personality
from the participants’ privately owned smartphones. This app
questionnaires via smartphone at a convenient time (Schoedel
has been continuously developed at the Ludwig-Maximilians-
et al., 2018). In all three studies, participants were auto-
Universität München since September 2013, to effectively and
matically reminded to activate location services, in the case
unobtrusively record what people do with their phones, when,
they had turned them off. Finally, at the end of mobile data
where, and how. In contrast to traditional methods of be-
collection, participants were instructed to contact the research
havioral observation (e.g., lab-based behavioral observation),
staff in order to receive compensation (studies 1-3) and to
the usage of the PhoneStudy app enabled us to continuously
return for the final lab session (study 2). More details about
record a wide range of parameters related to participants’
the procedures of the respective studies are available in the
behavior, as they occurred in daily life. Initially, activities
respective research articles (Schoedel et al., 2018; Schuwerk
were recorded in the form of time-stamped logs of events.
et al., 2018; Stachl et al., 2017).
Those included events related to calling, messaging, GPS-
location, app starts/installations, screen de-/activations, flight
mode de-/activations, Bluetooth connections, booting events, Data Analysis
played music, battery charging status, photo and video events
(no actual photos or videos), and connection events to wire- The final data set consisted of 1821 predictor variables and 35
less networks (WiFi). Additionally, the character-length of (5 factors and 30 facets) personality criteria. Gender, age, and
messages and technical device characteristics were collected. education were solely used for descriptive statistics and were
Irreversibly hash-encoded versions of contacts and phone- not included as predictors in any of the models. Please note
numbers were collected in order to enable the distinction of that although it is not possible to provide the raw data files
contacts while preventing the possibility of re-identification. to the research community (due to unsolved privacy implica-
Information such as names, phone numbers and contents of tions), we provide the final dataset of aggregated variables,
messages, calls etc. were not recorded at any time. the syntax for variable-extraction, pre-processing, predictive-
modeling and a data dictionary, including descriptions and
additional explanations as supplementary files in the project’s
Procedures
osf-repository (Stachl et al., 2019).
Study procedures were somewhat different with regard to the Pre-Processing. Before the machine learning analysis, we
respective study (Schoedel et al., 2018; Schuwerk et al., 2018; applied a series of pre-processing steps with regard to the char-
Stachl et al., 2017). However, common to all three studies, acteristics of the specific data-types (e.g., location data, app-
big five personality trait levels were collected with the BFSI usage, communication etc.). For texting and calling behaviors,6 STACHL ET AL.
apparent logging-induced duplicate entries were removed to to songs that were listened to for more than 20 seconds and
increase the data quality (also see Harari et al., 2019). In songs with a speechiness value of less than 0.6. We imple-
order to create variables about categorical app-usage, we first mented these cutoffs to exclude skipped songs, audio-books,
enriched the app-usage data with additional parameters from and podcasts for more accurate parameter-estimation in the
the Google Play Store, using web-scraping (Google, 2019). consequent step of variable-extraction.
This additional data provided information about the type, the
For location data, we used the Google Elevation API (Google,
price and the popularity of an app. However, as the app-
2018) to assign levels of ground elevation to longitude-latitude
categories from the Google Play Store proved to be inaccurate
combinations.
for many apps (e.g., “dating” apps being labeled as “lifestyle”
apps) and because some apps used by our participants were Finally, after the completion of this first step of pre-processing,
not available in the Google Play Store, we manually assigned the complete set of predictor variables was extracted from
each app to new, semantic categories. This was done in an iter- the raw dataset (see subsection Variable Extraction). In this
ative fashion and was cross-checked by three researchers. The second step of pre-processing, GPS-related variables from
full table with all observed apps and the assigned categories five participants that used apps deliberately designed to create
is available as a supplemental file in the project’s repository fake GPS positions, were imputed with missing values1 . Con-
(Stachl et al., 2019). sequently, missing values of predictors with regard to usage
frequencies and durations were imputed with zeros, as miss-
We enriched the data about participants’ music listening be- ing values would in this case indicate no usage. Furthermore,
havior with information from the Spotify API. In contrast we excluded variables with less than 2 % unique values - as
to previous approaches (Greenberg et al., 2016; Langmeyer they would not add much information to the modeling process
et al., 2012; Nave et al., 2018), this approach allowed us to and would cause our models to crash in some resampling-
create rather objective quantifications of participants’ music instances. In this step we reduced the initial number of 15,692
preferences. In particular, we retrieved metadata with the variables to the final dataset of 1821 variables. This enormous
track search API (Spotify, n.d.-a), including the audio features reduction in variables is related to a high number of variables
object (Spotify, n.d.-b) (e.g., stylistic characteristics such as with little to no variance (e.g., apps used only by one partici-
“acousticness” or “danceability”). Further details on these pant). Finally, we eliminated extreme outliers by excluding
variables are available at the given links to the Spotify API. data points that are unreasonably far (greater than 100 times
The API calls required specifying a combination of album, the median absolute deviation) from the sample median. This
artist, and track title. To do so, we used the track information was done to minimize the impact of possible logging errors
from the PhoneStudy-app. However, the logged track informa- on the modeling process.
tion can be incorrect in some cases, for example, if the track
file played by a participant (locally) had incorrect or missing In addition to pre-processing prior to the analyses, a third step
metadata (e.g., spelling mistake in the title, album missing). of data-dependent pre-processing was embedded within the
To still retrieve information in these cases, we repeatedly resampling procedures of the machine learning models. This
called the Spotify API using several heuristics: First, we used process is described in the section Machine Learning. More
the full available track information without modifications. details about the pre-processing of the data can be found in
If no result was found, we removed special characters (e.g., the respective code files in the osf-repository (Stachl et al.,
punctuation) and “tags” in those fields (i.e. characters between 2019).
brackets, e.g., “[Bonus CD]”). If this was still unsuccessful, Variable Extraction. In total, we extracted 15,692 vari-
we subsequently tried further searches, such as searching ables from the raw dataset. In relation to previous studies, the
without album and with “split” artist field (sometimes artist extracted variables roughly corresponded to the behavioral
data incorrectly contained a list of artists instead of only the categories of communication, app-usage, music consumption,
main artist). These heuristics were developed and manually general day- and nighttime activity (day- and nighttime de-
checked on a test set of incorrect track information, compiled pendency was treated as a distinct category in the analyses),
from our logged data. In this way, we improved coverage of and mobility. Note that no variables with regard to day and
successfully retrieved data without compromising on the qual- night difference in activity were computed for music listening
ity. For example, we found that searching only via track title behavior. Besides common estimators (e.g., arithmetic mean,
was not acceptable as it resulted in many incorrect matches. standard deviation, sum etc.), we also computed more com-
In total, we retrieved metadata for 76% (63,648) of all unique plex variables containing information about the irregularity,
logged tracks. After we enriched the music listening records the entropy, the similarity, and the temporal correlation of
with additional parameters from the Spotify API, we man-
ually checked whether the retrieved music parameters were 1
After closer inspection we concluded that this behavior was
correctly matched to the listened interpret-title-album triples. likely caused by participants creating fake GPS positions while
Consequently, the remaining music data was further reduced playing Pokémon Go.BEHAVIORAL PATTERNS PREDICT PERSONALITY 7
behaviors. These additional variables provided information each fold of the inner cross-validation loop. In contrast to
about specific data types (e.g., mobility data) and aimed to simpler linear models (e.g., linear regression), more flexible
grasp behavioral structures within-person and across time. In non-linear models (e.g., random forests) use hyperparameters
particular, this allowed us to consider temporal variation in the that can be tuned for optimal model performance. We used
data, without the need to use more complex time-series mod- a random search approach for the tuning of hyperparameters
els. Furthermore, due to the large amount of data that made in both model-types. In random forest models, we tuned
hand checking the calculated variables unfeasible, we used the number of randomly considered split variables and the
robust estimators (e.g., Huber M-Estimator, Huber, 1981) for minimum number of observations in a node to be considered
most variables (except for call and SMS variables that were (min.node.size) for a split (Wright & Ziegler, 2017). In elastic
checked manually). Details about the calculation of variables, net models, we tuned the regularization parameter λ and the
the full set of extracted variables, and a detailed overview of regularization-mixing parameter α (J. Friedman, Hastie, &
all sensed data are provided in the project’s repository (Stachl Tibshirani, 2010).
et al., 2019).
We evaluated the predictive performance of the models based
Machine Learning. We trained machine learning models on the Pearson correlation (r) between the predicted val-
for the prediction of all personality factor and facet variables. ues and the person-parameter trait-estimates from the self-
For model-benchmarking, we compared the predictive perfor- reported values of the respective personality trait variables.
mance of elastic net regularized linear regression models (Zou Additionally, we considered the root mean squared error
& Hastie, 2005) with those of non-linear tree-based random (RMS E) and the coefficient of determination (R2 ) as measures
forest models (Breiman, 2001) and a baseline model. The of predictive performance:
baseline model simply predicted the mean of the respective v
training set for all cases in a test-set. We chose these models
t n
1X
due to their ability to cope with P >> N problems (e.g., few RMSE = (yi − ŷi )2
n i=1
cases, many predictors) and because they represent standard
models in the machine learning community. Additionally,
Pn
the usage of random forest models allowed us to harness (yi − ŷi )2
non-linear predictor-effects in the models. R2 = 1 − Pi=1
n 2
i=1 (yi − ȳ)
In order to evaluate the predictive performance of our models
We computed performance measures within each fold of
we implemented hyperparameter tuning and pre-processing in
the cross-validation procedure and averaged across all folds
a nested resampling approach (Bischl, Mersmann, Trautmann,
within a single prediction model (e.g., for extraversion). We
& Weihs, 2012). This approach allowed us to test for optimal
considered models as predictive if they showed a positive
model settings while keeping the training and testing parts
Pearson correlation between the predicted and actual person-
of the data strictly separated. Thus, this approach helps to
ality scores, if the mean R2 metric was greater than zero, and
avoid algorithmic over-fitting as it allows the model to only
if the RMS E was lower in a prediction model than in the
consider the characteristics of the respective training set fold
comparable baseline model.
for data-dependent pre-processing decisions. Specifically,
we used an inner loop for model optimization and an outer Interpretable Machine Learning. Machine learning mod-
resampling loop for performance evaluation. In the inner els are often referred to as black-box models, due to their
resampling loop, we performed additional pre-processing high complexity and their often low explainability (Pargent
and hyperparameter tuning, using 5-fold cross-validation. In & Albert-von der Gönna, 2018; Yarkoni & Westfall, 2017).
the outer loop, the expected predictive-performance on new, To address this problem, a series of methods have been de-
unseen data was estimated using 10 times repeated 10-fold veloped to better understand how particular models work
cross-validation. Within each fold of both cross-validation (Breiman, 2001; Fisher, Rudin, & Dominici, 2018). Fur-
schemes, constant variables were dropped and missing values thermore, researchers in the fields of statistics and machine
of numeric and integer variables were either imputed with learning continue to invent tools to better understand how
two times the maximum of the remaining values (random black-box models work (Guidotti et al., 2018; Molnar, Casal-
forest) or with the median (elastic net). We used the two icchio, & Bischl, 2018). For the prediction models in our
times maximum strategy to label missings as distinct cases study, we computed permutation variable importance values
in order to allow random forest models to effectively use that to measure the impact of single variables and semantically
information in the modeling process. Median imputation for grouped variables (Casalicchio, Molnar, & Bischl, 2019; Gre-
elastic nets was chosen as it was expected that this approach gorutti, Michel, & Saint-Pierre, 2015). With this method, vari-
would not greatly influence the models. Predictors in the elas- able importance is measured by the decrease in the model’s
tic net models were additionally centered and scaled within prediction performance after permuting one single variable8 STACHL ET AL.
(or a group of variables). The motivation behind this is that by their smartphones an average number of 47.73 (SD = 30.86)
shuffling the variables and thus destroying the connection to times per day. Furthermore, participants were connected to
the target variable, unimportant variables should not influence WiFi networks for an average duration of 4.81 (SD = 2.76)
the prediction performance, but important variables should. hours, per day. Descriptive statistics of demographic and
Furthermore, for the random forest models, we visualized the personality trait variables are provided in Table 2, correlations
influence of single variables on the prediction with accumu- between big five personality traits and demographic variables
lated local effect plots (ALE-plots, Apley, 2016). ALE-plots are provided in Table 3. Furthermore, we calculated pairwise
are a method to visualize the effects of individual predictor Spearman correlations with 95% bootstrapped percentile con-
variables by showing how they affect the prediction of the fidence intervals between all extracted, behavioral variables
model on average. and all personality trait variables. Descriptive correlations
between all personality trait variables and all behavioral vari-
Software. Due to the high computational load of the ma- ables are available in the project’s repository (Stachl et al.,
chine learning analyses, we parallelized the computations on 2019).
the Linux -Cluster of the LRZ-Supercomputing Center, in
Garching near Munich, Germany, EU. For computations on In the dataset, we found small correlations between gender
the cluster, R-version 3.5.0 was used. We used R 3.5.2 for and the self-reported level of extraversion (r = -.09, CI95% = [-
all other analyses. We used the fxtract package (Au, 2019) .17, -.01]) and between gender and emotional stability (r = .27,
for variable extraction from the raw data. Furthermore, we CI95% = [.18, .33]). Hence, male gender was associated with
used the mlr (Bischl et al., 2016), mlrCPO (Binder, 2018), lower self-reported levels of extraversion and higher levels
and caret (Jed Wing et al., 2018) packages for pre-processing. of emotional stability. Additionally, we observed substantial
For machine learning we additionally used the glmnet (J. correlations between big five personality factors, for example
Friedman et al., 2010), and ranger (Wright & Ziegler, 2017) between extraversion and openness (r = .49, CI95% = [.43,
packages. Computational parallelization was enabled through .55]) and between extraversion and emotional stability (r =
the parallel (R Core Team, 2018), parallelMap (Bischl & .46, CI95% = [.38, .52]).
Lang, 2015), and batchtools (Lang, Bischl, & Surmann, 2017)
packages. More details on all used packages can be found
Personality Trait Prediction with Behavioral Patterns
in the R-syntax files in the project’s repository (Stachl et al.,
2019).
The results of our analyses show that levels of big five person-
ality traits were successfully predicted from digital records
Results of smartphone usage for the majority of factors and facets.
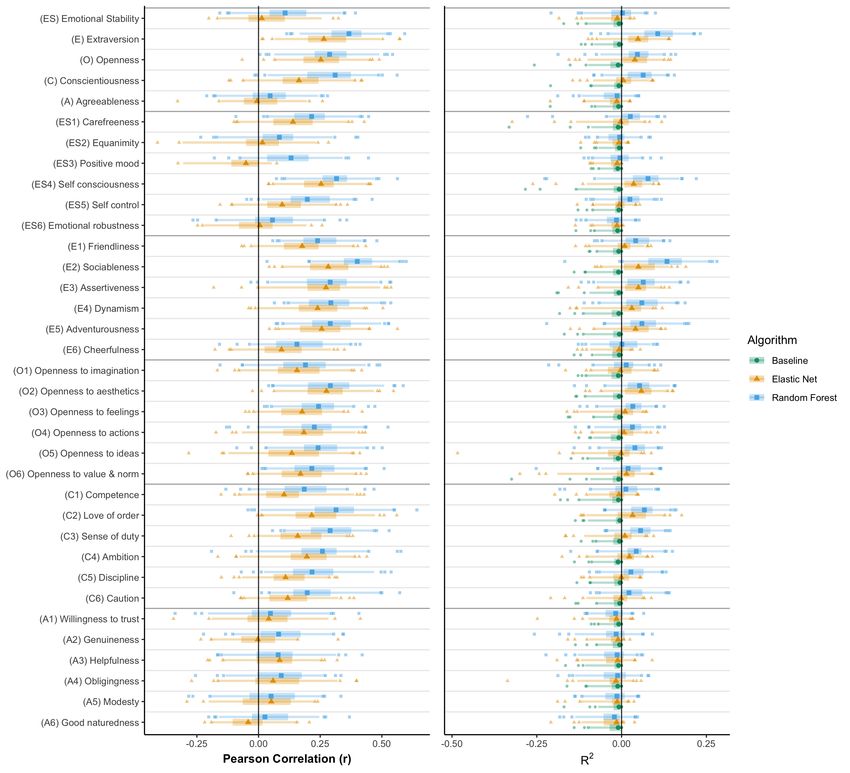
Furthermore, our results suggest differences in how well sin-
Descriptive Statistics gle personality-dimensions were predicted from the dataset,
see Figure 1 and Table 4. The results also show that the
non-linear random forest models on average outperformed
First, we computed a series of descriptive statistics in order
the linear, elastic net models in both prediction-performance
to portrait characteristics of the dataset and correlations be-
and the number of successfully predicted criteria. Behavioral-
tween psychometric and demographic variables. Across the
pattern plots and semantic importance indicators in Figure
three studies, the participants used a total number of 4,857
2 provide patterns of variable importance across all models.
different apps, with each participant having used 13.10 (SD
Several patterns are visible: app-usage behavior had an influ-
= 5.93) distinct apps per day, on average. Whereas the most
ence on most of the prediction models, while having the least
popular app - WhatsApp was on average used 40.62 (SD =
influence on models for extraversion dimensions. Mobility
40.32) times per day, per participant, the more traditional
variables on the contrary, had the least impact on the predic-
call functionality was only used 1.24 (SD = 1.58) times per
tion performance of models. Furthermore, variables from
participant, per day, on average. Out of 624 participants, 355,
the remaining semantic categories were mostly impactful for
at least once listened to music on their smartphones, during
prediction models of specific personality dimensions.
the course of the study. Furthermore, participants on average
listened to 11.13 (SD = 12.17) songs per day. Based on GPS Variable importance measures for all successful models are
data, participants on average covered a robust daily radius provided for single variables and semantic categories in the
of gyration of 6,204 (SD = 14,800) meters. On an average project’s repository (Stachl et al., 2019). In the following
day, participants used their phone at 23:41 for the last time we will report on prediction performances with regard to the
and at 7:55 for the first time. Considering this, participants respective personality traits. Selected ALE-plots are visible
on average showed a statistically robust nightly period of in Figure 3. For reasons of clarity and due to the model’s
inactivity of 7.21 hours (SD = 2.41). In terms of more general superiority in prediction, we will only report performance
phone usage, participants activated and unlocked the screen of metrics from the random forest models in the text. However,BEHAVIORAL PATTERNS PREDICT PERSONALITY 9
Table 2
Descriptive statistics of personality and demographic variables.
mean sd median min max range alphaCI
age 23.56 6.63 22 12 72 60 -
education 4.09 .61 4 1 5 4 -
(ES) Emotional Stability -.02 .72 -.01 -2.24 2.52 4.76 [.93, .94]
(E) Extraversion -.01 .74 -.04 -2.44 2.13 4.58 [.95, .96]
(O) Openness -.05 .71 -.11 -2.00 2.12 4.12 [.93, .94]
(C) Conscientiousness -.09 .74 -.14 -2.28 2.29 4.57 [.95, .96]
(A) Agreeableness -.05 .76 -.14 -2.11 2.64 4.75 [.93, .94]
(ES1) Carefreeness .14 1.30 .27 -4.30 4.30 8.60 [.86, .89]
(ES2) Equanimity .58 1.07 .49 -2.61 5.02 7.63 [.62, .70]
(ES3) Positive mood .95 1.43 .96 -5.78 5.59 11.38 [.78, .83]
(ES4) Self consciousness .65 1.18 .78 -3.57 3.90 7.47 [.80, .84]
(ES5) Self control .65 1.00 .74 -3.55 5.15 8.70 [.79, .84]
(ES6) Emotional robustness .66 1.19 .79 -3.78 5.53 9.30 [.85, .88]
(E1) Friendliness 1.43 1.28 1.37 -1.91 5.41 7.33 [.76, .81]
(E2) Sociableness 1.29 1.76 1.28 -4.50 5.64 1.14 [.86, .89]
(E3) Assertiveness .44 1.37 .47 -3.35 5.61 8.96 [.80, .84]
(E4) Dynamism 1.21 1.59 1.15 -4.11 5.94 1.05 [.86, .89]
(E5) Adventurousness .43 1.49 .55 -4.40 5.27 9.67 [.81, .85]
(E6) Cheerfulness 1.97 1.66 1.85 -3.23 6.09 9.32 [.79, .84]
(O1) Openness to imagination 1.27 1.39 1.30 -2.29 5.33 7.62 [.80, .84]
(O2) Openness to aesthetics .38 1.29 .29 -4.55 4.61 9.16 [.90, .92]
(O3) Openness to feelings 2.02 2.08 2.00 -5.65 6.04 11.69 [.84, .87]
(O4) Openness to actions 1.35 1.40 1.44 -2.75 5.42 8.16 [.85, .88]
(O5) Openness to ideas 1.66 1.43 1.58 -1.63 5.51 7.15 [.88, .90]
(O6) Openness to value & norm .91 1.03 .94 -3.54 4.86 8.41 [.86, .89]
(C1) Competence .84 1.21 .72 -3.32 5.66 8.99 [.83, .86]
(C2) Love of order 1.10 1.55 1.16 -4.34 5.67 1.01 [.79, .83]
(C3) Sense of duty 1.94 1.41 1.78 -1.59 5.50 7.10 [.84, .88]
(C4) Ambition 1.83 1.67 1.58 -2.39 5.86 8.25 [.83, .86]
(C5) Discipline 1.46 1.46 1.50 -3.61 5.75 9.36 [.75, .80]
(C6) Caution 1.53 1.34 1.45 -2.51 5.75 8.26 [.80, .84]
(A1) Willingness to trust .37 1.42 .19 -4.14 5.42 9.56 [.83, .87]
(A2) Genuineness 1.00 .95 .86 -1.56 4.25 5.81 [.85, .88]
(A3) Helpfulness 1.65 1.38 1.67 -2.47 6.04 8.52 [.91, .93]
(A4) Obligingness 1.17 1.30 1.05 -1.86 5.55 7.41 [.84, .87]
(A5) Modesty .78 1.13 .73 -2.68 5.11 7.79 [.82, .86]
(A6) Good naturedness 2.13 1.78 2.09 -2.99 6.40 9.39 [.74, .79]
Note. Descriptives of demographic and personality trait variables for the 624 participants
(377 female, 243 male, 4 not disclosed). alphaCI = 1000 times iterated, 95% bootstrapped
percentile confidence intervals for Cronbach alpha coefficients of internal consistency. Cron-
bach alpha values were computed on the basis of 607 participants, due to some missing raw
item values from study 1, see Stachl et al. (2017) for more details.
all performance metrics are reported in Table 4, plots for successfully predicted above baseline (rmd = .37, rsd = .09,
elastic net models are available in the project’s repository R2md = .11, R2sd = .06, RMS Emd = .70, RMS Esd = .06) on
(Stachl et al., 2019). factor and facet levels. Most notably, the facet of sociableness
was predicted with the highest R2 of all criteria (rmd = .40,
With the exception of the facet cheerfulness (rmd = .16, rsd rsd = .10, R2md = .13, R2sd = .07, RMS Emd = 1.60, RMS Esd =
= .12, R2md = .00, R2sd = .05, RMS Emd = 1.64, RMS Esd = .14). Besides sociableness, the facets friendliness (rmd = .24,
.13), the personality trait of extraversion and its facets were10 STACHL ET AL.
Table 3
Pairwise Spearman correlations between big five personality traits and demographic variables.
gender age education O C E A
age .10, [.02, .17]
education .00, [-.08, .08] .33, [.25, .41]
O -.09, [-.17, -.02] .01, [-.08, .09] .08, [.00, .15]
C -.06, [-.14, .02] .06, [-.03, .14] .05, [-.03, .13] .29, [.22, .36]
E -.09, [-.17, -.01] .00, [-.08, .07] -.04, [-.11, .03] .49, [.43, .55] .27, [.19, .34]
A -.04, [-.12, .04] .08, [-.01, .15] -.02, [-.09, .05] .37, [.30, .44] .16, [.07, .23] .34, [.26, .40]
ES .27, [.19, .33] .03, [-.05, .11] -.05, [-.13, .03] .25, [.17, .32] .26, [.19, .33] .46, [.39, .52] .33, [.25, .40]
Note. Pairwise Spearman correlations between big five personality factors (measured with the BFSI), and demographic
variables in the complete dataset. Gender was coded with 1 = female and 2 = male. Brackets contain 95% bootstrapped
percentile confidence intervals with 1000 iterations.
rsd = .09, R2md = .04, R2sd = .05, RMS Emd = 1.23, RMS Esd feelings (rmd = .24, rsd = .09, R2md = .03, R2sd = .04, RMS Emd
= .11), assertiveness (rmd = .29, rsd = .11, R2md = .06, R2sd = = 2.03, RMS Esd = .16), openness to actions (rmd = .23, rsd =
.06, RMS Emd = 1.32, RMS Esd = .12), dynamism (rmd = .29, .11, R2md = .03, R2sd = .05, RMS Emd = 1.36, RMS Esd = .14)
rsd = .10, R2md = .06, R2sd = .06, RMS Emd = 1.52, RMS Esd and openness to ideas ranging in between (rmd = .24, rsd =
= .12), and adventurousness (rmd = .29, rsd = .11, R2md = .11, R2md = .04, R2sd = .05, RMS Emd = 1.38, RMS Esd = .12).
.06, R2sd = .07, RMS Emd = 1.42, RMS Esd = .13) could be Unlike for extraversion, openness and its facets were best
predicted above baseline. Behavioral patterns and semantic predicted by a diverse mix of behavioral variables. Specifi-
importance in Figure 2 suggest that often variables related cally, the visual inspection of semantic importance indicators
to communication and social behavior, partially with regard in Figure 2 suggests that app-usage, music listening behavior,
to day and nighttime activity, were ranked as most important and partially communication played particularly important
in the prediction models of extraversion and its facets. Fur- roles. Specifically, ALE-plots in Figure 3 suggest non-linear
thermore, ALE-plots in Figure 3 indicate positive, non-linear predictor effects of music listening behavior in the respective
relationships between various communication variables and models. For example, lower levels of openness were predicted
dimensions of extraversion. Specifically, these plots show that for participants that listened to louder music on weekends and
for participants who on average made more outgoing calls for participants with higher minimum values for music-energy
per day and for those who on average called more different and danceability. With the exception of openness to actions,
people per day, higher levels of extraversion were predicted similar and pronounced effects can be seen across the facets
on average. Similarly, higher daily mean numbers in the of openness. Besides music listening behavior, semantic im-
usage of WhatsApp and the mean daily number of outgoing portance measures show that app-usage and communication
calls led to higher on average predictions for sociableness. played an important role in the prediction of openness and
Furthermore, higher values for friendliness were predicted for its facets. Specifically, variables related to the usage of sport-
participants with a higher standard deviation in the number news apps, the usage of the phone’s camera, the length of
of incoming calls per day and a lower irregularity of ringing text messages, and ringing events were identified as important
events on weekends (IVI_call_ring_weekend). Relatively ho- across several facets. Whereas an increased usage of sport-
mogeneous patterns are visible for models across all facets of news in general led to lower predicted values in openness
extraversion. dimensions, increased usage of the phone’s camera and both
higher and more varying length of text messages on average
Openness and its facets were successfully predicted in our led to higher predicted values in those dimensions (see Figure
dataset (rmd = .29, rsd = .11, R2md = .05, R2sd = .05, RMS Emd = 3 and the project’s repository for ALE plots of all effects).
.68, RMS Esd = .05). All facets of openness were also success- Moreover, behavioral patterns in Figure 2 indicate differences
fully predicted above baseline using random forest models. Of in predictor-rankings across facets of openness - possibly
all openness-facets, openness to aesthetics showed the highest hinting at the heterogeneity of this personality dimension
median prediction performance (rmd = .29, rsd = .12, R2md = (DeYoung, 2015; Mussel, Winter, Gelléri, & Schuler, 2011).
.05, R2sd = .05, RMS Emd = 1.25, RMS Esd = .14), openness to Whereas predictions in the model for the facet openness to
imagination the lowest (rmd = .19, rsd = .13, R2md = .01, R2sd actions have been mainly driven by communication related
= .05, RMS Emd = 1.35, RMS Esd = .10), with openness to variables, models for openness to imagination and opennessBEHAVIORAL PATTERNS PREDICT PERSONALITY 11
to aesthetics have mostly relied on variation in app usage and a charging cable. Consequent investigation of ALE-plots in
music preferences. Figure 3 suggest that higher average scores for both facets
were predicted for phone disconnections at battery charges
Conscientiousness was also successfully predicted above base- above 60%.
line (rmd = .31, rsd = .13, R2md = .06, R2sd = .05, RMS Emd =
.71, RMS Esd = .06). Additionally, all facets of conscien- For the personality dimension of emotional stability, only the
tiousness were successfully predicted. In terms of prediction facets of carefreeness (rmd = .22, rsd = .10, R2md = .03, R2sd
performance, the facet love of order ranked first (rmd = .31, = .05, RMS Emd = 1.27, RMS Esd = .10), self-consciousness
rsd = .13, R2md = .07, R2sd = .05, RMS Emd = 1.49, RMS Esd = (rmd = .32, rsd = .09, R2md = .08, R2sd = .07, RMS Emd = 1.11,
.12), followed by sense of duty (rmd = .29, rsd = .10, R2md = RMS Esd = .11), and self-control (rmd = .20, rsd = .11, R2md
.06, R2sd = .04, RMS Emd = 1.34, RMS Esd = .11), ambition = .02, R2sd = .05, RMS Emd = .97, RMS Esd = .12) were pre-
(rmd = .26, rsd = .12, R2md = .04, R2sd = .05, RMS Emd = 1.64, dicted above baseline. Behavioral patterns in Figure 2 are
RMS Esd = .15), discipline (rmd = .22, rsd = .12, R2md = .03, rather distinct for the individual facets of emotional stabil-
R2sd = .05, RMS Emd = 1.43, RMS Esd = .15), caution (rmd ity. Whereas variable importance measures for the model
= .20, rsd = .12, R2md = .02, R2sd = .05, RMS Emd = 1.31, of self-consciousness suggest communication and social be-
RMS Esd = .12), and competence (rmd = .19, rsd = .11, R2md = havior variables as predictive, models for carefreeness and
.01, R2sd = .05, RMS Emd = 1.19, RMS Esd = .13). Inspection self-control suggest more diverse behavioral effects. The pre-
of behavioral patterns and semantic importance indicators diction of self-consciousness was most heavily influenced by
in Figure 2 suggest that variables related to general day and calling behavior and the number of contacts per day. Specif-
nighttime activity and app usage were especially important ically, positive - non-linear relationships of those variables
in the prediction models of conscientiousness and its facets. on the predicted levels of self-consciousness were found (see
Predictor effects in Figure 3 suggest that higher levels of con- Figure 3 and the project’s repository, for visualizations of
scientiousness were predicted when the last traceable daily those effects). Predictions for the facet carefreeness were
event on a participant’s phone was on average detected before increased by various activities ranging from lower numbers in
midnight. Relatedly, higher scores in conscientiousness were the daily mean number of screen unlock events, lower daily
predicted for participants with temporal variation in the first mean usage numbers of the Android email client, and lower
daily event on average. Another important variable in the variance in the usage of of strategy games. Besides other
prediction model of conscientiousness was the daily variation variables, predicted values in the dimension self-control were
in the standard deviation of accumulated inter-event time negatively influenced by higher entropy values in the usage-
(sum of time between usage). Specifically, this effect suggests duration of casual gaming apps and an increased variation
higher predicted scores in conscientiousness for lower scores in the usage duration of checkup and monitoring apps (e.g.,
in inter-event time variation. Similar and more pronounced Speedtest).
patterns of predictor-influence can be seen across the ma- In the present analyses, the personality dimension of agree-
jority of facets. As an exception, predictions in the model ableness could not be successfully predicted from the data,
for the facet competence more heavily relied on mobility neither on factor nor on facet level (rmd = .05, rsd = .11, R2md
and communication-related variables. For example, predictor = -.01, R2sd = .05, RMS Emd = .76, RMS Esd = .07).
effects suggest higher predicted scores in competence with
higher daily mean numbers of contacts and larger on average
covered distances on weekends. Discussion
Furthermore, a number of additional predictor effects across Results from the present study show how big five person-
dimensions of conscientiousness were discovered. In that re- ality traits are manifested in patterns of smartphone-sensed
gard, higher scores were in general predicted for higher mean behaviors. Furthermore, we demonstrate that these behavioral
usage numbers of weather apps, longer usage durations of a lo- patterns can be used to automatically predict levels of indi-
cal public transportation app (de.swm.mvgfahrinfo.muenchen), vidual personality traits. With modest prediction success, the
longer and less variant usage times of the camera, and less trained models were able to predict the traits of extraversion,
variation in the usage of apps from the checkup and monitor- openness, conscientiousness, and single facets of emotional
ing category. Unlike other facets of conscientiousness, predic- stability, above chance. Beyond the predictive performance,
tions for the facet caution were lower if the cosine-similarity our results also provide insights into the types of behavior that
between contacted people on weekdays and on weekends was were most relevant for the prediction of individual personality
higher and if the mean valence of listened music on weekends traits.
was higher. Finally, for the facets love of order and sense
of duty, a very specify behavior was found to be important - Our findings do not align well with previous results by Møn-
the mean charge of the phone when it was disconnected from sted et al. (2018), who reported very limited success in the pre-You can also read