Firebrands and spotting ignition in large-scale fires
←
→
Page content transcription
If your browser does not render page correctly, please read the page content below
Review                                                                                                               CSIRO PUBLISHING

International Journal of Wildland Fire 2010, 19, 818–843                                                www.publish.csiro.au/journals/ijwf

      Firebrands and spotting ignition in large-scale fires

      Eunmo KooA,E, Patrick J. PagniB, David R. WeiseC and John P. WoycheeseD
      A
        Earth and Environmental Sciences Division, Los Alamos National Laboratory,
        Los Alamos, NM 87545, USA.
      B
        Mechanical Engineering Department, University of California at Berkeley,
        Berkeley, CA 94720, USA.
      C
        USDA Forest Service, Pacific Southwest Research Station, Riverside, CA 92507, USA.
      D
        Hughes Associates, Inc., 2551 San Ramon Valley Boulevard, San Ramon,
        CA 94583, USA.
      E
       Corresponding author. Email: koo_e@lanl.gov

      Abstract. Spotting ignition by lofted firebrands is a significant mechanism of fire spread, as observed in many large-
      scale fires. The role of firebrands in fire propagation and the important parameters involved in spot fire development are
      studied. Historical large-scale fires, including wind-driven urban and wildland conflagrations and post-earthquake fires
      are given as examples. In addition, research on firebrand behaviour is reviewed. The phenomenon of spotting fires
      comprises three sequential mechanisms: generation, transport and ignition of recipient fuel. In order to understand these
      mechanisms, many experiments have been performed, such as measuring drag on firebrands, analysing the flow fields of
      flame and plume structures, collecting firebrands from burning materials, houses and wildfires, and observing firebrand
      burning characteristics in wind tunnels under the terminal velocity condition and ignition characteristics of fuel beds. The
      knowledge obtained from the experiments was used to develop firebrand models. Since Tarifa developed a firebrand
      model based on the terminal velocity approximation, many firebrand transport models have been developed to predict
      maximum spot fire distance. Combustion models of a firebrand were developed empirically and the maximum spot fire
      distance was found at the burnout limit. Recommendations for future research and development are provided.

      Additional keywords: fire spread, forest fire, post-earthquake fire, urban conflagration, wildland–urban interface fire.

Introduction                                                            (1991), and Grand Forks during the Red River Flood (1997),
Spotting ignition by lofted firebrands, or pieces of burning            spot ignitions were found to be a dominant mechanism in fire
wood, is a significant mechanism of fire spread (Tarifa et al.          spread (Goodsell 1871; Sheahan and Upton 1872; British
1965a; Williams 1982). The threat of spotting ignition increases        Fire Prevention Committee 1917; Bell 1920; National Board of
as the scale of the main fire enlarges because a larger fire pro-       Fire Underwriters 1923; Railroad Commission of the State of
duces a larger and stronger plume with faster vertical and radial       California Hydraulic Division 1923; Wilson 1962; Wells 1968;
fire-induced wind velocity (Pitts 1991; Trelles and Pagni 1997)         California Department of Forestry and Fire Protection 1991;
capable of lofting larger firebrands a greater distance. Thus,          National Fire Protection Association 1991; Brenner 1993;
spotting can become the dominant fire-spread mechanism in               Pagni 1993; Sullivan 1993; Bredeson 1999; Greenwood 1999;
large conflagrations and wildland fires. Spot ignition, a dis-          Pernin 1999). Along with these wind-driven conflagrations, post-
continuous fire spread mechanism, frequently overwhelms fire            earthquake fires at San Francisco (1906), Tokyo (1923), Loma
suppression efforts, breaching large barriers and firebreaks.           Prieta (1989), Kobe (1991) and Northridge (1994) were studied
The atmospheric conditions that are favourable to contiguous            for spot fire conditions (National Board of Fire Underwriters
fire spread, such as high wind velocity and low humidity, also          1906; Engle 1929; Bronson 1959; Brown and Hillside Press
enhance this discontinuous fire spread mechanism, increasing            1976; Scawthorn 1987; Hale and Hale 1988; Scawthorn and
both spotting distance and ignition probability (Sheahan and            Khater 1992; Louie 1996; Quintiere 1997; Scawthorn et al.1998;
Upton 1872; Bell 1920; National Board of Fire Underwriters              Kurzman 2001; City of Kobe 2005; Iversen 2006).
1923; Wilson 1962; Anderson 1968; Wells 1968; Pagni 1993;                  The phenomenon of spotting can be broken down into three
Greenwood 1999; Pernin 1999). The conditions of the recipient           main sequential mechanisms: generation, transport, and ignition
fuel are also critical, not just because firebrands ignite fuels, but   of fuel at the landing position. These three mechanisms have
also because the ignited recipient fuel becomes another source          many submechanisms. Thus, firebrand research requires cover-
of firebrands. The criteria of ignition due to landed firebrands        ing a broad range of topics. For example, to understand firebrand
are strongly related to weather conditions. In the historical wind-     generation, degradation of wood due to pyrolysis and combus-
driven conflagrations of London (1666), Chicago (1871),                 tion should be understood. Firebrand transport includes topics
Peshtigo (1871), Berkeley (1923), Bel-Air (1961), Oakland               such as flame structures, airflow induced by the fire, interaction

Ó IAWF 2010                                                                          10.1071/WF07119                 1049-8001/10/070818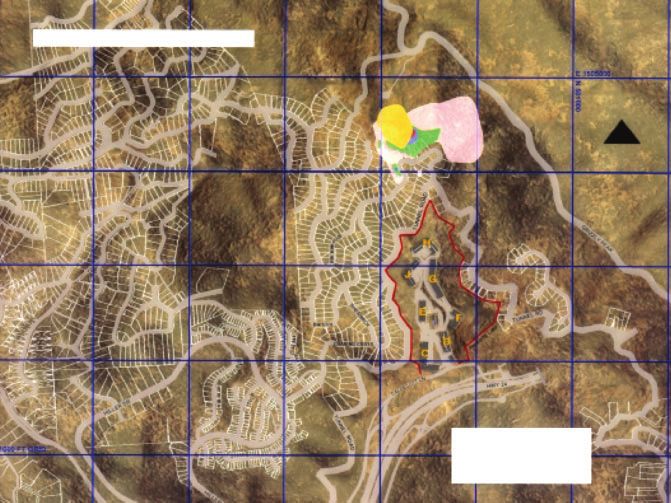
Firebrands and spotting ignition in large-scale fires Int. J. Wildland Fire 819
between fires and local weather, aerodynamics around fire- Lessons from historical large-scale fires
brands including drag forces, combustion of firebrands during Discontinuity
flight with criteria for extinction, and heat transfer of firebrands
Spotting ignition can break fire defence lines. In the 1666
during flight. In ignition by firebrands, ignition criteria for
London Fire (Bell 1920), people desperately formed a defence
various recipient fuels, heat capacity of firebrands, and heat
line around Saint Paul’s Cathedral, but failed to save it because
transfer between firebrands, air, and recipient fuel are involved.
of firebrands that ignited the roof after the fire jumped across
Smouldering combustion and its spread and development
the defence line and surrounding churchyard. The ‘leaping’
should also be considered. All of these subjects should be
fires, described as a fire behaviour characteristic of dis-
understood to some degree in order to gain a broad under-
continuous roof-to-roof spread in the 1666 London Fire (Bell
standing of firebrand phenomena, even though not all the
1920), created by firebrands, make firebreaks vulnerable in
subjects above are incorporated in current firebrand research.
many conflagrations. Historical evidence of fire leaping across
This paper reviews the literature that forms the current state
firebreaks such as rivers – the Chicago River in the 1871
of firebrand research. Many experiments have been performed
Chicago Fire (Sheahan and Upton 1872); roads – Powell Street
to understand firebrand behaviour. Based on these experiments,
in the 1906 San Francisco Fire (Bronson 1959), Mulholland
many firebrand transport models have been developed. Most
Drive in the 1961 Bel-Air Fire (Greenwood 1999); freeways –
of the models were designed to estimate maximum spot fire
San Diego Freeway in the 1961 Bel-Air Fire (Greenwood 1999),
distance. The phenomenon of spotting has again become an area
Highway 24 in the 1991 Oakland Hills Fire (Pagni 1993) is
of active research interest and there has been a recent prolifera-
indicative of the problem. Firebrands jumped across sea to reach
tion of papers on the subject. Although we have attempted to
an island – Moon Island (Tsukishima) in the 1923 Tokyo Fire
provide an up-to-date review of current work, we have certainly
(Tokyo Imperial University 1923). In the Red River Flood in
missed the most recent developments in the field. Any error of
1997, fire jumped approximately 11 buildings over the sur-
omission is not intentional. This review covers literature through
rounding floodwater, in the city of Grand Forks, MN (Shelby
2008. After a review of the literature, recommendations for
2004). The distance of spotting becomes as great as a few
future firebrand research are briefly suggested.
kilometres when the scale of a fire gets large, such as forest fires
(Wells 1968) and anecdotal distances of 30 km have been
reported in Australia (Chandler et al. 1983).
Firebrand and conflagrations Spotting ignition sometimes makes fire spread unpredictably
Historically, conflagrations have been one of civilisation’s fast. Fourteen firefighters were trapped by the fast-spreading
major disasters, from the Great Fire of Rome in 64 AD to the upslope fire initiated by spotting from the slow-spreading
Cedar Fire of southern California in 2003 to the more recent downslope fire and lost their lives in the 1993 South Canyon
fires in Australia, Greece, and Portugal to mention a few. Fire on the Colorado Storm King Mountain Fire (Butler et al.
Disastrous conflagrations have been recorded throughout his- 1998). When spotting becomes dominant, a fire suppression line
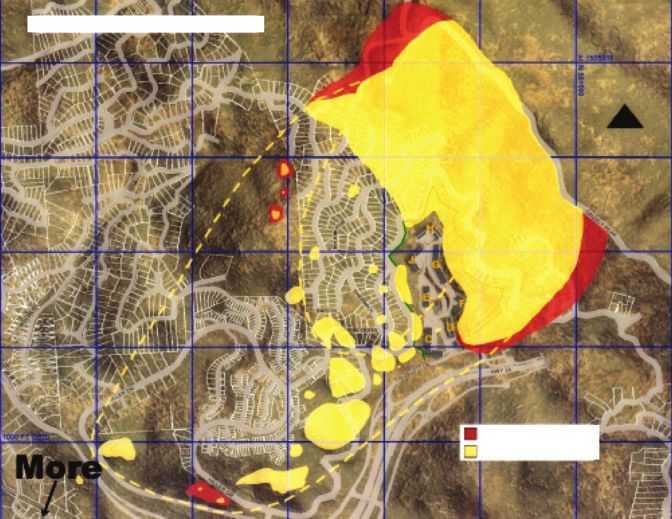
tory because of profound impacts on society. For example, loses efficacy. Figs 1–4 show the maps of the 1991 Oakland
the Roman historian Tacitus described the Great Fire of Rome Hills Fire (Woycheese 2000). These maps, in which coloured
in Annals. It is possibly the first recorded conflagration in areas indicate fire spread, show how much faster fire spreads
Western civilisation; many conflagrations since have produced through a large area owing to spotting. In the 1961 Bel-Air Fire
their own documents, some of which are cited in this paper. report, this situation is described:
Evidence of spotting ignitions can be found in such documents ‘There was no contiguous fire boundary. Instead, there were
even though many documents on historical conflagrations lack scores of large fires scattered over a wide area, each sending
a scientific point of view. These documents also depict the thousands of brands into the air to swarm out to ravage new
conditions and the roles of firebrands in the spread of large- sections.’ (Greenwood 1999)
scale fires.
Conflagrations occur generally when strong winds drive a
fire to overwhelm human suppression efforts. Besides atmo- Weather conditions
spheric conditions, limited fire suppression resources can fail to Weather conditions, especially wind, are the most critical factor
control multiple simultaneous fires, resulting in a conflagration, in spotting ignition, because strong wind increases firebrand
for instance, during warfare or after an earthquake. Multiple hazard in all respects, enhancing firebrand generation, transport,
fires commonly break out simultaneously after earthquakes and recipient fuel ignition by firebrands. First of all, strong wind
owing to damage inflicted during the earthquake such as can increase convective heat transfer to assist contiguous fire
breakage of gas pipes, stoves or furnaces, and spilling chemi- spread. Strong wind makes a main fire larger and increases
cals. If strong winds blow after an earthquake hits, the damage of buoyant force in the flame and plume, which can loft larger
the post-earthquake fire can become larger than the damage of firebrands. Second, stronger wind can transport firebrands fur-
the earthquake itself. For example, the 1906 San Francisco ther, because the drag force on a firebrand, which is the driving
earthquake (Bronson 1959; Kennedy 1963) and the 1923 Great force of firebrand transport, is proportional to the square of wind
Kanto earthquake (Quintiere 1997) were followed by fires more speed. Third, wind supplies oxygen; thus, strong wind helps
destructive than the earthquakes themselves. In these large post- ignition of recipient fuels and transition from smouldering to
earthquake fires, firebrand activity and spot fires were observed flaming combustion, unless the wind is strong enough to cool the
and played important roles in fire spread. firebrand off or detach the flame from the firebrand.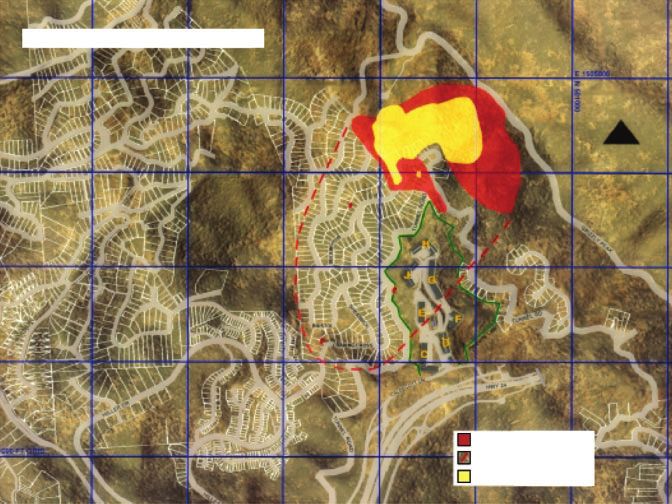
820   Int. J. Wildland Fire                                                                                                             E. Koo et al.

                               Oakland Hills ‘Tunnel’ Fire

                                                                                                                               N

                                                                                                   Saturday       1120 hours
                                                                                                   1100 hours     1130 hours
                                                                                                   1110 hours

                       Fig. 1. Synopsis of propagation of the Oakland Hills Fire of 1991 as developed from eyewitness and
                       emergency crew accounts and 911 phone calls by Dave Sapsis of UC Berkeley. The winds were
                       blowing from the north-east as shown in Fig. 7. The blue lines are the California State grids, which have
                       300-m spacing. The fire propagation for the first half-hour of the Sunday conflagration is colour-coded
                       as shown in the legend. From fig. 1.1 (p. 15) of Woycheese (2000), reproduced with permission.

                                Oakland Hills ‘Tunnel’ Fire

                                                                                                                               N

                                                                                                     1135 hours
                                                                                                     1135 hours envelope
                                                                                                     Through 1130 hours

                       Fig. 2. Continuation of the spread of the Oakland Hills Fire of 1991 as developed by Dave Sapsis. The
                       scope of the first 30 min of the fire is shown in yellow, and the propagation during the subsequent 5 min
                       is outlined by the red dashed line, with the contiguous fire front shown by the solid red area. Note the
                       three spot fires that have been initiated during this period to the south-west of the main fire. From fig. 1.2
                       (p. 16) of Woycheese (2000), reproduced with permission.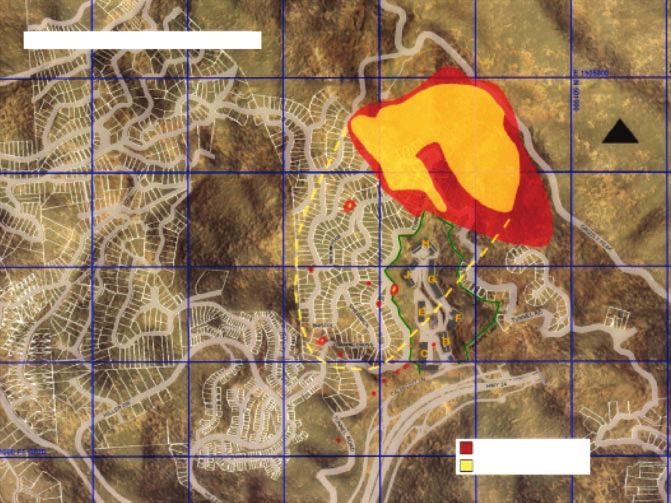
Firebrands and spotting ignition in large-scale fires                                                                         Int. J. Wildland Fire   821

                                   Oakland Hills ‘Tunnel’ Fire

                                                                                                                          N

                                                                                                    1140 hours
                                                                                                    Through 1135 hours

                          Fig. 3. Extent of the Oakland Hills Fire of 1991 through 1140 hours, as developed by Dave Sapsis,
                          where the spread shown in the previous figure is represented by the area outlined in yellow. During the
                          subsequent 5 min, the fire propagated as shown in red. The three spot fires have grown, and a multitude
                          of new spot fires have been initiated during this 5-min period. From fig. 1.3 (p. 17) of Woycheese
                          (2000), reproduced with permission.

                                   Oakland Hills ‘Tunnel’ FIre

                                                                                                                          N

                                                                                                     1200 hours
                                                                                                     Through 1155 hours

                          Fig. 4. Extent of the Oakland Hills Fire of 20 October 1991 through 1200 hours, as provided by Dave
                          Sapsis. The scope of the fire through 1140 hours, as shown in Fig. 3, is indicated by inner yellow dashed
                          line. By 1200 hours, spot fires have been initiated more than 1 km from the main, contiguous fire front.
                          ‘More’ in the map indicates that there were more spot fires in south-west, which is downwind. From fig.
                          1.4 (p. 18) of Woycheese (2000), reproduced with permission.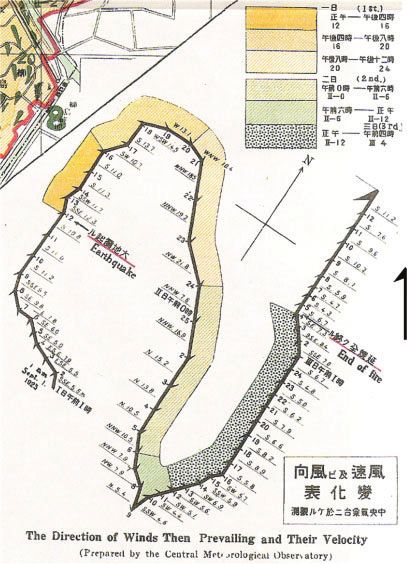
822     Int. J. Wildland Fire                                                                                               E. Koo et al.

    Strong wind can combine with low relative humidity to             seemed to be under control. As the strong Diablo wind, which is
increase the risk of spot fires. Low relative humidity also helps     a föhn wind in the San Francisco Bay area, blew (20th ignition)
the ignition of recipient fuel because dry air cannot act as a heat   on the next day, the fire got larger and spot fires dominated fire
sink during the firebrand transport and after landing. In addition,   spread within an hour (from 1100 to 1200 hours), as shown in
low humidity typically yields low moisture content of recipient       Figs 1–4.
fuels. Drought before large-scale fires and conflagration are             The importance of wind in spot fire phenomena can be
very common, as shown in the 1666 London Fire (Bell 1920), in         demonstrated by the large-scale fires without significant wind.
1871 in Chicago (Sheahan and Upton 1872) and in Peshtigo              Recently, three fires following an earthquake, the 1989 Loma
(Wells 1968; Pernin 1999). In the 1991 Oakland Hills Fire,            Prieta (San Francisco Fire Department 2005; Iversen 2006), the
relative humidity was recorded as almost zero (Pagni 1993;            1994 Northridge (Todd 1994; Scawthorn et al. 1998) and 1995
Trelles and Pagni 1997). In regions with föhn wind, which is a       Kobe earthquakes (Louie 1996; City of Kobe 2005), are good
dry wind associated with wind flow down the lee side of a             examples. After these three earthquakes, there were multiple
plateau or mountain range and with adiabatic warming (Wilson          fires ignited owing to earthquakes, but there was no significant
1962), the spot fire hazard increases. In the United States, föhn    firebrand activity because of the absence of wind. In the 1995
winds exist as the Diablo wind of the San Francisco Bay Area          Kobe earthquake, fire spread to a larger area and burned 7386
(1991 Oakland Hills Fire), the Santa Ana wind of southern             structures, but that was due to the high density of structures in
California (1961 Bel-Air Fire), the East Wind in western              Japanese urban areas, not as a result of fire propagation due to
Washington and Oregon and the Chinook wind of the Rocky               firebrand transport. If an earthquake strikes California under
Mountains. One extreme example of strong winds combined               Santa Ana or Diablo wind conditions, there could be a confla-
with conflagration is the 1923 Tokyo fire after the Kanto             gration with a bigger impact than previous post-earthquake fires.
Earthquake: a typhoon was near the area where the earthquake          Note that both the 1989 Loma Prieta earthquake in northern
struck. The Kanto earthquake and the ensuing fire resulted            California and the 1994 Northridge earthquake in southern
in ,100 000 deaths, including 38 000 due to a fire whirl –            California happened in the regions where föhn winds can blow,
a flaming tornado (Quintiere 1997).                                   even though they actually happened under near zero-wind
    In the 1666 London Fire, the prevailing wind was described        conditions.
as ‘the bellowing wind’, and ‘the red flakes’, or firebrands,
scattered and spread the fire in all directions (Bell 1920). Fig. 5   Recipient fuels to be ignited
shows the weather pattern of the cyclonic storm that formed on        In urban conflagrations, discontinuous fire spread has been also
8 October 1871, the day of the Chicago and Peshtigo Fires             referred as roof-to-roof spread because the roof is the recipient
(Pernin 1999). The arrow indicating wind direction in Fig. 5          fuel. The roof-to-roof spread in urban areas is sometimes alleged
corresponds with the fire spread direction. The wind was strong,      to be caused by radiative heat transfer. This can be true for the
9.8 m s1 (22 miles h1) in Chicago and 14.3 m s1 (32 miles h1)     highly dense urban areas like Kobe in Japan, but firebrands have
in Peshtigo. In addition, temperatures were high, 26.18C (798F)       been observed as the main cause of the roof-to-roof fire spread
in Chicago and 28.38C (838F) in Peshtigo. The scene was               in many fires with high wind conditions. Thus the recipient
described                                                             fuel condition, such as the roof material in cases of urban and
                                                                      wildland–urban interface fires, is another important factor
   ‘The wind blew a hurricane; the firebrands were hurled along
                                                                      (National Board of Fire Underwriters 1923; Wilson 1962).
   the ground with incredible force against everything that
                                                                         The fires initiated by firebrands in the 1666 London Fire
   stood in their way.’ (Wells 1968)
                                                                      burned down most structures made of wood (Bell 1920;
    In 1923, the Tokyo Fire broke out and spread rapidly owing        Tinniswood 2004). Roof-to-roof fire spread was indicated in
to strong winds from a typhoon near the Noto Peninsula                the 1871 Chicago fire too (Sheahan and Upton 1872). In the
(Scawthorn 1987). Fig. 6 is a hodograph, excerpted from a             wildland–urban interface fires in California – Berkeley in 1923,
map of the Tokyo fire (Tokyo Imperial University 1923), which         Bel-Air in 1961, Oakland in 1991 – wooden shingles, which
contains information about the fire including ignition sites,         were popular in California as roof material, assisted fire spread.
direction of fire spread and spot fire locations. The hodograph       Wooden shingles increase fire hazard owing to both ease of
shows chronological wind velocity and direction, using tail-          ignition and subsequent firebrand production (National Board
to-nose conjunction. The wind was strong on the first day             of Fire Underwriters 1923; Wilson 1962; Office of the City
(1 September 1923), ranging from 10.7 to 21.8 m s1, but              Manager 1991). Fig. 8 is an actual firebrand obtained from the
weakened to ,5 m s1 and changed its direction to the north           1991 Oakland Hills Fire, which was presumably produced from
at 0900 hours on the second day. The wind direction changed the       cedar shingle. It was found ,1 km away from the fire perimeter.
fire spread direction to the north, which had mostly burned           Wooden shingle roofs were identified as the main factor that
already, eventually allowing the fire to be extinguished at 0400      made fire worse in the official reports of the 1923 Berkeley Fire
hours on the third day.                                               (National Board of Fire Underwriters 1923) and the 1961 Bel-
    Fig. 7 is a hodograph of the 1991 Oakland Hills Fire, in the      Air Fire; the National Fire Protection Association (NFPA) report
same fashion as Fig. 6. In addition to wind velocity, atmospheric     of the 1961 Bel-Air Fire was entitled ‘Devil wind and wood
temperature is shown as thickness and humidity is shown as            shingles’ (Wilson 1962). In the 1961 Bel-Air Fire, the aero-
colour of the arrow (Pagni 1993). The Oakland Hills Fire              dynamic firebrands made of wooden roof shingles could reach
actually started on 19 October 1991 (19th ignition), but with a       higher altitudes and be carried further by the upper strata of the
typical coastal pattern of light wind, it didn’t grow larger and      Santa Ana winds. These became the long-range firebrands.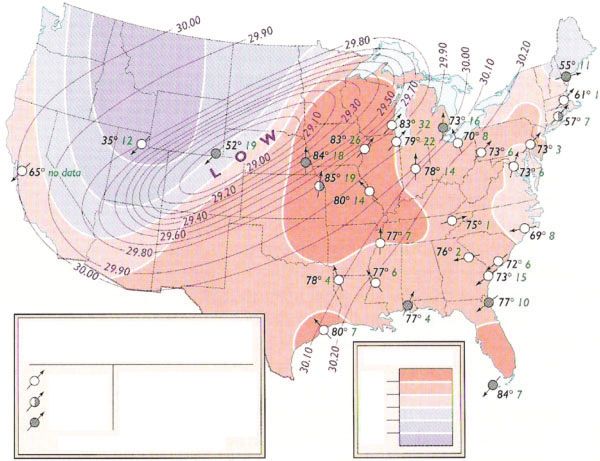
Firebrands and spotting ignition in large-scale fires                                                                                          Int. J. Wildland Fire   823

                                                    Cyclonic storm
                                           8 October 1871, 1735 hours                               Temperature (°F)

                                           Clear           Temperature (°F) (in black)              80°
                                                                                                    70°
                                           Partly cloudy   Wind speed (miles per hour) (in green)
                                                                                                    60°
                                                                                                    50°
                               Jeff Mass

                                           Cloudy          Barometric pressure (in purple)
                                                                                                    40°
                                                (Arrows indicate wind direction)

                               Fig. 5. Weather conditions in the US on 8 October 1871, the day of the Great Chicago Fire
                               and Peshtigo Fire, are shown. The cyclonic storm pattern in late summer shows strong winds
                               and high temperatures in the burned area. Moreover, 1871 had a severe summer drought in
                               the Midwest. From fig. 1 (p. 14) of Pernin (1999). Map created by Jeff Maas. Reproduced
                               with permission of the Wisconsin Historical Society.

                                                                                                            On 1 September 1923
                                                                                                            12001600 hours
                                                                                                            16002000 hours
                                                                                                            20002400 hours

                                                                                                            On 2 September
                                                                                                            00000600 hours
                                                                                                            06001200 hours
                                                                                                            12000400 hours (3 September)

                                                                                                            Wind velocity (direction, m s1)
                                                                                                            – Time

                              Fig. 6. The hodograph part of the Tokyo fire map that shows wind velocity vectors alongside
                              a chronology of the fire. On the upper right corner, a colour legend for chronology is shown
                              with day and time. On first day, the wind was strong – from 10.7 to 21.8 m s1. Later in the
                              second day, the wind speed slowed to ,5 m s1, and eventually the fire was controlled at the
                              ‘End of fire’ at 0400 hours of the third day (Tokyo Imperial University 1923).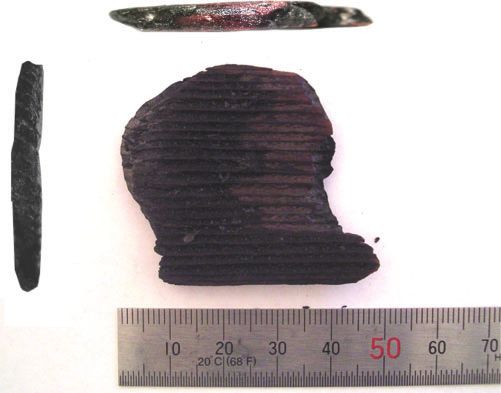
824   Int. J. Wildland Fire                                                                                                          E. Koo et al.

                                                                                                          19th ignition

                                                                                   1200              1300
                                                                                                      1400
                                                                             1100                         1500
                                                                                                            1600
                                                                            1000                                1700
                                                                                                                    1800
                                                                             0900                  0100
                                                                                                                      1900
                                                                                0800                                 2000
                                                                                0700                         2400
                                                                                 0500       0400
                                                                                                                0700
                                                                                          0800

                                                                                     0900

                                                                              1000

                                                                                                       20th ignition
                                                                       1100

                                                                  1200

                                                           1300

                                                                                            N
                                                      1400

                                                                                  W                E
                                                  1500

                                              1600                                       S
                                                                                   Wind direction
                                           1700

                                      1800
                                  1900
                                2000
                         2200
                       2300
                     2400

                     Fig. 7. Wind velocity vectors recorded at the Chabot Observatory for 19 and 20 October 1991. The wind
                     direction is indicated as shown in the compass rose. The wind speed is given by the length of the velocity
                     arrow, with the arrow on the compass rose corresponding to 5 m s1. The thickness of the arrow indicates
                     the temperature: thin o258C, thick 4258C. The colour of the arrow indicates the relative humidity:
                     white 410%, black o10%. The 19 October data show a typical coastal pattern with light on-shore winds
                     midday and light off-shore winds morning, evening, and night. Hot, dry, fast Diablo winds began pouring
                     over the hills, nearly normal to the ridgeline, at 0600 hours on 20 October and continued unabated until 2000
                     hours. From fig. 2 (p. 336) of Pagni (1993).

  ‘Unlike the flying brush brands which are often consumed
  before rising to great heights; the flat wood roofing                           In this report, brush and chaparral fuels that were ignited by
  materials soared to higher altitudes carried by strong                      firebrands are mentioned. The firebrands that landed on brush
  vertical drafts.y The denser brands rose into this upper                    and chaparral seemed to have more ability to ignite recipient fuel
  wind strata and were carried to the southwest in great                      because of fuel bed porosity, which allows more oxygen supply
  profusion. New fires were ignited in the brush and among                    to firebrand combustion.
  structures at great distances, at times spanning two and                        Ignition of the recipient fuel requires energy transfer from
  three canyons.’ (Wilson 1962)                                               firebrand to fuel, enough to raise the temperature of the recipient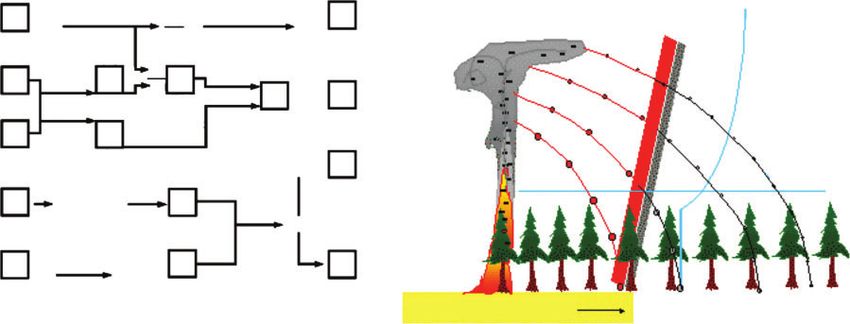
Firebrands and spotting ignition in large-scale fires                                                           Int. J. Wildland Fire     825

fuel to ignition temperature. There are several factors in deter-
mining the required energy for ignition. In addition to the kind of
recipient fuel itself, the moisture content of the fuel and relative
humidity of the local atmosphere are important factors. With
dry fuel in dry air conditions, the spotting ignition probability
could increase drastically. This could be related to the fact that
many large conflagrations and large-scale fires with spot
fires occurred after drought or during the fall season when fuels
and atmosphere are dry.

Spotting distance
For a given prevailing wind speed, the maximum spotting dis-
tance depends on the lifetime of burning firebrands (Tarifa et al.
1965a; Albini 1979). Thus the spotting distance gets larger when
the fire grows larger and becomes more intense. Definitely,
the firebrand’s lifetime depends on its initial size, which is
determined by the vertical speed of wind induced by the fire
                                                                       Fig. 8. A firebrand from the Oakland Hills conflagration: ,50-mm
(Tarifa et al. 1965a; Lee and Hellman 1969; Muraszew 1974;
                                                                       diameter, ,5-mm thickness, and 2.3 g (density of ,250 kg m3). Presumed
Muraszew et al. 1975; Muraszew and Fedele 1977; Albini 1979;           to be produced from cedar shingle. Ruler units are millimetres.
Woycheese 1996; Koo et al. 2007). For convective columns, the
vertical wind speed increases with the heat release rates of the
main fire. Another mechanism that lofts firebrands is a fire whirl        6 miles [,9.7 km] away and how a piece of wood was carried
(Muraszew and Fedele 1976, 1977). Strong convective columns               through the air for 7 miles [,11.27 km] before falling near a
and fire whirls are more common in large-scale fires such as              Lake Michigan vessel in the Green Bay.’ (Wells 1968)
forest fires. Therefore spot fire distance becomes more impor-
tant in forest fires and wildland–urban interface fires. In these
kinds of fires, spotting distance can be on the order of
                                                                       Firebrand research review
kilometres.
   In the 1871 Peshtigo Fire (Wells 1968), several firebrands          Because of the importance of spot fires in large-scale fire spread,
that travelled more than 10 km were found. They are thought to         the firebrand phenomenon has been studied since the 1960s. The
have been lofted by large fire whirls. Several reports written by      firebrand research work reviewed in this paper is summarised in
the USDA Forest Service on other forest fires indicate the             Table 1. The firebrand phenomenon and spotting ignitions are
significance of fire whirls and spot fires. Fire whirls and            still considered some of the most difficult problems to under-
numerous spot fires occurred in northern Idaho during the              stand in fire spread. The research work that has contributed to
Sundance Fire, on 23 August 1967 (Anderson 1968). Muraszew             the current knowledge and understanding of the firebrand phe-
suggested that most long-range firebrands are lofted by fire           nomenon is reviewed. As a result, recommendations for future
whirls, whereas short-range firebrands are mostly lofted by            firebrand research are presented.
the convective plume (Muraszew and Fedele 1976). Firebrands                Since Tarifa studied the lifetime and trajectories of fire-
escaping from a prescribed burn initiated several spot fires           brands for the first time (Tarifa et al. 1965a, 1965b, 1967),
during the 4 May 2000 Cerro Grande fire in New Mexico (Hill            firebrand research has been focussed on maximum spot fire
2000; United States National Park Service 2000). Some fire-            distance. The maximum spot fire distance is estimated as the
brands were even observed jumping across a canyon wider than           distance that a potential firebrand could travel within its life-
400 m. In the 1991 Oakland Hills Fire, a firebrand, shown in           time, which is the duration from lofting to its burnout. Many
Fig. 8, that was found ,1 km west from the perimeter of the fire       assumptions are incorporated in the estimation of the maximum
may have travelled several kilometres.                                 spotting distance. However, maximum spotting distance has
   Byram’s analysis on the travel distance of the firebrands           been used as a measure of spotting hazards, as Albini wrote,
found in the Peshtigo Fire summarises the significance of fire         ‘The severity of a potential spotting problem can be described
whirls in forest fires:                                                numerically by the maximum spot fire distance to be anticipated
                                                                       under the conditions in question’ (Albini 1979). In order to have
   ‘George M. Byram has found that catastrophic fires may              a longer maximum spotting distance, larger firebrands should be
   create convective columns that rise to a height of about            lofted to stronger prevailing wind. Besides spotting distance,
   5 miles [,8 km]. The energy generated by such whirling              both larger firebrands and a stronger prevailing wind increase
   chimneys of super-heated air can twist off large trees, as can      ignition probability (Blackmarr 1972; Bunting and Wright 1974).
   the more ordinary kind of tornadoes. Such fires frequently          Besides firebrand transport models, firebrand phenomena have
   carry embers nearly a mile in the air, then drop them far ahead     been studied experimentally. Combustion tests in wind tunnels
   of the fire front – a discovery that explains how a charred         have been the most fundamental experiments for firebrands
   board from Peshtigo was found in the Menominee River                (Tarifa et al. 1965a, 1965b, 1967; Muraszew et al. 1975;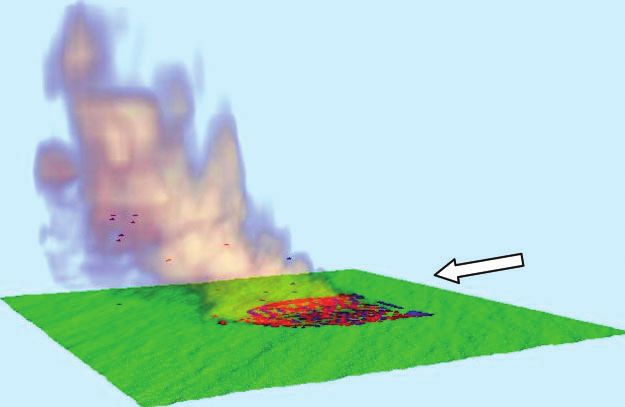
826

                                                                      Table 1. Compendium of firebrand research
                                                                                                                                                                                                  Int. J. Wildland Fire

Author                   Year               Experiment                                         Firebrand model                              Plume and wind model

Tarifa et al.            1965–67            Burning firebrands in wind tunnel                  Sphere, cylinder with combustion             Given launching height in constant horizontal wind,
                                                                                                                                             inclined convective plume (Nielsen and Tao 1965)
Waterman (and Tanaka)    1969               Size and number distribution at generation         –                                            –
                                             (Waterman 1969)
                                            Ignition of various fuel materials by firebrands
                                             (Waterman and Tanaka 1969)
Vodvarka                 1969               Size and number distribution                       –                                            –
Lee and Hellman          1969–70            Particles in vertical plume generator (1969)       Spheres with combustion (1970)               Turbulent swirling natural convective plume (1969)
Muraszew and Fedele      1974–77            Burning firebrands in wind tunnel and              Statistical model (1976)                     Fire whirl (1977)
                                             fire whirl in vertical channel (1975)
Clements                 1977               Firebrand combustion in terminal velocity          –                                            –
Fernandez-Pello et al.   1982, 1998, 2006   –                                                  Sphere with combustion (Fernandez-Pello      Given launching height (1998), McCaffrey plume
                                                                                                1982)                                        (2006) in constant boundary layer wind
                                                                                               Disc, cylinder and sphere (2006)
Albini                   1979–83            –                                                  Cylinder with combustion (Muraszew           Launching height from flame structure analysis
                                                                                                and Fedele 1976)                             in constant horizontal wind
Woycheese and Pagni      1996–2000          Burning firebrands in wind tunnel                  Non-dimensional model with combustion        Baum and McCaffrey plume model
                                                                                                (Kinoshita et al. 1981)                      (Baum and McCaffrey 1989)
Knight, Ellis et al.     2001               Various firebrand combustion in vertical           –                                            –
                                             wind tunnel
Colin et al.             2002               Statistical survey on fires and monitoring         Statistical model (SALTUS program)           –
Himoto and Tanaka        2005               –                                                  Disc without combustion                      Given launching height in turbulent boundary layer
Manzello et al.          2004–08            Fuel bed ignition by firebrands, generation        –                                            –
                                             from a burning tree; firebrand attack
                                             on structures using firebrands generator
Porterie et al.          2007               –                                                  Small world network model (Porterie et al.   Steady-state crown fire (Porterie et al. 2005)
                                                                                                2007); disc with combustion (Sardoy
                                                                                                et al. 2007)
Koo, Pagni and Linn      2007               –                                                  Disc and cylinder with combustion            HIGRAD/FIRETEC wildfire model
                                                                                                                                             (Linn and Cunningham 2005; Linn et al. 2005)
                                                                                                                                                                                                  E. Koo et al.
Firebrands and spotting ignition in large-scale fires                                                             Int. J. Wildland Fire     827

Woycheese et al. 1998, 1999; Knight 2001; Knight et al. 2001;             zero acceleration, he set Eqn 1 equal to zero and established a
Woycheese 2001; Knight and Sullivan 2004). Drag forces were               good approximation of assuming that firebrands always fly at
measured during the combustion tests, to develop dynamic                  their terminal velocities.
models of firebrands. In addition to these experiments on fire-               In order to study the behaviour of objects moving at terminal
brand transport and combustion, firebrand generation and igni-            velocity, Tarifa also performed free-fall tests for various shapes
tion of recipient fuels were tested to understand firebrand               of non-burning firebrands (Tarifa et al. 1967). Tarifa’s conclu-
phenomena. In particular, the experiments done by the Illinois            sions drawn from the free-fall tests for cylinders were: (1) cylin-
Institute of Technology Research Institute (IITRI) divided fire-          ders always fall tumbling; (2) falling times of cylinders are
brand phenomena into three mechanisms: generation, transport,             of the same order as those calculated for cylinders falling in the
and ignition, and tried to cover all three topics in the 1960s            position of maximum drag, with errors of less than 10%; and
(Vodvarka 1969; Waterman 1969; Waterman and Tanaka 1969).                 (3) when cylinders are dropped in groups, there is horizontal
                                                                          dispersion, but their fall times will differ by less than 10%.
                                                                          Similar conclusions were obtained with square plates.
Spotting distance models (firebrand transport models)                         Having established a simple model for how firebrands
The study on maximum spotting distance of a firebrand should              behave in wind, Tarifa attempted to calculate the trajectories
cover several physical process, namely dynamics models of a               of firebrands lifted by a plume and transported by horizontal
firebrand, firebrand combustion in wind, flow structure of flame          wind. The structure of the convective plume induced by the fire
and plume for firebrand lofting analysis, and wind field around           determines the lofted height of the firebrand. Tarifa initially
and above the main fire. In order to simplify these coupled               used simplified plume models. The simplest plume model
physical processes, assumptions and approximations have to                was a convective column of constant wind speed, and the second
be and have been taken cautiously. They are as important as               model was the same convective column but inclined. Later, he
the theories used for the development of models. The terminal             used a convective plume model developed by Nielsen and Tao
velocity assumption, derived from wind tunnel experiment                  (1965), whose structure is shown in Fig. 9a. In each plume
observations, has been used. Another assumption is dividing the           model, he assumed that firebrands are ejected by turbulence at
firebrand’s trajectory into two stages of lofting and propagation.        random vertical positions and then picked up by a specified
    Tarifa’s work on firebrand research (Tarifa et al. 1965a,             constant horizontal wind. With Nielsen and Tao’s convective
1965b, 1967) provided many basic ideas of firebrand research              column model, the calculated trajectories of firebrands lofted
for the first time. It covered topics from experiments measuring          by convective zones of various widths (L) and determined
the drag force on burning firebrands to models calculating spot           maximum spot fire distances are shown in Fig. 9b. In these
fire distances based on burnout limits. From his experiments,             cases, firebrands are cylinders of 8-mm diameter and 24-mm
Tarifa established the important approximation that firebrands            length, and the maximum spot fire distance was found to be
travel at their terminal velocities, which became the basis of            ,2050 m with a 53 m-wide convective column. This distance
subsequent firebrand models. In establishing this approxima-              represents the maximum spotting threat of this size firebrand for
tion, he first developed two-dimensional fundamental equations            all sizes of fires. If the convective column is wider, i.e. the scale
of firebrand dynamics, shown as Eqn 1, based on a force balance           of the fire is larger, then the same size firebrand would burn out
during flight:                                                            before landing.
                                                                              Finally, from his wind-tunnel firebrand combustion experi-
       dVx    dUx    dWx 1              Wx                                ments, Tarifa observed that the density and radius histories of a
     m     ¼m     m     ¼ rs CD Ap W 2                                   small sphere or cylinder of wood at constant wind speed under-
        dy     dt     dt  2             W
                                                                   ð1Þ    going convective combustion speeds could be approximated by
       dVz    dUz    dWz 1              Wz
     m     ¼m     m     ¼ rs CD Ap W 2     mg                           the expressions:
        dy     dt     dt  2             W
                                                                                               rs
                                                                                                    ¼ ð1 þ Zt2 Þ1
where m is the mass of the firebrand, V is its absolute velocity,                              rs;o
U is the wind velocity, W is the relative velocity of the wind with                                                  !                      ð2Þ
                                                                                                 rs           b þ dW
respect to the firebrand, x indicates the horizontal direction, and                                  ¼1         2
                                                                                                                      t
z indicates the vertical direction; t is time, rs is the density of the                         rs;o            rs;o
firebrand, CD is the drag coefficient, Ap is the cross-sectional
(projected) area, and g is the acceleration due to gravity. He            where r is density, r is radius, t is time, and W is the relative wind
measured weights and drag forces acting on burning firebrands             speed. The subscripts s and o mean solid (firebrand) and initial
in a wind tunnel as functions of time. With these experimental            value respectively, and the parameters Z, b, and d depend on the
results, he derived laws of variation of the drag force and weight        species of wood and moisture content of the firebrand. It was
acting on the burning firebrands as functions of both time and            further observed from these relations that the density of the
relative wind speed. Then, using these laws, he found that the            firebrand does not depend on the wind speed, and the law of
relative velocity drops to the terminal velocity in 2–3 s, whereas        radius change is similar to that of a combusting liquid droplet.
the burning lifetime of his firebrands was of the order of                    Lee and Hellman developed a model to determine trajec-
2–3 min. He wrote, ‘Except for a brief startup period, changes            tories of firebrands in turbulent swirling natural convective
are sufficiently slow that the firebrand velocity adjusts to the          plumes (Lee and Hellman 1969; Lee and Hellman 1970). They
force balance’ (Tarifa et al. 1965a). As terminal velocity implies        developed a spherical firebrand model with constant density and
828 Int. J. Wildland Fire E. Koo et al.
(a) 2000
1800
1600
Wind velocity (horizontal)
1400
pe
(b ) 1400
f 8 mm.
) e sha
24 mm.
1200
Height Y (m)
on
1200
nz
tical
L 100
m
ctio
1000
e r
1000
v
nve
ity (
Convection zone
Vertical path Y (m)
Burning out line
for L 100 m
Co
800
eloc
800
e v
600
ctiv
L6
600 0m
onve
L 100 m
400
C
400
200
200
00 L L5
200 400 600 800 1000 1200 30 m 3m
Horizontal distance X (m) 0
0 10 20 30 40 50 60 0 200 400 600 800 1000 1200 1400 1600 1800 2000 2200
Vertical and horizontal velocities (m s1) Horizontal distance X (m)
Fig. 9. (a) Wind profile of the convective zone of Nielsen and Tao’s plume model. (b) Tarifa’s firebrand trajectories and spot distances with the convective
column model in (a). L is the width of the convective zone. From figs 31 and 32 (pp. 56–57) of Tarifa et al. (1967).
constant burning rate in a 2-D axisymmetric turbulent swirling and his experiments, a statistical model for spot fires was
convective plume. They tested their model by injecting particles developed (Muraszew and Fedele 1976). Later, a short commu-
into the vertical swirling plume generator. This experiment nication paper on the modelling of fire whirls and firebrands was
confirmed the important role of the force balance in firebrand written (Muraszew and Fedele 1977).
motion and supported Tarifa’s assumption that firebrands move In his review report (Muraszew 1974), four categories of
at terminal velocity. Their results suggested that the magnitude previous firebrand research were studied: firebrand trajectory
of the particle velocity field depends on altitude and that the models, including those of Tarifa (Tarifa et al. 1965a, 1965b,
important parameters determining a particle’s trajectory are the 1967) and Lee and Hellman (Lee and Hellman 1969; Lee and
burning rate, initial size of the particle, density of the particle, Hellman 1970), convective column modelling, modelling of
and its initial placement in the plume. Experimentally, it was piloted ignition of fuel by firebrands and growth of spot fires
also observed that flat particles are more stable in the plume than thereafter, and statistical modelling of firebrand generation and
spherical particles. Trajectories were obtained using a constant spot fire ignition. He suggested statistical approaches to model
drag coefficient for two fluid flow fields of interest in forest fire firebrand generation and ignition probability, and physical
research. One was the swirling turbulent natural convection models to characterise the transport mechanism. As a conse-
plume, which approximates the velocity field above a fire whirl quence of the review, he recommended that future research
such as those observed occasionally in large-scale forest fires. focus on: (1) establishing the generation rate and size of fire-
The other was a tilted constant-velocity convection plume. In brands as a function of fuel type and convective column
later work by Lee and Hellman (1970), they expanded the model characteristics from experiments; (2) studying the burning of
to use the empirical velocity-dependent burning law Tarifa had firebrands in flight to establish the change in firebrand mass and
reported (Tarifa et al. 1965a) instead of the constant burning size with time and dependence on initial size, fuel type, and
rate. relative velocity; (3) exploration of recipient fuel ignition
Muraszew of the Aerospace Corporation in California stu- criteria as a function of firebrand characteristics; and (4) char-
died firebrand phenomena in the 1970s and published a series of acterisation of fire whirls in simple terms.
reports (Muraszew 1974; Muraszew et al. 1975; Muraszew and Muraszew reproduced Tarifa’s wind-tunnel experiments on
Fedele 1976, 1977). He reviewed the firebrand research that burning firebrands (Tarifa et al. 1965a) and Lee and Hellman’s
had been done before 1973 (Muraszew 1974) and performed vertical-channel fire-whirl structure tests (Lee and Hellman
firebrand burning tests in a horizontal wind tunnel and experi- 1969) using tangential boundary-layer inlets (TBLI) as forced
ments on the structure of fire whirls in a vertical channel using air-swirl inducers (FASI) (Muraszew et al. 1975). His results
wood cribs (Muraszew et al. 1975). Then, based on the review showed that the burning law for firebrands is a relationshipFirebrands and spotting ignition in large-scale fires Int. J. Wildland Fire 829
similar to first-order wood pyrolysis, i.e. the regression rate trajectories in the three regions and for burning laws determined
of the diameter of a burning cylinder is linearly proportional to from experiments for firebrands of cylindrical and flat plate
the wind velocity. This combustion model for burning cylinder shapes.
firebrands was later adapted by Albini (Albini 1979) and is Albini developed a predictive model of spot fire distance
stated as follows: (Albini 1979) for firebrands emitted from torching trees. The
model was later extended to apply to firebrands emitted from a
d
ðr dÞ ¼ Kra W ð3Þ line thermal source (Albini 1981a, 1982), such as those produced
dt s in wind-driven surface fires (Albini 1983a, 1983b), as well as
those produced from isolated sources such as burning wood piles
where r is the density, d is the diameter, W is the relative wind (Albini 1981b); it was originally developed for field use with
speed, which is terminal velocity under the terminal velocity calculators and simplified nomogram solutions (Albini 1979),
assumption, and t is the time. The subscript a means air, and but it was later incorporated into BEHAVE (Andrews 1986) and is
s means solid (firebrand). K is the constant dimensionless now used, as shown in Fig. 10, within BEHAVEPLUS (Andrews
regression rate, which was determined to be 0.0064 from his 1986; Andrews and Chase 1989) and FARSITE (Finney 1998).
33 wood combustion tests using combinations of 127-mm The model is built on six submodels: the flame structure
(5 inch) long 12.7- or 25.4-mm (0.5 or 1 inch) diameter model, the model of a buoyant plume above a steady flame,
cylinders in 4.5- or 6.7-m s1 (10 or 15 miles h1) wind. In the firebrand burning rate model, the lofting of firebrands by
addition to this combustion model, he observed glowing com- the flame and buoyant plume model, a model for surface wind
bustion on the windward side of the firebrands rather than over rough terrain, and the firebrand trajectories model. These
flaming combustion and thus concluded that most firebrands submodels are used in the steps of the worksheet as summarised
in real fires will be in a state of glowing combustion when they below.
reach the ground.
In Muraszew’s third report (Muraszew and Fedele 1976), 1. Description of trees that produce firebrands: the species,
he developed a statistical approach to spot fire prediction to diameter and height of trees, and the numbers of burning
account for firebrands’ random behaviour, as he had previously trees.
recommended (Muraszew 1974). Spot fires were divided into 2. Flame height and duration: from tree properties, the flame
two classes: short-range spot fires due to firebrands lofted by a height and the time of steady burning of tree crowns are
convective plume and long-range spot fires due to firebrands evaluated through tabulated experimental data.
lofted by a fire whirl. Actually, this classification was suggested 3. Adjustments to flame information: adjustment factors of
before Muraszew (Berlad and Lee 1968). For both cases, their the flame height and steady burning time due to the number
report provides analytical and empirical formulae giving fuel of trees are obtained from nomograms. The flame height
characteristics, trajectories related to lofting mechanisms and increases and the steady burning time decreases as the
firebrand generation under the assumptions based on the review number of trees increases.
and experiments. A firebrand generation function, giving the 4. Maximum firebrand launching height: half of the tree height
probability Fd that a particular size of firebrand will be lofted out is added to the lofted height of the firebrand because the
of the fire was developed for both cases. The function depends flame base is assumed as the middle of the tree. The burning
on the intensity of the lifting mechanism and on the fuel rate model of a firebrand based on experiments by Muraszew
characteristics, such as the size and density of firebrands and et al. (Muraszew et al. 1975; Muraszew and Fedele 1976) is
the intensity and degree of completion of burning of the fuel. It is involved in this calculation.
stated as 5. Wind-speed adjustment: the wind is modelled horizontally
and a logarithmic function of height, so the wind speed
Fd ¼ 1 expðKðUz;o =Vter Þ2 1Þ ð4Þ measured at any reference height is converted to the wind
speed at the mean tree-top (canopy) height. Drag effects by
where K depends on the fuel model, varying from 0.0005 to the trees (in addition to the ground) are not considered.
0.005, Uz,o is the vertical wind velocity at the core base of the 6. Maximum spot fire distance over flat terrain: this is obtained
convection column or fire whirl, and Vter is the firebrand from the nomogram as shown in Fig. 11, using three factors
terminal velocity within the column or fire whirl. Reasonable as inputs: the maximum initial firebrand height from the
values of Fd were recommended to be 0.001 to 0.02 for fourth step, the mean tree-top height, and the wind speed at
convection columns and 0.01 to 0.4 for fire whirls. Later, the mean tree-top height.
Muraszew and Fedele wrote a short communication paper on
how to model fire whirls and firebrands (Muraszew and Fedele Albini’s model is the operational spot fire model, as
1977) where he presented calculations on the trajectories of it is incorporated within BEHAVEPLUS and FARSITE. In
long-range firebrands lofted by fire whirls. He divided the flow BEHAVEPLUS, Albini’s model solves for the maximum spot
field into three regions: the fire whirl core characterised by solid fire distance and returns the result. However, FARSITE uses it to
body rotation, the ambient swirl around the core characterised model the initiation of spot fires that will then spread contigu-
by constant angular momentum, and above the core and swirl ously in the given terrain, so a user needs to input an ignition
zone where the main force carrying the firebrands aloft is the probability. The idea that ignition frequency can be expressed in
ambient wind. Equations were then briefly introduced for the form of a probability function of factors such as temperature,830 Int. J. Wildland Fire E. Koo et al.
(a) Spotting worksheet (b) Spotting from torching trees
Input Wind speed
Ember
1 Torching profile
tree (A) (D) burnout
height (feet) (A) Vertical lofting
2 time
Plume height
(B)
2 Torching
tree
(A) (C) (B) (C) (E)
species NOM. 1 (B)
Flame Ratio of NOM. 3 (E)
height (feet) tree height
3 Torching to flame
Ratio of lofted Transition zone
firebrand height
tree NOM. 2 height
to flame height
DBH (inches)
Flame
duration (D) (E) Flame height
4 Torching If forest is open, Maximum 20-foot wind speed
tree divide by 2, firebrand
cover otherwise retain height
height full height
(feet)
Effective tree NOM. 4
cover height (feet)
Output
5 Wind speed
at 20-foot
height (F) (F) 2/3
1 Treetop
(miles h ) Maximum
wind speed spotting
(miles h1) distance Maximum spotting distance
(m)
Fig. 10. (a) Spotting worksheet from Fireline Handbook Appendix B: Fire Behaviour (p. B-9) of National Wildlife Coordinating Group (2006); (b) concept
diagram of spotting from torching trees in Albini’s spotting distance model, screenshot of BEHAVEPLUS program help menu.
Mean treetop height 10 m
(uniform forest cover)
20
Wind speed (km h1)
treetop height 60 50 40 30 20 10
40
60
3.0 2.5 2.0 1.5 1.0 0.5 0 100 200 300 400
Maximum spot fire map distance (km) Initial firebrand height above ground (m)
Fig. 11. Nomograph for predicting maximum spot fire distance over flat terrain. From fig. 8b (p. 14) of Albini (1979).
humidity and fuel moisture content, is justified by many particle regression rate was then developed in terms of the
researchers (Blackmarr 1972; Bunting and Wright 1974; Reynolds number (Re) and mass transfer numbers (B). The
Bradshaw et al. 1984). However, there is no functional model predicted dependence of the regression rate on these parameters
for ignition frequency yet, so the user simply inputs a percentage agreed qualitatively, as Kinoshita and Pagni had found pre-
representing the best estimation of the ignition probability. viously (Kinoshita et al. 1981) with experimental observations
Fernandez-Pello developed a theoretical combustion model for droplets vaporising and burning in forced convection.
for firebrands, whereas empirical combustion models had been Firebrands can be produced from other sources besides
applied in the firebrand models reviewed above (Fernandez- fires. A power line can produce small firebrands, causing spot
Pello 1982). He analysed forced convective burning of fires. Tse and Fernandez-Pello provided an analysis of this
spherical PMMA (polymethyl methacrylate) particles using problem and developed a predictive, numerical model to
boundary-layer and flame-sheet approximations to describe calculate trajectories, combustion rates, and lifetimes of metal
the reacting flow. The governing boundary layer equations were particles and burning embers of different sizes (Tse and
solved, and profiles of the velocity, temperature and species Fernandez-Pello 1998). High winds can cause power cables
distributions normal to the particle surface were presented, to come close enough together to arc or collide with trees and
along with local mass burning rates, for a series of values of produce metal sparks or burning embers. Then they are carried
the azimuthal angle. A valuable explicit expression for the by the wind and land in adjacent areas of dry vegetation toFirebrands and spotting ignition in large-scale fires Int. J. Wildland Fire 831
(b)
(a) Wind
distribution Particle trajectory
12 12
9 10 10
Height (m)
Height (m)
8 8
6 6 6
z on 4 4
ecti
W ind dir 2 2
3
0 0
4.0 0 20 0 5 10 15 20 25
0 Wind speed
1.2 3.2 1 Distance (m)
0.9 2.4 (m s )
0.6 1.6
y 0.3 0.8 0.5 mm 1 mm 1.5 mm 2 mm
0 0 x
(c) (d) Wind
Wind distribution Firebrand trajectory
distribution Particle trajectory 12 12
12 12
10 10
10 10
Height (m)
Height (m)
8
Height (m)
8
Height (m)
8 8
6 6 6
6
4 4 4
4
2 2 2
2
0 0 0
0
0 20 0 5 10 15 20 25 0 20 0 10 20 30 40 50 60
Wind speed Wind speed
Distance (m) 1 Distance (m)
1
(m s ) (m s )
0.5 mm 1 mm 1.5 mm 2 mm 2 mm 5 mm 10 mm 20 mm
Fig. 12. Tse and Fernandez-Pello’s firebrand trajectories. (a) Copper particle trajectories at various ejection angles, 1.5-mm diameter particles, 14.3-m s1
(30 miles h1) wind speed. (b–d) Particle trajectories for various initial particle diameters, 14.3-m s1 wind speed: (b) copper; (c) aluminium; and (d) wood.
From figs 3–6 (pp. 348–351) of Tse and Fernandez-Pello (1998), reproduced with permission.
initiate brush or grass fires. To investigate problem, both metal flame and plume zones. The dimensionless centreline velocity,
and wood firebrands were launched at the power-cable height U*p, for the three regions of dimensionless height z* is:
of 10 m and carried by a 14.3-m s1 horizontal wind (30 miles
h1) with a 10 m-thick ambient boundary layer, as shown in Upn ¼ 2:13ðzn Þ1=2 ; zn 1:32 ð5aÞ
their results in Fig. 12. Three distinct cases were studied: (1)
hot particles produced by arcing copper power lines; (2) Upn ¼ 2:45; 1:32o zn 3:3 ð5bÞ
burning sparks produced by arcing aluminium power lines;
and (3) burning embers produced by the collision of high-
voltage power lines with surrounding trees. The results show Upn ¼ 3:64ðzn Þ1=3 ; zn 3:3 ð5cÞ
that the distances reached by wood firebrands were the great-
est, followed by aluminium, and then copper owing to combus- p ¼ Up /Uc, z* ¼ z/zc and
where U*
tion effects on the trajectories. The copper particles, because _ 2 1=5
they were not burning, maintained constant mass, so were not Qo g
Uc ¼
blown as far, and cooled down quickly, though they could still ra cP T1
carry significant heat to their areas of impact. The aluminium 2=5 ð6Þ
Q_ o
particles could burn or blow out while in flight, but could also zc ¼ pffiffiffi
travel further than copper particles as their mass decreased. ra cP T1 g
Burning embers could travel the furthest without extinction but
also carried less heat than the metal particles. This study was Here Q_ o is the rate of heat release for the fire and ra, cp, TN and
later expanded to spheres, discs and cylinders of burning wood g are the ambient density, specific heat, temperature and accel-
firebrand (Anthenien et al. 2006) with the McCaffrey plume eration due to gravity respectively. By comparing the maximum
model (Baum and McCaffrey 1989). upward drag force with the gravitational force for firebrands of a
Woycheese and Pagni modelled the lofting of firebrands in a given size, they obtained a maximum loftable size where these
convective plume, calculated maximum propagation distances two values are equal. They found that the maximum loftable
for lofted firebrands, and conducted wind-tunnel tests on burning initial diameter is given by d*o,max E 2/r*o, where d* and r* are
firebrands (Woycheese 1996, 2000; Woycheese et al. 1998, the firebrand diameter and air density, non-dimensionalised
1999). For their first paper (Woycheese et al. 1998), they with characteristic height zc and firebrand density rs. In dimen-
modelled rising spherical and disc firebrands using the Baum– sional terms,
McCaffrey plume model (Baum and McCaffrey 1989) and
showed that there is an upper limit to the size of a loftable 2=5
ra r Q_ o
firebrand. The Baum–McCaffrey model divides the vertical flow do;max 2 zc ¼ 2 a pffiffiffi ð7Þ
field into three sections corresponding to the burning, intermittent rs rs ðra cP T1 gÞ832 Int. J. Wildland Fire E. Koo et al.
The maximum height to which non-burning spheres can rise was the development of a statistical spot fire model (Colin et al.
calculated by finding the height at which the decaying plume 2002). To understand the complexity of the firebrand phenom-
velocity equals the firebrand’s terminal velocity. For CD E 0.45 enon, a statistical survey of 245 extinguished fires, experiments
as a drag coefficient, the maximum height was found to be and simulations, and monitoring of 48 wildfires to collect data
z*max ¼ 9.5(r*od*o)1.5, which in dimensional terms is: were performed. The SALTUS work showed that spot fires are a
very frequent phenomenon in southern Europe and that spot fire
ra 1:5 Q_ o distances can be very large. In their results, 56% of the studied
zmax ¼ 9:5 pffiffiffi ð8Þ fires showed one or more spot fires at a distance of more than
rs do ra cP T1 g
10 m, in 32% of the fires, one or more spotting ignitions occurred
at a distance of more than 100 m, and 8% of fires were observed
Using the droplet-burning model (Turns 2000) for the combust- to have spotting distances of more than 500 m. The observed
ing spherical firebrand regression rate, they calculated burnout average spotting distance was 228 m. The longest spotting
heights. Furthermore, they found a collapse at the large end of distance was observed as 2.4 km.
the initial firebrand size distribution. All firebrands greater than Porterie et al. used a statistical approach based on the small-
a collapse diameter have the same burnout height, which is world network theory (Porterie et al. 2007). They proposed a
z*b ¼ 56 for d*o 4 4000 and r*o ¼ 1/7600. forest fire spread model that includes short-range radiative and
In their second paper (Woycheese et al. 1999), maximum convective effects from flames as well as the long-range spot-
propagation distances were defined as the maximum distance ting effects of firebrands, which are considered by introducing a
achievable while a firebrand is still burning. The maximum characteristic spotting distance. For a homogeneous fuel system,
propagation distance was found as a function of Q_ o , Uw and they found that development of spot fires can slow down the
wood type, or b, indexed by overall fire propagation process. Spread rate and burned area
2=5 were significantly reduced as the degree of disorder increased
ra 1 for heterogeneous systems. The influence of the firebrands then
b ¼ 4:46 pffiffiffi ð9Þ
rs ra cP T1 g became weaker. Recently, Sardoy et al., from the same group in
Marseille, France, modelled transport of a firebrand from a
For instance, cedar firebrands (b ¼ 1), lofted by fires with Q_ o ¼ crown fire (Sardoy et al. 2007).
1 MW, 50 MW and 1 GW in 10 m s1 wind, travelled a maximum A 3-D physics-based model (Porterie et al. 2005) was used to
of 49, 290 and 1100 m respectively, before landing at burnout. pre-compute the steady-state gas flow and thermal field induced
Firebrands between a collapse diameter of dcol ¼ 0.49Q_ o0:269 b0:782 by a crown fire. The thermal degradation and combustion of
and a maximum loftable diameter of do,max ¼ 0.454bQ_ o0:04 woody fuel particles were studied to determine the burning
propagated the same maximum distance. The increased burning characteristics of firebrands. Firebrands were determined
time inherent in larger firebrands was cancelled out by an whether they were flaming or in glowing states based on the
product of rwof t (rf , initial firebrand density; t, firebrand
wo
increased time of flight because larger firebrands move more
slowly. Hence, only firebrands with 0 d dcol need to be thickness) for disc firebrands. Results show that for the fire-
studied for a given Q_ o , Uw and b. brands that remain longer in the thermal plume, the distance
Woycheese’s PhD dissertation (Woycheese 2000) develops covered on landing is independent of the initial diameter and
correlates well with I0.1U0.9 wind(rf t), where I is the fire
wo
analytical combustion and propagation models and presents data
from over 500 wind-tunnel tests on burning firebrands. For the intensity and Uwind is the wind speed. The normalised firebrand
analytical portion, lofting and propagation of spherical and disc- mass fraction on landing was obtained as the correlation with
shaped firebrands were determined numerically with two com- flight time normalised with (rwo f t) for flaming firebrands, and
for glowing firebrands with rwo f Do , where Do is initial
5/3
bustion models: spherical firebrands based on droplet burning,
and disc-shaped firebrands based on opposed flow diffusion firebrand diameter.
flame analysis (Kinoshita et al. 1981) for the surface combustion Whereas the firebrand models reviewed above considered
of disc firebrands. Maximum dimensionless propagation dis- a single firebrand, next two studies concerned multiple fire-
tances were then provided as functions of ambient, fire and brand trajectories with the consideration of turbulence in
firebrand properties. Disc-shaped firebrands were found to have fires. Himoto and Tanaka (2005) numerically modelled the
greater propagation distances; spherical firebrands can travel scattering of non-burning disc firebrands in a turbulent
,1.1 km from a 90-MW fire, whereas disc firebrands with a boundary layer produced by a large eddy simulation (LES)
thickness-to-diameter ratio of 1 : 10 can be transported 7.9 km. model. In their simulations, the firebrand diameters varied
Woycheese concluded that discs approximate firebrands gener- from 0.4 to 1.2 mm and the thickness varied from 0.04 to
ated from roof and siding shakes and shingles, so there is a ready 0.12 mm. The computational domain was 2.48 m long 1.0
source for these far-travelling firebrands in wildland–urban m high 1.0 m wide. The density of the firebrands was
interface (WUI) fires. Woycheese’s PhD dissertation work also varied as 50, 100, and 150 kg m3. One of the simulation
contains firebrand combustion tests in the wind tunnel and this is results is shown in Fig. 13. The purpose of their simulation
discussed in the next section. was for comparison with their non-dimensional model; thus a
From 1998 to 2001, a European project titled the SALTUS rather small scale of computational domain was chosen.
program, involving scientists from five Mediterranean countries Then, a scaling dimensionless parameter B* for the firebrand
(France, Greece, Italy, Portugal and Spain) was carried out for transport was derived as Eqn 10:You can also read