Roadmap to the deployment of offshore wind energy - in the Central and Southern North Sea (2020 - 2030)
←
→
Page content transcription
If your browser does not render page correctly, please read the page content below
Roadmap to the
 deployment of
  offshore wind
         energy
    in the Central and
  Southern North Sea
         (2020 – 2030)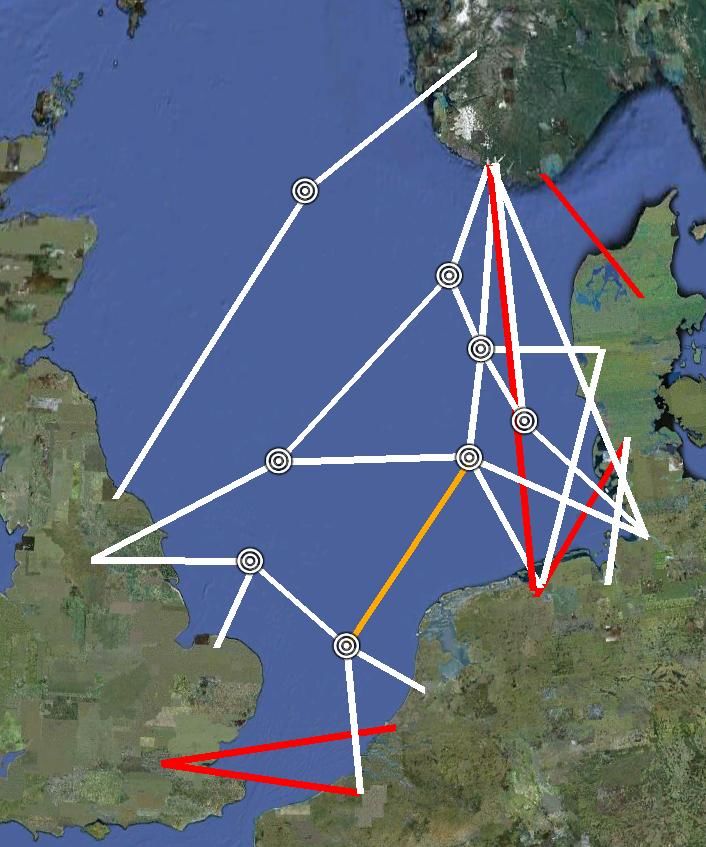

Roadmap to the deployment of offshore wind
   energy in the Central and Southern North Sea
   (2020 - 2030)

   Karina Veum (ECN)
   Lachlan Cameron (ECN)
   Daniel Huertas Hernando (SINTEF)
   Magnus Korpås (SINTEF)

   Printing:        RICOH
   Photos:          www.flickr.com      (Cover page. Users:dingbat2005, adstream, extrajection, crawfish_head,
                                        royaldutchshell, 8929612@N04, oneeighteen. Used under non-commercial non-
                                        derivative Creative Commons attribution licences
                                        www.creativecommons.org/licenses/by-nc-nd/3.0/)
                    Alpha Ventus        (Cover page)
                    C-Power             (p11)
                    Vattenfall          (p19)
                    Dong Energy         (p21)
                    Eurocopter          (p21)
                    BARD Group          (p22)

The sole responsibility for the content of this report lies with the authors. It does not necessarily reflect the
opinion of the European Communities. The European Commission is not responsible for any use that may be
made of the information contained therein.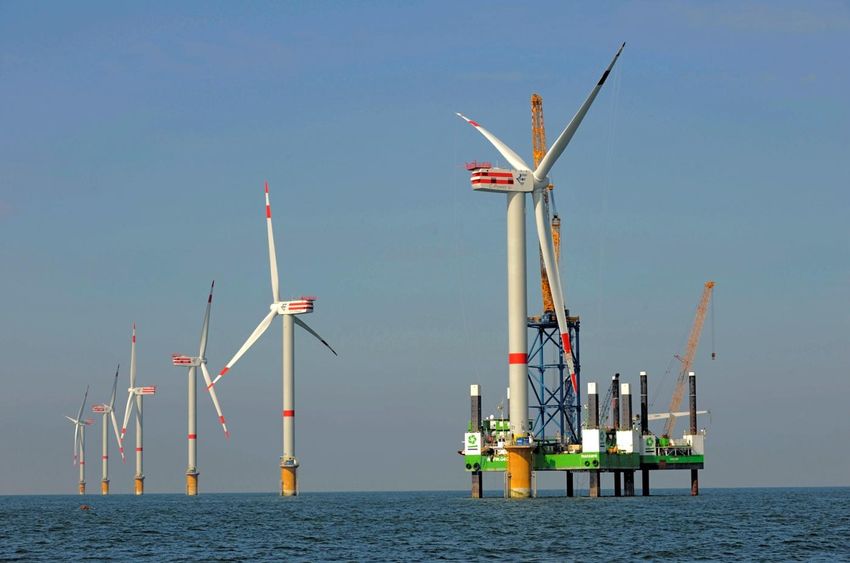
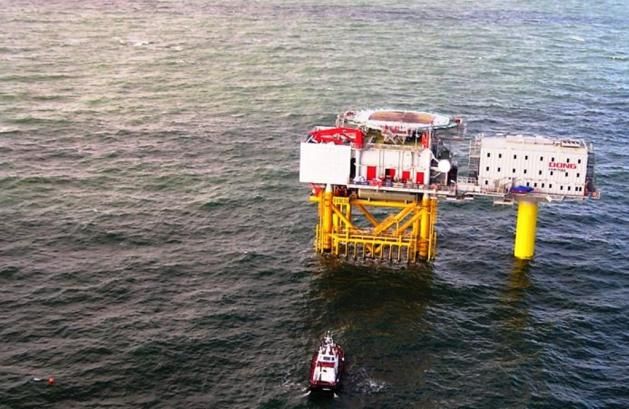
Table of contents

Executive summary                                              2
1   Introduction                                               5
     Rationale – why a Roadmap to offshore wind deployment?    5
     Approach                                                  7
     Stakeholder involvement                                   8
     Roadmap structure                                         8
2   Point of departure                                         9
     Current developments                                      9
     Targets and ambitions                                    10
     Maritime Spatial Planning and conflict management        11
     Support mechanisms                                       12
     Grid and market integration aspects                      14
     In summary                                               15
3   Challenges and Opportunities                              16
     The North Sea and its dynamic users                      16
     Technology and costs                                     20
     In summary                                               23
4   Looking ahead                                             24
     How much space is there?                                 24
     Where can we go?                                         27
     Sharing the sea                                          30
     Connecting the power                                     31
     What are the costs?                                      34
     How can we get there?                                    35
     Key findings                                             37
5   Paving the way for offshore wind deployment               38
     Roadmap “destination”                                    38
     Enabling policy initiatives                              38
     Actions and milestones                                   43
6   References                                                46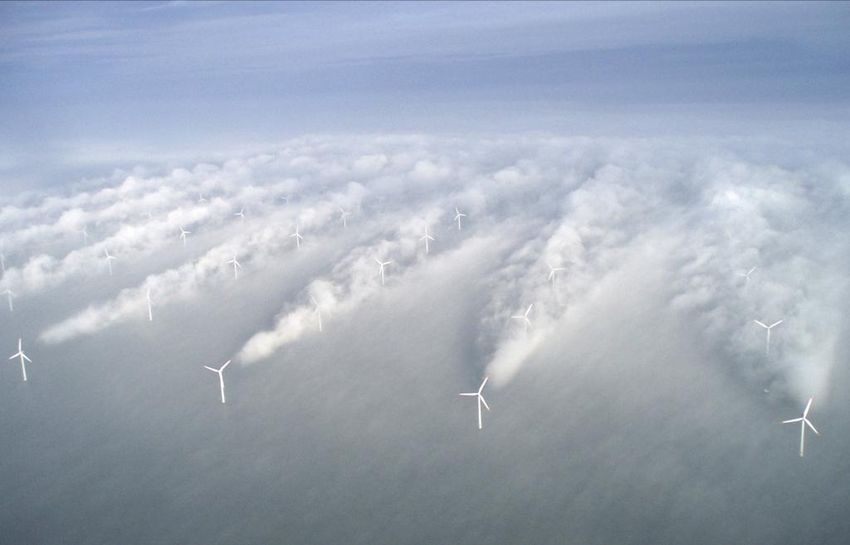
Executive summary
This Roadmap represents the final deliverable of the WINDSPEED project. It has a dual objective. Firstly,
it aims to present an ambitious but realistic target for offshore wind with minimum negative impacts on
other sea functions present in the Central and Southern North Sea basin in the time frame to 2030.
Secondly, it aims to identify actions and milestones required to achieve this target.

The North Sea countries – Belgium, Denmark, Germany, the Netherlands, Norway and the UK – are
facing a number of challenges and opportunities in their quest for rapid expansion of offshore wind
energy in the Central and Southern North Sea basin. The WINDSPEED project has carried out an
assessment of (ambitious but realistic) deployment potentials under different scenarios to gain better
insight into how key uncertainties can impact on OWE developments. An early understanding of how
different development perspectives influence challenges and opportunities, as well as uncertainties, will
allow for better adaptation of policies and approaches to promote large scale offshore wind energy
(OWE). This is particularly important at a time when OWE is strongly driven by EU and national policy
needs in attempting to reach overall policy goals of a competitive, secure and sustainable energy
system.

There is ample space in the Central and Southern North Sea. But many attractive areas for developing
OWE within reasonable cost ranges are already occupied by other sea users. Moving OWE further from
shore and into deeper waters not only drives costs up, but also raises the issue of the availability of deep
sea technology components and the need for an offshore grid. To date, the North Sea countries will
have developed a capacity of around 2 GW in the North Sea. It has taken a decade to get this far.
Important lessons are being learnt and these must be taken into account in the development of OWE
towards 2030.

The WINDSPEED project concludes that a capacity of 135 GW of OWE in the Central and Southern North
Sea is feasible by 2030. Assuming that the NREAP projections of around 32 GW for the six North Sea
countries involved are achieved in 2020 (this also includes developments in additional sea basins), a
capacity of 135 GW in the Central and Southern North Sea basin implies a growth of more than 100 GW
in the time frame 2020 - 2030. Due to long lead times in developing offshore wind projects, changing
the current pathway in the period up to 2020 may be difficult. This is, however, not the case for the
period 2020 - 2030. A development of this magnitude will clearly require a different approach and policy
framework regarding OWE deployment than what we see today.

To achieve 135 GW OWE in the Central and Southern North Sea by 2030, countries must be willing to
both increase spatial prioritisation to OWE (closer to shore) and establish an offshore grid. In order to
do so, greater coordination between countries is necessary.

The final WINDSPEED recommendations – consisting of key actions, milestones and which stakeholders
should take the lead in following up the necessary actions to achieve 135 GW of OWE by 2030 – are
summarised as follows:

                                                                                                          2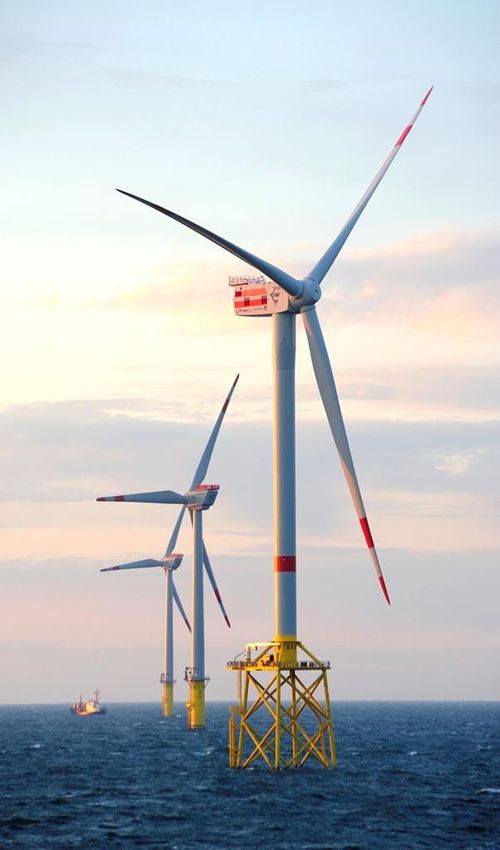
Short term (to 2015)                                             Medium term (2016 – 2020)                                              Long term (2020 – 2030)
support schemes

                         Extension of current approach with national binding RES targets &
 Ambitions and

                                            NREAPs to 2030 (or beyond)
                             Set up stable and long-term economic incentives for OWE
                                     investment & grid infrastructure build-up.

                                                                      Implement cooperation mechanisms in the context of offshore wind parks

                                        Examine MSP with respect to co-use, compromise, and clustering of OWE as well as cumulative effects.
Maritime spatial

                                                                            Continued designation of suitable areas for OWE deployment, preferably in a consecutive manner
   planning

                                          Establish a transnational MSP forum for the joint analysis of future spatial demands in the North Sea

                         Establish policy guidelines to encourage streamlining of new zones
                                                        for OWE

                            Planning for T-connections as first steps in move towards a
                                     transnational fully meshed offshore grid                                                                                          Key as to who should take a leading role:
                                                                                                                                                                             European Commission
                          Construction of T-connections and upgrades into multi term VSC
                                                 HVDC solutions                                                                                                              National governments/ACER
                                                                                                                                                                             TSO/ENTSO-E
    Grid configuration

                          Coordination between link developers (typically TSOs) and wind
                               farm developers at early stages of the development
                                                                                                                                                                             Industry

                                                         Planning for transnational clustering & transnational coordinated development of grid infrastructure
                                                                           projects to allow for flexible and harmonized technical standards

                                                                      Establish a dedicated transnational regulatory framework for offshore grid

                                                        Pilot schemes to test possible solutions with a view to establishing long term changes in the regulatory
                                                                                      framework for establishing an offshore grid

                                   Facilitate and provide funding to offshore grid projects, which are considered to be projects of European interest.

                                                                Dedicated and simplified demonstration programme for offshore renewable technologies in Member States and at EU level
    R&D

                                                   Increased use of Public Private Partnerships to encourage demonstration projects.

                                                                                                                          Standardised and scalable solutions combining HVAC, LCC HVDC and VSC HVDC
4
1       Introduction

A Roadmap is a dynamic and responsive plan, consisting of three key elements – a starting point, a
destination and a route description – often triggered by the need and the will to follow a better
pathway than the current one. This chapter gives a brief introduction to the rationale behind and
structure of this WINDSPEED Roadmap, the approach taken to develop it and the involvement of
stakeholders in doing so.

Rationale – why a Roadmap to offshore wind deployment?
Offshore wind energy (OWE) is a newcomer to the sea, and many argue that it will play a key role in
moving towards a sustainable energy system in Europe in 2020 and beyond. The EU energy system is
challenged by global climate change threats, increasing dependency on energy imports as well as
threats of supply disruptions from countries outside the EU. Faced with these challenges, the EU
recently established a policy framework which includes a target of 20% share of renewable energy
source (RES) by 2020.

OWE deployment is foreseen to expand dramatically in the years to come. This expansion is strongly
driven by EU and national policies that aim to provide a low-carbon and reliable energy system. The
European Commission anticipated, in its 2008 Communication on offshore wind energy (EC, 2008),
that “Offshore wind can and must make a substantial contribution to meeting the EU's energy policy
objectives through a very significant increase — in the order of 30-40 times by 2020 and 100 times by
2030 — in installed capacity compared to today”. The installed offshore wind capacity in Europe by
end of 2008 was 1.5 GW. A hundredfold increase implies 150 GW by 2030. This target has also been
presented by the European Wind Energy Association (EWEA, 2009).

OWE is more complex and costly than onshore wind. However, due to a combination of better wind
resources and larger turbines, it provides higher energy yields. In addition, the sea offers more space
and less public resistance. The latter is an increasing problem for wind energy onshore. Successful
deployment of large scale OWE in the coming years requires additional preparation and adaptation of
the current policy framework. In order to do this it is necessary to understand the constraints (spatial,
policy, growth, grid and market integration) on the realistic potential for OWE in a given sea basin, in
this case the Central and Southern North Sea. This is a precondition for designing transparent, stable
and favourable framework conditions in order for OWE to fully develop its realisable potential. These
are key focus areas of the WINDSPEED project.

The Central and Southern North Sea is an attractive sea basin for large scale deployment of OWE, and
a hotspot for past and ongoing developments in offshore activities in general. At a first glance, the
North Sea wind resources seem abundant. The available wind resources could potentially fulfil a large
share of the ambitious EU 20% renewable energy target to be achieved by the European Member
States by 2020. At the same time, there are increasing pressures on this marine environment as more
uses are being introduced and current uses are being expanded. Large OWE projects are in the
pipeline and countries surrounding this sea basin are, to some extent, speeding up planning activities
in an attempt to find viable locations for development. However, the overall management of this sea
basin is still somewhat fragmented, nationally focussed and rarely steam-lined in terms of timing.

The Central and Southern North Sea basin is one of the busiest seas in the world. It is surrounded by
densely populated and highly industrialised countries such as Belgium, Denmark, Germany, the

                                                                                                       5
Netherlands, Norway and the United Kingdom. Major activities in the North Sea include shipping,
fishing, sand and gravel extraction, military activities and offshore energy related activities such as the
exploitation of oil and gas reserves including the laying of cables and pipelines. The North Sea has
numerous ports and harbours situated on its coasts, including two of the world's largest ports -
Rotterdam and Hamburg. The North Sea is frequently traversed with many dense shipping lanes,
particularly in the Southern part of the North Sea. Generally, there is an increase on pressures on
marine space and many parts the sea basin are strongly congested, especially near shore1.

                                                                                    200
                                                                                    180
                                                                                                  > 50m depth
                                                                                    160
                                                                                                  30 - 50m depth

                                                         Size of sea basin (km2)
                                                                                    140
                                                                                                  < 30m depth
                                                                                    120
                                                                                    100
                                                                                     80
                                                                                     60
                                                                                     40
                                                                                     20
                                                                                       0
                                                                                             BE       NL        DK   UK      NO       DE

Figure 1: WINDSPEED study area and countries                                       Figure 2: Size of sea basin by country and depth

                                     2
    Country        Sea basin size (km )   Key characteristics
    Belgium              3 400            Small and densely used area. Very little room for further development of OWE.
    Denmark              56 600           One of two sea basins belonging to Denmark, but holds the majority of OWE
                                          opportunity. Fairly large coastline and areas of shallow waters.
    Germany              38 400           One of two sea basins belonging to Germany but much larger than the German
                                          Baltic Sea basin. Compared to North Sea neighbours, it is relatively small and fairly
                                          congested, including IMO shipping lanes and major nature reserves.
    Netherlands          58 900           Quite congested areas, in particular closer to shore, including important IMO
                                          shipping lanes. Fairly shallow waters
    Norway               84 500           For a large part deep waters, average water depth of over 100m
    UK                  192 400           Largest area of the six countries, water depth increases with distance from shore
Table 1: Key characteristics of each country’s EEZ (in Central and Southern North Sea)

At a time when OWE is strongly driven by EU and national policies, and pressures on marine space are
increasing, an early understanding of how driving forces can impact on opportunities, challenges and
future trends will allow for a better adaptation of policies to promote a greater deployment of OWE.
This merits a more in-depth and detailed analysis of the different parameters that relate to
competition for sea space and the cost of OWE. This is a key motivation behind the WINDSPEED
project. The WINDSPEED project, funded under the Intelligent Energy for Europe programme, has
taken a closer look at the potentials for OWE in the Central and Southern North Sea. To do this, it has
developed a methodology for an integrated assessment of how various constraints – spatial, policy,
growth, grid and market integration – impact on deployment potentials.

1
    There is no clear cut definition of what is meant by near shore. In the WINDSPEED project, use of the term near shore
    includes the areas which are currently planned for OWE deployment.

                                                                                                                                           6
Approach
This Roadmap has been developed in four phases:
Phase I: Information on different sea uses and their geographical presence in the North Sea was
collected and harmonised. Sea uses comprise fisheries, oil and gas extraction, sand
extraction, shipping, cables and pipelines, existing and planned OWE, military activities,
nature conservation, and marine wildlife preservation. Taking stock of the current and
future presence of sea uses is a prerequisite for an assessment of the potential for further
development of OWE. Datasets on, amongst others, average wind speeds, wave regimes,
bathymetry, staging port locations, were used to determine the levelised production cost
(LPC) of OWE. Finally, this phase also included the definition of calculation rules to allocate
space between OWE and other sea use functions.
Phase II: Datasets and calculation rules from phase I were incorporated into a so-called Decision
Support System (DSS). Such a tool, developed for maritime spatial planning purposes, uses
geographical information system (GIS) software which allows for the spatial representation
of offshore wind energy in relation to costs and presence of non-wind sea use functions.
Phase III: Four different scenarios were then developed (illustrated in Figure 3) to study how OWE
might develop in the time frame to 2030 under different constraints and priorities. The
resulting feasible growth of OWE was modelled for each of the scenarios in order to
account for the fact that not all of the North Sea’s vast potential for OWE will be realised,
the lowest cost areas are most likely to be developed first and growth will be dependent on
support policies in each country.
Phase IV: The last phase incorporated all results into a final Roadmap, which identifies an ambitious
but realistic target for OWE deployment in the Central and Southern North Sea, and a set of
policy recommendations on how to achieve this target.
In assessing the potential for offshore wind deployment, an important distinction was made between
the time period up to 2020 and the time period 2020 - 2030. The scenario analysis has assumed an
implementation of the NREAP projections for OWE in the Central and Southern North Sea countries
involved by 2020, and focused on an assessment of additional space for OWE deployment for the time
period 2020 - 2030.
Scenarios have been chosen to
reflect different aspects influencing
OWE deployment, such as OWE
ambitions in 2030, priority given to
OWE over other sea use functions,
constraints on costs, and attention
to international, cross-border
synergies. These are described in
more detail in Chapter 4. The
different development perspectives
and their corresponding pathways
can help to identify what policy
framework is needed to match the
chosen OWE deployment ambition
Figure 3: WINDSPEED scenarios
7Stakeholder involvement
‘Stakeholders’ generally refers to different parties who have a vested interest (or 'stake') in decisions
being taken. In the context of the WINDSPEED project, there are numerous stakeholder; the offshore
wind industry – including manufacturers, developers and various companies involved in the processing
chain; policy makers; regulators; TSOs; as well as all those representing other sea uses. Their interests
relate to decisions on where, when and how much OWE can be developed.
Stakeholders have been involved in each step of the WINDSPEED process, primarily through
stakeholder workshops organised as part of the project as well as through numerous dissemination
events. Feedback from stakeholders has focused on two aspects. Firstly, in establishing the DSS, and,
secondly, the approach taken that includes the application of the DSS to address opportunities for new
deployment areas for OWE. The stakeholders have assisted in bringing to the surface key issues with
respect to further developments in OWE and other sea uses, such as the potential synergies between
OWE and oil & gas. An aspect that is, however, difficult to take into account in the planning of new
areas for OWE since details of decommissioning plans are often not fully disclosed. Another important
issue raised was the important of health and safety as well as collision risks in determining safety and
buffer zones. With large scale deployment of OWE on the horizon, many stakeholders are concerned
about the impact of OWE in a sea basin which already accommodates numerous economic related
activities and at the same time is home to a rich biodiversity. Care was taken by the WINDSPEED team
when designing the DSS and scenario analysis to allow for such concerns to be addressed.
Roadmap structure
This Roadmap is structured as follows:
Chapter 2 presents the “starting point” for further analysis of OWE potentials in the Central and
Southern North Sea. It gives an overview of where we are in terms of current and planned
deployment. It briefly describes the policy framework, including targets and ambitions, planning and
permitting procedures, support mechanisms and grid integration issues.
Chapter 3 addresses some of the challenges and opportunities regarding two key uncertainties;
namely competition for space at sea (in particular near shore), and technology development and cost
evolution.
Chapter 4 summarises how OWE could potentially develop in the future, depending on different
priorities and how key uncertainties impacting on the development of OWE will unfold. This chapter
presents highlights and results from the WINDSPEED scenario analysis.
Chapter 5 presents the overall target for OWE in 2030, which the WINDSPEED project concludes is
realisable. It also presents recommendations on policy actions and milestones needed to achieve such
a target.
82 Point of departure
This chapter highlights the current status of OWE developments and associated policy frameworks,
and as such focuses on the first of the three key Roadmap elements; namely the point of departure. In
addition to an overview of current developments, this chapter also provides a brief overview of
targets/ambitions, support schemes, Maritime Spatial Planning (MSP) as well as incentives and
regulations to facilitate the necessary grid infrastructure.
Current developments
The current capacity of operational OWE in the Central and Southern North Sea totals around 1.8 GW.
The North Sea currently has the highest installed capacity compared to other sea basins around the
world. In comparison, the Baltic Sea and Irish Sea have a total installed capacity of around 650 MW
and 450 MW respectively. The operational parks are listed in Table 2.
Capacity Turbine Water Dist. to Year of
Wind farm Country Foundation
(MW) size (MW) Depth (m) shore (km) completion
BARD Offshore I DE 400* 5 Tripile 39-41 101 2012
Thanet UK 300 3 Monopile 20-25 11 2010
Horns Rev II DK 209 2.3 Monopile 9-17 32 2009
Lynns & Inner Dowsing UK 194 3.6 Monopile 6-11 5 2009
Gunfleet Sands UK 172 3.6 Monopile 2-15 7 2010
Horns Rev I DK 160 2 Monopile 10-20 18 2002
Belwind BE 160 3 Monopile 15-37 46 2010
Princess Amalia NL 120 2 Monopile 19-24 26 2008
OWEZ NL 108 3 Monopile 15-18 13 2008
Kentish Flats UK 90 3 Monopile 3-5 10 2005
Scroby Sands UK 60 2 Monopile 0-8 2.5 2004
Alpha Ventus DE 60 5 Tripod, jacket 28-30 56 2010
Thorntonbank BE 30 5 Gravity 13-19 27 2009
Beatrice UK 10 5 Jacket 45 23 2007
Hywind NO 2.3 2.3 Floating 220 10 2009
Table 2: Existing parks in the North Sea basin (*partially operational; 15 out of 80 turbines grid connected at July 2011)
The UK is currently the leading country in terms of installed OWE capacity. The largest park to date,
Thanet Offshore Wind Park, has an installed capacity of 300 MW, but the BARD Offshore I wind park in
Germany will surpass this once complete in 2012. The majority of projects have been installed using
monopile foundations, which currently is feasible for water depths of up to 35 m. However, other
foundations have been tested and used. Alpha Ventus in the German sea basin is a demonstration
project for 5 MW turbine technology using different foundation technologies that are suitable for
deeper waters, such as tripod and jacket foundations. The existing parks consist of turbines ranging
between 2 and 5 MW. The BARD Offshore I project is using the tripile foundation technology. Table 2
also includes the Hywind project. Although this project is located just outside the WINDSPEED study
area, it is the first floating turbine concept in the world. The success of this project could have
9important implications for developments in the deeper sections of the Central and Southern North Sea
basin.
Table 3 gives an overview Cap. Water Distance to Year of
Wind Farm Country
of the projects that are (MW) Depth (m) shore (km) completion
currently under construc- London Array UK 630 23 20 2012
tion in the WINDSPEED Greater Gabbard UK 504 4-37 23 2012
Sheringham Shoal UK 317 14-23 17 2012
study area. This overview Lincs UK 270 7-12 8 2012
shows that offshore wind Table 3: Offshore wind parks currently under construction in the North Sea
in the North Sea is clearly
moving from a pioneering phase to large scale deployment. These new parks are typically significantly
larger than existing parks. However, with the exception of the BARD I Offshore project, currently under
construction and located 90 km from shore, projects remain fairly close to shore.
In addition to these operational and under-construction parks, there are a large number of projects
that can be broadly classed as 'planned'. These projects are to be found at many different stages of the
planning process. Some have received the necessary consents but are awaiting commencement (for
example 24 projects in German North Sea basin with a total capacity of approximately 6.5 GW), others
have been consented but are awaiting support scheme funding (for example in the Netherlands),
some have been provided with seabed leases but await further permitting procedures (for example
the Round 3 zones in the UK), many have submitted applications for consents and are waiting on
responses, and yet a further group are based on the proposed/revealed plans of developers, but have
not been taken substantially further at this time. All in all the 'planned' capacity is very large, with
European Commission (EC, 2010) estimates putting this figure in the realm of 140 GW across all
member states.
Targets and ambitions
EU’s climate and energy policy – driven by a three overall objectives: clean, secure and affordable
energy – is a key driver behind the growth of RES in Europe, including OWE. The EU’s current policy
framework includes the Renewable Energy (RES) Directive (2009/29/EC) that sets an EU target of a
20% share of renewable energy in total energy consumption by 2020. This overall target has been
broken down into a national binding RES target per Member State. Member States are also obligated
to publish a National Renewable Energy Actions Plan (NREAP), indicating the mix of RES technologies
which they expect (and intend to promote) to reach their national 2020 targets, along with the policy
framework to support this. The NREAPs for Belgium, Denmark, Germany, the Netherlands and the
United Kingdom announce an installed OWE capacity of approximately 32 GW by 2020 in their
respective sea basins. The majority of this capacity is expected to be deployed in the North Sea.
Norway2 has not currently set any targets for the development of OWE in its sea basin.
However, with the exception of Germany, Denmark and the UK, there is little information regarding
ambitions beyond 2020. These three countries have previously indicated targets of 4.6 GW and 33 GW
by 2025 (Denmark and UK respectively) and 25 GW by 2030 (Germany).
2
Norway, a non-EU country, is currently negotiating with the European Commission on a binding RES target for 2020, under
the framework of the EEA agreement. Following a successful negotiation, it is expected that Norway will implement the RES
Directive and submit a NREAP to the European Commission.
10Figure 4: Thorntonbank Offshore Wind Park
Maritime Spatial Planning and conflict management
The expansion of sea use functions, including OWE, and the increasing need to coordinate these use
functions has led to an enhanced interest in maritime spatial planning (MSP). MSP is an important tool
that brings together multiple users of the sea – including energy, industry, government, fishing,
conservation and recreation – to make informed and coordinated decisions on the use of marine
resources. MSP can provide OWE developers with more certainty in where offshore wind parks may or
may not be built in the future. Finding adequate locations is a prerequisite to large scale deployment.
Adequate planning tools, such as geographical Information System (GIS)-based tools, are being used to
address and better understand competing uses and spatial opportunities/limitations of different sea
uses. These tools are also used to understand potential trade-offs in moving current non-wind sea use
functions from favourable offshore wind energy locations to other locations.
Different MSP approaches are used in the WINDSPEED countries to identify and allocate locations for
offshore wind parks. In some countries, the permission to build and operate a wind farms is linked to
the allocation of support through a tendering scheme. Strategic environmental assessments (SEA)
have been applied, such as in the UK, to best identify zones in accordance with important
environmental constraints. The UK has also applied the concept of consecutive deployment rounds.
This has the advantage of providing flexibility to adapt the zoning of areas as information - for
example in relation to environmental impacts - becomes available and technology choices expand
throughout the development process and maturity of the industry. Several countries have facilitated
demonstration projects in their planning procedures. Examples of such projects include Horns Rev
(Denmark) and Egmond an Zee (Netherlands), which allowed for assessment of environmental
impacts from design and layout of parks in absence of such knowledge.
Key characteristics of national MSP processes are summarised in Table 4.
11Allocation
Country of sea bed Characteristics of MSP regime
rights
Belgium Tendered First North Sea country to introduce an operational, multi-use MSP.
2
Introduces delimitation for OWE (270 km , equivalent space for 2 GW OWE) all of which
has been allocated
Denmark Tendered Government led site investigation for OWE development (23 specific locations for 200
MW parks, of which 14 locations are found in the North Sea basin)
Single site tendering process, concessions awarded to projects with best price per kWh
Germany Open National MSP adopted in 2009, which sets guidelines for spatial development, targets
and principles for functions and uses in the German sea basins
Priority areas for shipping, sea cables and pipelines and OWE, but developers can
propose projects in additional non-excluded areas
Netherlands Open, Under outgoing framework, suitable areas for OWE were based on areas not excluded
moving to by other sea uses. Demand outstripped support, concessions awarded to developers
tender with lowest tariff
New National Water Plan, awaiting full implementation, defines suitable areas for OWE
(4 areas of which 2 are search areas) and is poised to use tenders for specific sites
Development of Round 3 projects put on hold as financial support is not currently
available
Norway - 15 areas (of which 2 are in the WINDSPEED area) identified for strategic environmental
assessments (SEA)
SEA will be carried out before areas will be made available for OWE deployment
UK Tendered Multi-site tendering of zones
Sea-bed leases awarded from the Crown Estate in consecutive rounds of tendering
Most recent Round 3 specifies zones within which discrete parks are proposed by
developers for permitting.
Table 4: Characteristics of MSP regimes in the WINDSPEED countries
The North Sea countries have notably taken steps to improve their own planning framework, with a
clear trend towards a more pro-active spatial planning. Well aware of the benefits of more
coordinated planning across borders, planning regimes remain nationally focused. The Dogger Bank
area, which is interesting from the perspective of large scale OWE deployment, is an area where
integrated planning is needed. It has at least two management challenges. Firstly, the area is spread
over the EEZs of Denmark, Germany, the Netherland and the UK. Secondly, it is an area with where
multiple claims are increasing. Being an important area from the perspective of natural value
preservation, the Netherlands and Germany have designated the area as a Natura 2000 site, whereas
Denmark and the UK have not (in the UK section of the Dogger Bank, a round 3 zone with a capacity of
up to 13 GW is identified). There is a clear need to understand the increasing pressures and impacts of
activities from a joint perspective in order to establish common objectives and compatible measures.
It can also be observed that MSP efforts to date have generally been nationally oriented. While some
cross-border consultation takes place, it is often ad-hoc or sector based. There is currently no official
transnational forum for MSP in the North Sea. Furthermore, different member states have undertaken
MSP activities at different times. Without streamlining of the development of MSP and trying to
coordinate activities, it is difficult to effectively cooperate on planning decisions.
Support mechanisms
Alongside other RES technologies, commercial deployment of offshore wind currently requires
economic incentives or financial support to bridge the gap between the wholesale electricity price and
the levelised cost of production of projects. Support mechanisms need to be well-designed to make
deployment economically attractive, which in turn can open up for economies of scale and reduce
12costs in the medium to long term. The two main types of support mechanisms used today are quota
obligations coupled with tradable green certificates, and feed-in tariffs or premiums.
Table 5 shows the variety of support mechanisms used by the six WINDSPEED countries. In addition to
differences in design and size of support, countries also apply different rules on who should bear the
grid connection costs. Denmark and the Netherlands typically offer feed-in premiums through
tendering schemes, allowing for competition to spark the development of parks at lowest cost. In
Denmark, the TSO is responsible for the grid connection, whereas in the Netherlands, this burden is
put on the developer. Germany, on the other hand, has an open-ended feed-in tariff scheme, which
implies that all applicants receiving necessary concessions are granted a feed-in tariff. Frequent
changes have been made to the design and size of the German feed-in tariff in attempts to tailor the
scheme to real costs. The UK provides OWE developers with tradable green certificates, known as
renewable obligation certificates (ROCs), which allow for market-based earnings on top of the
wholesale electricity price. Technology banding has been introduced in the UK ROC system to provide
for additional support to more expensive technologies, such as OWE.
Main support Responsibility for
Country Support level (€/MWh) Additional incentives
mechanism grid connection
Developer,
Lower balancing cost if support provided
Minimum payment of 107 €/MWh (over
Quota real production stays by TSO for 25% of
Belgium 20 years) for first 216 MW installed,
obligation within 30% of cable connection
thereafter 90 €/MWh
nominated production cable cost, max
25M€
Tender + 1.05 DKK/kWh (approx. 13 4€/MWh) for
Denmark feed-in first 50,000 full load hours (result of the TSO
premium last tendering process)
To accelerate
150 €/MWh for a minimum of 12 years
investment in OWE, the
(of which 20€/MWh is bonus for projects
public German KfW
initiated before 2015), 35 €/MWh for
Germany Feed-in tariff bank is providing a total TSO
next 10 years. Alternatively a so-called
of €5 bil. loans for the
squeezed FIT of 190 €/MWh which is
first 10 parks (at market
granted for 8 years can be chosen.
based interest rates)
Average expected premium of 110
Tender +
€/MWh (over 15 years) above the
Netherlands feed-in Tax incentives Developer
average yearly electricity price on the day
premium
ahead market
Currently no support incentives for
development of offshore wind parks.
Joint Norwegian-Swedish certificate
scheme will be introduced on 1 January Capital grants for
Norway Capital grants Developer
2012, however, it is expected that the demonstration projects
certificate price will be too low to be
attractive for OWE developers. Additional
support for OWE not yet identified.
1.5 ROCs, temporary increase to 2/1.75
ROCs for projects with financial closure by
Quota Climate change levy
UK 3 March 2010/2011, average ROC price Developer
obligation Capital grants
£50 (approx. €56) (April 2011),
certificates to 2037.
Table 5: Support mechanisms and grid connection regimes in the Central and Southern North Sea countries
3
The UK has recently announced a move to feed-in tariffs with contracts for difference, compulsory from 2017; however,
tariffs are not yet known.
13In several of the WINDSPEED countries, there is clearly a lack of coherence between OWE ambitions
identified through MSP processes and the level of support generated through the national support
schemes. In the Netherlands, the round 3 developments of OWE, foreseen in the period 2012 – 2020,
have been put on hold due to a lack of funding mechanisms. In the UK, the significant leases in round 3
are likely to face hurdles with the current forecast RES requirements within their obligation system.
Differences in planning procedures and economic incentives for OWE projects may pose a challenge
for future coordination and cooperation of OWE deployment. Whilst the design and size of support in
€/MWh differs quite significantly between countries, this may change over time. Should cross-border
flows of OWE become significant, this may push support levels closer towards equivalency.
Grid and market integration aspects
Grid integration, comprising onshore connection and offshore interconnections, is a key barrier to
large scale deployment of OWE. In anticipation of large scale deployment of offshore wind, an offshore
electricity infrastructure in the North and Baltic Seas is at present a key topic on the EU energy agenda.
In the European Commission’s energy infrastructure blueprint communication (EC, 2010a), one of the
priority corridors identified to allow for electricity grids suitable for 2020 is the offshore grid in the
Northern Seas and connection to Northern and Central Europe. First steps towards increased
cooperation and coordination between countries with respect to connection of large scale OWE in the
North and Baltic Seas were initiated through the establishment of the North Sea Country Offshore Grid
Initiative (NSCOGI) in December 2010. This important and timely collaboration, between several EU
Member States and Norway, aims to create an integrated offshore energy grid linking offshore wind
farms and other renewable energy sources across the northern seas of Europe. A first step in this
initiative is to address the regulatory, planning and economic challenges involved in linking the
offshore wind capacities to a European offshore grid by end of 2012.
The EU is currently also playing a key role in facilitating the establishment of appropriate grid
infrastructure through the EU-funded European Energy Plan for Recovery (EEPR), which came into
force in 2009. A number of interconnections are currently in the planning stage in the North Sea.
Three examples are the interconnector between Norway and Germany (Nor-Ger link), the
interconnector between Norway and UK (Brit-Nor link) and the COBRA project between Denmark and
The Netherlands. The Nor-Ger and the Brit-Nor links will connect the Norwegian system with the
German and British electricity systems respectively, to improve security of supply and provide the
German and UK markets with flexible Norwegian hydropower. Hydropower can be used as balancing
power to account for the generation variability that increased levels of installed wind power will
introduce in the German and British systems. The COBRA project is an undersea electricity cable to be
installed between the Netherlands and Denmark. The objective of the COBRA project is to advance the
integration of more sustainable energy (particularly wind energy) into the Dutch and Danish electricity
supply. For these projects, possibilities of connecting offshore wind farms to the cable in a T-
connection configuration will also be investigated. These projects can be regarded as important first
steps towards an eventual development of an offshore electricity grid, especially if T-connection
solutions connecting the links with one or several wind farms and/or with a nearby offshore hub are
chosen. T-connections will likely involve the use of VSC technology, instead of classical LCC technology.
VSC is the technological choice needed for multi-terminal meshed offshore grid configuration. The
COBRA project has received funding under the EC Recovery plan4.
Regarding timing for construction of the offshore grid electrical infrastructure, we take as examples
the existing Nor-Ned and Brit-Ned links, the future Nor-Ger HVDC link, the existing offshore wind farm
4
For details on existing projects see (ENTSO-E, 2011).
14BARD Offshore 1 and the future offshore wind farm Dogger Bank (see Huertas Hernando et al. 2011
for details). The total period of time for the completion of these projects seems to be approximately
between 8-10 years, of which the application process, approval and investment decision typically takes
5-7 years and construction phase 3-5 years. For 2030 as target year, it seems reasonable to assume
that new pro-OWE regulatory and commercial frameworks should be established in the period 2015-
2020 such that large scale investment decisions are being made latest before the beginning of 2020.
Under these assumptions, large scale construction of an offshore grid can slowly emerge from national
development to international coordination between 2020 and 2030, with a minimum total
construction time of 10 years.
The current electricity market rules act as a barrier against using the full ‘technical’ potential of
offshore wind development as well as the added flexibility potential of hydropower as a balancing
resource. An important barrier to present and future increase of cross border energy exchange and
trade of power between the North Sea, the Nordic area, UK and continental Europe is that there are
differences in the markets mechanisms in the European countries. As per today, these are very
different between different countries. It is e.g. not clear how offshore wind farms could be connected
to several different countries to allow for trans-national power exchanges. There are differences in the
timing of the different market actions also. Regarding large scale integration of wind power,
mechanisms improving the interaction between balancing markets and the intra-day spot markets
have been suggested (Grande et al., 2008).
In summary
- The Central and Southern North Sea basin has currently a leading role in the deployment of OWE,
with a capacity of 2GW (expected by end of 2011). This sea basin is in a position to continue its
leadership in OWE deployment.
- Although foresight and timing are crucial elements for providing investor confidence, there are
currently no clear ambitions or targets for further OWE developments beyond 2020.
- There is a clear lack of coherence in the current ambitions and support provided for OWE
deployment.
- North Sea countries are notably taking steps to improve their own MSP framework, however, few
efforts are being made to look beyond national borders.
- All parks are currently radially connected to shore; however, a few interconnector projects in the
planning phase will likely address the possibility of T-connection solutions.
- Current electricity market rules and differences in national support schemes act as a barrier
against using the full ‘technical’ potential of offshore wind development as well as the added
flexibility potential of hydropower as a balancing resource.
- National orientation of support mechanisms persists; however, should cross-border flows of OWE
become significant, this may push support levels closer towards equivalency.
153 Challenges and Opportunities
The point of departure described in the preceding chapter – at this stage somewhat modest in its level
of OWE deployment – holds tremendous promise based on the efforts of member states to date and
their ambitions for the future. But, like any roadmap, it can be instructive to understand the obstacles
that may lay over the horizon and, equally, the opportunities for smooth travel.
This chapter takes a look at some of the key challenges and opportunities with regards to competition
for space at sea and to technology development. These two aspects are used to distinguish the four
different scenarios from one another, due to their importance as determinants of future deployment
of OWE in the North Seas.
It is vital to understand, firstly, the characteristics and compatibilities of different sea use functions
with OWE. Secondly, the key uncertainties with respect to technology availability and costs must be
considered, focusing in particular on what the main cost drivers are, on the implications for choice of
locations to develop OWE, on how are costs likely to change, on what cost uncertainties OWE faces
and on how cost changes are likely to impact on spatial opportunities and constraints.
The North Sea and its dynamic users
The Central and Southern North Sea – approaching half a million square kilometres in size – supports a
large volume of varying commercial activities and also provides important value in terms of marine
habitats and populations. From a spatial perspective, the challenge is to find space for new OWE that
balances the need for low cost renewable energy against the needs of these other, so called, non-wind
sea use functions. The non-wind sea functions studied within the WINDSPEED project comprise
shipping, fisheries, military areas, cables and pipelines, oil and gas extraction, nature conservation
areas, marine wildlife preservation, and sand extraction. These functions have quite different
characteristics, with respect to their current and future expected presence, their compatibility and
overlap with other sea uses, flexibility in use patterns and general importance to society. Some sea use
functions change from year to year as their underlying resource changes (for example fisheries), others
align themselves to their optimum areas of the North Sea (for example shipping) while yet others
involve immovable infrastructure based on fixed resources (for example oil and gas extraction). Table
6 gives an overview of the most important characteristics for each non-wind sea use function included
in the WINDSPEED analysis.
Not only do the characteristics of each sea use function differ, but many of these uses overlap with
each other. For example, it is possible to find areas of the North Sea zoned for both nature
conservation and military use, with cables or pipelines running underneath, with the same area also
allowing shipping passage and fishing activities. This greatly complicates any search for new locations
for OWE. Not only must the compatibility and flexibility of each sea use function with respect to OWE
be considered, but also their interactions with other non-wind use functions. Figure 5 illustrates the
high level compatibility of the different sea use functions considered in the WINDSPEED project.
16Sea use Current Future
Characteristics
function Extent development
Shipping approx. moderate The movement of vessels for a wide variety of purposes. The focus in
10 – 25% growth WINDSPEED is on route-bound traffic which, in travelling from place to
(depending place, needs a route of safe passage. The project considers both
on shipping internationally regulated routes (IMO routes) and national/informal traffic
density) requirements; hence the large variation in extent reported at left,
depending on the definition of shipping considered to be ‘in use’.
Fisheries extensive, Stable, with Fishing activities cover almost all of the North Sea in some form or
but not possible another depending on targeted fish species, fishing techniques and boat
clearly changes to sizes. Moreover the resulting use patterns can be highly variable from
demarcated techniques season to season and year to year depending on fish stocks. WINDSPEED
focuses on heavy fishing using beam trawl or similar methods that have
the potential to come into conflict with OWE or the associated cables.
Military areas approx. stable Covering a wide range of activities – including submarine manoeuvres,
14% firing ranges, munitions dumping, aerial exercise and others – military
zones are defined by governments in the interest to training and security.
WINDSPEED incorporates maps of these zones along with information on
usage type where available.
Cables and approx. moderate Cables (for example for electricity or telecommunications) and pipelines
pipelines 8% growth (for example for gas or oil transport) run across large stretches of the
North Sea. WINDSPEED includes maps of the known cable/pipeline
infrastructure and defines exclusion zones on either side of the cable/pipe
in order to provide protection and maintenance access.
Oil and gas approx. decline There is a significant amount of infrastructure in the North Sea that
extraction 11% through relates to the extraction of oil and gas reserves and these platforms and
decommission installations require, depending on their nature, varying sizes of exclusion
ing buffer around them to ensure safe and reliable operation. WINDSPEED
includes information on both surface and sub-surface
infrastructure/platforms. CO2 storage is also a possibility in the North Sea
and could impact on the amount of offshore infrastructure. However a
lack of firm knowledge on extent and location meant that it could not be
considered in the WINDSPEED project.
Sand approx. stable The extraction of sand and gravel is necessary for a number of onshore
extraction 2% activities including land reclamation, beach nourishment and
construction. Dredging also occurs in shipping lanes to ensure free
passage. WINDSPEED maps the known areas of sand extraction in order to
understand them as a constraint.
Nature approx. growth This sea use function includes the network of protected areas that are
conservation 13% likely identified under the Birds Directive and Habitat Directive (Special
Protection Areas and Special Areas of Conservation respectively).
WINDSPEED contains information on these two types of conservation
area, both current and proposed.
Marine present uncertain This sea use function has been developed within the WINDSPEED project
wildlife everywhere to supplement the nature conservation areas described above, based on
but not the lack of firm knowledge that is available regarding the cumulative
clearly effects of OWE. It is implemented through a series of nature
demarcated value/vulnerability maps for birds, fish and benthos that are combined
into a wildlife preservation map that shows which areas are most valuable
in terms of nature values.
Other Presently growth - A number of other renewable energy sources – such as tidal and wave
offshore negligible uncertain power conversion devices and algae farms – could develop in the North
renewables scale Sea. However, a lack of available information on their future development
excluded them from the WINDSPEED project. Moreover, these sources are
generally compatible with OWE sites in terms of co-use of space so are
deemed unlikely to impact project results.
Table 6: Overview of sea use functions –current extent, expected development and key characteristics
Furthermore, different sea use functions are present in different portions of the North Sea. Some are
predominantly found closer to shore or in shallower depths (areas that could be of interest for low
17cost OWE), while others are typically further from shore or in deeper waters. This interaction between
location and cost is a key aspect of the WINDSPEED project and is discussed further in the following
section of this Chapter.
Cables & pipelines
Sand extraction
conservation
Oil & gas
Fisheries
Shipping
Military
Nature
OWE
Shipping
Oil & gas
Military
Fisheries
Cables & pipelines Generally compatible
No/limited possibility of co-existence
Nature conservation
Co-existence possible under certain conditions
Sand extraction Little possibility of co-existence. First come, first served
Note: arrow indicates use that typically takes precedence
OWE
Figure 5: Interactions between sea use functions (source: adapted from van der Wal et al., 2009)
Finally, OWE is not the only use function that is anticipating a change in its stake in the North Sea.
Other uses such as shipping, cables and pipelines are expected to undergo significant growth over the
coming decades, as well as possible changes in the nature of that use (for example trends towards
larger vessels). On the other hand, activities such as oil and gas extraction are expected to reduce their
spatial claim in the North Sea significantly based on announced decommissioning plans. Yet there is
little firm knowledge of exactly when individual platform decommissioning will take place due to
ongoing technology and demand changes within that industry. Considerations such as these only serve
to increase the challenge to identify future OWE locations in the North Sea. Future developments in
non-wind sea uses have been accounted for in the development of the WINDSPEED scenarios, in as
much detail as was practicable from the information available at the time of the analysis.
The future of OWE in the North Sea also faces challenges in regards to its interactions with, and
impacts on, nature values. These can be both locally, where an individual park is built, and more
broadly, based on possible neighbouring effects or impacts on remote, but linked ecosystems. While
existing nature conservation areas (Special Protection Areas, Special Areas of Conservation and other
nationally defined conservation areas) are presumably sufficient for the current level of commercial
activity in the North Sea, there is little information available on the cumulative effects of future large
scale offshore wind deployment. This uncertainty makes it difficult to answer important questions
such as “What level of nature protection is required in the future?” and “How might this be
distributed?” This uncertainty suggests that a conservative approach – which assumes some level of
increase in nature conservation areas in the future, as implemented in the WINDSPEED project – has
merit.
To do this, the WINDSPEED project introduced a new use function that relates to marine wildlife
vulnerability outside of recognised nature conservation areas. A combined map representing the
18overall vulnerability of bird, fish and benthos species was used to reserve critical areas for
preservation. This was done in an effort to anticipate growth in nature conservation areas in the future
in recognition of the possible cumulative impacts from OWE on the marine environment. This new use
function gives an additional level of nature protection to the North Sea region that is roughly
equivalent in size to the current nature conservation areas.
210
Average levelised production cost (€/MWh)
200
389 sand extraction
273
190 405 fisheries
916
265 oil and gas extraction
351
180
634 military areas
shipping exclusions
170
nature conservation areas
160 48 cable or pipelines
marine wildlife preservation
150
40 % 50 % 60 % 70 % 80 % 90 % 100 %
Percentage overlap with other sea use functions
Figure 6: Excluded generation potential (circles labelled in TWh) versus cost and spatial exclusivity - default case (Cameron
et al., 2011)
Based on the project results, the five largest sea use functions – fisheries, shipping, military areas, oil &
gas extraction, and nature conservation areas – are also the most significant spatial drivers with regard
to OWE. They are not only the largest, but potentially the most interesting for OWE due to: i) the fact
that on average their current locations offer a lower possible electricity cost; and/or ii) they are more
‘spatially unique’, meaning that they have less overlap with other sea use functions (Figure 6).
However, with this knowledge the
question remains of what
opportunities these sea use
functions offer for new OWE. These
could include simple compromise of
another sea use function to reduce
its extent, relocation of a sea use
function, or integration of a sea use
with OWE planning. Which of these
approaches, if any, may be suitable
in a given scenario was an important
part of the scenario development
process within the project.
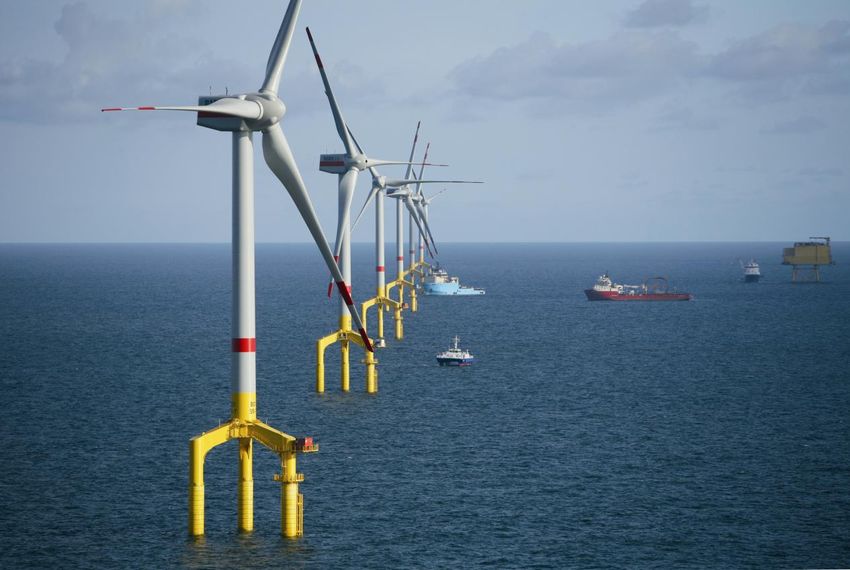
In particular, the opportunities for
Figure 7: Wakes behind wind turbines at Horns Rev offshore wind park
synergies between OWE and certain
other sea use functions through integrated planning deserves further explanation. A fundamental
premise of the work undertaken in this project is the inclusion of wind regeneration corridors, in the
form of wide multi-kilometre gaps, between wind parks in order to reduce turbulence and inter-park
effects and thus maintain the energy yield of neighbouring parks. While existing or planned offshore
19wind parks typically have densities in the order of 6 MW, or more, per square kilometre, there is a
growing body of literature that suggests that such high densities are not sustainable over large areas
of deployment. This is because wake effects and wind speed reductions behind consecutive rows of
wind turbines begin to detrimentally affect the level of wind resource behind large parks (Phillips et
al., 2010).
In view of the recent findings
on wakes within offshore
wind farms and on wind
speed deficits behind these
wind farms, the WINDSPEED
project considers that, within
a defined area, only 30% of
the total should realistically
be occupied by wind farms. It
is assumed that any large
scale deployment of offshore
Figure 8: Illustration of wind park clustering (black squares), wind regeneration
wind will likely take the form between parks, and turbines (red dots, ‘D’ is diameter) (Jacquemin et al., 2009)
of multiple wind farm clusters
uniformly spaced, allowing adequate distance between each cluster to mitigate the impact of inter
wind farm wake losses and the resulting lost production and wake turbulence loading (Jacquemin et
al., 2009). The remaining 70% shall provide space for wind speed recovery and dissipation of wake
turbulent energy, but also possibly permit some form of navigation throughout the area (Figure 8).
This provides opportunities for co-use/co-existence with other sea uses such as shipping and fishing.
For example, a more formalised definition of areas for shipping activity (see German spatial planning
practice; BSH, 2009) may offer a way to reduce competition for space between shipping and OWE, and
provide clarity for wind park developers.
Technology and costs
Although OWE is still at a relatively early stage of development in terms of capacity deployed, it can be
considered to be on the verge of large scale implementation. That is not to say that the technology is
now mature. Instead, the many technical aspects of OWE, ranging from component design to
installation techniques to maintenance methodologies, are all progressing and evolving. This reflects
changing market requirements in terms of depths, distances to shore, scale of individual parks and
delivered electricity costs amongst others.
While offshore wind turbines certainly inherit many design characteristics from onshore wind energy,
there are a number of new challenges posed by the marine environment. These include: i) technical
constraints on depth for traditional fixed foundations, ii) corrosion, iii) the significant cost penalties
associated with operations and maintenance activities offshore, iv) the possibility of large distances to
a grid connection point, and v) limited knowledge on the environmental impact of offshore wind
turbines, at least compared to onshore.
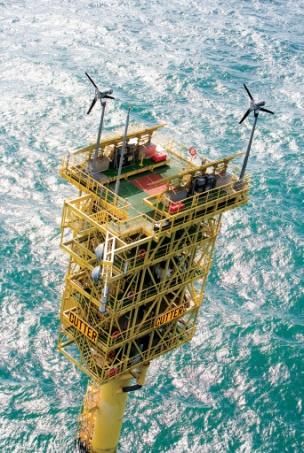
With regard to operations and maintenance, a number of developments – apart from the
improvements in the reliability of the turbines themselves – offer opportunities for cost reductions in
the future. To date maintenance crews have been based onshore and have accessed remote sites by
boat, but that situation is changing. Wind parks have already begun to look for alternative solutions for
offshore intervention including offshore permanent offshore accommodation, helicopter based access,
large accommodation vessels moored at sea or permanent ‘island’ structures constructed closer to
wind park locations (Figure 9).
20You can also read