A 305-year continuous monthly rainfall series for the island of Ireland (1711-2016)
←
→
Page content transcription
If your browser does not render page correctly, please read the page content below
Clim. Past, 14, 413–440, 2018
https://doi.org/10.5194/cp-14-413-2018
© Author(s) 2018. This work is distributed under
the Creative Commons Attribution 4.0 License.

A 305-year continuous monthly rainfall series for the island
of Ireland (1711–2016)
Conor Murphy1 , Ciaran Broderick1 , Timothy P. Burt2 , Mary Curley3 , Catriona Duffy1 , Julia Hall4 , Shaun Harrigan5 ,
Tom K. R. Matthews6 , Neil Macdonald7 , Gerard McCarthy1 , Mark P. McCarthy8 , Donal Mullan9 , Simon Noone1 ,
Timothy J. Osborn10 , Ciara Ryan1 , John Sweeney1 , Peter W. Thorne1 , Seamus Walsh3 , and Robert L. Wilby11
1 Irish Climate Analysis and Research UnitS (ICARUS), Department of Geography, Maynooth University, Maynooth, Ireland
2 Department   of Geography, Durham University, Durham, DH1 3LE, UK and Department of Geographical Sciences,
University of Bristol, Bristol, BS8 2LR, UK
3 Climatology and Observations Division, Met Éireann, Dublin, Ireland
4 Institute of Hydraulic Engineering and Water Resources Management, Technische Universität Wien, Vienna, Austria
5 Centre for Ecology & Hydrology, Wallingford, Oxfordshire, OX10 8BB, UK
6 School of Natural Sciences and Psychology, Liverpool John Moores University, Liverpool, Merseyside, L3 3AF, UK
7 Department of Geography and Planning, School of Environmental Sciences, University of Liverpool, Liverpool, UK
8 Met Office, Hadley Centre, Fitzroy Road, Exeter, EX1 3PB, UK
9 School of Natural and Built Environment, Queen’s University Belfast, Belfast, N. Ireland, UK
10 Climate Research Unit, School of Environmental Sciences, University of East Anglia, Norwich, UK
11 Department of Geography, Loughborough University, Loughborough, UK

Correspondence: Conor Murphy (conor.murphy@mu.ie)

Received: 2 November 2017 – Discussion started: 10 November 2017
Revised: 8 February 2018 – Accepted: 16 February 2018 – Published: 27 March 2018

Abstract. A continuous 305-year (1711–2016) monthly                itive phase of the North Atlantic Oscillation. Unusually wet
rainfall series (IoI_1711) is created for the Island of Ireland.   summers occurred in the 1750s, consistent with proxy (tree-
The post 1850 series draws on an existing quality assured          ring) reconstructions of summer precipitation in the region.
rainfall network for Ireland, while pre-1850 values come           Our analysis shows that inter-decadal variability of precipi-
from instrumental and documentary series compiled, but not         tation is much larger than previously thought, while relation-
published by the UK Met Office. The series is evaluated by         ships with key modes of climate variability are time-variant.
comparison with independent long-term observations and re-         The IoI_1711 series reveals statistically significant multi-
constructions of precipitation, temperature and circulation        centennial trends in winter (increasing) and summer (de-
indices from across the British–Irish Isles. Strong decadal        creasing) seasonal precipitation. However, given uncertain-
consistency of IoI_1711 with other long-term observations is       ties in the early winter record, the former finding should be
evident throughout the annual, boreal spring and autumn se-        regarded as tentative. The derived record, one of the longest
ries. Annually, the most recent decade (2006–2015) is found        continuous series in Europe, offers valuable insights for un-
to be the wettest in over 300 years. The winter series is prob-    derstanding multi-decadal and centennial rainfall variability
ably too dry between the 1740s and 1780s, but strong con-          in Ireland, and provides a firm basis for benchmarking other
sistency with other long-term observations strengthens con-        long-term records and reconstructions of past climate. Cor-
fidence from 1790 onwards. The IoI_1711 series has remark-         relation of Irish rainfall with other parts of Europe increases
ably wet winters during the 1730s, concurrent with a period        the utility of the series for understanding historical climate in
of strong westerly airflow, glacial advance throughout Scan-       further regions.
dinavia and near unprecedented warmth in the Central Eng-
land Temperature record – all consistent with a strongly pos-

Published by Copernicus Publications on behalf of the European Geosciences Union.
414                    C. Murphy et al.: A 305-year continuous monthly rainfall series for the island of Ireland (1711–2016)

1   Introduction                                                   (1850–2010) monthly rainfall network for Ireland, consist-
                                                                   ing of 25 stations together with an Island of Ireland (IoI)
Long historical weather records are essential for understand-      composite series (arithmetic mean of the 25 stations). Subse-
ing climate variability and change, as well as contextual-         quent work used these data to evaluate severe Irish droughts
ising extreme events, identifying emerging trends, evaluat-        from 1850 to present (Wilby et al., 2016; Noone et al., 2017),
ing climate models and supporting vulnerability and risk as-       with protracted droughts being a feature of the 19th Century,
sessments (e.g. Matthews et al., 2016). Continuous observa-        but largely missing from recent records – particularly since
tions of precipitation in the British–Irish Isles (BI) can be      the mid-1970s (Murphy et al., 2017).
traced back to 1677 – the year the first known rain gauge was         An unpublished UK Meteorological Office (UKMO) note
developed by Richard Towneley of Burnley, Lancashire, in           by Jenkinson et al. (1979) was recently rediscovered amongst
NW England. Since the early 1700s, at least three precipita-       a collection of old files following a refurbishment of Met
tion gauges have operated somewhere in the BI every year           Éireann. This note provides a continuous monthly rainfall
(Jones and Briffa, 2006). The earliest meteorological obser-       series for IoI covering the period 1711–1977 based on doc-
vations in Ireland began at the end of the 17th Century. Un-       umentary sources (weather diaries) and early observations.
fortunately, these early instrumental records, taken in Dublin     Given the painstaking work of the original authors in con-
by William and Samuel Molyneux, have been lost (Shields,           structing the series, together with the possibility of extending
1983). While discontinuous records exist, systematic weather       IoI rainfall records to the early 18th Century, revisiting the
observing did not begin in Ireland until 1789 when Richard         work of Jenkinson et al. (1979) holds considerable potential
Kirwan set up a series of instruments in Dublin (Shields,          for better understanding long-term Irish rainfall climatology.
1983). Yet, with the exception of Butler et al. (1998) who            Therefore, this paper (i) presents the previously unpub-
analysed the record for Armagh Observatory (commencing             lished Jenkinson et al. (1979) data and its constituent sources,
in 1838), there has been little work on Irish precipitation        (ii) merges the Jenkinson data with the homogenised Noone
measurements prior to 1850, due primarily to the lack of suit-     et al. (2016) series to produce a continuous monthly rainfall
able digitised data. There have also been few assessments of       series for Ireland from 1711 to present (Murphy et al., 2018)
qualitative descriptions from weather diaries pre-1850. Ex-        (henceforth IoI_1711), (iii) assesses confidence in the early
ceptions from the 18th Century include analyses of the di-         record through comparison with other long records of rele-
ary of Thomas Neve from Derry, for the period 1711–1725            vant meteorological parameters from the BI region, as well
(Dixon, 1959), the diary of Isaac Butler from Dublin cov-          as available proxy and documentary sources; and, (iv) in-
ering 1716–1734 (Sanderson, 2017) and Joshua Wight from            vestigates the nature of variability and change in the recon-
Cork during June 1753 to September 1756 (Tyrell, 1995).            structed rainfall record. The rest of the paper is organised
Thus, Irish rainfall climatology over the last 300 years re-       as follows. Section 2 presents the various sources of infor-
mains poorly understood.                                           mation (including the Jenkinson note) for constructing the
   The spatially variable nature of precipitation, together with   IoI_1711 series, alongside other data used for comparative
changes in observer practices, gauge location and design,          analysis. The methods for exploring variability and change
mean that developing reliable, long-term precipitation series      are also presented. Results are described in Sect. 3. Section 4
can be a challenging task (Wilby et al., 2017). The assem-         provides a discussion of key findings and limitations of the
bly of regional series from individual gauges can be fur-          new series. Finally, Sect. 5 closes with conclusions and some
ther hampered by changes in the network of gauges through          priorities for future work.
time. Nonetheless, such regional series can provide impor-
tant insights into precipitation variability and change over
                                                                   2     Data and methods
the course of centuries. Symons (1866) and later Nicholas
and Glasspoole (1931) were among the first to construct            2.1    Deriving the extended Island of Ireland (IoI_1711)
a regional average monthly rainfall record for England and                series
Wales extending back to 1727. Despite known homogeneity
issues (due to changes in methods of rain gauge construc-          Two data sources were used to construct the IoI_1711 se-
tion and siting through time), this record ultimately led to the   ries. The first is the Noone et al. (2016) IoI composite series
development of the England and Wales Precipitation (EWP)           (1850–2010) (henceforth IoI_1850 series). This dataset con-
series, beginning in 1766 (Wigley et al., 1984; Alexander          sists of monthly rainfall data for 25 stations across the island,
and Jones, 2001). Similarly, Glasspoole (1925) developed           each homogenised via the community standard “HOMogeni-
a regional monthly precipitation series representing Ireland       sation softwarE in R” (HOME, 2013) software package and
for the period 1881–1924. Tabony (1980) and Briffa (1984)          making recourse to available metadata. These homogenised
developed long-term rainfall series for Irish stations, which      data were combined by simple arithmetic mean into a com-
have since been updated by others (e.g. Jones, 1983; Gre-          posite monthly precipitation series representing the Island of
gory et al., 1991; Jones and Conway, 1997). More recently,         Ireland (IoI). McCarthy et al. (2016) updated this composite
Noone et al. (2016) constructed a homogenous long-term             series to February 2016, which are the data used here. The

Clim. Past, 14, 413–440, 2018                                                                  www.clim-past.net/14/413/2018/
C. Murphy et al.: A 305-year continuous monthly rainfall series for the island of Ireland (1711–2016) 415
Table 1. Description of the data used to produce the Jenkinson series of monthly and annual rainfall, 1711–1977. Derived values were
subsequently converted to internal percentages of the annual rainfall for each station. For both (1) and (2) this was achieved using a ranking
method to classify rainfall amounts (e.g. wet/dry). The frequency of the ranked events for each month was recorded. Using a comparable
period of reference, internal percentages (per ‰) were assigned to the rankings to determine internal percentages for each year.
Years Source Description of the data Reference
1711–1725 Derry, NW Ireland Monthly and annual totals extracted from the weather diary Dixon (1959)
of Thomas Neve.
1711–1715 Crosby, NW England Monthly and annual totals extracted from Nicholas Blundell’s Blundell (1968)
Diurnal.(1)
1716–1717 Crosby, NW England Monthly and annual totals extracted from Nicholas Blundell’s Blundell (1968)
Diurnal.(1)
1718–1727 London, SE England Monthly and annual totals extracted from Nicholas Blundell’s Blundell (1968)
Diurnal.(1)
1726–1727 Antrim, NE Ireland Monthly and annual totals. Met Office
1716–1765 Dublin, E Ireland Brief monthly and seasonal summaries extracted from Rutty (1770)
a chronological history of the weather in Dublin 1716–65.(2)
1757–1839 NW England Monthly and annual totals. Regional series used as a single Met Office
Ireland station.
1792–1839 SW Scotland Monthly and annual totals. Regional series used as a single Met Office
Ireland station.
1757–1977 Scotland Monthly and annual totals. For completeness data was com- Met Office/Glasspoole (1925)
bined with the Glasspoole series from 1868 onwards.
1792–1839 Dublin, E Ireland Monthly and annual totals. Supplemented by MS data avail- Dixon (1953)
able from the Met Office.
1813–1830 Kilkenny, SE Ireland Monthly and annual totals. Met Office
1823–1824 Dublin, E Ireland Monthly and annual totals. Met Office
1795–1801 Derry, NW Ireland Monthly and annual totals. Met Office
1814–1815 Belfast, NE Ireland Monthly and annual totals. Met Office
1818–1977 Belfast, NE Ireland Monthly and annual totals. Met Office
1836–1977 Armagh, NE Ireland Monthly and annual totals. Met Office
1825–1832 Cork, S Ireland Monthly and annual totals. Met Office
1836–1977 Cork, S Ireland Monthly and annual totals. Met Office
1833–1977 Sligo, NW Ireland Monthly and annual totals. Met Office
1840–1977 Ireland Monthly and annual totals. Combined with the Glasspoole Met Office/Glasspoole (1925)
series from 1881 onwards.
1940–1945 UK Annual rainfall maps (with percentage isopleths). Met Office
1946–1948 Ireland Annual rainfall maps (with percentage isopleths). Irish Meteorological Service
1940–1948 Ireland Monthly and annual totals recorded at ten long-term stations Tabony (1980)
throughout Ireland (listed below∗ ).
1949–1977 Ireland Monthly and annual totals recorded at various stations Irish Meteorological Service
throughout Ireland.
∗ Markree, Valentia, Shannon, Birr, Dublin, Cork, Waterford, Armagh, Londonderry, Belfast.
second source is the UKMO note by Jenkinson et al. (1979) and proportionate monthly values, presented in the Appendix
(henceforth the Jenkinson series), which contains tables of of Jenkinson et al. (1979), were transcribed using double key-
monthly and annual rainfall representing IoI for the years ing (by two of the authors) to minimise the risk of transcrip-
1711 to 1977. A copy of the original document is provided tion errors. Table 1 provides an overview of the various data
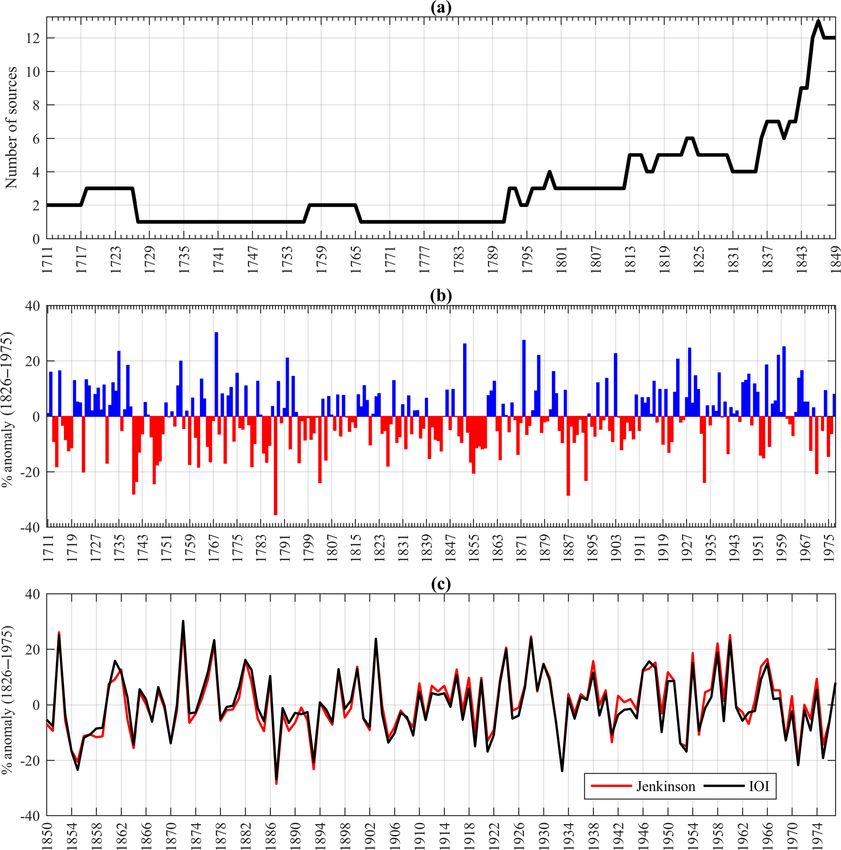
in the Supplement. sources comprising the Jenkinson series. Figure 1 maps the
location of contributing sources from Ireland and the UK,
while Fig. 2 plots the number of constituent sources per year
2.1.1 The Jenkinson series underpinning the series, along with annual anomalies (rela-
The Jenkinson data are presented as annual totals expressed tive to 1826–1975) contained in the note for the years 1711–
as a percentage of the mean annual average rainfall (AAR) 1977.
for the period 1826–1975. Monthly values are provided as The earliest instrumental observations in the Jenkinson
a proportion of the rainfall for each year. Annual anomalies record originate from a rudimentary gauge operated by
www.clim-past.net/14/413/2018/ Clim. Past, 14, 413–440, 2018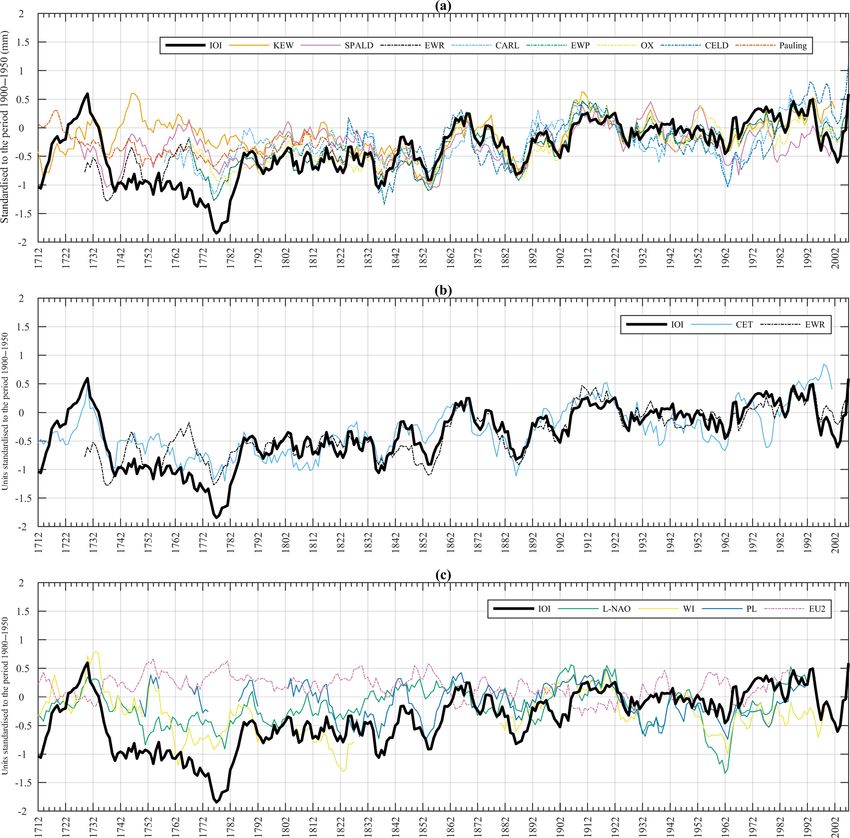
416                               C. Murphy et al.: A 305-year continuous monthly rainfall series for the island of Ireland (1711–2016)

Table 2. List of data sources used for comparison with the reconstructed IoI_1711 series. Given are the full data set name and its abbreviation
as used in the text and subsequent figures, the years for which data are available and the primary references for each dataset.

  Series name (abbreviation used)                                             Years         References
  England and Wales Precipitation (EWP)∗                                      1766–2016     Wigley et al. (1984); Alexander and Jones (2001)
  England and Wales Rainfall (EWR)∗                                           1725–1765     Nicholas and Glasspoole (1931); Jones and Briffa (2006)
  Central England Lake District Precipitation (CELD)∗                         1788–2016     Barker et al. (2004); Wilby (2016); revised version CELD
                                                                                            20170203 (Robert L. Wilby, personal communication, 2017)
  Oxford Precipitation (Ox)∗                                                  1766–2016     Craddock and Craddock (1977); Burt and Howden (2011)
  Carlisle Precipitation (Carl)∗                                              1757–2001     Craddock (1976); Jones (1983); Todd et al. (2015)
  Kew Gardens Precipitation (Kew)∗                                            1697–2016     Wales-Smith (1971); Wales-Smith (1980)
  Spalding Precipitation (Spald)∗                                             1726–2016     Craddock and Wales-Smith (1977); Tabony (1980)
  Hoofddorp precipitation series (Hoof)                                       1735–1973     Tabony (1980)
  Pauling et al. (2006) seasonal precipitation reconstruc-                    1500–2000     Pauling et al. (2006)
  tions (Pauling) ∗
  Tree ring reconstruction of southern Britain summer                         1613–2003     Rinne et al. (2013)
  (MJJA) precipitation (Rinne)
  Central England Temperature Record (CET)                                    1659–2016     Manley (1974); Parker et al. (1992)
  Monthly NAO reconstruction (L-NAO)∗                                         1659–2000     Luterbacher et al. (2001)
  Paris–London Westerly Index (PL index)                                      1692–2004     Cornes et al. (2013)
  London Sea Level Pressure (L-SLP)                                           1692–2007     Cornes et al. (2012)
  East Atlantic/Western Russia pattern (EU2 Index)                            1675–1995     Luterbacher et al. (1999)
  Westerly Index (WI)                                                         1685–2008     Wheeler et al. (2010); Barriopedro et al. (2014)
  Cork Annual Totals (Cork)                                                   1738–1748     Wakefield (1812)
  A chronological history of the weather in Dublin                            1716–1765     Rutty (1770); Dixon (1969)
  1716–1765 and associated pressure measurements for
  Dublin∗
∗ identifies series that are likely to be have a risk of circularity.

Table 3. List of rainfall stations recording in the UK for the years prior to the commencement of the contemporary EWP series (i.e. pre 1766)
which would have been available to Nicholas and Glasspoole (1931) in constructing the EWR series. Stations are taken from those listed in
Craddock (1976).

                                     Region                       Station              Observer          Years
                                     Devon/Cornwall               Plymouth             J. Huxham         1725–1752
                                     Devon/Cornwall               Penzance             W. Borlase        1759–1772
                                     London                       Crane Court          F. Hauksbee       1725–1733 & 1744–1781
                                     London                       Tonbridge            J. Hooker         1734–1764
                                     London                       Lambeth              G. J. Symons      1765–1769
                                     London                       Gravesend            J. Hooker         1728–1733
                                     East Anglia                  Norwich              W. Arderon        1750–1762
                                     East Midlands                Southwick (Oundle)   G. Lynn           1726–1741
                                     East Midlands                Lyndon (Rutland)     T. Barker         1737–1798
                                     Yorkshire                    Halifax              Nettleton         1725–1727
                                     Yorkshire                    Darlington           Forth             1734–1742
                                     Yorkshire                    Pickering            T. Robinson       1736–1749
                                     Yorkshire                    Malton               Unknown           1736–1741
                                     Carlisle                     Carlisle             J. Carlyle        1757–1783
                                     Notts and Derby              Chatsworth           G. Cavendish      1761–1813
                                     Liverpool Area               Hulme, Manchester    G. Lloyd          1765–1769

Thomas Neve in Derry during the period 1711–1725. Given                                   1839 data from NW England were used as a proxy Irish sta-
the scarcity of observations in the early part of the Jenkin-                             tion. Similarly, Scottish data were used for the years 1757–
son record, at times annual totals were derived from regional                             1977. Prior to 1811, the number of sources is typically less
series from the UK. For instance, during the period 1757–                                 than four, while for the years 1728–1756 and 1766–1791 the

Clim. Past, 14, 413–440, 2018                                                                                          www.clim-past.net/14/413/2018/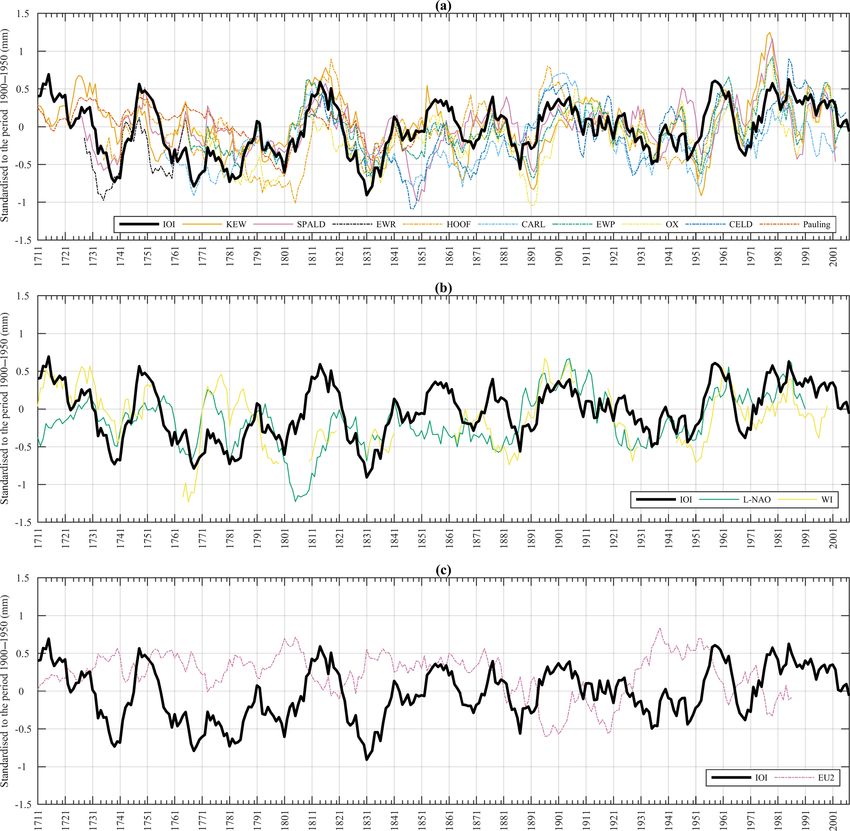
C. Murphy et al.: A 305-year continuous monthly rainfall series for the island of Ireland (1711–2016) 417
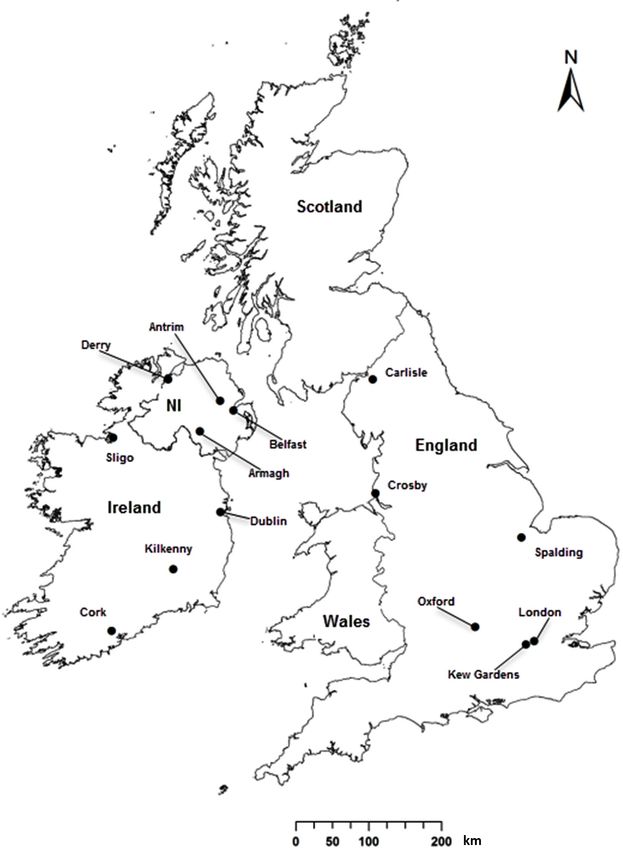
Figure 1. Location of sources comprising the Jenkinson et al. (1979) data, together with locations of comparison precipitation series used in
the analysis. Please note that in terms of the latter we also employ the Hoofddorp series (Amsterdam), which is not plotted on the map. Start
dates of the various series can be found in Tables 1 and 2 for Jenkinson sources and comparison series, respectively.
derived series is based on single sources – the weather di- The methods employed by Jenkinson et al. (1979) to
ary of John Rutty (1770), who compiled monthly and sea- derive annual totals and proportionate monthly values are
sonal weather summaries for Dublin (1716–1765), and a re- incompletely documented, but appear similar to those of
gional series comprising data from NW England and SW Glasspoole (1925) and Nicholas and Glasspoole (1931) in
Scotland, respectively. The latter were compiled by Jenkin- deriving regional rainfall series for the UK and Ireland (see
son et al. (1979) using available data from the UKMO. From Appendix 1 in Wigley et al., 1984 for description). For avail-
the 1790s onwards, instrumental observations from across able stations, Jenkinson et al. (1979) expressed monthly val-
IoI became available, including stations at Dublin, Kilkenny, ues as a fraction (percentage) of the annual value for each
Derry, Belfast, Armagh, Cork and Sligo. station, and these fractions were then averaged over avail-
able stations. Regional estimates of annual totals were con-
www.clim-past.net/14/413/2018/ Clim. Past, 14, 413–440, 2018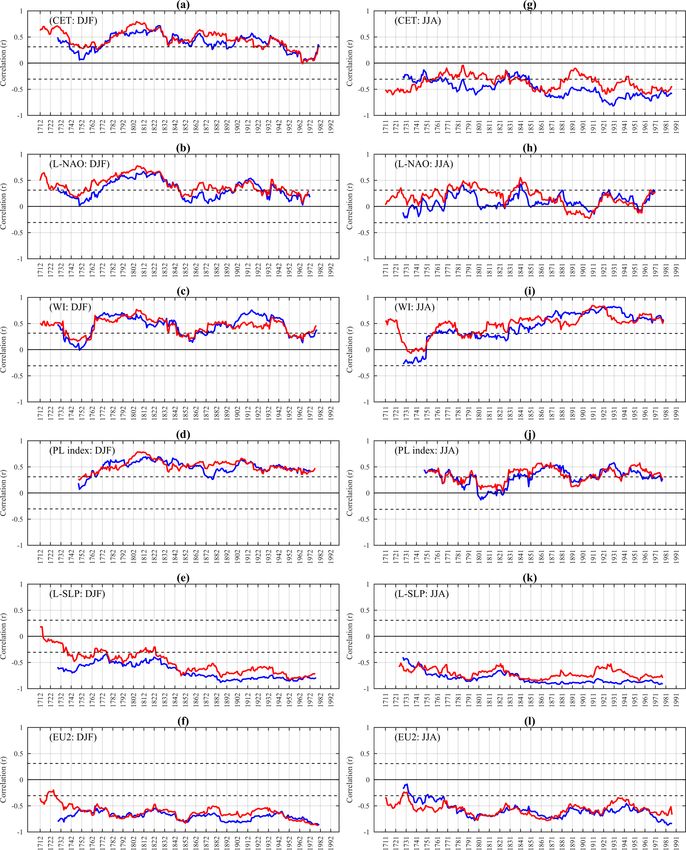
418                    C. Murphy et al.: A 305-year continuous monthly rainfall series for the island of Ireland (1711–2016)

Figure 2. (a) The number of constituent sources used to compile the Jenkinson data for the years 1711–1849; (b) percentage annual rainfall
anomalies (relative to the normal period 1826–1975) contained in Jenkinson et al. (1979) and (c) comparison of (b) with anomalies from
IoI_1850 for years 1850–1977 (anomalies from 1850–1975 mean representing closest approximation of the Jenkinson et al. (1979) normal).

structed by taking an overlapping period of 20–50 years with           1979). Only the latter are provided in the Jenkinson note. For
the Glasspoole series for Ireland (1881–1924) and continu-             any station, estimates of AAR were taken as the arithmetic
ing this overlapping back to the earliest records. According           mean of the available annual totals. Individual years were
to Jenkinson et al. (1979), overlapping periods were varied            recorded as percentages of this AAR. The mean of the per-
according to the available contributing stations with longer           centage values for a given year across available stations was
period records taken as optimum. For each overlapping pe-              then taken as the estimate of the regional percentage of AAR
riod, estimates of AAR were derived iteratively to provide:            for that year. Finally, Jenkinson et al. (1979) used the mean
(i) station AAR, (ii) station annual percentages of AAR and            for all data years to derive the final estimate of the regional
(iii) regional annual percentages of AAR (Jenkinson et al.,

Clim. Past, 14, 413–440, 2018                                                                        www.clim-past.net/14/413/2018/
C. Murphy et al.: A 305-year continuous monthly rainfall series for the island of Ireland (1711–2016)                               419

Figure 3. Reconstructed IoI_1711 precipitation series showing annual and seasonal totals. The grey shading shows the uncertainty in the
reconstruction from resampling of the baseline used to estimate AAR only. The red line (used in subsequent analysis) is the median of the
1000 resamples. From 1850 onwards the data is the IoI_1850 series produced by Noone et al. (2016). The blue line represents a 10-year
moving average.

www.clim-past.net/14/413/2018/                                                                        Clim. Past, 14, 413–440, 2018
420                    C. Murphy et al.: A 305-year continuous monthly rainfall series for the island of Ireland (1711–2016)

Figure 4. Seasonal and annual Spearman’s Rho correlations between IoI_1711 and gridded (0.5◦ resolution) CRU TS V4.1 precipitation for
the years 1901/1902–2015/2016. Grids for which p > 0.05 are denoted white.

AAR (see description of methods in the original document in          nal series was calibrated against Glasspoole’s EWR series,
the Supplement).                                                     although details of this step are not provided by Jenkinson
   The diaries of Thomas Neve (Dixon, 1959), Nicholas                et al. (1979). Moreover, Jenkinson et al. (1979) report annual
Blundell (1968) and John Rutty (1770) are critical sources           anomalies relative to 1826–1975, but this AAR value does
for the early Jenkinson series. The Neve diary contains es-          not appear in the publication.
timates of rainfall totals from Derry taken from a rudimen-
tary gauge (described by Dixon, 1959). Nicholas Blundell’s
diary provides monthly and annual weather summaries for              2.1.2   Deriving the IoI_1711 series
Crosby (Liverpool) in NW England for the years 1711–1715
                                                                     The IoI_1850 series is used to estimate this missing AAR
and 1718–1727. The Rutty diary contains a chronology of
                                                                     and thus to reconstruct the full series. With the exception
weather in Dublin from 1716–1765, including monthly and
                                                                     of the 24 years prior to 1850, there is a large overlap be-
seasonal weather summaries. To convert the qualitative de-
                                                                     tween the normal period applied to the Jenkinson series
scriptions of Blundell and Rutty to a quantitative measure of
                                                                     and the IoI_1850 series. Matching annual anomalies de-
rainfall, Jenkinson et al. (1979) applied a graded scaling sys-
                                                                     rived from the IoI_1850 series using the normal period of
tem, similar to Brázdil et al. (2010a) and Gimmi et al. (2007),
                                                                     1850–1975 with the anomalies derived from the Jenkinson
to both diaries. Scores ranging from one (exceptionally dry)
                                                                     series for concurrent years, reveals a strong positive corre-
to nine (exceptionally wet) were used to rank individual
                                                                     lation (Spearman’s r = 0.95). The time series of both sets
months and aligned with seasonal summaries. Frequencies
                                                                     of anomalies is plotted in Fig. 2c. Resampling was used to
of rankings for each month over the period 1716–1765 were
                                                                     derive estimates of long-term AAR values from 1000 sam-
derived and internal percentages for each month estimated by
                                                                     ples (with replacement) of long-term (100-year) AAR drawn
comparison with frequencies of monthly rankings for the pe-
                                                                     from the IoI_1850 series over the period 1850–2015. Each
riod 1840–1889 (Jenkinson et al., 1979). These values were
                                                                     AAR estimate was used to reconstruct annual totals and sub-
used as a percentage of AAR for each month in the period
                                                                     sequently monthly rainfall totals for the years 1711–1849.
1716–1765. Monthly and annual percentages were processed
                                                                     Post-1850 data remain the homogenised IoI_1850 series of
to give internal percentages for each year, with the annual
                                                                     Noone et al. (2016). Resampling the missing AAR from
percentages of AAR (1825–1977) used to represent a single
                                                                     IoI_1850 has two advantages. First, it ensures that the Jenk-
station (see the original Jenkinson et al., 1979 note in the
                                                                     inson series is mean-adjusted to the homogenised IoI_1850
Supplement). This combination of methods for quantitative
                                                                     series. Second, confidence bounds can be generated for the
and qualitative sources was used by Jenkinson et al. (1979)
                                                                     reconstructed series to convey the uncertainty in estimat-
to produce the final IoI series of annual totals, expressed
                                                                     ing the value of AAR. The combined dataset is named the
as a percentage of AAR for the period 1826–1975. The fi-
                                                                     IoI_1711 series and provides a continuous monthly rain-

Clim. Past, 14, 413–440, 2018                                                                     www.clim-past.net/14/413/2018/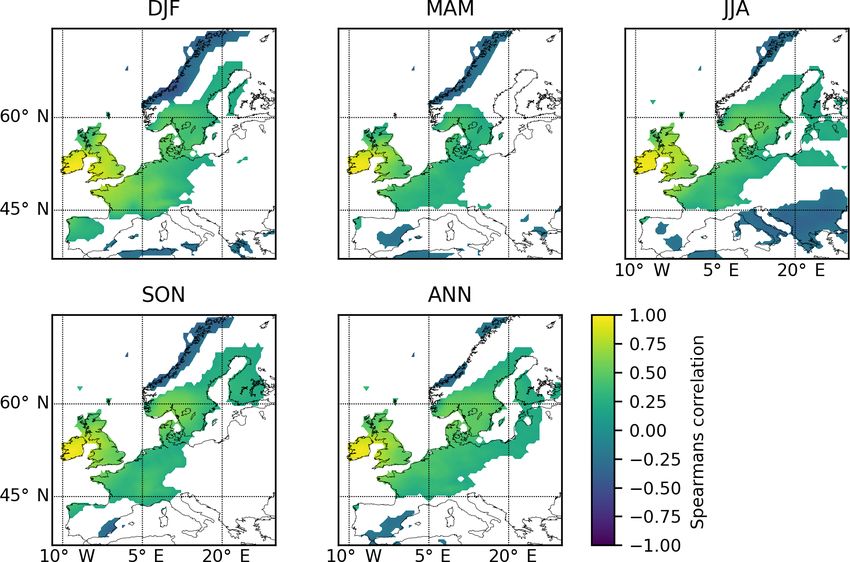
C. Murphy et al.: A 305-year continuous monthly rainfall series for the island of Ireland (1711–2016)                               421

Figure 5. Moving 30-year correlations between IoI_1711 (red) and EWR/EWP (blue) for winter (left) with (a) CET; (b) L-NAO; (c) WI;
(d) PL index; (e) L-SLP; (f) EU2 index and for summer (right) with (g) CET; (h) L-NAO; (i) WI; (j) PL index; (k) L-SLP; (l) EU2 index.
Acronyms used for each series are given in Table 3. Dashed lines indicate 95 % confidence levels for moving correlations identified using
a Monte Carlo procedure.

www.clim-past.net/14/413/2018/                                                                        Clim. Past, 14, 413–440, 2018
422 C. Murphy et al.: A 305-year continuous monthly rainfall series for the island of Ireland (1711–2016)
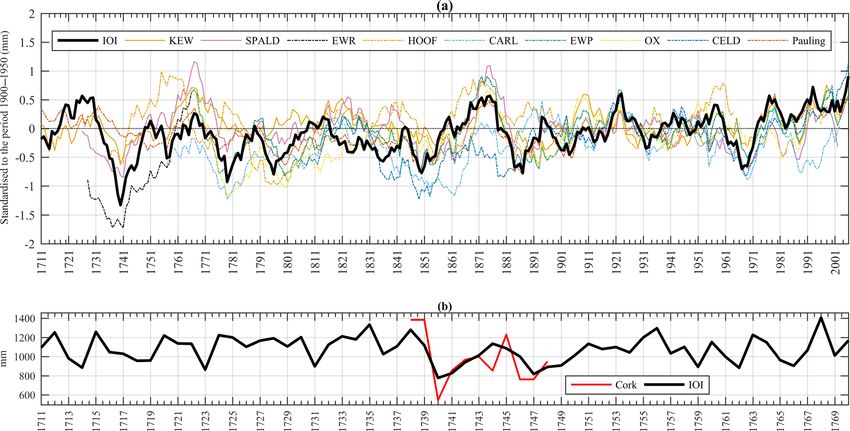
Figure 6. (a) Comparison of decadal mean IoI_1711 annual series (thick black line) with other long term precipitation records standardised
to the period 1900–1950 and (b) comparison of raw annual totals (mm) from Cork with annual totals from the IoI_1711 series. Acronyms
used for each series are given in Table 3.
fall record from January 1711 to February 2016. Subsequent 2.2.1 Category I series that may not be fully
analysis is performed on the median of the IoI_1711 series. independent
2.2 Series used for comparison with IoI_1711 England Wales Rainfall (EWR): Nicholas and Glasspoole
(1931), building on earlier work by Symons (1866), pre-
Other long-term observational series of precipitation, tem-
sented a regional monthly precipitation series for the UK
perature, sea level pressure, and proxy reconstructions of pre-
(1727–1931). Jenkinson et al. (1979) used annual EWR data
cipitation and modes of climate variability and circulation for
to calibrate their series for Ireland, so there are obvious cir-
the region were collated for comparison with the IoI_1711
cularities. However, we include the years 1727–1765 prior to
series. Emphasis is placed on the pre-1850 period as post-
the modern England and Wales Precipitation (EWP) series
1850 has already been interrogated by Noone et al. (2016).
that begins in 1766 (see below). Early EWR data were anal-
Datasets used are listed in Table 2 and the location of precip-
ysed by Jones and Briffa (2006) and provided by Phil Jones.
itation series are mapped in Fig. 1. All reported correlations
We treat the EWR series by simply appending it to the EWP
are derived using Spearman’s rank correlation, with signifi-
series (where EWR and EWP are appended in such man-
cance reported at the 0.05 level. There is a risk of circular-
ner we refer to the resultant series as EWR/EWP). Wigley
ity when comparing with precipitation records from the UK
et al. (1984) note inhomogeneities in the annual totals in the
since some of these observations and documentary sources
early EWR record, whereby there is a tendency to underesti-
were used directly by Jenkinson et al. (1979) to calibrate their
mate precipitation relative to EWP prior to 1870. Moreover,
series against EWR. Therefore, when presenting the data
Tabony (1980) suggests that prior to 1820 EWR is unreliable.
used, series are grouped into two categories: (I) those where
Knowledge of these discrepancies is useful for assessing the
a risk of circularity exists and (II) those that are deemed to
IoI_1711 series. The stations comprising the early EWR se-
be independent, based on examination of data sources.
ries are unclear and there is a need to reconcile the early
EWR series of Glasspoole (1925) with the earlier Symons
(1866) work. Glasspoole (1925) mentions that from 1727–
1756 at least two stations were available, and from 1757–
1774 at least three. Craddock (1976) provides a comprehen-
sive list of stations that would have been available for this pe-
riod of time – certainly more than used by Glasspoole (1925).
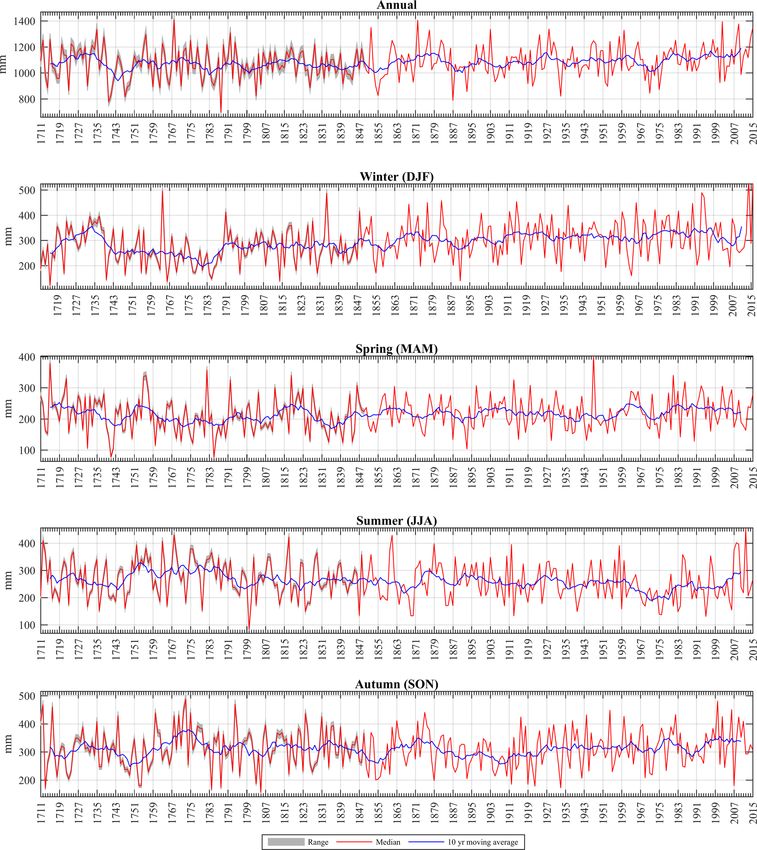
Clim. Past, 14, 413–440, 2018 www.clim-past.net/14/413/2018/C. Murphy et al.: A 305-year continuous monthly rainfall series for the island of Ireland (1711–2016) 423 Figure 7. Comparison of decadal mean IoI_1711 winter (DJF) series (thick black line) with (a) other long term precipitation series; (b) with CET, L-NAO and WI. In (c) a comparison between the three indicators of westerly air flow (L-NAO, WI and PL index) is provided. All series are standardised to the period 1900–1950. Acronyms used for each series are given in Table 3. Table 3 provides a list of stations that were operational (with (Wigley et al., 1984; Alexander and Jones, 2001) and data at least one year of data) in England (note none listed for for key EWP stations prior to 1766 are also employed. While Wales) between 1725 and 1766. This covers the early period EWP runs from January 1766 to present, some constituent in the IoI_1711 series up to the start of the modern EWP se- records extend into the 1700s (e.g. Carlisle, Kew, Spalding ries when traceability is clearer. This list of stations is used at Pode Hole). The early part of these records often con- to identify potential circularity with the IoI_1711 series. tains data from the stations listed in Table 3. However, many England and Wales Precipitation (EWP) Series: the Eng- have also undergone adjustments to correct uncovered qual- land and Wales Precipitation series from 1766 onwards ity issues in the early series. An overview of each series is www.clim-past.net/14/413/2018/ Clim. Past, 14, 413–440, 2018
424                   C. Murphy et al.: A 305-year continuous monthly rainfall series for the island of Ireland (1711–2016)

given in the following paragraphs. The EWP series was ac-         Observatory (Burt and Howden, 2011). Data used here were
cessed via the UKMO website (https://www.metoffice.gov.           provided by co-author Tim Burt.
uk/hadobs/hadukp/).                                                  North Atlantic Oscillation (NAO) reconstruction (L-NAO):
   Kew Gardens Precipitation (Kew): routine rainfall mea-         Luterbacher et al. (2001) developed a monthly resolution
surements have been taken at Kew since 1871. Prior to this,       multi-proxy reconstruction of the NAO Index back to 1659
annual and monthly totals were estimated by Wales-Smith           and seasonal reconstructions back to 1500. Full details of
(1971) back to 1697. During the years 1717–1724 and 1725–         the reconstruction methods and constituent data sources are
1744, the Richmond diaries and the diary of George Smith          given by Luterbacher et al. (2001). Issues of circularity
respectively, were used to derive estimates of monthly totals     arise when using Luterbacher et al. (2001) to interrogate the
calibrated to observational series at Upminster, Fleet Street     IoI_1711 series because of the inclusion of Kew, Spalding
and Tonbridge (all in Table 3). For the remainder of the          (Pode Hole), EWP and other UK records in the reconstruc-
1700s, data from Tonbridge, Lambeth and Somerset House            tion. During the 1700s the number of predictors falls rapidly
feature strongly and the former two are noted in the series       from approximately 40 to less than 20, so these UK precipita-
available to EWR in Table 3. However, monthly and an-             tion series are likely to be more heavily weighted in the NAO
nual totals for 1697–1870 were later revised by Wales-Smith       reconstruction for this period. Data were downloaded from
(1980). Data used here were provided by Todd et al. (2013).       the Climatic Research Unit (CRU) of the University of East
   Spalding (Pode Hole) precipitation (Spald): the early          Anglia (https://crudata.uea.ac.uk/cru/data/paleo/naojurg/).
record for Spalding (1726–present) is a composite of records         European seasonal rainfall reconstructions (Pauling):
from the East Midlands developed by Craddock and Wales-           Pauling et al. (2006) provide a seasonal gridded (0.5◦ res-
Smith (1977) (including Southwick (Oundle) 1726–1736 and          olution) precipitation reconstruction for European land areas
Lyndon 1737–1798 from Table 3), while much of the record          for the period 1500–1900. From 1901 to 2000 the dataset is
for the 19th Century derives from South Kyme and Pode             the gridded reanalysis of Mitchell and Jones (2005). Recon-
Hole thereafter. Tabony (1980) corrected the series for being     structions are developed using a variety of long instrumen-
overly wet during 1770–1870. The quality of the pre-1770          tal precipitation series (including for Ireland and the UK;
record is largely unknown. Data used here were provided by        see Fig. 1 of Pauling et al., 2006) and other documentary
Todd et al. (2013).                                               and proxy sources. Data were downloaded from the Cli-
   Carlisle Precipitation (Carl): the Carlisle series (1757–      matic Research Unit (CRU) (https://crudata.uea.ac.uk/cru/
present) for NW England was constructed as a composite            projects/soap/data/recon/#paul05). The earliest observations
of stations prior to 1872. An annual series for Carlisle was      that would have been part of EWR and used by Jenkinson
first developed by Craddock (1976) and a monthly series           et al. (1979) to calibrate their series, are also used as pre-
subsequently developed for the years 1845–1976 by Tabony          dictors in the Pauling et al. reconstructions (e.g. Kew, Spald-
(1980). The series was further extended to 1757 by Jones          ing). Data for grids closest to each of the 25 stations compris-
(1983). Todd et al. (2015) updated the Carlisle series to         ing the IIP network (Noone et al., 2016) were extracted and
present, and assessed the homogeneity of the record. Data         seasonal regression adjustments developed over the period
for the years 1757–1783 come from observations taken by           1850–2000 using each IIP station. Average seasonal scaling
J. Carlyle, as listed in Table 3. Rainfall totals prior to 1790   adjustments applied to Pauling et al. (2006) data in bridg-
were found to be under-representative and were increased by       ing to IIP stations were 1.03 (DJF), 0.99 (MAM), 0.91 (JJA)
24 %, while annual totals during 1827–1850 were also in-          and 1.01 (SON). The mean of the 25 regression adjusted se-
creased by 10 % (Todd et al., 2015). Data used here were          ries were then averaged to produce an island of Ireland series
provided by Todd et al. (2015).                                   from the Pauling et al. (2006) data.
   Oxford Precipitation (Ox): the Radcliffe Observatory,             Rutty (1770) weather diary (Rutty): the Rutty diary pro-
founded in Oxford in 1772, is the longest and best docu-          vides qualitative insight to the weather conditions experi-
mented continuous series of temperature and rainfall at any       enced in Ireland during the years 1716–1765. As outlined
single site in the UK. Daily observations are available from      above, the Rutty diary was used extensively in the Jenkinson
April 1814, and continuously since 1827 (Burt and How-            series. Nonetheless, drawing on the actual descriptions in the
den, 2011). A reconstructed monthly precipitation record,         diary is useful to help contextualise conditions in the early
first developed by Craddock and Craddock (1977), exists           record. A scanned copy of the Rutty diary is available online
from 1767. Prior to 1815, monthly totals are estimated from       (https://archive.org/details/achronologicalh00ruttgoog).
the manuscripts of Thomas Hornsby (often incomplete and
fragmentary) and data from Shirburn Castle (12 miles from         2.2.2   Category II series that are independent
Oxford), together with estimates from other stations around
Oxford (Stroud, Sunbury and Lambeth, the latter is noted in       Nine independent datasets consisting of observational and
Table 3). The Oxford record is unusual in that much work          proxy records are also employed:
has been done to ensure that the entire record is homoge-            Central England Lake District (CELD) precipitation se-
nous, including the early measurements from the roof of the       ries: Barker et al. (2004) developed a 200-year homogenous

Clim. Past, 14, 413–440, 2018                                                                 www.clim-past.net/14/413/2018/
C. Murphy et al.: A 305-year continuous monthly rainfall series for the island of Ireland (1711–2016)                         425

monthly composite series for the Central England Lake Dis-        the construction of the PL index, together with a compar-
trict (CELD) (1788–2016). Available stations were bridged         ison with available NAO reconstructions, are provided by
to Grasmere High Close using regression to develop sea-           Cornes et al. (2013). Only seasons with no missing data
sonal adjustment factors. Much of the pre-1850 record is          in any constituent month were employed. Data were ob-
drawn from sites at Kendall and Keswick. Neither are key          tained from the CRU website (https://crudata.uea.ac.uk/cru/
stations in the development of EWR/EWP (although Kendall          data/parislondon/).
was used as a station for regression development by Wigley           London SLP (L-SLP): Cornes et al. (2012) present a 300-
et al., 1984). Wilby and Barker (2016) subsequently updated       year (1692–2007) daily series of MSLP for the city of Lon-
the CELD series with a further revision of adjustment factors     don. Digitised data were transcribed from multiple sources,
undertaken in 2017. The data used here were obtained from         quality controlled, corrected and homogenised to represent
Wilby and Barker (2016).                                          daily means of MSLP at standard modern-day conditions.
   Hoofddorp (1735–1973) (Hoof): monthly precipitation            Monthly values of MSLP are not reported when missing
data recorded for the Netherlands over the period 1735–1973       values exceed 20 %. Here, seasonal MSLP is only derived
(Tabony, 1981; Slonosky, 2002), downloaded through the            when all three months are reported. Data were obtained
KNMI Climate Explorer website (http://climexp.knmi.nl/).          from the CRU website (https://crudata.uea.ac.uk/cru/data/
   Central England Temperature (CET) record (Manley,              parislondon/).
1974; Parker et al., 1992): temperature data coincident with         East Atlantic/Western Russia pattern (Eurasia 2 pattern
IoI_1711 is used to assess consistency of rainfall, especially    EU2) (EU2 Index): the EU2 index (Barnston and Livezey,
in winter given that warm winters tend to be associated with      1987) measures the zonal pressure difference across cen-
wet conditions. CET data were downloaded from the UKMO            tral Europe and is important in describing the variability
website (https://www.metoffice.gov.uk/hadobs/hadcet/).            of Eurasian climate, especially during boreal winter (Luter-
   Cork annual rainfall totals (Cork): in his list of rainfall    bacher et al., 1999). The EU2 pattern is characterised by two
records operating before 1780, Craddock (1976) cites a num-       main large scale pressure anomalies located over the Caspian
ber of stations for Ireland including Derry (1711–1724),          Sea and Western Europe and is found to be closely re-
taken by Thomas Neve; Castle Dobbs, Antrim (1727), taken          lated to Rossby wave propagation (Lim, 2015). Luterbacher
by A. Dobbs and annual totals for Cork (1738–1748) taken          et al. (1999) reconstructed monthly EU indices back to 1675,
by Timothy Tuckey. While the first two sources are used in        with the derived data for the EU2 index provided for this
the Jenkinson series, the latter for Cork is not. Annual totals   analysis by Luterbacher.
for Cork (south Ireland) were published by Wakefield (1812,          Southern England tree ring precipitation reconstruction
p. 207) and transcribed here. Neither the exact location nor      (Rinne): Rinne et al. (2013) present a 400-year long (1613–
the design of Tuckey’s gauge is known.                            2003), annually resolved May to August precipitation recon-
   Westerly Index (WI): Barriopedro et al. (2014) developed       struction for southern England developed from oxygen iso-
a monthly index of atmospheric circulation variability over       tope measurements of tree ring cellulose in pedunculate oak
the North Atlantic from 1685–2008. Their index is based on        (Quercus robur). Using these reconstructions (1613–1893)
direct observations of wind direction from Royal Navy log-        and instrumental data (1894–2003), their derived precipita-
books from 1685–1850 provided by ship movements in the            tion series has been shown to be robust back to at least 1697 –
English Channel. After 1850, the CLIWOC v1.5 (Garcia-             the first year of the oldest existing instrumental precipitation
Herrera et al., 2005) and the ICOADS v2.1 (Worley et al.,         series in England (at Kew, see above). Data were obtained
2005) datasets for the same area are used. The so-called          from Katja Rinne-Garmston.
Westerly Index (WI) provides a measure of the persistence
of westerly winds beneath the exit zone of the North Atlantic     2.3   Quality assurance, variability and change
extratropical jet-stream (Wheeler et al., 2010). Before 1850,
the WI contains only one record of wind direction (measured       The annual and seasonal IoI_1711 series were tested for ev-
with a 32-point compass) per day, with data available for         idence of step changes in the mean and for change in vari-
95 % of days (Barriopedro et al., 2014). The monthly WI           ance. The Shapiro–Wilks test (Royston, 1982) confirms that
used here is defined as the percentage of days per month          the annual and seasonal series conform to a normal distri-
with prevailing wind from the west (i.e. blowing from be-         bution. Given the lack of a homogenous reference series for
tween 225 and 315◦ from true north). WI data were obtained        comparison using relative methods, the Pettitt (1979) test and
from Dennis Wheeler.                                              the Standard Normal Homogeneity Test (SNHT) for a sin-
   Paris–London (PL) Index: Cornes et al. (2013) developed        gle break (Alexandersson, 1986) were used to examine evi-
the Paris–London index (1692–2004) as an indicator of the         dence for break points in the mean. Both tests were selected
state of the NAO index. This index, developed from recov-         given their wide use in the climate literature and their abil-
ered and corrected mean sea level pressure (MSLP) data            ity to identify the likely year of break. Pettitt is an absolute,
from the respective cities, provides a consistent measure         non-parametric test and, being rank based, is less sensitive
of westerly air flow over northwest Europe. Full details of       to outliers. SNHT assumes data are normally distributed. For

www.clim-past.net/14/413/2018/                                                                  Clim. Past, 14, 413–440, 2018
426                    C. Murphy et al.: A 305-year continuous monthly rainfall series for the island of Ireland (1711–2016)

all tests the null hypothesis (no change point in time series)      Trend significance was assessed at the 0.05 level using a two-
against the alternative (an upward or downward change point         tailed test. The null hypothesis of no trend was rejected if
in a given year) was tested at the 0.05 level. It should be noted   |Zs| > 1.96. Dependency of trends on the period of record
that where breaks were identified no adjustments were made          was investigated by deriving MK Zs for all possible start and
to the data; instead the tests were used to identify points of      end dates with a minimum of 30 years duration (e.g. Murphy
interest requiring further investigation.                           et al., 2013; Hall et al., 2014).
   To test for changes in variance the annual and seasonal
series were split into three 100-year sections: 1711–1810,
                                                                    3     Results
1811–1910 and 1911–2010. As the winter series commences
in 1712 each section was incremented one year (e.g. 1712–           3.1    The IoI_1711 series
1811 and so on). While the F test is widely used for testing
differences in variance, it is extremely sensitive to assump-       To derive the IoI_1711 series 1000 re-samples (with replace-
tions of normality (Wang et al., 2008). This is also the case       ment) of long-term (100-year) AAR were drawn from the
for the Bartlett’s test (Bartlett, 1937). Here, application of      homogenised IoI_1850 series. These range between 1039
the Shapiro–Wilks test to each annual and seasonal 100-year         to 1120 mm, with a median of 1080 mm. Each re-sample
section reveals a small number of series to be non-normal.          was used to estimate the annual anomalies and subsequently
Thus, we use Levene’s test which is less sensitive to depar-        monthly totals from the pre-1850 Jenkinson data. Figure 3
tures from normality (Conover et al., 1981; Snedecor and            shows the resultant IoI_1711 time series annual and seasonal
Cochran, 1989, p. 252) to compare variances across each of          totals. The rest of our analysis is based on the IoI_1711 series
the three 100-year sections. For all tests the null hypothesis      calculated from the ensemble median.
(that each section has identical variance) against the alterna-        Application of the Pettit test to the median annual series
tive (at least one of the sections has a different variance) was    revealed no statistically significant step change in the mean
tested at the 0.05 level.                                           at the 0.05 level. However, further investigation of p val-
   Correlation between IoI_1711 rainfall and other long term        ues reveals a significant change at the 0.1 level (p = 0.053)
series was assessed using the non-parametric Spearman’s             in 1922. Noone et al. (2016) also found significant breaks
Rho test. To examine the extent of the relationship between         (p < 0.1) across many of the 25 stations comprising the
IoI_1711 and precipitation across Europe, seasonal and an-          IoI_1850 series in the early 1920s. Consistency in the tim-
nual correlations were computed between the CRU TS V4.1             ing of these breaks across stations, along with an absence of
gridded series (0.5◦ resolution) (Harris et al., 2013) and          evidence from metadata describing widespread measurement
IoI_1711 for the years 1901/1902–2015/2016. For selected            changes across the island, suggests that this break is due to
long-term series moving 30-year correlations were assessed.         natural climate variability. The SNHT test reveals a signifi-
The 95 % confidence levels for moving correlations were             cant step change in 1976 (p = 0.027). The timing of breaks
identified using a Monte Carlo procedure for which correla-         is consistent with an increase in annual totals associated with
tions between the observed and a set of one thousand ran-           a shift to a positive phase of the North Atlantic Oscillation
domly generated time series were estimated (Kokfelt and             around this time (Harrigan et al., 2014). Both tests also reveal
Muscheler, 2013). Confidence levels were calculated as the          a significant upward step change in winter (1864; p < 0.001)
2.5th and 97.5th percentiles of the moving correlation values       and downward step change in summer (1855; p = 0.015).
returned by simulated series. Following Pauling et al. (2006),      Neither step change was identified by Noone et al. (2016) for
each time series generated by the Monte Carlo procedure has         the IoI_1850 series given that they both occurred so close to
the same statistical attributes (variance, mean and lag-one au-     the start of that record.
tocorrelation) as the observations (Gershunov et al., 2001).           Levene’s test reveals no significant differences in variance
   All records were standardised (rescaled to have a mean           between the three 100-year blocks when analysed for all four
of zero and a SD of one) to the period 1900–1950 to as-             seasons. However, a significant difference (p = 0.040) in the
sess decadal variability and change. This period is common          variance of the three blocks is noted in the annual series. Fur-
to all datasets and is a time of good data coverage and qual-       ther investigation reveals that a statistically significant differ-
ity. Annual and seasonal (winter (DJF), spring (MAM), sum-          ence (p = 0.016) in the variance of annual precipitation to-
mer (JJA) and autumn (SON)) decadal moving averages were            tals occurs between the periods 1711–1810 and 1811–1910,
then computed for all long-term datasets. Decades are named         with the 1700s (134.3 mm) revealing a higher SD than the
according to their start year (i.e. 1950 denotes the ten years      1800s (109.5 mm). But neither block shows significant dif-
1950–1959). The non-parametric Mann–Kendall (MK) test               ferences relative to 1911–2010 (SD 114.6 mm).
(Mann, 1945; Kendall, 1975) was used to detect monotonic
trends in seasonal and annual totals. The MK test statistic         3.2    Correlation of records with IoI_1711
(Zs) has mean of zero and variance of one. Positive (neg-
ative) Zs indicates a positive (negative) trend in precipita-       Figure 4 shows the correlation of precipitation for IoI
tion. The magnitude of Zs indicates strength of the trend.          with other locations in Europe for the period 1901/1902

Clim. Past, 14, 413–440, 2018                                                                    www.clim-past.net/14/413/2018/
C. Murphy et al.: A 305-year continuous monthly rainfall series for the island of Ireland (1711–2016) 427
to 2015/2016. Non-significant correlations (p > 0.05) are the pre-1850 record. There is strong coherence of correla-
masked white. Significant correlations are evident across tions of selected series with both IoI_1711 and EWR/EWP,
wide areas of Europe annually and for all seasons. Corre- with the exception of the early EWR series when correlated
lations are strongest in winter, with strong positive corre- against L-SLP and the EU2 index.
lations found throughout the UK (weaker in north-western For summer (Fig. 5, right), moving 30-year correlations
Scotland), and areas of Brittany (northern France). Strong are typically more variable than for winter. CET shows neg-
negative correlations with IoI are also evident for winter ative correlations with the precipitation series, with periods
along the western coast of Scandinavia (also present in spring of significant correlations intermittent throughout the record.
and autumn). In summer, negative correlations exist between Stronger correlations are evident with EWR/EWP than for
IoI_1711 and rainfall over Italy and the Balkan Peninsula. IoI_1711. Moving 30-year correlations with L-NAO tend to
Table 4 shows the correlation of individual long-term se- be weak and non-significant in summer, with the exception
ries with IoI_1711 annual and seasonal totals for the pe- of the latter half of the 18th Century (significant positive cor-
riod 1790–2000, the longest overlap between most stations. relation). WI shows significant positive correlations up to the
Note that there are missing data in some series (up to 1720s and from the 1750s to the end of the record. There is
27 years for Hoofddorp, which ends in 1973). The Paul- an increasing tendency in the value of the correlation coeffi-
ing reconstructions consistently show the strongest correla- cients of both IoI_1711 and EWR/EWP with the WI. Persis-
tions, however, we note that these are seasonally adjusted tently strong and significant negative correlations are appar-
to IoI _1850 (see Sect. 2.2.1). Otherwise, EWP shows the ent for L-SLP throughout the record, indicating the impor-
strongest correlation with IoI_1711. Annually, all long-term tance of blocking (high SLP) in the regional summer precipi-
series show significant correlations with IoI_1711, with EWP tation regime. The EU2 index also shows significant negative
(r = 0.67), CELD (r = 0.58) and Carlisle (r = 0.52) reveal- correlations throughout the record for IoI_1711.
ing the strongest correlations (p = 0.001). L-SLP shows
a modest negative correlation with IoI_1711 annual totals 3.3 Comparison of decadal variability
(r = −0.46), with weaker positive correlations evident for
the PL-index (r = 0.27), the WI (r = 0.41) and L-NAO (r = The following paragraphs examine the consistency of annual
0.21). In winter, strongest correlations (all r > 0.70) with and seasonal decadal moving averages for IoI_1711 with
IoI_1711 are evident for EWP, Oxford and Kew. Indices other long-term series from Table 2. Table 5 distils the key
representing westerly air flow show correlations with win- findings for each season.
ter IoI_1711 ranging from r = 0.51 (PL Index) to r = 0.37
(L-NAO), while the EU2 index shows significant negative 3.3.1 Annual
correlation (r = −0.67). In spring, strongest correlations are
Figure 6a compares decadal moving averages for each long-
evident with EWP (r = 0.73), CELD (r = 0.64) and Carlisle
term precipitation series. Strong agreement between all se-
(r = 0.63). The EU2 Index and L-SLP show significant neg-
ries is evident. In the pre-1766 record, EWR reveals the low-
ative correlation (r = −0.64 and −0.58, respectively) while
est decadal mean annual totals, consistent with concerns that
the WI shows a significant positive correlation (r = 0.46).
EWR underestimates early totals (Jones and Briffa, 2006).
For summer, strongest correlations are evident with EWP
In the IoI_1711 annual series the most recent decade (2006–
(r = 0.75) and L-SLP (r = −0.71). The latter indicates the
2015) is the wettest. Indeed, the last 50 years has seen the
regional influence of blocking on precipitation in summer.
most persistent period of decadal mean annual totals above
Similar, (albeit slightly weaker) correlations are evident for
the 1900–1950 mean. This is also the case for the Pauling
autumn.
data. The driest decade in the IoI_1711 annual series was
Associations with selected series are further explored by
1740–1749. The 1740s was also notably dry in the other long
examining moving 30-year correlations (Fig. 5). For compar-
series covering this period. For instance, the 1740s was the
ison, correlations of each variable with EWR/EWP are also
driest decade on record for Spalding and second driest for
included (blue line in Fig. 5). In winter (Fig. 5, left) signif-
Kew (after 1893–1902). Although the 1740s were notably
icant positive correlations are evident with CET in the early
dry in the Hoofddorp series, decades commencing from the
1700s and from the 1760s through to the 1940s. Both the L-
1790s through to the early 1800s were even drier. Figure 6b
NAO and WI index show time varying correlations with both
plots the early annual totals from Cork taken by T. Tuckey
IoI_1711 and EWR/EWP. Significant positive correlations
relative to the raw IoI_1711 annual totals. These data con-
with L-NAO are evident in the early and late 1700s and early
firm that the 1740s were notably dry. In both series, 1740
1800s, while the WI shows significant correlations from the
was the driest year of the decade, followed by 1747. Indeed,
1760s to the 1840s, and again for the 1870s through to the
in the entire IoI_1711 series, 1740 is the second driest year
1940s. The PL-index shows more persistent significant cor-
after 1788.
relation with winter precipitation. Both L-SLP and the EU2
index show persistent negative correlations with winter pre-
cipitation, however, correlations with L-SLP are weaker in
www.clim-past.net/14/413/2018/ Clim. Past, 14, 413–440, 2018428 C. Murphy et al.: A 305-year continuous monthly rainfall series for the island of Ireland (1711–2016)
Table 4. Spearman’s rank correlation of IoI_1711 seasonal and annual totals with other long-term records for the period 1790–2000. Corre-
lations significant at the 0.05 level are shown in bold, a indicates significant correlations at the 0.01 level and b at the 0.001 level. Note that
Rinne series is only for the months MJJA and is reported under summer. Acronyms used for each series are given in Table 3.
Winter (DJF) Spring (MAM) Summer (JJA) Autumn (SON) Annual
EWP 0.85b 0.73b 0.75b 0.68b 0.67b
Kew 0.70b 0.45b 0.52b 0.51b 0.43b
Carl 0.64b 0.63b 0.65b 0.60b 0.52b
CELD 0.67b 0.64b 0.65b 0.64b 0.58b
Spald 0.56b 0.43b 0.57b 0.48b 0.44b
Ox 0.72b 0.54b 0.53b 0.50b 0.50b
Hoof 0.46b 0.41b 0.42b 0.31b 0.29b
CET 0.45b 0.00 −0.34b 0.24b 0.20
Pauling 0.96b 0.95b 0.94b 0.93b 0.76b
L-SLP −0.58b −0.58b −0.71b −0.63b −0.46b
PL Index 0.51b 0.38b 0.32b 0.39b 0.27b
WI 0.45b 0.46b 0.47b 0.40b 0.41b
L-NAO 0.37b 0.07 0.14a 0.43b 0.21b
EU2 Index −0.67b −0.64b −0.60b −0.57b −0.50b
Rinne 0.51b
Table 5. Synthesis of key findings from the comparison of IoI_1711 annual and seasonal decadal means with other long-term series.
IoI_1711 Series Summary of key findings
Annual IoI_1711 shows strong consistency with all other observational records throughout the series. There is thus high
confidence in the annual series. The wettest decade in the series is the most recent (2006–2015), while the driest
(1740–1749) is consistent with other long series covering this period. The early, independent, observations from
Cork add confidence to the 1740s being exceptionally dry.
Winter (DJF) IoI_1711 is consistent with other observational records from ∼ 1790 onwards, increasing confidence in this part
of the series. Prior to this there is divergence among all observational records. Confidence in the 1730s being an
exceptionally wet decade in the IoI_1711 series is built from coherence with CET, L-NAO, WI, EU2 Index at this
time. While dry, given coherence with a persistently negative L-NAO, the period from 1740–1780 is likely overly
dry in our series. The driest decade in the IoI_1711 series (1777–1786) is broadly consistent with other records.
Spring (MAM) IoI_1711 shows strong coherence with all observational records from 1740 onwards. Prior to this the number of
comparison stations decreases (Spald/EWR), though consistency is maintained, thus increasing confidence in the
entire series. There is also strong coherence with indicators of westerly flow throughout the record, with wet decades
consistent with enhanced westerly flow, and dry spring conditions with reduced westerly flow. The wettest spring
decade (1715–1724) is consistent with a strongly positive WI and the driest spring decade (1831–1840) is consistent
with EWP and Oxford series.
Summer (JJA) The key feature of the IoI_1711 summer series are the exceptionally wet decadal totals through the latter half of
the 1700s. While this period is also exceptionally wet in other observational records and tree ring reconstructions,
particularly in the 1750s and 1760s, the persistence of wet conditions is not evident in subsequent decades. Wet
conditions throughout the period are consistent with a persistently positive L-NAO and WI, and low L-SLP and EU2
index. Otherwise, consistency with long-term observations increases confidence in the IoI_1711 summer series.
Autumn (SON) IoI_1711 shows strong coherence with long term observations and models of variability throughout the record, thus
building confidence in the entire series. The driest (1745–1754) and wettest (1770–1779) decades are consistent
with other long-term series, as is the notable variation in the early record.
3.3.2 Winter (DJF) decadal mean totals for all winter series standardised to the
period 1900–1950. Consistency of all precipitation series
Winters (DJF) are named by the year in which January falls, (Fig. 7a) from about 1790 onwards is noted. Prior to this
so that winter 1712, for example, comprises December 1711 there is divergence between the available precipitation se-
together with January and February of 1712. Figure 7 plots
Clim. Past, 14, 413–440, 2018 www.clim-past.net/14/413/2018/You can also read