Gulf of Alaska ice-marginal lake area change over the Landsat record and potential physical controls
←
→
Page content transcription
If your browser does not render page correctly, please read the page content below
The Cryosphere, 15, 3255–3278, 2021
https://doi.org/10.5194/tc-15-3255-2021
© Author(s) 2021. This work is distributed under
the Creative Commons Attribution 4.0 License.

Gulf of Alaska ice-marginal lake area change over the Landsat
record and potential physical controls
Hannah R. Field1,2 , William H. Armstrong1 , and Matthias Huss3,4,5
1 Department  of Geological and Environmental Sciences, Appalachian State University, Boone, NC 28607, USA
2 School of Earth Sciences, The Ohio State University, Columbus, OH 43210, USA
3 Laboratory of Hydraulics, Hydrology and Glaciology (VAW), ETH Zurich, Zurich, Switzerland
4 Swiss Federal Institute for Forest, Snow and Landscape Research (WSL), Birmensdorf, Switzerland
5 Department of Geosciences, University of Fribourg, Fribourg, Switzerland

Correspondence: William H. Armstrong (armstrongwh@appstate.edu)

Received: 17 December 2020 – Discussion started: 18 January 2021
Revised: 17 May 2021 – Accepted: 9 June 2021 – Published: 15 July 2021

Abstract. Lakes in contact with glacier margins can im-           area change, the influence of a lake’s specific geometry and
pact glacier evolution as well as the downstream biophys-         topographic setting overrides these external controls.
ical systems, flood hazard, and water resources. Recent
work suggests positive feedbacks between glacier wastage
and ice-marginal lake evolution, although precise physical
controls are not well understood. Here, we quantify ice-          1   Introduction
marginal lake area change in understudied northwestern
North America from 1984–2018 and investigate climatic, to-        The development and evolution of ice-marginal lakes (both
pographic, and glaciological influences on lake area change.      proglacial and ice-dammed lakes) may have implications for
We delineate time series of sampled lake perimeters (n =          both upstream glacier systems and downstream fluvial envi-
107 lakes) and find that regional lake area has increased         ronments (Baker et al., 2016; Otto, 2019; Tweed and Car-
58 % in aggregate, with individual proglacial lakes grow-         rivick, 2015). The formation and growth of a proglacial lake
ing by 1.28 km2 (125 %) and ice-dammed lakes shrinking            (a lake that forms downstream of a glacier terminus) marks
by 0.04 km2 (−15 %) on average. A statistical investigation       a fundamental transition in alpine landscapes, with the in-
of climate reanalysis data suggests that changes in summer        tervening lake modifying transport of water, sediment, and
temperature and winter precipitation exert minimal direct in-     nutrients to the downstream river and altering mass loss and
fluence on lake area change. Utilizing existing datasets of ob-   dynamics of the upstream glacier (Baker et al., 2016; Bogen
served and modeled glacial characteristics, we find that large,   et al., 2015; Dorava and Milner, 2000; Jacquet et al., 2017;
wide glaciers with thick lake-adjacent ice are associated with    Ratajczak et al., 2018). Additionally, the presence of ice-
the fastest rate of lake area change, particularly where they     dammed lakes (lakes dammed by a glacier that often form in
have been undergoing rapid mass loss in recent times. We          tributary valleys or at the glacier margin) enables glacial out-
observe a dichotomy in which large, low-elevation coastal         burst floods (GLOFs) that contribute to short-term changes in
proglacial lakes have changed most in absolute terms, while       downstream geomorphologic and hydrologic dynamics and
small, interior lakes at high elevation have changed most         may pose a serious hazard to downstream communities (Car-
in relative terms. Generally, the fastest-changing lakes have     rivick and Tweed, 2016; Roberts et al., 2003; Tweed and Rus-
not experienced the most dramatic temperature or precipita-       sell, 1999). The response of ice-marginal lakes, in terms of
tion change, nor are they associated with the highest rates of    both number and size, to climate change is an important is-
glacier mass loss. Our work suggests that, while climatic and     sue for alpine environments globally because of these inter-
glaciological factors must play some role in determining lake     system links (Stokes et al., 2007; Zemp et al., 2015). Despite
                                                                  the critical role of these lakes, little is known about phys-

Published by Copernicus Publications on behalf of the European Geosciences Union.
3256                             H. R. Field et al.: Gulf of Alaska ice-marginal lake area change over the Landsat record

ical controls on ice-marginal lake formation and evolution        calving (e.g., Chernos et al., 2016) and/or by modulating sub-
(Falatkova et al., 2019; Magnin et al., 2020). To address this    glacial hydraulics (Tsutaki et al., 2011). However, despite
knowledge gap, we investigate trends in ice-marginal lake         their similarity to marine-terminating (tidewater) glaciers,
area change across northwestern North America, a relatively       lake-terminating glaciers likely calve less vigorously and ex-
unstudied region, over the satellite record and explore physi-    perience less subaqueous melt than their tidewater counter-
cal controls on observed behavior.                                parts due to shallower and colder water near the terminus and
   Globally, proglacial lakes have expanded and increased in      the lack of upwelling meltwater plumes (Truffer and Motyka,
number over the 20th–21st centuries (Shugar et al., 2020;         2016).
Stokes et al., 2007; Tweed and Carrivick, 2015; Wang et              Above, we discuss the impacts of ice-marginal lake change
al., 2015). Iceland has experienced an increase in the num-       on the lakes’ associated glacier, but this is a two-way process,
ber of proglacial lakes, with individual lakes increasing in      with glacier change also impacting their associated lakes.
area by up to 18 km2 (Canas et al., 2015; Tweed and Carriv-       Globally, the extensive retreat of glaciers has been associated
ick, 2015). Across the Hindu Kush Himalayas, glacial lake         with the increase in the number and size of proglacial lakes
change has been variable and appears to be indirectly linked      (Otto, 2019; Stokes et al., 2007). However, the exact mecha-
to glacier change (Gardelle et al., 2011). Glacial lakes in the   nisms driving lake area change and its sensitivity to climate
central and eastern Himalayas have significantly expanded         change are not well understood. Both glacier processes (e.g.,
in both number and size over the past 30–40 years, which          sensitivity of glacier mass balance to temperature change,
coincides with glacier retreat and precipitation changes in       glacier response time) and local subglacial topography likely
those regions (Bajracharya et al., 2015; Gardelle et al., 2011;   contribute to how lakes change over time and space (Debnath
Khadka et al., 2018; Shukla et al., 2018; Treichler et al.,       et al., 2018; Otto, 2019; Song et al., 2017), and these factors
2019; Wang et al., 2015; Zhang et al., 2019). In the west-        themselves may interact and/or change over time. Previous
ern Himalayas where glaciers are experiencing less retreat,       work suggests that the main factor in lake development is the
lakes appear to be shrinking (Gardelle et al., 2011). In the      presence of glacial overdeepenings and confining topography
southern Andes, glacier lakes (including some lakes not in        (Buckel et al., 2018; Cook and Swift, 2012; Farías-Barahona
direct contact with glaciers) appear to be primarily grow-        et al., 2020; Haeberli et al., 2016; Otto, 2019). Changing air
ing in number, with smaller cumulative area increase (7 %)        temperature and precipitation also play an important role in
than seen elsewhere (Wilson et al., 2018). Less is known          proglacial lake area change by influencing glacial thinning,
about ice-marginal lakes in northwestern North America, a         retreat, and meltwater runoff (Debnath et al., 2018; Treichler
region that is experiencing increasing air temperatures and       et al., 2019), though Brun et al. (2020), focusing on closed
changing precipitation that has generally resulted in negative    basins not in direct contact with glaciers, found minimal in-
glacier mass balance (Larsen et al., 2015) and loss of glacier    fluence of glacier mass loss on Tibetan lake volume change.
coverage (Arendt et al., 2009). Wolfe et al. (2014) indicate      In Alaska, glacier thinning and tributary disconnection alter
that Alaska glacier-dammed lakes have become less common          basin morphology, and the distribution of ice-dammed lakes
over 1971–2008. The total number of ice-dammed lakes de-          shifted to higher elevation over the late 20th century (Wolfe
creased by 23 %, though 34 % of lakes existing in 2008 were       et al., 2014). Glaciological factors such as debris cover and
newly formed (Wolfe et al., 2014). We expand upon the work        regional glacier mass loss may also influence proglacial lake
of Wolfe et al. (2014) by assessing change in proglacial lakes    evolution (Song et al., 2017).
in addition to ice-dammed lakes, characterizing area change          Ice-marginal lakes can impact downstream ecosystems by
in addition to quantity, and probing the underlying physical      altering sediment fluxes, geochemical cycling, and down-
controls.                                                         stream geomorphological characteristics, among other im-
   The development and evolution of an ice-marginal lake          pacts (Baker et al., 2016; Dorava and Milner, 2000). The re-
can impact its associated glacier. Theoretically, the presence    duced suspended sediment load in glacier-fed streams and
of proglacial lakes can influence glacier ablation through        rivers downstream from proglacial lakes enhances habitats
thermal and mechanical processes (Tweed and Carrivick,            for aquatic organisms (Bogen et al., 2015; Dorava and Mil-
2015). Observations of the glaciological impact of lake for-      ner, 2000). Stream temperature is higher and less time vari-
mation are mixed, with some studies finding increased rates       able downstream from lakes, and this thermal regulation is
of mass loss (King et al., 2019) and speed (Tsutaki et al.,       also beneficial for many aquatic species (Dorava and Milner,
2011; Watson et al., 2020) on lake-terminating glaciers, with     2000; Fellman et al., 2014). Proglacial lakes may also stabi-
support from non-numerical modeling (Sutherland et al.,           lize downstream channel morphology, contributing increased
2020), though other observational studies suggest glacier-        bank stability (Dorava and Milner, 2000). Conversely, ice-
averaged mass balance is minimally affected by the presence       dammed lakes may increase the rate of channel migration
of a proglacial lake (Larsen et al., 2015). The presence of a     and contribute to more transient channel geometry due to
lake at the terminus of a glacier may allow thermally induced     outburst flooding (Jacquet et al., 2017). Understanding the
subaqueous melt (e.g., Robinson and Matthaei, 2007) and           development and evolution of these lakes is critical due to
may also increase glacier mass loss by enabling increased         their influence on both local and regional environments.

The Cryosphere, 15, 3255–3278, 2021                                                  https://doi.org/10.5194/tc-15-3255-2021
H. R. Field et al.: Gulf of Alaska ice-marginal lake area change over the Landsat record                                      3257

   The complicated interrelations of geomorphic, climatic,        tial and temporal variability exists in the pattern of glacier
and glaciologic influences on ice-marginal lake area change       mass loss (Menounos et al., 2019).
must be untangled to develop a better understanding of the
main drivers of ice-marginal lake area dynamics. A concep-        2.2   Climatic variables
tual model for physical controls on both proglacial and ice-
dammed lake behavior is necessary for predicting lake evo-        We retrieve climate data from the Scenarios Network for
lution in a warming world, highlighting which lakes may be        Alaska + Arctic Planning (SNAP) database (accessible at
most sensitive to perturbations and assessing potential im-       http://ckan.snap.uaf.edu/dataset, last access: 13 July 2021).
pacts on their adjacent biophysical systems. This study seeks     The database includes 2 km×2 km resolution gridded climate
to narrow this knowledge gap in two ways. First, we docu-         data downscaled from the Climatic Research Unit Time-
ment what is happening – how are proglacial lakes chang-          Series (CRU TS3.10) and Parameter-elevation Regressions
ing across northwestern North America? What are the rates         on Independent Slopes Model (PRISM) datasets (Daly et
and spatial patterns of change? Secondly, we investigate why      al., 1997; Harris et al., 2014). SNAP provides access to his-
this is happening – what are the dominant physical con-           torical air temperature estimations including seasonal, an-
trols on ice-marginal lake behavior? Do these controls vary       nual, and decadal monthly means. We retrieve decadal sum-
across space? Explicitly, we employ statistical analyses to       mer air temperature and winter precipitation data (Table 1;
explore climatic, glaciological, and topographic associations     Fig. S1a and b), which are the quantities most relevant to
with ice-marginal lake area change. By answering the ques-        non-equatorial glacier mass balance (Cuffey and Paterson,
tions above, we hope to inform our understanding of this          2010). The summer temperature products have average un-
critical landscape interface to enhance prediction of how up-     certainties of ±0.3 ◦ C, with a 0.1 ◦ C cold bias (Bieniek et al.,
stream and downstream systems will evolve in a warming            2016). Precipitation data include estimates of monthly totals
world.                                                            and means of annual, seasonal, and decadal monthly means
                                                                  of total precipitation. The winter precipitation estimates have
                                                                  an uncertainty of ±4.1 mm d−1 , with a −0.9 mm d−1 dry bias
2     Study area, datasets, and data pre-processing               (Bieniek et al., 2016). These data do not subdivide precipita-
                                                                  tion into rain and snow. We investigated the influence of 10-
Below, we introduce the study region and then describe our        year averages of winter (December, January, and February)
climatic, glaciologic, and geomorphic data sources for sta-       precipitation, summer (June, July, and August) air tempera-
tistical analyses employed to investigate drivers of lake area    ture, and the changes in these quantities between the 2000–
change. In Sect. 2.2–2.4, we describe the datasets used to        2009 decade and the 1960–1969 decade (Fig. S1c-d). We uti-
evaluate potential control variables for ice-marginal lake area   lize the 1960s decade to consider the longest-term compari-
change (Table 1). Later in the paper, we use the terms “envi-     son allowed by the SNAP dataset. We manually measure the
ronmental variables” or “predictor variables” to collectively     shortest distance between each lake and a simplified repre-
describe these climatic, glaciologic, and topographic descrip-    sentation of the Gulf of Alaska coastline (Fig. S2) to provide
tors of each lake’s setting.                                      a metric for a lake’s continentality.

2.1    Study area                                                 2.3   Glaciologic variables

We study a sampling of ice-marginal lakes (n = 107) that          Glaciologic variables may be subdivided into variables that
span 48–68◦ N, 116–154◦ W, covering much of northwest             describe glacier geometry and those that describe glacier
North America along the Gulf of Alaska and into the interior.     mass balance. To investigate the influence of geometric at-
The lakes are found from the Brooks Range to the Washing-         tributes of each lake’s adjacent glacier, we use the Randolph
ton Cascades and Canadian Rockies and are located in the          Glacier Inventory (RGI) version 6.0, a globally complete,
states and provinces of Alaska, Washington, Yukon, British        frozen-in-time snapshot of glacier outlines produced to pro-
Columbia, and Alberta (Fig. 1). The region is extensively         vide an inventory of glaciers at the start of the 21st cen-
glacierized (101 700 km2 ) and contains 14 % of the world’s       tury (Pfeffer et al., 2014; RGI Consortium, 2017). The RGI
glaciers and ice caps (GICs) by area (Randolph Glacier In-        also provides glacier geometrical characteristics, including
ventory regions 01 and 02; Gardner et al., 2013). Glaciers        glacier area, elevation, mean surface slope, flow direction,
across northwestern North America are losing mass faster          and the length of the longest flow line. Additionally, we use
than in any other region (−73 Gt a−1 or −0.85 m w.e. a−1 for      information on glacier ice thickness based on the Farinotti et
Alaska; −12 Gt a−1 or −0.83 m w.e. a−1 for western Canada         al. (2019a) consensus ice thickness product. This dataset re-
and the continental USA; Zemp et al., 2019) and account for       lies on glacier surface characteristics of RGI glaciers to pro-
26 % of GIC contributions to sea level rise, despite compris-     duce predicted ice thickness distributions from an ensemble
ing only 14 % of global GIC volume (Zemp et al., 2019). De-       of up to five models (Farinotti et al., 2019a). The ensemble
spite this general picture of glacier wastage, significant spa-   approach produces ice thickness estimates that are more ro-

https://doi.org/10.5194/tc-15-3255-2021                                                 The Cryosphere, 15, 3255–3278, 2021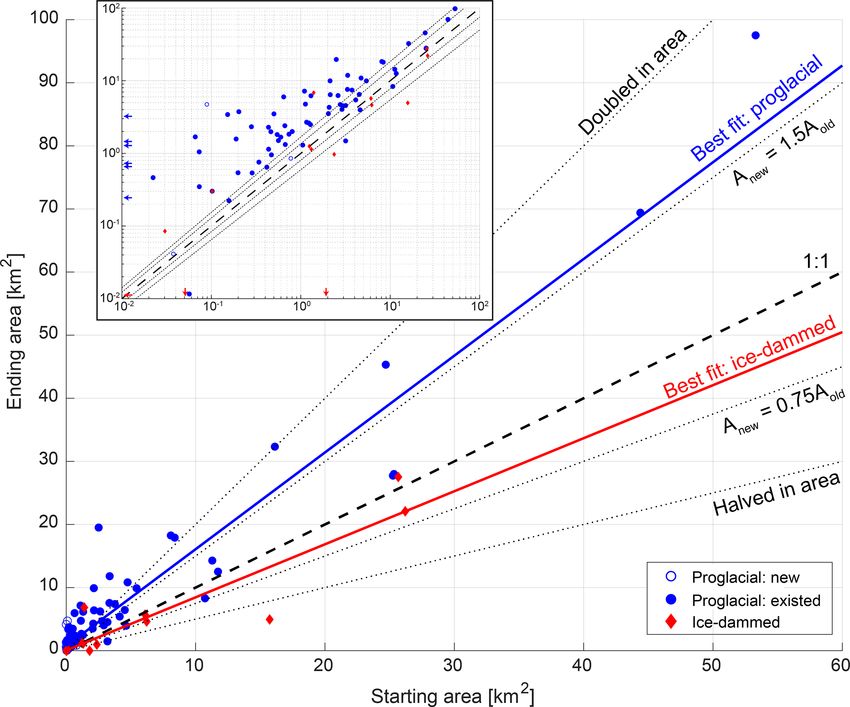
3258 H. R. Field et al.: Gulf of Alaska ice-marginal lake area change over the Landsat record
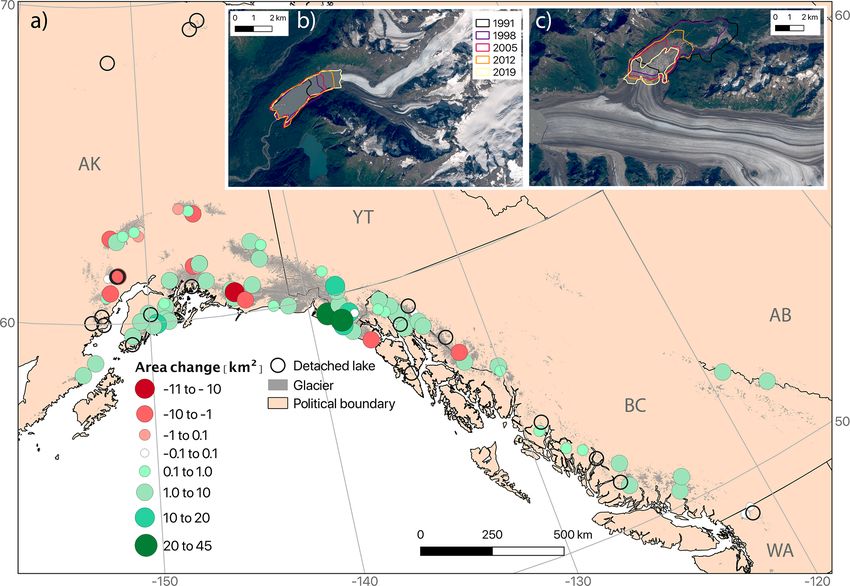
Figure 1. (a) Map of study region showing sampled proglacial (blue circles) and ice-dammed (red diamonds) lakes. Glacier extent is shown
as gray fill (RGI Consortium, 2017), and black lines indicate political boundaries. Two-letter state and province abbreviations are given
in gray text. The inset map shows the location of the study area (red box) in northwestern North America. Examples are shown of (b) a
proglacial lake (unnamed lake downstream from Twentymile Glacier; 60.94◦ N, 148.78◦ W) and (c) an ice-dammed lake (Van Cleve Lake
dammed by Miles Glacier; 60.70◦ N, 144.41◦ W). Background imagery in (b) and (c) is from Landsat 8.
Table 1. Climatic, glaciologic, and topographic datasets and respective variables retrieved and used in our analyses.
Source Variables retrieved
Scenarios Network for Alaska Summer air temperature (1960s, 1980s, 2000s – June, July, August decadal average), winter
+ Arctic Planning (SNAP) precipitation (1960s, 1980s, 2000s – December, January, February decadal average)
USGS GTOPO30 Elevation
Randolph Glacier Inventory Glacier geometry (glacier area; minimum, maximum, and median elevation of glacier; mean
(RGI v6.0) slope of glacier surface; orientation of glacier surface; length of longest flow line on glacier)
Farinotti et al. (2019a) ice Mean, maximum, and standard deviation of ice thickness across glacier; glacier volume; near-
thickness product terminal ice thickness
Huss and Hock (2015) mass Mean annual mass balance (1980s, 1990s, 2000s, 2010s), summed balance 1980s–2010s, ter-
balance dataset minal balance, winter accumulation, glacier response time, mass balance gradient
bust and accurate than any individual model, with 50 % of and maximum ice thickness of each glacier, as well as its to-
all modeled mean ice thickness agreeing with observations tal volume.
to within +30%/−20 % (Farinotti et al., 2019a). Despite this To assess the influence of glacier mass balance on ice-
overall agreement, local deviations up to 2 times the observed marginal lake area change, we use data from Huss and Hock
ice thickness do exist (Farinotti et al., 2019a). We further pro- (2015), who estimated mass balance distribution for individ-
cess these data to compute metrics such as the mean, median, ual RGI 6.0 glaciers for the period 1980–2016 based on the
The Cryosphere, 15, 3255–3278, 2021 https://doi.org/10.5194/tc-15-3255-2021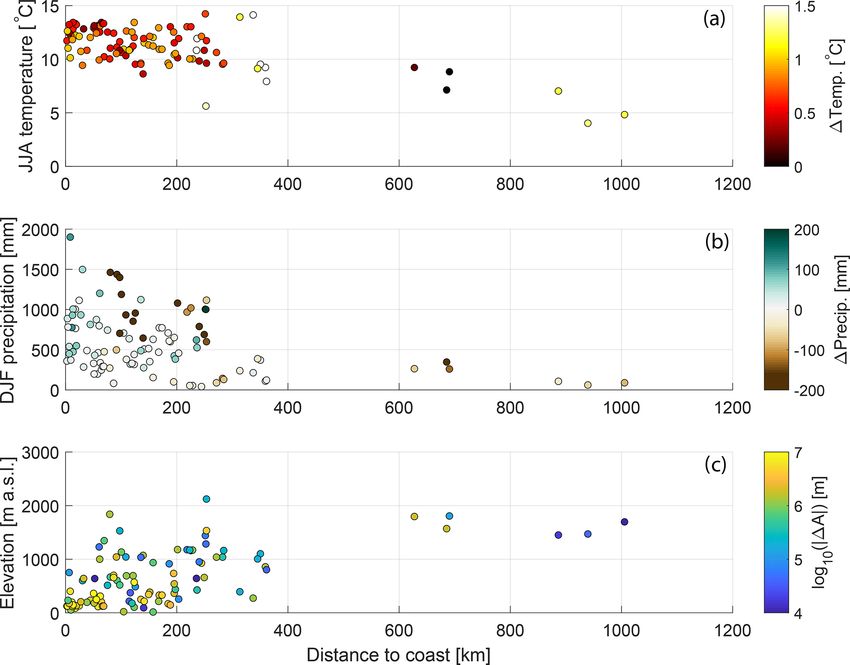
H. R. Field et al.: Gulf of Alaska ice-marginal lake area change over the Landsat record                                     3259

Global Glacier Evolution Model (GloGEM). GloGEM em-                 then extract the Farinotti et al. (2019a) ice thickness in this
ploys a calibrated temperature-index model driven by ERA-           zone and compute its statistics. For glaciers associated with
Interim reanalysis climate data. Huss and Hock (2015) re-           proglacial lakes, we define the “near-terminal zone” as the
port that 66 % of modeled net annual mass balance estimates         terminal 20 % of the upstream glacier. For ice-dammed lakes,
agree with observations to within ±0.25 m w.e. a−1 . For the        we define the lake-adjacent region as 10 % of the glacier
estimates that fall outside of this range, smaller glaciers are     length up- and down-glacier from the lake–glacier junction.
more prone to mass balance overestimates than large glaciers        We used a fixed relative area (scaled by glacier area) to en-
(Huss and Hock, 2015). From this dataset, we investigate            sure uniformity across study sites in our definition of the
variables that characterize annual mass balance, cumulative         near-terminus zone.
mass balance, near-terminal mass balance, glacier response
time, and mass balance gradient. Glacier response (T ) time
has been determined based on the strongly simplified con-
text proposed by Jóhannesson et al. (1989) based on maxi-           3     Methods
mum ice thickness and mass balance at the glacier terminus
as T = −Hmax /bt , where Hmax is the maximum thickness of           Below we describe the procedure we use for sampling and
the glacier and bt is the mass balance of the lowermost ele-        delineating lakes and follow this with a description of the
vation band (10 m) of the glacier (Jóhannesson et al., 1989;        analyses we perform to investigate physical controls on the
Huss and Hock, 2015). Mass balance gradients have been              evolution of ice-marginal lake area for our sample set.
determined by a linear fit with elevation through computed
mass balances in the ablation area for each year individually       3.1    Lake sampling and delineation
as an average over the entire study period.
                                                                    We use the term “ice-marginal lake” to describe any lake that
2.4   Topographic variables                                         is in direct physical contact with one or more glaciers, re-
                                                                    gardless of whether it occurs at a terminal or lateral margin
We extract surface elevation data from the US Geological            and independent of dam type (e.g., bedrock, moraine, glacier
Survey (USGS) GTOPO30, a 1 km resolution global digital             ice). We use “proglacial lake” to describe an ice-marginal
elevation model (Danielson and Gesch, 2011). For the United         lake that is immediately downstream from a glacier’s termi-
States, GTOPO30 utilizes the USGS digital elevation mod-            nus. We consider an “ice-dammed lake” to be an ice-marginal
els, and in Canada it utilizes the Digital Terrain Elevation        lake that is found at a glacier’s lateral margin and appears
Data and the Digital Chart of the World datasets. The rel-          to be impounded by glacier ice. Most of the study lakes
atively coarse resolution of GTOPO30 is sufficient for the          remained in contact with a glacier for the entire study pe-
purpose of providing a general estimate of lake surface ele-        riod, and we discard lakes that detached from their associated
vation.                                                             glacier from later statistical analyses (described below). Due
   For each lake-associated glacier, we extract glacier width       to the time-consuming nature of high-accuracy manual lake
as well as the width of its confining valley in the terminus        digitization, we do not attempt to delineate every single ice-
region from Google Earth imagery. The valley width is es-           marginal lake in the study area but rather sample an evenly
timated from ridge-to-ridge measurement, which we manu-             distributed subset of lakes to provide an estimate of regional
ally identify using an elevation overlay. Near-terminal glacier     lake area change behavior. We utilize a gridded map and se-
width is measured at the terminus of the glacier in con-            lect a similar number of lakes in each grid cell to avoid bi-
tact with the proglacial lake. For ice-dammed lakes, valley         ased site selection and clustering. A subset of lakes (n = 40)
width is estimated as the ridge-to-ridge distance transverse to     is sampled from a historical catalog of ice-marginal lakes in
the dammed valley axis. Near-terminal glacier width in ice-         Alaska (Post and Mayo, 1971) to avoid undersampling lakes
dammed settings is approximated as the straight-line length         that disappeared and could not be observed in recent satellite
of the glacier–lake interface.                                      imagery. Our dataset for area change analysis includes 107
   In the previous section we described glacier-wide at-            ice-marginal lakes (88 proglacial and 19 ice-dammed). For
tributes that may be associated with lake area change. How-         statistical analyses, this number is decreased to 73 proglacial
ever, it is plausible that glacier attributes in the region imme-   lakes and 14 ice-dammed lakes (87 ice-marginal lakes in to-
diately bordering an ice-marginal lake may be more impor-           tal) due to the discarded lakes that detached from their asso-
tant for the lake’s evolution. To assess the influence of local     ciated glacier during the study period. Of the 40 lakes sam-
ice thickness, we extract these data for the lake-adjacent re-      pled from Post and Mayo (1971), 19 lakes were ice-dammed,
gion of the glacier associated with each sample lake (Fig. 2).      and the rest of our sample set are proglacial lakes of uncate-
Ice thickness in the lake-adjacent area better reflects the ex-     gorized dam material (e.g., moraine, bedrock, or landslide).
tent to which a subglacial overdeepening exists that can allow      Our study lakes are generally relatively small, with a median
for further lake growth. We delineate these lake-adjacent re-       (mean) initial area of 0.78 km2 (4.06 km2 ). Excluding lakes
gions using the RGI 6.0 outline and recent satellite data. We       that appeared during the study period, the median (mean) ini-

https://doi.org/10.5194/tc-15-3255-2021                                                  The Cryosphere, 15, 3255–3278, 2021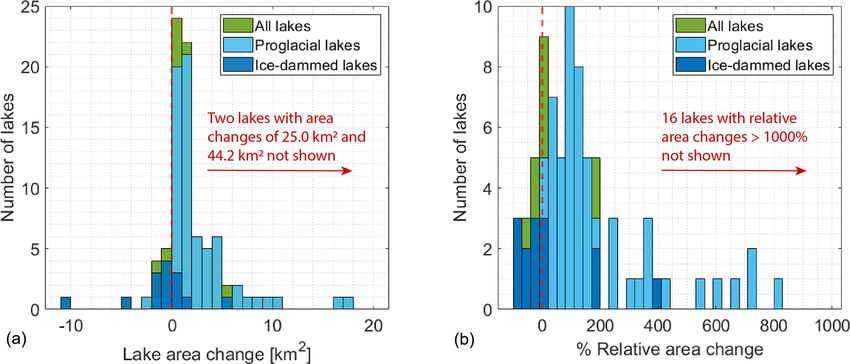
3260                                H. R. Field et al.: Gulf of Alaska ice-marginal lake area change over the Landsat record

Figure 2. Illustration of the potential importance of the near-terminus topography. (a) Time-varying lake margins (red) and estimated ice
thickness distribution (blue) at Harlequin Lake below Yakutat Glacier, Alaska (59.48◦ N, 138.90◦ W). Zone for calculating near-terminus ice
thickness is shown in stippled white, and the RGI 6.0 glacier margin is shown as a black line. This specific glacier–lake system is discussed
in Trüssel et al. (2015). (b) Same as in (a) but for an unnamed lake below Fourpeaked Glacier, Alaska (58.77◦ N, 153.45◦ W). (c) Overview
map showing locations of panels (a) and (b). Ice thickness data are from Farinotti et al. (2019a). Glacier outlines are from RGI Consortium
(2017). Background imagery is from Landsat 8.

tial area is 1.08 km2 (4.42 km2 ), with an interquartile range           3.2   Lake area change analysis
of 0.26 to 3.66 km2 .
   We accessed the Landsat 5–8 record using Google Earth                 We determine absolute lake area change (1A) as the sim-
Engine to estimate lake area change between 1984–2018 by                 ple difference in area between our last and first lake delin-
utilizing the Google Earth Digitisation Tool (GEEDiT) (Lea,              eations, where a positive area change indicates a growing
2018). GEEDiT was initially developed by Lea (2018) for de-              lake. This simple difference means that our characterization
lineating glacier termini; however we adapted it to manually             of area change is sensitive to the exact value of lake area
digitize lake boundaries from pan-sharpened true-color opti-             at the time of image acquisition. This sensitivity will not
cal imagery (Fig. 1b, c). Adapting GEEDiT for this purpose               produce significant error if interannual and seasonal varia-
required a post-processing step to close polylines into poly-            tions in lake area change are small relative to the long-term
gons, which was accomplished using the Shapely package in                trend. However, where short-term variability is large relative
Python (accessible at https://github.com/Toblerity/Shapely,              to the long-term trend, this single-pair area change metric
last access: 13 July 2021). Each lake’s margin was manu-                 may be less accurate in estimating the true long-term lake
ally digitized between four and seven times with intervals of            area change. This may make our estimates of ice-dammed
approximately 5–10 years separating images (Table S1) for                lake area change more uncertain because these lakes are sus-
a total of 540 digitized lake outlines. We exclusively utilize           ceptible to periodic outburst flooding. We determine relative
summer imagery (June, July, August) to increase confidence               lake area change as 1A/A0 , where A0 is the lake’s first ob-
in lake perimeter digitization and to minimize the influence             served area and 1A represents the absolute change in lake
of seasonal cycles on our estimates of lake area change.                 area over the study period.
                                                                            Lake area change takes one of two forms: (1) progression
                                                                         along a continuum, such as a small lake growing larger, or
                                                                         (2) a system switch, such as the appearance of a new lake
                                                                         or disconnection of an ice-marginal lake from its associated

The Cryosphere, 15, 3255–3278, 2021                                                           https://doi.org/10.5194/tc-15-3255-2021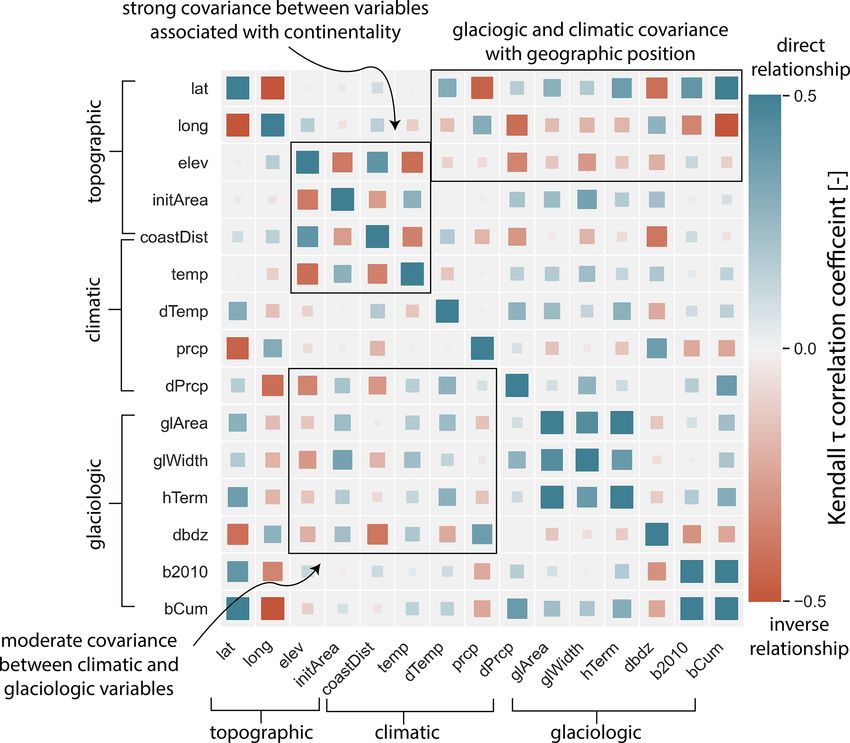
H. R. Field et al.: Gulf of Alaska ice-marginal lake area change over the Landsat record                                      3261

glacier. We characterize these styles of lake area change in        physical control variables. We also employ Kendall correla-
two distinct ways, as described below.                              tion to test for statistical relationships between environmental
    For lakes moving along a continuum, we observe that there       variables. The Kendall test makes no assumption of data nor-
are several different patterns of lake area change over time.       mality and is calculated from the rank of data points rather
We quantify these behaviors by categorizing the area change         than their actual values, which makes it robust to outliers
time series of each lake as linear, exponential, or logarithmic     (Helsel and Hirsch, 2002). Further, the Kendall test does not
change over the study period. The accuracy of this characteri-      assume variables are associated linearly, and it can be applied
zation again assumes that interannual and seasonal variations       to any monotonic relationship. All of these attributes make
in lake area are small relative to the long-term trend. This as-    the non-parametric Kendall test preferable to parametric tests
sumption may be problematic for ice-dammed lakes that ex-           such as Pearson’s linear correlation test because many of our
perience regular outburst flooding resulting in lake drainage       datasets are non-normally distributed, contain outliers, and
followed by a refilling period. Anecdotally, we did not ob-         exhibit non-linear relationships. We also employ the non-
serve any lakes disappearing and then re-appearing in our           parametric Kendall–Theil robust line (a.k.a. Sen slope) to
study sample, and so we assume this source of error is small        estimate best-fit lines that are insensitive to outliers (Helsel
in our overall analysis. Further, our main conclusions do not       and Hirsch, 2002). The Kendall–Theil robust line is imple-
rely heavily on this metric, and we present it here merely as       mented in MATLAB through a third-party code, available
a tool to explore varied lake change behavior. In addition to       at https://www.mathworks.com/matlabcentral/fileexchange/
the temporal styles of change described above, we defined           34308-theil-sen-estimator (last access: 13 July 2021). We re-
stable lakes as those with area change of ≤ 0.10 km2 . We use       strict our statistical analyses to the ice-marginal lakes that
this relatively high stability threshold to produce conserva-       remained in contact with their associated glacier(s) through-
tive results that do not classify area change styles unless the     out the study period (n = 87). We implement an alpha level
signal is large. We interpret linear area change trends to rep-     of 0.1 for testing correlation significance. Analyses are per-
resent steady growth or shrinkage, while exponential trends         formed using MATLAB version R2019b, and we use the corr
indicate either accelerating growth or decelerating shrinkage       function to determine both the significance level (p value)
and logarithmic change suggests decelerating growth or ac-          and the Kendall τ test statistic. Further, we employed prin-
celerating shrinkage over time. We utilize the Ezyfit Toolbox       cipal component (PC) analysis to reduce data dimensionality
in MATLAB version R2019b in order to determine the best-            and test for correlations between lake area change and PC
fitting line type for each lake area change time series. Lakes      axis scores.
were categorized as having the growth style with the line fit
that explains the highest variance in the data (i.e., highest r 2   3.4   Principal component analysis procedure and
value).                                                                   interpretation
    The system switches of new lake appearance or lake dis-
connection represent the first and final stages of ice-marginal     In addition to the single-variable correlation tests described
lake evolution (Emmer et al., 2020). We record the date of          in Sect. 3.3, we undertake principal component analysis
the first image in which the lake either appeared or became         (PCA) to reduce the dimensionality of the datasets of topo-
detached. We denote lakes that appeared during the study pe-        graphic, climatic, and glaciologic factors, many of which are
riod as “new lakes” in later figures but include them with ex-      themselves correlated (see Sect. 4.4 for discussion of covari-
tant lakes for all analyses. We exclude lakes that detached         ance). To prevent high-valued environmental variables (e.g.,
from their adjacent glacier from our lakes area change analy-       glacier area, which can exceed 1000 km2 ) from dominating
ses and investigation of physical controls because they com-        dataset variance relative to low-valued variables (e.g., mass
plicate interpretation, particularly where the lake detached        balance gradient, which is generally 0.1–1 m w.e. per 100 m),
early in the study period. However, we retain these lakes in        we standardize input variables (Table 3) by their minima
this inventory to represent the late stages of proglacial lakes     and maxima to ensure that all variables range from 0 to 1.
in deglaciating environments, and the date of their discon-         We then run PCA on the standardized environmental vari-
nection may yield meaningful insight. Additionally, we ob-          ables using MATLAB’s pca function. We investigate the vari-
served that some lakes appeared during the study period. We         ance explained by each principal component axis (i.e., “scree
include these lakes in area change analyses and investigations      plot”) and the input variable loadings onto each axis (Ta-
of physical controls because they represent early proglacial        ble S2). After determining which principal component axes
lake growth and all appeared early in our study period.             are most relevant (described below), we correlate the lakes’
                                                                    principal component scores to lake area change, using the
3.3   Correlation testing                                           same procedure as that described in Sect. 3.3.

We utilize the non-parametric Kendall correlation test to as-
sess the strength and significance of relationships between
lake area change (both absolute and relative) and potential

https://doi.org/10.5194/tc-15-3255-2021                                                  The Cryosphere, 15, 3255–3278, 2021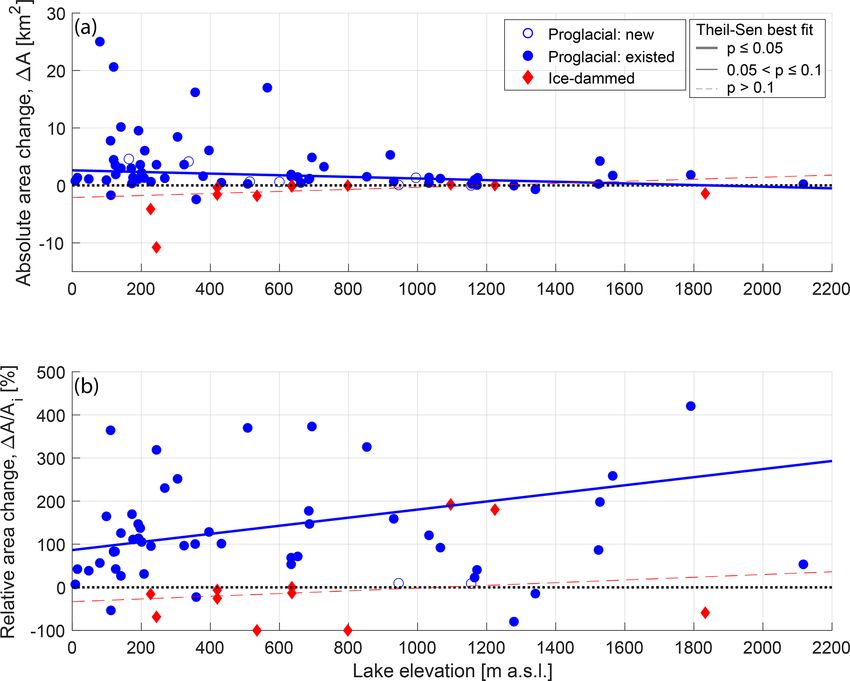
3262                               H. R. Field et al.: Gulf of Alaska ice-marginal lake area change over the Landsat record

4     Results                                                        ice-dammed lake area decline of −15 %, with an interquartile
                                                                     range of −56 % to +8 % (Figs. 3–4b).
In this section, we first provide summary statistics of lake            Of the 107 ice-marginal lakes considered in this study,
area change for the subset of northwestern North America             17 % detached from their associated glacier during our study
ice-marginal lakes considered in this study, in terms of both        period or between the Post and Mayo (1971) catalog and the
absolute and relative change. We follow this by presenting           beginning of our record. Lakes that detached from their asso-
statistical associations between lake area change and predic-        ciated glacier are found throughout the study region (Fig. 5).
tor variables such as climate, glacier mass balance, and sur-        Nine proglacial lakes formed during the study period, with
rounding topography. Absolute and relative area change have          no new ice-dammed lakes observed in our lake subset. We
substantially different statistical associations with predictor      use the term new lakes to denote lakes that formed during the
variables, and we thus discuss these findings in separate sec-       study period (e.g., Fig. 3) but do not separate these lakes for
tions. We first perform bivariate correlations between indi-         later statistical analyses. Of growing lakes, 50 lakes (73 %)
vidual environmental variables and lake area change, then            exhibit linear growth, while 8 (12 %) and 10 (15 %) lakes ex-
discuss covariance between individual environmental vari-            hibit accelerating and decelerating growth, respectively. Of
ables, and finally present multivariate statistical analyses. We     shrinking lakes, 9 (75 %) exhibit linear shrinkage, while 2
present both bivariate and multivariate results because each         lakes (17 %) and 1 lake (8 %) exhibit accelerating and decel-
type of analysis provides context for the other. Comprehen-          erating shrinkage, respectively (Fig. S4).
sive investigation of both types of statistical tests provides          There is no obvious spatial organization of observed lake
the strongest foundation for interpretation of potential phys-       area change (Fig. 5), with all manners of change observed
ical controls on ice-marginal lake area change.                      across the study area. We again stress that we investigate a
                                                                     subset of ice-marginal lakes (n = 107), not every lake in the
                                                                     area, and determining their representativeness of population-
4.1    Summary of regional lake area change                          scale regional lake behavior must be the subject of future
                                                                     work.
Of the 107 ice-marginal lakes (both proglacial and ice-
dammed) investigated in this study, which does not include           4.2     Bivariate correlations with absolute lake area
every lake in the region, we find that 70 % grew in area, 12 %               change
shrank, and 18 % remained relatively constant, changing by
less than ±0.1 km2 (Figs. 3 and 4; Table 2). Of proglacial           4.2.1    Climatic correlations with absolute area change
lakes (n = 87), 83 % grew, 5 % shrank, and 13 % remained
relatively steady. In contrast, of the 20 ice-dammed lakes,          We investigate the potential influence of climatological vari-
only 15 % increased in area, while 45 % shrank and 40 %              ables on absolute ice-marginal lake area change between
were relatively unchanged (Figs. 3–5; Table 2). Analyzing            1984–2018 using the non-parametric Kendall correlation test
all ice-marginal lakes together, lake coverage increased in          (Table 3). Average decadal summer (June, July, August) air
cumulative area by 59 % relative to 1984 (432 to 687 km2 ).          temperature is positively associated with proglacial lake ab-
Dividing the study lakes into their sub-classes, proglacial          solute area change (p < 0.05; τ = 0.19), and winter (Decem-
lakes grew in total area by 81 % (336 to 606 km2 ), while ice-       ber, January, February) precipitation is inversely correlated
dammed lake area shrunk by −17 % (96 to 80 km2 ; Table 2).           with ice-dammed lake area change (p < 0.05; τ = −0.46).
   Individual proglacial lakes experienced a median area             As mentioned in Sect. 2.2, we run correlations between win-
change of +1.3 km2 (mean is +3.1 km2 ), with an interdecile          ter precipitation and summer temperature because these are
range (10th to 90th percentile) growing between 0.0 and              the climate variables most relevant to glacier mass balance.
6.8 km2 (Fig. 4a; Table 2). At the extremes, we observe a            Physically, these correlations mean that proglacial lakes in
minimum proglacial lake area change of −2.4 km2 and max-             regions with warm summers are growing faster and ice-
imum of +44.2 km2 . In terms of area change relative to              dammed lakes in regions with wet winters are shrinking more
each lake’s initial area, we find a median proglacial lake           rapidly. Despite these correspondences with mean climate
growth of +125 %, with an interquartile range of +42 % to            variables, we find little evidence for relationships between
+384 % (Figs. 3–4b). Considering the full range of relative          lake area change and the long-term change in summer air
area change produces physically meaningless values where             temperature or winter precipitation. The greatest rates of ab-
lakes did not exist or were very small at the start of the record.   solute ice-marginal lake area change are generally occurring
   In contrast, ice-dammed lakes in this study experienced a         in regions with minimal changes in winter precipitation and
median area change of −0.04 km2 with an interdecile range            moderate warming (Figs. S5, S6). We do observe a signifi-
of area change from −3.71 to 0.36 km2 (Figs. 3 and 4a;               cant positive relationship between the change in winter pre-
Table 2). At the extremes, one ice-dammed lake shrunk by             cipitation and proglacial absolute lake area change, yet there
−10.8 km2 and one grew by +5.4 km2 . In terms of area                is not a clear physical mechanism to explain greater lake ex-
change relative to each lake’s initial area, we find a median        pansion in regions with more winter precipitation – we ex-

The Cryosphere, 15, 3255–3278, 2021                                                      https://doi.org/10.5194/tc-15-3255-2021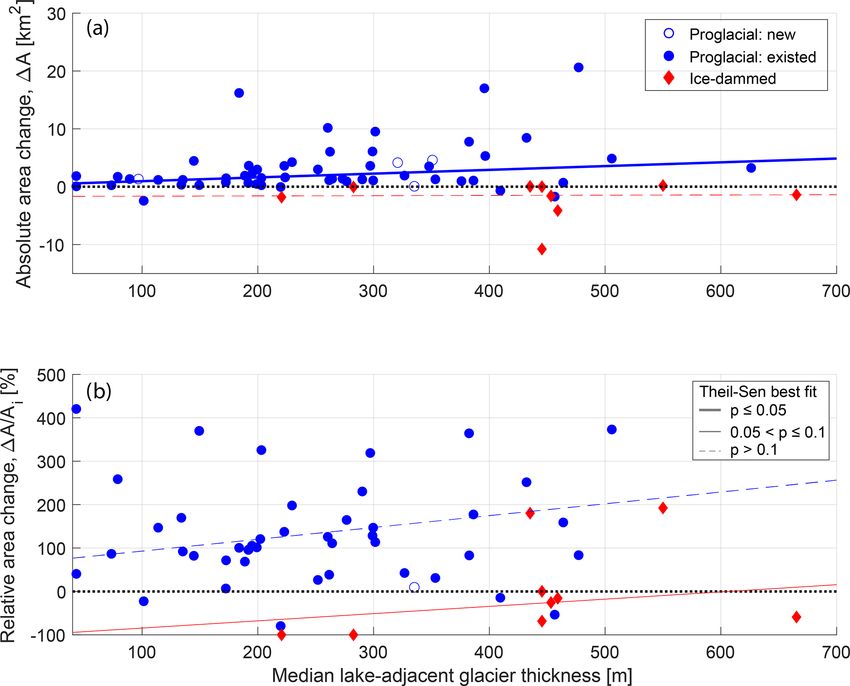
H. R. Field et al.: Gulf of Alaska ice-marginal lake area change over the Landsat record                                                3263

Figure 3. Ice-marginal lake area at the start (horizontal axis) and end (vertical axis) of the study period. Proglacial lakes that existed for
the entire study period are shown as filled blue circles, while proglacial lakes that appeared in that time (new lakes) are shown as unfilled
symbols. Red diamonds depict ice-dammed lakes. The dashed line shows 1 : 1 (i.e., lakes with constant area), while the dotted lines show
various levels of relative area change. The blue (red) solid lines show the Theil–Sen estimator line of best fit to proglacial (ice-dammed)
lakes. The inset shows the same data in log–log space to better display the behavior of small lakes.

Figure 4. Distribution of proglacial and ice-dammed (a) absolute area change and (b) relative lake area change.

pand upon this idea in Sects. 4.4 and 5.4. A proglacial lake’s           ables, and in Sect. 4.3 we argue covariance between climate
distance from the open ocean is inversely associated with its            variables and continentality provides a more plausible expla-
absolute area change (p < 0.05; τ = −0.23; Fig. S9), indi-               nation for unintuitive correlations between absolute lake area
cating that coastal proglacial lakes are growing faster than in-         and climatic variables.
land lakes. The strength of this correlation is of similar mag-
nitude to those relating proglacial lakes to other climate vari-

https://doi.org/10.5194/tc-15-3255-2021                                                          The Cryosphere, 15, 3255–3278, 2021
3264                                 H. R. Field et al.: Gulf of Alaska ice-marginal lake area change over the Landsat record

Table 2. Summary statistics for proglacial and ice-dammed study lake area change. Steady lakes are defined as having changed by less
than ±0.1 km2 . Summary statistics are shown for the change in individual lakes, as well as for the cumulative area of all study lakes. For
descriptors of individual lakes, we use the robust statistics of the median and 10th- and 90th-percentile lake area change because the existence
of extreme values makes the minimum, mean, and maximum area change less meaningful (%ile denotes percentile in the table). Relative
area change is scaled by a lake’s initial area, so a 100 % increase indicates a lake that doubled in area, while −100 % indicates a lake that
completely disappeared.

                                                         Proglacial                                Ice-dammed
                  Number of lakes           Growing         Steady      Shrinking     Growing        Steady        Shrinking
                  (–, %)                   72 (83 %)     11 (13 %)        4 (5 %)     3 (15 %)     8 (40 %)         9 (45 %)
                  Absolute area change      10th %ile      Median       90th %ile    10th %ile      Median         90th %ile
                  (individual, km2 )             0.01        1.28            6.76        −3.7        −0.04              0.36
                  Relative area change      10th %ile      Median       90th %ile    10th %ile      Median         90th %ile
                  (individual, %)                8%         125 %       > 1000 %       −82 %        −15 %             212 %
                  Cumulative area               1984          2018        Change          1984        2018          Change
                  (km2 )                         336           606     270 (81 %)           96          80     −17 (−17 %)

Figure 5. (a) Absolute area change for the studied ice-marginal lakes between 1984 and 2018, including both proglacial and ice-dammed
lakes. Green (red) circles indicate lakes that grew (shrunk) over the study period. White circles indicate lakes that remained relatively stable
(within ±0.1 km2 of their initial area), while unfilled circles show lakes that detached from their associated glacier during the study period.
Glacier extent is shown in gray fill (RGI Consortium, 2017), and black lines indicate political boundaries. Examples are shown of (b) a
growing proglacial lake (unnamed lake downstream from Twentymile Glacier; 60.94◦ N, 148.78◦ W) and (c) a shrinking ice-dammed lake
(Van Cleve Lake dammed by Miles Glacier; 60.70◦ N, 144.41◦ W). Years displayed in (b) and (c) are upper limits on a lake’s outline (e.g., a
lake delineation between 1991 and 1998 will appear as a purple line). Background imagery in (b) and (c) is from Landsat 8.

The Cryosphere, 15, 3255–3278, 2021                                                              https://doi.org/10.5194/tc-15-3255-2021
H. R. Field et al.: Gulf of Alaska ice-marginal lake area change over the Landsat record 3265
Table 3. Kendall rank correlation coefficient (τ ) values for monotonic relationships between absolute (middle columns) and relative (right-
most columns) lake area change with associated climatological, glaciological, and topographic variables. In each category, test statistics are
reported separately for proglacial and ice-dammed lakes. Bold numbers indicate correlations that are significant at p ≤ 0.05, while regular
text indicates relationships where 0.05 < p ≤ 0.1. Dashes indicate a correlation with p > 0.1. Positive (negative) correlation coefficients
indicate a direct (inverse) relationship between the examined variables.
Parameter Absolute area change Relative area change
Proglacial Ice-dammed Proglacial Ice-dammed
Climatological
Mean summer temperature (2000s) 0.19 – −0.13 –
Change in summer temperature (2000s–1960s) – – – –
Mean winter precipitation (2000s) – − 0.46 – –
Change in winter precipitation (2000s–1960s) 0.20 – −0.15 –
Distance to open ocean − 0.23 – 0.16
Glacier area 0.22 – – –
Glaciological
Glacier width 0.32 – – –
Median lake-adjacent ice thickness 0.25 – – 0.47
Mass balance gradient – – − 0.18 –
2010s average annual mass balance − 0.17 – – –
1980–2016 summed annual mass balance – – – –
Topographic
Latitude – – – –
Longitude – – – –
Elevation − 0.27 – 0.19 –
Initial lake area 0.33 − 0.41 − 0.53 –
4.2.2 Glaciologic correlations with absolute area 4.2.3 Geometric and geomorphic correlations with
change absolute area change
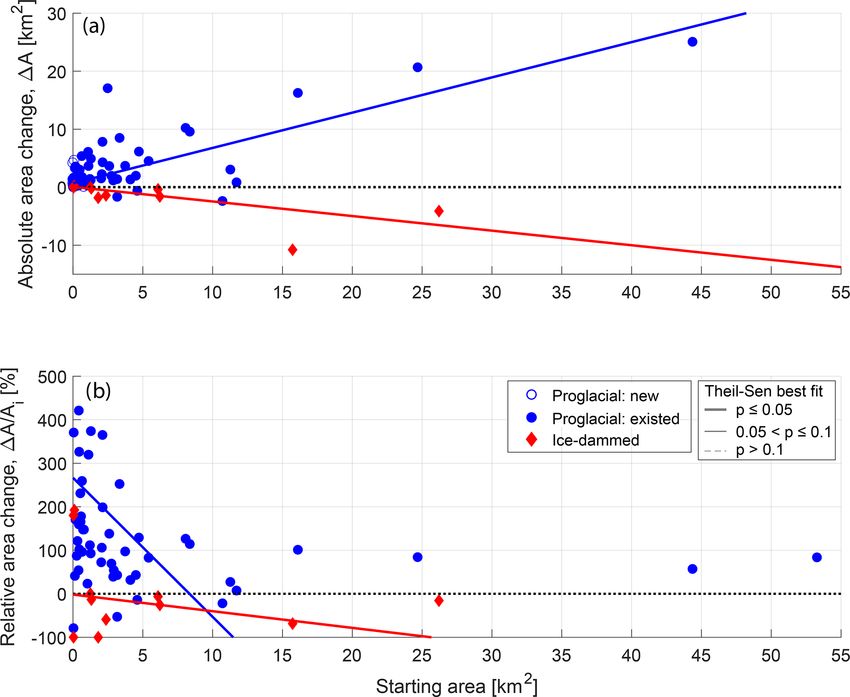
We find statistical associations between several glaciologic Of all our climatic, glaciologic, and geometric variables, ini-
variables and absolute proglacial lake area change but not tial lake area is one of the strongest predictors of absolute
with ice-dammed lake area change (Table 3). For all lakes, lake area change, exhibiting a moderately strong statisti-
the only glacier mass balance variable with a statistically cally significant positive association with proglacial lake area
significant correlation with absolute lake area change is the change (τ = 0.33; Table 3; Fig. 7a) and a strong inverse rela-
average mass balance in the 2010s (τ = −0.17; Fig. S7a). tionship with ice-dammed lake area change (τ = −0.41; Ta-
The sign of this correlation indicates that proglacial lakes ble 3; Fig. 7a). We also find that glacier width at the terminus
are growing more rapidly downstream from glaciers with (τ = 0.32) is significantly associated with lake area change.
a more negative mass balance in recent times. Notably, we Additionally, a moderately strong inverse relationship exists
do not find any statistical links between lake area change between absolute lake area change and elevation (τ = −0.27;
and the associated glacier’s cumulative mass balance over Fig. 8a), with low-elevation lakes growing most rapidly. To-
the 1980–2016 period (Table 3). Considering glacier geo- gether, these associations suggest that large, low-elevation
metric factors, however, we find several significant correla- lakes occupying wide valleys have grown most rapidly over
tions with proglacial lake area change (Table 3). Glacier area the 1984–2018 study period. Harlequin Lake (below Yaku-
(τ = 0.22), width (τ = 0.32; Fig. S8a), and near-terminal tat Glacier, Alaska; Fig. 2a), the fastest-growing study lake
median ice thickness (τ = 0.25; Fig. 6) all exhibit correla- (1A = 44.2 km2 ), exemplifies these traits.
tions with proglacial lake area change at a p < 0.05 level
(Table 3). This indicates that proglacial lakes are growing
4.3 Bivariate correlations with relative lake area
most rapidly where they exist downstream of large and wide
change
glaciers with thick ice near the terminus. We find no evidence
for statistical links between absolute ice-dammed lake area
change and either glacier geometric or mass balance vari- In Sect. 4.2, we discussed statistical associations between en-
ables (Table 3). vironmental variables and absolute lake area change. In this
section, we investigate statistical links between relative lake
area change and those same environmental variables. We first
discuss statistical results for climatic variables, followed by
glaciologic and geometric variables.
https://doi.org/10.5194/tc-15-3255-2021 The Cryosphere, 15, 3255–3278, 20213266 H. R. Field et al.: Gulf of Alaska ice-marginal lake area change over the Landsat record Figure 6. (a) Absolute and (b) relative lake area change as a function of median lake-adjacent glacier ice thickness (see Sect. 2.3) for proglacial (blue circle) and ice-dammed (red diamond) lakes. On both panels, lines show the linear fit to proglacial (blue) and ice-dammed (red) lakes as estimated to by the non-parametric Theil–Sen robust line. Thick solid lines show relationships that are significant at the p ≤ 0.05 level; thin solid lines show 0.05 < p ≤ 0.1 relationships, and thin dashed lines show p > 0.1 relationships. All significance values are estimated by the Kendall rank correlation test. The dotted black line shows zero lake area change. Unfilled symbols indicate lakes that appeared during the study period. We find no statistically significant links between climate Relatively few of the considered glaciologic variables are variables and relative ice-dammed lake area change, with a significantly correlated with relative ice-marginal lake area few p < 0.1 associations for proglacial lakes (Table 3). The change. However, we do find a strong direct relationship same climatic variables that were significant for absolute area between relative ice-dammed lake area change and lake- change are again significant for relative proglacial lake area adjacent ice thickness (τ = 0.47; p = 0.07; Fig. 6b). Phys- change, though with opposite signs. We observe inverse cor- ically, this suggests that lakes dammed by thick glaciers have relations between relative proglacial lake area change and av- shrunk least, relative to their initial area. Additionally, rela- erage summer air temperature (τ = −0.13; p = 0.02) as well tive proglacial lake area change is inversely correlated with as the change in winter precipitation (τ = −0.15; p = 0.01). the associated glacier’s mass balance gradient (τ = −0.18; We find a direct relationship between relative proglacial lake p = 0.04; Fig. S7b). This indicates that proglacial lakes area change and distance from the open ocean (τ = 0.16; downstream from glaciers with “flat” mass balance gradi- p = 0.01; Figs. 9c and S9b). As we discuss in Sect. 4.2 and ents (i.e., little change in mass balance with increasing ele- 4.4, both summer air temperature and winter precipitation vation) have grown most rapidly, relative to their initial area. change are themselves correlated with distance from the open This is consistent with interior proglacial lakes growing more ocean (Figs. 9c, 10), and we suggest continentality is the rapidly in relative terms because maritime glaciers generally most physically plausible driver of observed statistical links. have steeper mass balance gradients, with the opposite being While maritime proglacial lakes are growing most rapidly in true for continental glaciers, as discussed in greater detail in terms of absolute area, interior proglacial lakes are growing Sect. 4.4. most rapidly relative to their initial size (Fig. S9b). The Cryosphere, 15, 3255–3278, 2021 https://doi.org/10.5194/tc-15-3255-2021
H. R. Field et al.: Gulf of Alaska ice-marginal lake area change over the Landsat record                                                 3267

Figure 7. (a) Absolute lake area change as a function of initial lake area for all proglacial lakes (blue circles) and ice-dammed lakes (red
diamonds). (b) Relative lake area change as a function of initial lake area. In both panels, lines show the linear fit to proglacial (blue) and
ice-dammed (red) lakes as estimated to by the non-parametric Theil–Sen robust line. Thick solid lines show relationships that are significant
at the p ≤ 0.05 level; thin solid lines show 0.05 < p ≤ 0.1 relationships, and thin dashed lines show p > 0.1 relationships. All significance
values are estimated by the Kendall rank correlation test. The dotted black line shows zero lake area change.

   For the geometric and geomorphic variables, we again find              interpretation of the results presented in Sect. 4.2 and 4.3,
the same statistically significant variables as seen for ab-              but this covariance also provides a physically plausible ex-
solute area change but with the opposite sign. While low-                 planation for several unintuitive results presented in those
elevation lakes tend to grow more rapidly in terms of abso-               subsections. We cross-correlate the 15 environmental vari-
lute area change, high-elevation lakes grow more quickly in               ables shown in Table 3 and find that most (63 %) of the pos-
relative terms (τ = 0.19; p = 0.02; Fig. 8b). We observe a                sible pairs of environmental variables are significantly cor-
strong inverse correlation between relative lake area change              related at p < 0.05 (Fig. 10; Table S4). These correlations
and initial lake area (τ = −0.52; p < 0.01; Fig. 7b), but we              signify that one environmental variable (e.g., summer tem-
interpret this to be an artifact of data processing because ini-          perature) systematically varies with another (e.g., latitude),
tial lake area is used to compute relative lake area change.              which is driven by the spatially coherent structuring of these
That being said, this result suggests that smaller lakes are ex-          variables. Below, we describe several salient clusters of cor-
periencing greater relative area change, while large lakes are            related environmental variables that affect interpretation of
experiencing greater absolute change.                                     results presented in Sect. 4.2 and 4.3.
                                                                             Lake elevation and initial lake area are both significantly
4.4   Assessing covariance of environmental variables                     correlated with 50 % of the other environmental variables,
                                                                          and the variables with which they covary are nearly identical
It is plausible that a correlation between lake area change and           (Fig. 10; Table S4). Large, low-elevation lakes are signifi-
a single environmental variable is actually due to underlying             cantly associated with the following variables: proximity to
covariance among the environmental variables. Covariance                  the coast, high summer temperatures, winters that have be-
between environmental variables in some ways complicates                  come wetter, larger glaciers, wider glaciers, thicker glaciers,

https://doi.org/10.5194/tc-15-3255-2021                                                          The Cryosphere, 15, 3255–3278, 2021
3268 H. R. Field et al.: Gulf of Alaska ice-marginal lake area change over the Landsat record
Figure 8. (a) Absolute and (b) relative lake area change as a function of lake elevation for proglacial (blue circle) and ice-dammed (red
diamond) lakes. On both panels, lines show the linear fit to proglacial (blue) and ice-dammed (red) lakes as estimated by the non-parametric
Theil–Sen robust line. Thick solid lines show relationships that are significant at the p ≤ 0.05 level; thin solid lines show 0.05 < p ≤ 0.1
relationships, and thin dashed lines show p > 0.1 relationships. All significance values are estimated by the Kendall rank correlation test.
The dotted black line shows zero lake area change. Unfilled symbols indicate lakes that appeared during the study period.
and glaciers with a steeper mass balance gradient. Distance to The first four principal component axes explain 73.3 % of the
the coast is significantly correlated with a similar set of en- variance found in the 15 environmental variables for which
vironmental variables but lacks significant association with we present correlation results (Table 2). After inspecting the
the variables describing glacier size (i.e., area, width, lake- loadings of environmental variables onto each principal com-
adjacent ice thickness). ponent axis (Table S2) and plotting the quasi-exponential
Notably, variables describing glacier mass balance are not decay explained by increasing PC axis numbers, we retain
significantly correlated with lake elevation, initial area, or only the first four PC axes for correlation testing. Some in-
distance from the coast. Glaciers with more negative cumu- terpretation is required to understand the physical meaning
lative mass balance instead are significantly associated with of PCA results: strong loadings of the PC axis (PC1, ab-
locations further south and east; warm summers; wet winters; solute value ≥ 0.25) are found for environmental variables
winters that are becoming drier; smaller, narrower, and thin- associated with a lake’s geographic location (e.g., latitude,
ner glaciers; and glaciers with a steep mass balance gradient. longitude, elevation), and so we interpret this axis to largely
reflect a lake’s position on the Earth’s surface. This interpre-
4.5 Multivariate correlations between lake area change tation is supported by PC scores varying systematically along
and environmental variables a latitudinal gradient (Fig. S3a). Strong PC2 loadings are in-
dicative of a maritime setting; high PC2 scores are associated
To supplement bivariate correlations and the above dis- with low elevation, proximity to the open ocean, high mass
cussion of covariance between environmental variables, we balance gradients, and high winter precipitation (Table S2).
undertake non-parametric correlation testing between ice- This interpretation is again supported by the spatial distri-
marginal lake area change and principal component scores. bution of PC2 scores, with a systematic decrease in scores
We first must interpret the physical meanings of the PC axes.
The Cryosphere, 15, 3255–3278, 2021 https://doi.org/10.5194/tc-15-3255-2021You can also read