A comprehensive biogeochemical record and annual flux estimates for the Sabaki River (Kenya)
←
→
Page content transcription
If your browser does not render page correctly, please read the page content below
Biogeosciences, 15, 1683–1700, 2018
https://doi.org/10.5194/bg-15-1683-2018
© Author(s) 2018. This work is distributed under
the Creative Commons Attribution 4.0 License.

A comprehensive biogeochemical record and annual flux estimates
for the Sabaki River (Kenya)
Trent R. Marwick1 , Fredrick Tamooh2 , Bernard Ogwoka3 , Alberto V. Borges4 , François Darchambeau4 , and
Steven Bouillon1
1 Department of Earth and Environmental Sciences, KU Leuven, Leuven, 3001, Belgium
2 Kenyatta University, Department of Zoological Sciences, Mombasa, Kenya
3 Kenya Wildlife Service, Mombasa, Kenya
4 Unité d’Océanographie Chimique, Université de Liège, Liège, 4000, Belgium

Correspondence: Trent R. Marwick (trent.marwick@gmail.com)

Received: 13 July 2017 – Discussion started: 9 August 2017
Revised: 28 January 2018 – Accepted: 15 February 2018 – Published: 21 March 2018

Abstract. Inland waters impart considerable influence on nu-     tently oversaturated in dissolved methane (CH4 ; from 499 to
trient cycling and budget estimates across local, regional and   135 111 %) and nitrous oxide (N2 O; 100 to 463 %) relative
global scales, whilst anthropogenic pressures, such as ris-      to atmospheric concentrations. Wet season flows (October–
ing populations and the appropriation of land and water re-      December and March–May) carried > 80 % of the total load
sources, are undoubtedly modulating the flux of carbon (C),      for TSM (∼ 86 %), POC (∼ 89 %), dissolved organic carbon
nitrogen (N) and phosphorus (P) between terrestrial biomes       (DOC; ∼ 81 %), PN (∼ 89 %) and particulate phosphorus
to inland waters, and the subsequent flux of these nutrients     (TPP; ∼ 82 %), with > 50 % of each fraction exported dur-
to the marine and atmospheric domains. Here, we present          ing the long wet season (March–May). Our estimated sedi-
a 2-year biogeochemical record (October 2011–December            ment yield (85 Mg km−2 yr−1 ) is relatively low on the global
2013) at biweekly sampling resolution for the lower Sabaki       scale and is considerably less than the recently reported av-
River, Kenya, and provide estimates for suspended sediment       erage sediment yield of ∼ 630 Mg km−2 yr−1 for African
and nutrient export fluxes from the lower Sabaki River un-       river basins. Regardless, sediment and OC yields were all at
der pre-dam conditions, and in light of the approved con-        least equivalent or greater than reported yields for the neigh-
struction of the Thwake Multipurpose Dam on its upper            bouring dammed Tana River. Rapid pulses of heavily 13 C-
reaches (Athi River). Erratic seasonal variation was typi-       enriched POC coincided with peak concentrations of PN,
cal for most parameters, with generally poor correlation be-     ammonium, CH4 and low dissolved oxygen saturation, sug-
tween discharge and material concentrations, and stable iso-     gesting that large mammalian herbivores (e.g. hippopotami)
tope values of C (δ 13 C) and N (δ 15 N). Although high to-      may mediate the delivery of C4 organic matter to the river
tal suspended matter (TSM) concentrations are reported here      during the dry season. Given recent projections for increas-
(up to ∼ 3.8 g L−1 ), peak concentrations of TSM rarely co-      ing dissolved nutrient export from African rivers, as well as
incided with peak discharge. The contribution of particulate     the planned damming of the Athi River, these first estimates
organic C (POC) to the TSM pool indicates a wide bian-           of material fluxes from the Sabaki River provide base-line
nual variation in suspended sediment load from OC poor           data for future research initiatives assessing anthropogenic
(0.3 %) to OC rich (14.9 %), with the highest %POC occur-        perturbation of the Sabaki Basin.
ring when discharge is < 100 m3 s−1 and at lower TSM con-
centrations. The consistent 15 N enrichment of the particulate
nitrogen (PN) pool compared to other river systems indicates
anthropogenic N loading is a year-round driver of N export
from the Sabaki Basin. The lower Sabaki River was consis-

Published by Copernicus Publications on behalf of the European Geosciences Union.
1684                                                                           T. R. Marwick et al.: The Sabaki River (Kenya)

1   Introduction                                                     to the atmosphere in comparison to temperate and boreal
                                                                     inland waters (Aufdenkampe et al., 2011; Raymond et al.,
The acknowledgement of the vital role inland waters play in          2013; Borges et al., 2015a, b), and the same has been asserted
carbon (C) cycling and budget estimates at local, regional           for global CH4 flux from tropical rivers and lakes (Bastviken
and global scales has progressed steadily over the past three        et al., 2011; Borges et al., 2015a, b). Hence, given their re-
decades (e.g. Meybeck, 1982; Cole et al., 2007; Tranvik et           ported significance as a source of GHGs to the atmosphere,
al., 2009). For example, inland waters not only act as a con-        an increased focus on the inland water biogeochemistry of
duit for the delivery of significant quantities of terrestrial or-   the tropics is merited (Regnier et al., 2013; Stanley et al.,
ganic C to the coastal zone and open ocean, they are typi-           2016), particularly for data-scarce river basins of Africa.
cally sources of greenhouse gases (GHGs: e.g. CO2 , CH4 ,               Over the past decade, momentum has gathered towards
N2 O) to the atmosphere. These GHGs can be derived ei-               a broader understanding of the nutrient cycling within sub-
ther from instream remineralisation of a proportion of lat-          Saharan inland water ecosystems (e.g. Coynel et al., 2005;
eral inputs, through inputs from groundwater and floodwa-            Abrantes et al., 2013; Bouillon et al., 2014). However, Africa
ter carrying the products of terrestrial mineralisation (Cole        has experienced the highest annual population growth rate
and Caraco, 2001a; Beaulieu et al., 2011; Raymond et al.,            over the past 60 years (∼ 2.51 %, 1950–2013; see United Na-
2013) or from wetlands (Abril et al., 2014; Borges et al.,           tions, 2013), a position it is expected to hold for the remain-
2015a). Recent data compilations further elucidate the con-          der of the 21st century (United Nations, 2013). Coupling the
trols and drivers of GHG dynamics within the fluvial domain          increasing population with forecasted climate change scenar-
at regional and global scales (Borges et al., 2015a; Stanley         ios, land-use changes including deforestation and the expan-
et al., 2016; Marzadri et al., 2017). Additionally, a quantity       sion of agriculture, reservoir construction and water abstrac-
of the lateral inputs may be buried within sedimentary de-           tion and the increased exploitation of natural resources will
posits of reservoirs, lakes, floodplains and wetlands (Cole et       shift the dynamics of lateral nutrient inputs to inland wa-
al., 2007; Battin et al., 2008; Aufdenkampe et al., 2011). An-       ters of Africa, the balance between transport and in situ pro-
thropogenic pressures, such as land-use and land-use change,         cessing of these terrestrial subsidies and consequently the re-
are undoubtedly modulating the quantities involved in each           gional C and nutrient balance of Africa (Yasin et al., 2010;
of these exchange fluxes (Regnier et al., 2013).                     Ciais et al., 2011; Valentini et al., 2014). Hence, continued
   Given that recent reports assert a similar order of mag-          effort in characterising the biogeochemistry of African in-
nitude to the lateral C input to inland waters (∼ 2.3 up to          land waters is paramount for developing robust regional and
5.1 Pg C yr−1 ; Cole et al., 2007; Battin et al., 2009; Drake        global nutrient budgets, but also to provide a working base-
et al., 2018) as that for global net ecosystem production            line for assessing future climate and land-use impacts on the
(∼ 2 Pg C yr−1 ; Ciais et al., 2013), the scarcity of the biogeo-    nutrient fluxes to and from inland waters of Africa.
chemistry database for some regional inland waters is key to            The potential perturbation of the biogeochemistry of trop-
our inability to adequately resolve the role of this biosphere       ical inland waters by climate and land-use change (Hamilton,
domain within broader regional and global C budgets (Reg-            2010), and that of Africa specifically (Yasin et al., 2010),
nier et al., 2013; Raymond et al., 2013). Although the spot-         has received some attention. Given a projected warming of
light has turned somewhat towards establishing a compre-             a ∼ 2–4.5 ◦ C toward the end of the 21st century within the
hensive reckoning of riverine C source variability and con-          tropics (Meehl et al., 2007; Buontempo et al., 2015) and
straining C cycling within river basins, rather than solely          in East Africa specifically (Buontempo et al., 2015; Do-
quantifying the transport fluxes from inland waters to the           sio and Panitz, 2016), important shifts are predicted involv-
coastal zone (Bouillon et al., 2012), there remain important         ing (i) aquatic thermal regime, influencing rates of in situ
inland water systems or regions lacking long-term, riverine          microbe-mediated biogeochemical processes, (ii) hydrolog-
biogeochemical datasets built upon high-frequency sampling           ical regimes of discharge and floodplain inundation and
initiatives capable of providing reliable transport flux esti-       (iii) freshwater–saltwater gradients, altering biogeochemical
mates. Tropical and sub-tropical Africa is one region where          processing as rivers approach the coastal zone. Additionally,
such datasets are scarce (e.g. Coynel et al., 2005; Borges           Yasin et al. (2010) estimate that the load of all dissolved and
et al., 2015a), and they thus contribute some of the largest         particulate forms of C, N and P in African river basins in-
uncertainty to global C budgets (Ciais et al., 2011). On the         creased in the period 1970–2000, and further increases are
global scale, the tropics and subtropics are considered of par-      predicted for all dissolved fractions of N and P between
ticular importance regarding the transport of sediments and          2000–2050, although C fractions and particulate forms of N
C (Ludwig et al., 1996; Schlünz and Schneider, 2000; Moore           and P are modelled to decrease. Predicted decreases of partic-
et al., 2011), with a recent compilation of African sediment         ulate loads are linked to the net effect of climate change and
yield (hereafter SY) data highlighting the paucity of obser-         reservoir construction, which alter hydrology, nutrient reten-
vations relative to other continental regions (Vanmaercke et         tion and sediment carrying capacity of rivers (Yasin et al.,
al., 2014). Also, the inland waters of the tropics and sub-          2010), and which store ∼ 25 % of annual sediment load car-
tropics are suggested to have elevated evasion rates of CO2          ried over the African landmass (Syvitski et al., 2005), while

Biogeosciences, 15, 1683–1700, 2018                                                      www.biogeosciences.net/15/1683/2018/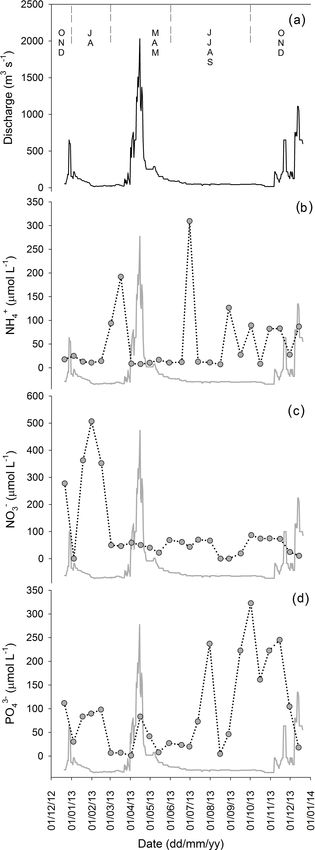
T. R. Marwick et al.: The Sabaki River (Kenya)                                                                                 1685

the increasing dissolved nutrient loads are related to the ris-    discharges to the Indian Ocean at Malindi Bay (Fig. 1). The
ing population and with increased per capita gross domes-          river is known as the Athi River in its upstream reaches, and
tic product (GDP) and meat consumption, with these factors         after its confluence with the Tsavo River, becomes known as
driving up the terrestrial inputs of manure-, fertiliser- and      the Sabaki (or Galana) River (Fig. 1).
sewage-derived N and P (Yasin et al., 2010).                          Precipitation ranges between 800 and 1200 mm yr−1 in the
   British settlement brought European land-use practices to       highly populated central highlands surrounding Nairobi, and
the Kenyan highlands early in the 20th century, triggering         between 400 and 800 mm yr−1 in less-populated, lower alti-
severe soil erosion in, and elevated sediment fluxes from,         tude, semi-arid south-east Kenya. Two dry seasons (January–
the Athi–Galana–Sabaki (A-G-S) River basin (Champion,              February, hereafter JF; June–September, hereafter JJAS) in-
1933; Fleitmann et al., 2007). These terrigenous sediments         tersperse a long (March–May, hereafter MAM) and short
have had a significant impact on the environment surround-         (October–December, hereafter OND) wet season. Only dur-
ing the outflow of the Sabaki River in the Indian Ocean,           ing the MAM and OND periods does monthly precipitation
for example, by increasing coral stress (van Katwijk et al.,       exceed potential evaporation–transpiration within the basin
1993) and spreading seagrass beds on local reef complexes,         (Fig. 1), and accordingly the annual hydrograph displays bi-
as well as siltation and infilling of the Sabaki estuary and the   modal discharge, with an average flow rate of 49 m3 s−1 be-
rapid progradation of nearby shorelines (Giesen and van de         tween 1957–1979 (Fleitmann et al., 2007). Dry season flow
Kerkhof, 1984). In order to alleviate regional water scarcity,     rates as low as 0.5 m3 s−1 compare to peak wet season flow
construction of reservoirs on the Athi River has been un-          rates of up to 5000 m3 s−1 (Delft Hydraulics, 1970; Fleit-
der consideration for decades, the implementation of which         mann et al., 2007). Oscillations between El Niño and La Niña
could modify the magnitude of sediment delivery to the             conditions have a strong influence on the decadal patterns
coastal zone (van Katwijk et al., 1993) as previously ob-          of river discharge, where extended severe drought is broken
served in the neighbouring Tana River (Finn, 1983; Tamooh          by intense and destructive flooding (Mogaka et al., 2006).
et al., 2012).                                                     The pre-1960 sediment flux of 0.06 Tg yr−1 is dwarfed by
   The lower Sabaki (also known as Galana) River forms             modern-day flux estimates of 5.7 and 14.3 Tg yr−1 (Van
after the confluence of the Athi and Tsavo rivers, and has         Katwijk et al., 1993; Kitheka, 2013), with the rapid increase
been shown to be strongly influenced by nitrogen inputs from       in sediment flux over the past half-century attributed to a
the greater Nairobi area (Marwick et al., 2014a), yet annual       combination of intensified land use practices, the highly vari-
fluxes of particulate and dissolved elements have not been         able climatic conditions and extremely erosive native soils.
measured in detail. In light of the planned construction of        More detailed information regarding basin settings may be
the Thwake Multipurpose Dam (currently awaiting tender             found in Marwick et al. (2014a).
approval; see http://www.afdb.org/projects-and-operations/
project-portfolio/project/p-ke-e00-008/, last access: 15 Jan-      2.2   Sampling and analytical techniques
uary 2018), we here present a 2-year biogeochemical record
at fortnightly resolution for the lower Sabaki River, and pro-     Physico-chemical parameters of the Sabaki River were mon-
vide estimates for sediment and nutrient export rates from the     itored biweekly (i.e. fortnightly) approximately 2 km up-
A-G-S system whilst still under pre-dam conditions.                stream of Sabaki Bridge (approximately 5 km upstream of
                                                                   the river outlet to Malindi Bay) for the period October 2011
2     Materials and methods                                        to December 2013. This site was chosen since it is close to
                                                                   the outflow to the ocean and thus integrates the yields over
2.1    Study area                                                  the entire basin; however, it is not influenced by salinity in-
                                                                   trusion or tidal influence. Water temperature, conductivity,
The Athi–Galana–Sabaki River basin is the second largest           dissolved oxygen (O2 ) and pH were measured in situ with
drainage basin (∼ 46 600 km2 ) in Kenya. The headwaters are        a YSI ProPlus multimeter, whereby the O2 and pH probes
located in central and south-east Kenya, in the vicinity of        were calibrated on each day of data collection using wa-
Nairobi (Fig. 1), draining agricultural areas (predominantly       ter saturated air and United States National Bureau of Stan-
tea and coffee plantations) which provide the livelihood of        dards buffer solutions (4 and 7) respectively. Samples for dis-
70 % of the regional population (Kithiia, 1997). Industrial        solved gases (CH4 , N2 O) and the stable isotope composition
activities and informal settlements dominate land use around       of dissolved inorganic C (δ 13 CDIC ) were collected from mid-
Nairobi, with livestock and small-scale irrigation activities      stream at ∼ 0.5 m depth with a custom-made sampling bottle
also present downstream. The basin land cover is dominated         consisting of an inverted 1 L polycarbonate bottle with the
by grasslands biomes (∼ 65 %) rich in C4 species (Fig. 1),         bottom removed, and ∼ 0.5 m of tubing attached in the screw
with agriculture accounting for ∼ 15 % and the region of           cap (Abril et al., 2007). Exetainer vials (12 mL) (for δ 13 CDIC )
Nairobi < 1 %. Forest biomes dominated by C3 vegetation            and 50 mL serum bottles (for CH4 and N2 O) were filled from
are isolated to higher altitude regions in the basin headwa-       water flowing from the outlet tubing, poisoned with HgCl2
ters, as well as in the coastal region where the Sabaki River      and capped without headspace. Approximately 2000 mL of

www.biogeosciences.net/15/1683/2018/                                                       Biogeosciences, 15, 1683–1700, 2018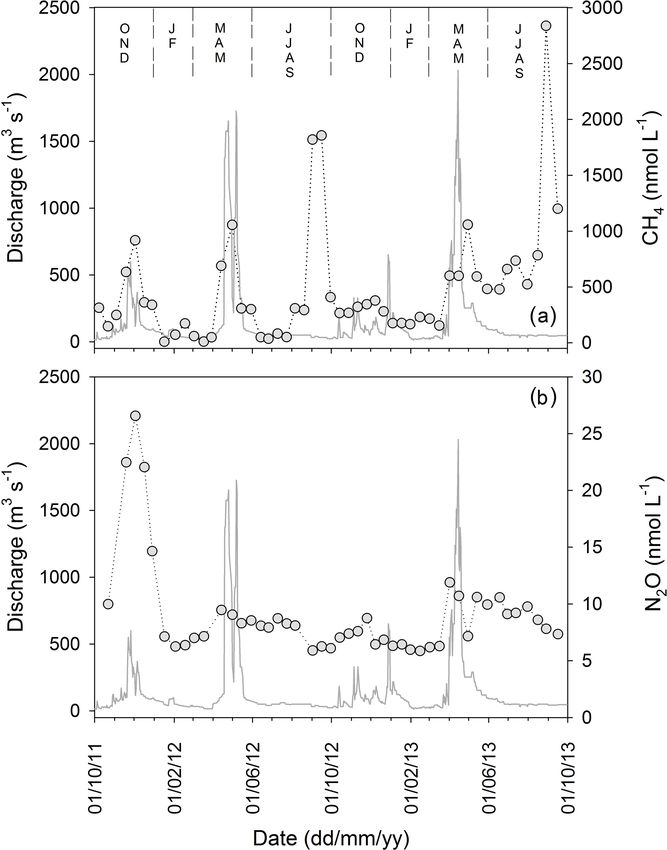
1686                                                                                T. R. Marwick et al.: The Sabaki River (Kenya)

Figure 1. The Athi–Galana–Sabaki River basin: (a) digital elevation model; (b) mean monthly variation of hydrological and climate param-
eters including discharge at the outlet (shaded area; data from 1959–1977), precipitation (black bar; from Fleitmann et al., 2007), potential
evapotranspiration (PET; grey box) and the maximum air temperature in Malindi (A-G-S outlet; dotted black line); (c) GLC2000 vegetation
biomes (Mayaux et al., 2004); (d) crop-corrected vegetation “isoscape” (extracted from Still and Powell, 2010). The yellow dots in (a) mark
the site locations from Marwick et al. (2014a), with the locations of biweekly sampling here (S20) and discharge data collection (S19)
indicated, while the area of Nairobi is highlighted by the red outline in the upper basin.

Biogeosciences, 15, 1683–1700, 2018                                                            www.biogeosciences.net/15/1683/2018/
T. R. Marwick et al.: The Sabaki River (Kenya) 1687
water was collected on each sampling occasion at ∼ 0.5 m
below the water surface for other particulate and dissolved
variables, with filtration and sample preservation performed
in the field within 2 h of sampling.
Samples for total suspended matter (TSM) were obtained
by filtering 60–250 mL of water using pre-combusted (4 h
at 500 ◦ C) and pre-weighed glass fibre filters (47 mm GF/F,
0.7 µm nominal pore size) and then dried in ambient air dur-
ing the fieldwork. Samples for determination of particulate
organic C (POC), particulate nitrogen (PN) and C isotope
composition of POC (δ 13 CPOC ) were collected by filtering
40-60 mL of water on pre-combusted (4 h at 500 ◦ C) 25 mm
GF/F filters (0.7 µm nominal pore size). The filtrate from the
TSM filtrations was further filtered with 0.2 µm polyethersul-
fone syringe filters (Sartorius, 16532-Q) for total alkalinity
(TA), DOC and δ 13 CDOC (8–40 mL glass vials with polyte-
trafluoroethylene coated septa). All samples were regularly
shipped to the home laboratories for analyses, which typi-
cally took place within 6 months of sample collection.
TA was analysed by automated electro-titration on 50 mL
samples with 0.1 mol L−1 HCl as titrant (reproducibility esti-
mated as typically better than ±3 µmol kg−1 based on repli-
cate analyses). For the analysis of δ 13 CDIC , a 2 mL he-
lium (He) headspace was created, and H3 PO4 was added to
convert all DIC species to CO2 . After overnight equilibra-
tion, part of the headspace was injected into the He stream
of an elemental analyser – isotope ratio mass spectrometer
(EA-IRMS, Thermo Finnigan Flash HT and Thermo Finni-
gan DeltaV Advantage) for δ 13 C measurements. The ob-
tained δ 13 C data were corrected for the isotopic equilibra-
tion between gaseous and dissolved CO2 as described in
Gillikin and Bouillon (2007), and measurements were cali-
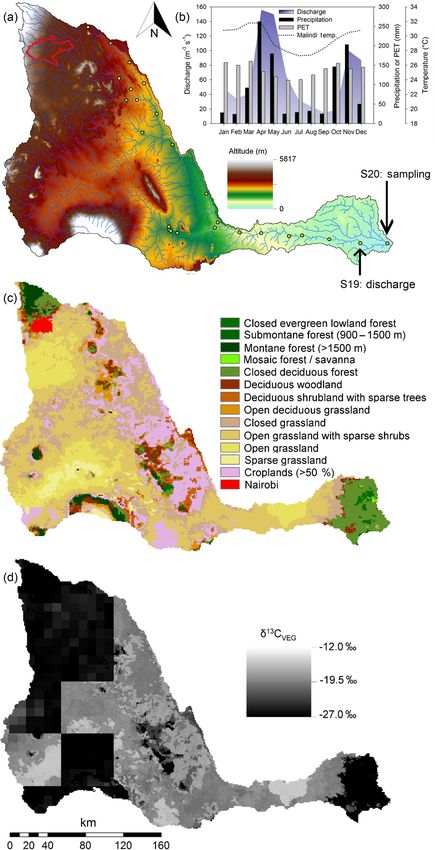
brated with certified reference materials LSVEC and either Figure 2. (a) Discharge rating curve for the Sabaki River at the
NBS-19 or IAEA-CO-1. Concentrations of CH4 and N2 O Baricho gauge station (3HA13). (b) Calculated daily discharge for
were determined via the headspace equilibration technique the 2-year monitoring period. Note the one anomalous gauge read-
(20 mL N2 headspace in 50 mL serum bottles) and measured ing on the 12 November 2012 provides an upper discharge estimate
by gas chromatography (GC, Weiss, 1981) with flame ion- of 41 332 m3 s−1 , over a magnitude larger than the next highest
isation detection (GC-FID) and electron capture detection daily discharge estimate (3441 m3 s−1 ). Given the discharge esti-
(GC-ECD) with a SRI 8610C GC-FID-ECD calibrated with mates on the preceding (11 November 2012) and following days (13
November 2012) were 312 and 218 m3 s−1 respectively and also re-
CH4 : CO2 : N2 O : N2 mixtures (Air Liquide Belgium) of 1,
ported historical maximum daily discharge of ∼ 5000 m3 s−1 (Delft
10 and 30 ppm CH4 and of 0.2, 2.0 and 6.0 ppm N2 O, and
Hydraulics, 1970), we linearly interpolated the gauge data for the
using the solubility coefficients of Yamamoto et al. (1976) 12 November 2012 from the values of adjacent days thereby lower-
for CH4 and Weiss and Price (1980) for N2 O. ing the discharge estimate for this date to 249 m3 s−1 . The curve in
Filters (25 mm) for POC, PN and δ 13 CPOC were decar- (a) was developed from the limited dataset (n = 11) of recent dis-
bonated with HCl fumes for 4 h, re-dried and packed in Ag charge measurements (2006–2007; grey circles) on the Sabaki River
cups. POC, PN and δ 13 CPOC were determined on the above- at Baricho (data supplied by WRMA, Machakos).
mentioned EA-IRMS using the thermal conductivity detec-
tor (TCD) signal of the EA to quantify POC and PN, and
by monitoring m/z 44, 45 and 46 on the IRMS. Internally OC (TOC) analyser (OI Analytical) coupled to a Delta V Ad-
calibrated acetanilide and sucrose (IAEA-C6) were used to vantage IRMS. Typical reproducibility observed in duplicate
calibrate the δ 13 CPOC data and quantify POC and PN, after samples was in most cases < ±5 % for DOC, and ±0.2 ‰ for
taking filter blanks into account. Reproducibility of δ 13 CPOC δ 13 CDOC .
measurements was better than ±0.2 ‰. Samples for DOC Our dataset for CH4 and N2 O has been used in a
and δ 13 CDOC were analysed either on a Thermo HiperTOC continental-scale data synthesis in Borges et al. (2015a), but
IRMS (Bouillon et al., 2006), or with an Aurora1030 total is discussed here in more detail.
www.biogeosciences.net/15/1683/2018/ Biogeosciences, 15, 1683–1700, 2018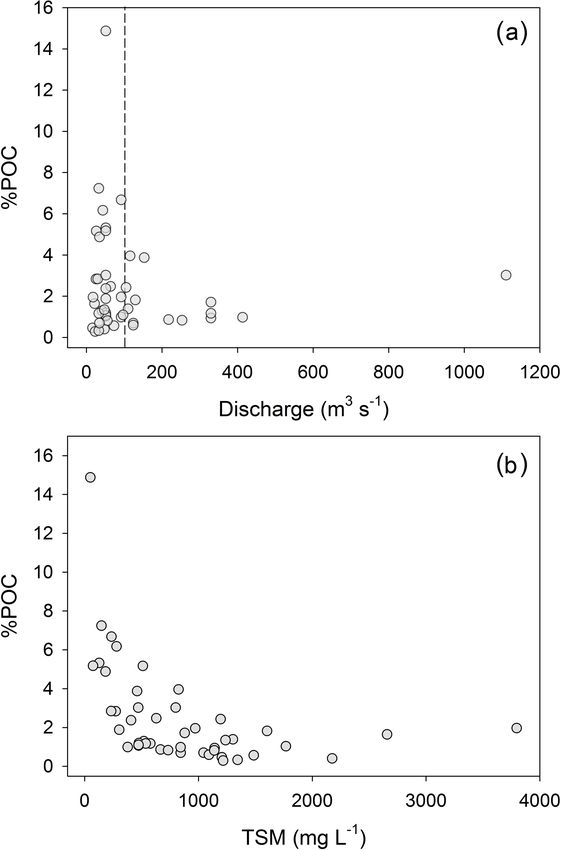
1688 T. R. Marwick et al.: The Sabaki River (Kenya)
2.3 Discharge estimates (October–December; OND), short dry (January–February;
JF), long wet (March–May; MAM) and long dry (June–
Historical discharge observations and daily gauge height data September; JJAS). Over the monitoring period, daily dis-
for the sampling period were provided by the Water Re- charge (Fig. 2b; see also Table S1 in the Supplement) varied
source Management Authority (WRMA), Machakos, Kenya. between 13 and 2032 m3 s−1 , with mean and median flow
Due to the poor resolution of discharge and gauge data at rates of 139 and 51 m3 s−1 respectively compared to the av-
the Sabaki Bridge north of Malindi (gauge no. 3HA06) over erage flow rate of 73 m3 s−1 reported by Kitheka (2013) for
the monitoring period, the finer fidelity record from the Bari- 2001–2003 and noted as a relatively wet period. The aver-
cho station (gauge no. 3HA13) was used, situated approx- age annual discharge throughout the monitoring period to-
imately 50 km upstream of our biogeochemical monitoring talled ∼ 4.4 km3 , considerably less than the ∼ 10.7 km3 used
station (i.e. site S20 from basin-wide sampling campaigns; by Mayorga et al. (2010) and approximately double that re-
see Marwick et al., 2014a). With discharge measurements ported by Kitheka (2013; ∼ 2.3 km3 ) for the period 2001–
from 2006 and 2007 (n = 11), care of WRMA, we devel- 2003. There was negligible inter-annual variation of total dis-
oped a rating curve to calculate daily discharge from avail- charge for the monitoring period. Discharge during the wet
able gauge data (Fig. 2a). As seen in Fig. 2a, the limited and seasons (MAM + OND) accounted for 82 and 79 % of an-
poor spread of discharge measurements results in extrapola- nual discharge for 2011–2012 and 2012–2013 respectively
tion for gauge heights < 1 and > 3 m. Although Kenyan rivers while 59 and 51 % of annual discharge occurred during the
have been suggested to export up to 80 % of annual sediment upper 10 % of daily flows for the same periods.
load during pulse discharge events over few days (Dunne, Throughout the results and discussion we use discharge
1979), the time frame of these event pulses is typically short- values of ≤68 m3 s−1 and ≥152 m3 s−1 when referring to low
lived relative to more typical flow conditions, and at heights and high flow (hereafter LF and HF) conditions respectively,
for example < 3 m (which account for ∼ 97 % of gauge data) corresponding to the maximum value for the upper 80 % of
we have reasonable confidence that the rating curve reflects daily dry season flows and minimum value for the upper 30 %
in situ conditions. Given the general positive correlation be- of daily wet season flows.
tween discharge and sediment concentration, and disregard-
ing possible hysteresis in discharge–sediment flux dynamics 3.2 Physico-chemical parameters
(which have been shown for the neighbouring Tana River),
we suspect the greatest error in our discharge estimates is Water temperature varied from 24.1 to 33.9 ◦ C (average
when gauge height exceeds 3 m. ±1 SD = 29.8 ±2.0 ◦ C), with considerable variability intra-
The Baricho gauge height dataset contains a 2-month pe- and inter-seasonally. The coolest temperatures occurred at
riod of no measurements (1 February to 31 March 2013). For the end of the MAM wet season and during the JJAS
this period, the daily discharge was estimated as the aver- dry season. pH varied widely across the sampling pe-
age discharge for that day over the previous 10 years (2003– riod (range = 4.6 to 10.1) yet maintained an average of
2012). Since this period falls within the dry season when 7.1 ± 1.1. Most basic conditions were typically observed
flows are relatively stable and low, we expect any bias de- during lower-flow periods of the dry seasons. %O2 satura-
riving from this approximation to have no major effect on tion ranged between 23.3 and 130.0 %, with least saturated
our annual flux estimates. conditions observed during the JJAS dry season of 2013.
There was no clear relationship between discharge and con-
2.4 Suspended sediment and C, N and P flux estimates ductivity, with the latter’s range varying sporadically over
the sampling period from 113.0 to 1080.0 µS cm−1 (aver-
Annual flux estimates for suspended sediments and the var-
age = 487.1 ± 254.5 µS cm−1 ). Total alkalinity (TA) varied
ious riverine fractions of particulate and dissolved C, N and
over an order of magnitude (0.475 to 4.964 mmol kg−1 ) with
P were calculated with the discharge data above. We interpo-
an average of 2.438 ± 0.872 mmol kg−1 . There was poor cor-
lated linearly between the concentrations measured on con-
relation between discharge and TA, with observed peaks
secutive sampling dates in order to establish concentrations
scattered across the hydrograph, suggesting a simple two
for every day of the study period. The daily concentrations
source scenario of baseflow and high-flow dilution is inad-
were then multiplied by daily discharge and summed over
equate to explain the seasonal variability for the A-G-S sys-
the study period to establish annual flux estimates.
tem. All data for physico-chemical parameters and those out-
3 Results lined below are presented in Table S1 of the Supplement.
3.1 Discharge 3.3 Bulk concentrations
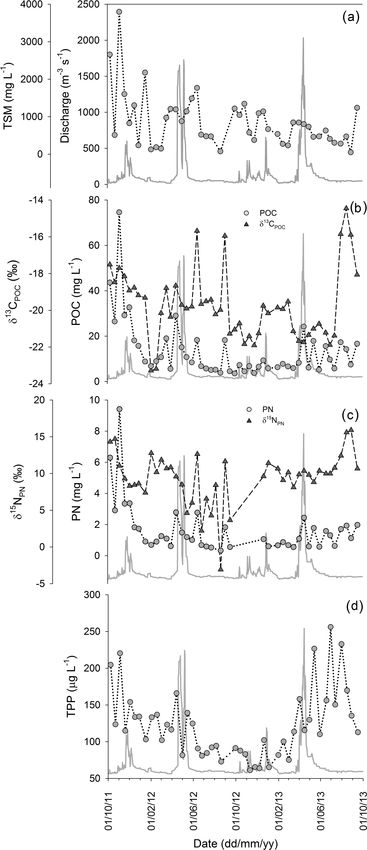
All data (excluding results for NH4 + , NO3 − and PO4 3− ) are The concentrations of TSM, POC, particulate N (PN) and
presented for the period between October 2011 and Septem- total particulate phosphorus (TPP) are shown in Fig. 3, as
ber 2013, encompassing two full seasons each of short wet well as the stable isotope composition of POC and PN,
Biogeosciences, 15, 1683–1700, 2018 www.biogeosciences.net/15/1683/2018/T. R. Marwick et al.: The Sabaki River (Kenya) 1689
with most variables showing no pronounced relationships
with discharge across the hydrological year. The Sabaki
River exported TSM varying in concentration from 50.0 to
3796.7 mg L−1 (Fig. 3a), containing POC at concentrations
between 3.5 and 74.6 mg L−1 (Fig. 3b). The lower and up-
per TSM and POC concentrations were associated with the
JJAS (dry) and OND (wet) periods of 2011 respectively. The
contribution of POC to the TSM pool (hereafter %POC)
indicates a wide biannual variation in suspended sediment
load from OC poor (0.3 %) to OC rich (14.9 %), with the
highest %POC occurring when discharge is < 100 m3 s−1
(Fig. 4a) and at lower TSM concentrations (Fig. 4b). The
large range for the C stable isotope (δ 13 C) of the POC pool
(δ 13 CPOC ; −23.3 to −14.5 ‰) displayed complex temporal
patterns with no obvious trends across seasons or with dis-
charge (Fig. 3b). Particulate N ranged in concentration from
0.3 to 9.4 mg L−1 (Fig. 3c), while the ratio of POC to PN (as
a weight : weight ratio; hereafter POC : PN) varied from 6.6
to 17.4, with an average value of 9.4 ± 1.7 (n = 42). The N
stable isotope composition (δ 15 N) of PN (δ 15 NPN ) showed
considerable fluctuation (from −3.1 to +15.9 ‰; Fig. 3c),
with the most 15 N-enriched PN recorded at the beginning of
the OND period of 2011–2012 and during the JJAS period
of 2012–2013. The TPP concentrations (Fig. 3d) ranged be-
tween 61.2 and 256.1 µg L−1 and were not correlated with
discharge. Although TPP generally rose during (or slightly
preceding) peak discharge, the highest values were recorded
under LF conditions during the 2012–2013 JJAS period.
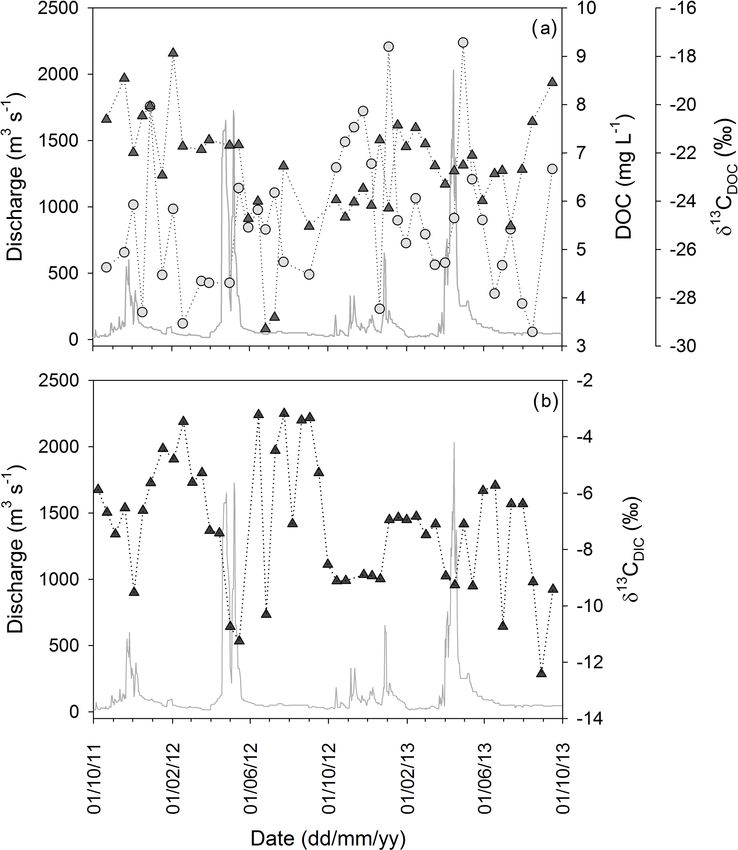
The dissolved organic C (DOC) concentration fluctuated
from 3.3 to 9.3 mg L−1 (Fig. 5a), with lowest and highest
concentrations observed during the JJAS and MAM periods
of 2013 respectively. The highest DOC concentrations were
regularly observed in the weeks following wet season peak
discharge. The contribution of DOC to the TOC pool ranged
between 15 and 68 % (accounting for 20 and 32 % of an-
nual TOC export during 2011–2012 and 2012–2013 respec-
tively) with no clear seasonal trend. Akin to the δ 13 CPOC , the
δ 13 C composition of the DOC pool (δ 13 CDOC ) varied widely
(−29.3 to −17.9 ‰ ) with no obvious relationship with ei-
ther seasonality or discharge (Fig. 5a). On average, the DOC
was more depleted in 13 C than in concurrent POC samples
(δ 13 CPOC − δ 13 CDOC = 2.8 ± 2.9 ‰, n = 40).
The δ 13 C composition of the DIC pool (δ 13 CDIC ) shifted
between −12.4 and −3.2 ‰ (Fig. 5b), and was generally
higher during LF periods and lower over the wet seasons.
Sampling of NH4 + , NO3 − and PO4 3− was conducted
over a different time frame than the rest of the data pre-
Figure 3. Discharge (solid grey line) and 2 years of monitoring the
sented here. The range in daily discharge over this time
(a) total suspended matter concentration, the concentration and sta-
ble isotope signature of (b) particulate organic carbon and (c) partic- period (21 December 2012 to 20 December 2013) re-
ulate nitrogen and the concentration of (d) total particulate phospho- flects the ranges reported above for the 2-year discharge
rus in the Sabaki River. In all figures grey circles represent bulk con- record, although the mean flow rate was somewhat ele-
centrations and dark triangles represent stable isotope signatures. vated (169 m3 s−1 ). Total annual discharge was 5.3 km3 , with
around 83 % of total annual discharge occurring during the
wet seasons. The concentration range for NH4 + , NO3 − and
PO4 3− over the 1-year period were 7.1 to 309.6 µmol L−1 ,
www.biogeosciences.net/15/1683/2018/ Biogeosciences, 15, 1683–1700, 20181690 T. R. Marwick et al.: The Sabaki River (Kenya)
Figure 5. Discharge and 2 years of monitoring the dissolved (a) or-
ganic carbon concentration and carbon stable isotope signature, and
(b) the carbon stable isotope signature of dissolved inorganic car-
bon in the Sabaki River. Grey circles represent bulk concentrations,
with dark triangles for all stable isotope signatures.
(Fig. 7a). Although CH4 peaks occurred in both dry and wet
Figure 4. The relationship between the percent contribution of par-
seasons, the largest annual peaks occur at the end of the JJAS
ticulate organic carbon to the total suspended load and (a) discharge
and (b) total suspended matter. The dashed line in (a) marks dis-
dry period. Concentrations of dissolved N2 O (Fig. 7b) var-
charge of 100 m3 s−1 , as cited in the text. ied from 5.9 to 26.6 nmol L−1 , corresponding to oversatura-
tion of 100 to 463 % relative to atmospheric concentrations.
N2 O concentrations were highest during the OND period of
2011–2012, and otherwise showed maximum concentrations
< 0.1 to 506.9 µmol L−1 and 1.1 to 322.6 µmol L−1 respec- preceding peak discharge during the MAM period of each
tively (Fig. 6). No clear seasonal pattern is apparent in year.
the dissolved inorganic N fractions (Fig. 6b, c), although
peak concentrations generally occur at below-average dis- 3.4 Annual flux and yield of particulate and dissolved
charge conditions (i.e. when Q < 169 m3 s−1 then the aver- fractions
age (±1 SD) DIN concentration is 172.2 ± 140.1 µmol L−1
(n = 20), whereas when Q ≥ 169 m3 s−1 then the aver- Annual material flux estimates to the coastal zone for TSM
age (±1 SD) DIN concentration is 59.6 ± 26.3 µmol L−1 and various C, N and P fractions are provided in Table 1.
(n = 5)). The concentration of PO4 3− (Fig. 6d)was highly Briefly, our data suggest a mean flux of 4.0 Tg TSM yr−1 ,
variable at below-average flow conditions (i.e. when 70.6 Gg POC yr−1 and 24.1 Gg DOC yr−1 , corresponding to
Q < 169 m3 s−1 the average (±1 SD) PO4 3− concentration mean annual %POC of 1.8 %, and mean annual contribution
is 105.7 ± 97.2 µmol L−1 (n = 20)), whereas concentrations of DOC to the TOC pool (hereafter %DOC) of 26 %. Bian-
became comparatively low during above-average discharge nually, wet season (OND, MAM) flows carried > 80 % of
(i.e. when Q ≥ 169 m3 s−1 then the average (±1 SD) PO4 3− the total load for TSM (∼ 86 %), POC (∼ 89 %) and DOC
concentration is 34.8 ± 31.0 µmol L−1 (n = 5)). (∼ 81 %), with the MAM period accounting for > 50 % of
The river was consistently oversaturated in dissolved CH4 TSM, POC and DOC annual export. Estimates of mean an-
relative to the atmosphere (from 499 to 135 111 %) with nual flux of PN and TPP were 7.5 and 0.5 Gg respectively,
a concentration range of between 10 and 2838 nmol L−1 and > 80 % of biannual export of PN (∼ 89 %) and TPP
Biogeosciences, 15, 1683–1700, 2018 www.biogeosciences.net/15/1683/2018/T. R. Marwick et al.: The Sabaki River (Kenya) 1691
Figure 7. Two years of monitoring concentrations of dissolved
(a) methane and (b) nitrous oxide. Grey circles represent riverine
gas concentrations.
Annual dissolved nutrient flux estimates (Table 1) were
2.3 Gg NH4 + , 4.3 Gg NO3 − and 11.2 Gg PO4 3− . Approxi-
mately 75 % of NH4 + export occurred during the wet sea-
sons, whereas only 66 % of NO3 − export occurred over the
same period. Approximately 79 % of annual PO4 3− export
took place during the wet seasons, with a greater proportion
exported over the OND wet season (45 %) than the MAM
wet season.
Various surface area estimates are reported for the A-G-S
Basin, ranging from 40 000 km2 (Giesen and van de Kerkhof,
1984; van Katwijk et al., 1993), to ∼ 70 000 km2 (Fleit-
mann et al., 2007; Kitheka, 2013), and up to 117 000 km2 by
Mayorga et al. (2010). Using ArcGIS 10.1 and the African
river basin output of Lehner et al. (2006; http://hydrosheds.
Figure 6. (a) Daily discharge rates and 1 year of monitoring the cr.usgs.gov), we estimate the A-G-S Basin covers an area of
concentration of dissolved (b) ammonium, (c) nitrate and (d) phos-
∼ 46 750 km2 .
phate in the Sabaki River. In panels (b)–(d) grey circles represent
Taking the above basin area estimate and the flux
bulk concentrations.
values detailed above, we estimate mean annual
yields of 84.6 Mg TSM km−2 , 1.51 Mg POC km−2 and
(∼ 82 %) occurred during the wet seasons, with > 50 % of 0.52 Mg DOC km−2 (Table 1). Conservative mean annual
the annual flux occurring over the MAM period. yields for particulate nutrient forms 161 kg PN km−2 and
11 kg TPP km−2 , while those of the dissolved fractions
over the single hydrological year were 49 kg NH4 + km−2 ,
www.biogeosciences.net/15/1683/2018/ Biogeosciences, 15, 1683–1700, 20181692 T. R. Marwick et al.: The Sabaki River (Kenya)
Table 1. Summary of annual fluxes, element ratios and annual clude with consideration of the future anthropogenic impacts
yields for the Athi–Galana–Sabaki River basin from data reported in the A-G-S Basin and the consequences for material fluxes
here and from the NEWS2 export model (see Mayorga et al., 2010), from the Sabaki River to the coastal zone.
as well as data for 2012 and 2013 from the neighbouring Tana River
basin at Garsen (Geeraert et al., 2018). 4.1 Material fluxes, annual yields and their origin
A-G-S A-G-S Tana
To the best of our knowledge, and excluding suspended mat-
(NEWS2)
ter, the estimates provided in Table 1 are the first quan-
Fluxes tifications of material fluxes from the A-G-S system, al-
though we stress that our material flux estimates may not be
Basin area (km2 ) 46 750 117 230 81 700
the most robust since (i) hydrological data are incomplete
Discharge (km3 yr−1 ) 4.39a 10.75 4.32–4.71
Discharge (km3 yr−1 ) 5.32b
and discharge data rely on an limited number of measure-
TSM (Tg yr−1 ) 4.0 38.8 4.1–4.9
ments to construct a rating curve and (ii) our study covered
POC (Gg yr−1 ) 70.6 205.3 113–157 a period of 2 years, while annual discharge in this system
DOC (Gg yr−1 ) 24.1 49.5 11–14 is likely to show substantial interannual variability. A sus-
PN (Gg yr−1 ) 9.4 16.4 pended sediment flux of ∼ 7.5 to 14.3 Tg yr−1 is commonly
TPP (Gg yr−1 ) 0.5 9.6 cited for the A-G-S system (Watermeyer et al., 1981; van
DIN 6.6 7.4 Katwijk et al., 1993; Fleitmann et al., 2007), which is ap-
PO4 3− (Gg yr−1 ) 11.2 0.9 proximately 2- to 3.5-fold greater than our conservative flux
%POC (of TSM) 1.8 0.5 estimate of ∼ 4.0 Tg TSM yr−1 . A more recent estimate from
POC : PN 8.7 12.5 Kitheka (2013) for the period 2001–2003 (5.7 Tg yr−1 ) is
%DOC (of TOC) 25.5 23.0 still greater than, though more comparable to, our own esti-
Yields mate above. While we employed year-round biweekly moni-
toring and extrapolated fluxes from daily gauge height read-
TSM (Mg km−2 yr−1 ) 84.6 330.7 50.2–60.0 ings, Kitheka (2013) measured concurrent discharge and sus-
POC (Mg km−2 yr−1 ) 1.51 1.75 1.38–1.92 pended matter concentrations at monthly to biweekly period-
DOC (Mg km−2 yr−1 ) 0.52 0.42 0.13–0.17 icity. The relative coarseness of sampling interval employed
PN (kg km−2 yr−1 ) 161 140 by Kitheka (2013), in combination with their acknowledge-
TPP (kg km−2 yr−1 ) 11 82 ment that peak sediment flux often occurs prior to peak dis-
DIN (kg km−2 yr−1 ) 142 63 charge, i.e. sediment exhaustion effect (Rovira and Batalla,
PO4 3− (kg km−2 yr−1 ) 239 8 2006; Oeurng et al., 2011; Tamooh et al., 2014), may preempt
a All fractions except dissolved N and P: hydrological years 1 October 2011 to accurate extrapolation of the annual sediment flux from their
30 September 2012 and 1 October 2012 to 30 September 2013. limited dataset. For example, in order to accurately estimate
b Dissolved N and P only: hydrological year 21 December 2012 to 14 December
2013. fluxes in systems with an irregular hydrograph, such as the
neighbouring Tana River (which experiences climatic con-
ditions and annual hydrograph pattern similar to the A-G-S
93 kg NO3 − km−2 and 239 kg PO4 3− km−2 (see also Basin), monitoring at a recurrence interval of < 7 days has
Table S2 in the Supplement). been recommended (Tamooh et al., 2014), also implying that
the flux estimates presented here may be improved with a
more refined sampling frequency.
4 Discussion If we normalise the basin area of ∼ 70 000 km2 reported
by Fleitmann et al. (2007) and Kitheka (2013) to the value
Although previous studies provide estimates of annual sus- reported here (∼ 46 750 km2 ), and subsequently recalculate
pended sediment fluxes at the Sabaki outlet as well as annual their SY from their riverine sediment flux values, we find
yield estimates for the A-G-S Basin (GOK-TARDA, 1981; our SY of ∼ 85 Mg km−2 yr−1 is considerably lower than
Munyao et al., 2003; Kitheka, 2013), their primary research the 160 to 306 Mg km−2 yr−1 recalculated from Fleitmann et
focus lay elsewhere, and none provide the comprehensive al. (2007) and the 122 Mg km−2 yr−1 from Kitheka (2013).
biogeochemical record at a comparable temporal scale as Some have reported that prior to 1960 the suspended sed-
presented here. The following discussion revolves around the iment load of the A-G-S Basin was ∼ 58 Gg yr−1 (Water-
main objectives of our study, including (i) the quantification meyer et al., 1981; Van Katwijk et al., 1993), which is equiv-
of annual suspended matter, C, N and P fluxes and sediment alent to an SY of ∼ 1 Mg km−2 yr−1 . Although indeed the
yield, (ii) characterising the sources of particulate and dis- A-G-S Basin has been disturbed by anthropogenic practices
solved fractions of C and N and (iii) providing indications to since European arrival, this value needs to be met with some
the water–atmosphere transfer of important greenhouse gases scepticism, as it represents an approximately 85-fold in-
(CH4 and N2 O) at the outlet of the Sabaki River. We con- crease in annual soil loss over the past 50 years. In the neigh-
Biogeosciences, 15, 1683–1700, 2018 www.biogeosciences.net/15/1683/2018/T. R. Marwick et al.: The Sabaki River (Kenya) 1693 bouring Tana River basin, Tamooh et al. (2014) estimated an- and Wambua, 2010), providing an evident explanation for the nual suspended sediment yields between 46 and 48 Mg km−2 POC-loaded sediment flux from the A-G-S Basin in compar- at ∼ 150 km from the river mouth (basin area of 66 500 km2 ). ison to other African river basins. More recently, the higher-resolution dataset of Geeraert et The annual DOC yield from the A-G-S Basin al. (2018; see Table 1) for the Tana River at Garsen (∼ 70 km (0.5 Mg DOC km−2 ) is markedly lower than the global from the river mouth, basin area of 81 700 km2 ) estimated a mean of 1.9 Mg DOC km−2 (Ludwig et al., 1996). The yield suspended SY of 50–60 Mg km−2 , indicating that the rela- is within the range of 0.1 to 0.6 Mg DOC km−2 reported tively smaller A-G-S Basin exports a comparable quantity of for the Tana River (Tamooh et al., 2014), consistent with sediment annually to the coastal zone to that discharged from the global observation of low DOC concentrations in rivers the much larger (and heavily regulated) Tana River basin. of semi-arid regions (Spitzy and Leenheer, 1991), and also The SY reported here is low compared to the global aver- falls between observations in tropical savannah basins of age of 190 Mg km−2 yr−1 (Milliman and Farnsworth, 2011) ∼ 0.3 Mg DOC km−2 for the Gambia River (Lesack et al., and considerably less than the average of 634 Mg km−2 yr−1 1984) and ∼ 0.9 Mg DOC km−2 for the Paraguay River for the African continent recently reported by Vanmaercke et (Hamilton et al., 1997). Tamooh et al. (2014) attributed the al. (2014). This may be somewhat surprising given the typ- low DOC yield in the Tana basin to low soil OC content ically concentrated suspended sediment loads observed over (average of 3.5 ± 3.9 % OC) as well as high temperatures in the monitoring period (mean (±1 SD) = 865 ± 712 mg L−1 ; the lower basin (Tamooh et al., 2012, 2014). Surface soils median = 700 mg L−1 ), but can be explained by the fact all (0–5 cm) in the A-G-S Basin were of low OC content also, TSM concentrations > 1500 mg L−1 were observed at be- ranging between 0.4 and 8.9 % OC with an average value low HF discharge rates (i.e. < 152 m−3 s−1 ; see Fig. 3a). of 2.0 ± 1.9 % (n = 19; own unpublished data), although All the same, our SY estimate is over 3-fold greater than due to site selection, samples were not gathered from the the average pre-dam SY of 25 Mg km−2 yr−1 from the relatively OC-rich soils of the upper A-G-S Basin (see Congo, Nile, Niger, Zambezi and Orange rivers (draining https://maps.qed.ai/ (last access: 16 March 2018) and the > 40 % of the African landmass; Milliman and Farnsworth, soil organic carbon mean–depth 0–5 cm overlay). 2011). Sediment yield estimates from other arid tropi- In contrast to some other C4 -rich tropical and sub-tropical cal basins of Africa (e.g. Gambia, Limpopo, Niger, and river basins, the POC load in the Sabaki River (average Senegal rivers) are significantly lower (between 3 and δ 13 C = −19.7 ± 1.9 ‰) is marginally enriched in 13 C com- 18 Mg km−2 yr−1 ; Milliman and Farnsworth, 2011), al- pared to the basin-wide bulk vegetation δ 13 C value of though reported yields of 94 Mg km−2 yr−1 from the Rufiji −21.0 ‰, as estimated from the crop-corrected vegetation (Tanzania) and 88 Mg km−2 yr−1 from the Ayensu (Ghana), isoscape of Africa in Still and Powell (2010; Fig. 1c). A both arid tropical basins, are equivalent to what was observed consistent underrepresentation of C4 -derived C in riverine in the A-G-S Basin. OC pools was reported in the C4 -dominated Betsiboka River The annual POC yield (1.5 Mg POC km−2 ) from the basin of Madagascar (Marwick et al., 2014b), the Congo A-G-S Basin is equivalent to the global average of Basin (particularly during dry season, Mariotti et al., 1991; 1.6 Mg POC km−2 (Ludwig et al., 1996), though al- Bouillon et al., 2012), the Amazon Basin (Bird et al., 1992) most triple the estimate of 0.6 Mg POC km−2 by Ta- and in rivers of Australia (Bird and Pousai, 1997) and mooh et al. (2014) at their most downstream site on the Cameroon (Bird et al., 1994 and 1998). The relatively low C4 neighbouring Tana River, and over 7-fold greater than contributions in these rivers has typically been attributed to a the 0.2 Mg POC km−2 reported from the largely pristine, greater portion of riverine OC sourced from the neighbouring wooded savannah-dominated Oubangui River (Bouillon et C3 -rich riparian zone relative to more remote C4 -dominated al., 2014), the second largest tributary to the Congo River. landscapes (i.e. grassland/savannah). Under this scenario, the The over-riding influence of sewage inputs on the biogeo- C4 -derived riverine OC component generally peaks during chemistry of the A-G-S Basin has been previously brought to the wet season in response to the increased mobilisation of attention by Marwick et al. (2014a), partially through inves- surface and sub-surface OC stocks from more distant C4 - tigation of the δ 15 N composition of the PN pool. The aver- rich sources. At the outlet of the A-G-S Basin, on the other age δ 15 NPN recorded across the monitoring period here was hand, not only was POC more enriched in 13 C (peak value 9.5 ± 3.5 ‰ (n = 43), which sits above the 75th percentile of −14.5 ‰) than values recorded in the neighbouring Tana of measurements within other African basins (see Fig. 10 in Basin (−19.5 ‰; Tamooh et al., 2014) and the C4 -dominated Marwick et al., 2014a), and reflects the range of δ 15 N sig- Betsiboka Basin (−16.2 ‰; see Marwick et al, 2014b), but natures of NH4 + (+7 to +12 ‰ ; Sebilo et al., 2006) and these 13 C-enriched POC loads occurred during consecutive NO3 − (+8 to +22 ‰ ; Aravena et al., 1993; Widory et al., JJAS periods (i.e. long dry season), and therefore, an al- 2005) sourced from raw waste discharge. As highlighted ear- ternative mechanism to the “riparian zone effect” outlined lier, around 50 % of Nairobi’s population of 3 million live above is required to explain these dry season observations. in slums with inadequate waste management facilities which One possibility is herbivore-mediated inputs of C4 -derived leads to increasing water quality issues (Dafe, 2009; Kithiia organic material (OM) to riverine OC pools, such as from www.biogeosciences.net/15/1683/2018/ Biogeosciences, 15, 1683–1700, 2018
1694                                                                        T. R. Marwick et al.: The Sabaki River (Kenya)

livestock or large native African mammals, as has been re-        removal of DIN in the upper to mid-basin during the dry sea-
ported for Lake Naivasha (Grey and Harper, 2002) and the          son and which resulted in significantly lower DIN concentra-
Mara River in Kenya (Masese et al., 2015). The combined           tion at the monitoring station (i.e. site S20 from Marwick et
Tsavo West and Tsavo East national parks, accounting for          al., 2014a) relative to wet season observations. Our higher-
approximately 4 % of the total surface area of Kenya, are dis-    resolution dataset, however, suggests a more complex rela-
sected by the Galana River downstream of the confluence of        tionship between DIN concentrations, seasonality and dis-
the Tsavo with the Athi River. These national parks contain       charge, given that peak DIN concentrations were also ob-
large populations of mammalian herbivores (Ngene et al.,          served during low-flow conditions (Fig. 6b, c). In particu-
2011), including elephants and buffalo (Fig. S1a and b in the     lar, a prominent NH4 + peak during the JJAS dry season of
Supplement), which graze on the C4 savannah grasses and           2013 occurred in conjunction with peaks in POC and PN, and
gravitate towards perennial water sources, such as the Galana     might be attributed to in situ processing of the dry season or-
River, during the dry season. More importantly, hippopotami       ganic matter inputs from large herbivores in the lower basin,
(Fig. S1c in the Supplement) graze within the C4 -rich savan-     as outlined above. Similarly, a prominent peak in NO3 − was
nas by night and excrete partially decomposed OM into the         observed during the JF dry season, for which no clear ex-
river during the day. Grey and Harper (2002) estimated the        planation exists. Despite this, our flux estimates suggest that
total quantity of excrement for the Lake Naivasha hippopota-      the annual DIN and PN export predominantly occurs during
mus population to be ∼ 5.8 Gg yr−1 (∼ 500 individuals), as-       the wet seasons as a result of the elevated discharge condi-
suming a consumption of 40 kg of biomass and a measured           tions, and with the consistent enrichment of the PN pool in
maximum wet weight of 8 kg of excrement on land per in-           15 N (Fig. 3d) relative to the δ 15 N composition of biologically

dividual per night, with the remainder excreted into the lake     fixed N (i.e. ∼ 0 to +2 ‰ ), this supports the analysis of Mar-
during the day. This equates to approximately ∼ 12 Mg yr−1        wick et al. (2014a) that anthropogenic inputs impart signif-
per hippopotamus, and using the mean excrement compo-             icant influence on the cycling of N in the A-G-S Basin and
sitions from Grey and Harper (2002) of 37 % carbon and            the export budget of N from the Sabaki River to the coastal
1.5 % nitrogen, results in hippopotamus-mediated delivery of      zone.
∼ 740 kg C yr−1 and ∼ 30 kg N yr−1 . To a lesser extent, addi-       The Global Nutrient Export from Watersheds 2 (NEWS2;
tional terrestrial subsidies would be supplied by livestock us-   see Mayorga et al., 2010) provides flux and yield estimates
ing the river as a water source (Fig. S1d in the Supplement).     for TSM and particulate and dissolved fractions of organic
Aerial census results from 2011 identified ∼ 80 hippopotami       and inorganic forms of C, N and P for > 6000 river basins
within the combined Tsavo East (i.e. Athi and Galana rivers)      through hybrid empirical and conceptual based models re-
and Tsavo West (i.e. Tsavo River) national parks, consider-       lying on single and multiple linear regressions and single-
ably less than the ∼ 4000 reported from the Masai Mara Na-        regression relationships. Comparatively, our flux estimates
tional Reserve where the research of Masese et al. (2015)         are in general considerably lower than the NEWS2 estimates
was conducted. Figure S1 in the Supplement highlights the         (Table 1), except for the dissolved PO4 3− pool. There are
high density of other large mammals congregating around           at least three likely explanations for these overestimates.
the Athi and Galana rivers, and though a smaller propor-          Firstly, the basin area used in NEWS2 calculations is 2.5-
tion of their total excrement will be released directly to the    fold greater than our estimate, and given the flux estimates
river relative to hippopotami, the combined quantity may          of Mayorga et al. (2010) are also a function of basin area, it
make a significant contribution to the riverine OC pool un-       is understandable there will be considerable overestimation
der low-flow conditions. Hence, it is reasonable to assume        by the model. Secondly, the TSM sub-model is grounded in
these herbivores deliver significant quantities of C4 -derived    datasets of observed conditions (generally not impacted by
OM to inland waterways, especially during the dry season          extensive damming) and independent factors including pre-
when other local water sources are depleted, with this be-        cipitation, a relief index, dominant lithology, wetland rice
ing a time when the inputs may be particularly noticeable in      and marginal grassland extent, whereas the export of particu-
riverine δ 13 CPOC signatures, as the contribution from other     late forms of C, N and P are reliant on empirical relationships
allochthonous sources would be minimised (especially C4 -         between contents of TSM and POC (Ludwig et al., 1996) and
derived OM; see Marwick et al., 2014b) due to lower ter-          POC and PN (Ittekkot and Zhang, 1989), and a relationship
restrial runoff rates. The correlation between minor peaks in     for particulate phosphorus export based on POC load devel-
bulk POC and 13 C-enriched δ 13 CPOC signatures during the        oped by Beusen et al. (2005). We suggest these relationships
JJAS period of 2012 supports this suggestion, when without        may not extrapolate well to a basin so severely impacted by
a simultaneous increase in discharge, a short pulse of C4 -       anthropogenic inputs as the A-G-S system. Thirdly, export
derived OC is observed in the Sabaki River.                       of dissolved fractions is built upon an empirical dataset of
   The findings from the basin-wide campaigns reported in         131 global river basins, though this includes only 9 African
Marwick et al. (2014a) led to the suggestion that the concen-     basins, compared to 45 basins for North America and 36
tration of DIN in export from the A-G-S Basin likely peaks        basins for Europe for example, and hence the relationships
during the wet season, due to the significant processing and      developed from these datasets will be biased towards condi-

Biogeosciences, 15, 1683–1700, 2018                                                    www.biogeosciences.net/15/1683/2018/
T. R. Marwick et al.: The Sabaki River (Kenya)                                                                              1695

tions observed in these regions and not necessarily reflective    dry season was mirrored by a distinct decrease of O2 satu-
of African systems. Additionally, the NEWS2 model only            ration level from ∼ 100 to ∼ 20 %. Although we provide no
takes into account contributions from sewage when areas are       flux estimates, these elevated concentrations relative to ob-
connected to sewage systems (i.e. point source inputs), which     servations in other African river systems at least hint that the
is not the case for 1.5 million residents of Nairobi, and may     A-G-S river system may be a relatively significant source of
explain the major underestimation of the dissolved PO4 3−         CH4 outgassing at the local scale.
flux.                                                                Nitrous oxide in rivers is sourced from either nitrifica-
                                                                  tion or denitrification, and although the interest in N2 O is
4.2   Greenhouse gases                                            growing due to its recognition as a significant contributor
                                                                  to radiative forcing (Hartmann et al., 2013) and as a major
The combination of high-frequency sampling and long-term          ozone depleting substance (Ravishankara et al., 2009), rela-
monitoring of dissolved CH4 and N2 O concentrations in the        tively limited datasets are available for rivers (see Baulch et
rivers of Africa remain scarce (Borges et al., 2015a). The av-    al., 2011; Beaulieu et al., 2011; Marzadri et al., 2017) and
erage and median concentrations of CH4 in the Sabaki River        very few for tropical systems specifically (see Guérin et al.,
(483 ± 530 nmol CH4 L−1 and 311 nmol CH4 L−1 respec-              2008; Bouillon et al., 2012; Borges et al., 2015a). We ob-
tively; n = 50) often exceeded observations in other rivers       serve similar seasonal patterns in the Sabaki River to those
of Africa, including the mid- and lower Tana River (54–           observed by Bouillon et al. (2012) in the Oubangui River,
387 nmol CH4 L−1 ; Bouillon et al., 2009), the Comoé, Bia         with concentrations during low-flow conditions typically
and Tanoé rivers of Côte d’Ivoire (48–870 nmol CH4 L−1 ;          hovering at ∼ 5–6 nmol N2 O L−1 (Fig. 7b) and increasing
Koné et al., 2010) and the Oubangui River of Central African      as high-flow conditions approach, though our peak concen-
Republic (74–280 nmol CH4 L−1 ; Bouillon et al., 2012). On        tration (26.6 nmol N2 O L−1 ; 463 % saturation) is consider-
a seasonal basis, CH4 concentrations tended to rise and fall      ably higher than that reported for the largely pristine Ouban-
with discharge (Fig. 7a), opposite to observations in the         gui River basin (9.6 nmol N2 O L−1 ; 165 % saturation), with
Oubangui and Côte d’Ivoire rivers where highest concen-           this pattern reflecting well the concentrations observed at the
trations are observed during low-flow periods and decrease        monitoring station during the basin-wide campaigns of JJAS
as discharge increases (Koné et al., 2010; Bouillon et al.,       dry season (6.3 nmol N2 O L−1 ; 116 % saturation) and OND
2012), and are likely linked to the increased supply of organic   wet season (15.8 nmol N2 O L−1 ; 274 % saturation). The sea-
waste primed for decomposition from Nairobi. On the other         sonal pattern reported from these African rivers is unique
hand, the highest peaks (1857–2838 nmol CH4 L−1 ; 85 171–         compared to temperate rivers, where the opposite pattern is
135 111 % saturation) were observed over the dry JJAS dry         more typical (Cole and Caraco, 2001b; Beaulieu et al., 2011).
seasons of 2012 and 2013, their timing coinciding with the        Given the reported correlation between N2 O and NO3 − con-
peaks in POC, PN and NH4 + previously discussed and at-           centrations in various river systems (Baulch et al., 2011;
tributed to large mammalian inputs, and we suggest these          Beaulieu et al., 2011), including three from Africa (Borges
short-lived dry season CH4 peaks likely represent the decom-      et al., 2015a), and that basin-wide data shows gradually in-
position of these mammalian-mediated terrestrial subsidies.       creasing concentrations from ∼ 179 to 538 µmol NO3 − L−1
CH4 showed two seasonal peaks, one during high water and          over the 200 km reach directly upstream of the monitoring
another at the end of the low water period. The peak of CH4       site during the OND wet season (see Marwick et al., 2014a),
during high water might be related to the increased connec-       we make a first assumption that the elevated N2 O concen-
tivity between river and wetlands such as floodplains as re-      trations during the wet season may be driven by upstream
ported in the Zambezi River (Teodoru et al., 2015), and in the    nitrification of the wastewater inputs identified in Marwick
Oubangui (Bouillon et al., 2012, 2014). The peak of CH4 at        et al. (2014a).
the end of the dry season is obviously unrelated to interac-
tion with wetlands since at this period river and floodplains     4.3   Future outlook
are hydrologically disconnected. We hypothesise that this in-
crease of CH4 is related to the combination of increased wa-      The biogeochemical cycles and budgets of the Athi–Galana–
ter residence time and the additional inputs of organic matter    Sabaki river system have been considerably perturbed by the
from hippopotami. Indeed, they aggregate during low flow          introduction of European agricultural practices in the early
in river pools and river banks leading to a substantial in-       20th century and the expanding population of Nairobi living
put of organic matter (Subalusky et al., 2015) that we hy-        with inadequate waste water facilities (Van Katwijk et al.,
pothesise leads to enhanced in-stream CH4 production. Dur-        1993; Fleitmann et al., 2007). These factors have had consid-
ing high-water period, the hippopotami disperse across the        erable impact on riverine sediment loads (Fleitmann et al.,
landscape, presumably having a lower impact on river wa-          2007), instream nutrient cycling (Marwick et al., 2014a) and
ter biogeochemistry. Indeed, during the low water period O2       near-shore marine ecosystems in the vicinity of the Sabaki
decreased in 2011, although the CH4 increase was modest.          outlet (Giesen and van de Kerkhof, 1984; Van Katwijk et
However, the marked increase of CH4 at the end of the 2013        al., 1993). Recent modelling of nutrient export to the coastal

www.biogeosciences.net/15/1683/2018/                                                     Biogeosciences, 15, 1683–1700, 2018
You can also read