Climate Change Your Mind - Responding to the Canadian government's "Canada's Changing Climate Report" CCCR2019 - Friends of Science
←
→
Page content transcription
If your browser does not render page correctly, please read the page content below

Climate Change Your
       Mind.
       Responding to the Canadian government’s “Canada’s Changing Climate
       Report” CCCR2019

Michelle Stirling                     4/30/19             Friends of Science Society
CLIMATE CHANGE YOUR MIND.

Contents
Executive Summary....................................................................................................................................... 2
You’re Feeling Warmer. Aren’t you? ............................................................................................................ 4
Temperatures and Precipitation Might Change Somewhere Sometime. ..................................................... 5
Köppen Climate Types Exhibit Common Long-term Characteristics. ........................................................... 5
UN Climate Panel Rejects Extreme Weather-Human Attribution ................................................................ 6
Climate Models – Not a Crystal Ball .............................................................................................................. 7
   “The climate model is a very good tool for understanding climate, but a very bad tool for predicting
   climate” ..................................................................................................................................................... 7
Climate Models do not Reflect Observations ............................................................................................... 9
Rapid Decarbonization – Reality or Fantasy? ............................................................................................. 10
What Causes Climate Change? ................................................................................................................... 13
100% Confident that CO2 Influence is not Seen in Canadian Temperature Records ................................. 15
Heat Waves, Drought and Other Extremes Unrelated to CO2 .................................................................... 19
Fort McMurray Wildfires – Human Causation and Lack of Preparation..................................................... 20
Sea Ice Variability and Polar Bear Survival .................................................................................................. 25
   Geothermal Activity – A Forgotten Factor in Sea Ice Variability ............................................................ 27
Floods .......................................................................................................................................................... 29
   The 100-Year Flood Deception ............................................................................................................... 30
   Seasonal Flooding ................................................................................................................................... 31
Subsidence and Sea Level Rise .................................................................................................................... 33
Human-Caused Global Warming Hyped by Green Billionaires ................................................................... 35
Canada’s CCCR2019 Advisory Team............................................................................................................ 36
Can Science Go Wrong? Does Science Change? ......................................................................................... 38
Climate Warms and Cools – We should Prepare for Either Reality ............................................................ 39
In Conclusion – Present Choices Matter ..................................................................................................... 41

                                  Cover Image: By NASA Goddard Space Flight Center - Flickr:
                                  Magnificent CME Erupts on the Sun - August 31, CC BY 2.0,
                                  https://commons.wikimedia.org/w/index.php?curid=21422679

                                  This is a plain language document, intended for the public and
                                  policy-makers. It includes references to peer-reviewed and non-
                                  peer reviewed academic material.

                                                                                                                                                  1|Page
CLIMATE CHANGE YOUR MIND.

Executive Summary
Environment and Climate Change Canada issued a report entitled “Canada’s Changing Climate
Report 2019” (CCCR2019) on April 2, 2019 which sparked headlines world-wide claiming that
Canada was warming ‘twice as fast as the global average temperature.’1 The report made
predictions of increased weather extremes such as flooding, wildfires and heatwaves, unless drastic
cuts to greenhouse gas emissions and the use of fossil fuels were implemented.
The report was issued a day after the very unpopular federal carbon tax policy was implemented
and as a constitutional court case began over the validity of a federally imposed carbon tax on the
provinces.
Friends of Science Society disputes the claims of the CCCR2019 as summarized here:
       1. NASA GISS Dec. 2019 temperature dataset shows that global temperatures have
          dropped by 0.5°Celsius in the past three years. The sun is presently entering a solar
          minimum, exhibiting very few sunspots. Historically, observations correlate this low solar
          activity to a time of cooling, such as that of the Little Ice Age (1250-1860AD).
       2. The risk of cooling to Canadians and to Canadian agriculture presents a far more
          serious challenge than the risk of warming.
       3. Despite a significant rise in carbon dioxide concentration, temperatures have
          flatlined for the past 20 years. The growing scientific consensus is that carbon dioxide is
          not the ‘knob’ that can fine tun climate, meaning carbon taxes and reduction measures will
          not fight climate change. Natural climate factors appear to be more influential.
       4. CCR2019 used a reference frame that began in a cooler solar minimum and ended in
          a higher temperature El Nino period – this would give a distorted appearance of much
          higher warming. Page 6 of the Executive Summary refers to “Changes are relative to the
          1986–2005 period.”
       5. Computer models (simulations) are useful for understanding how climate works, but
          inadequate for accurately predicting future climate. There are too many variables and
          unknowns. Physicist Freeman Dyson calls it ‘science fiction’ to use computer models for
          climate predictions. Climate models do not reflect the observations of satellite and weather
          balloon data and did not project the near 20-year hiatus in warming, with no statistically
          significant warming since 1997.
       6. Canada is a vast country of many regional climatic conditions; predicting climate
          change patterns 80 years from now is an exercise in magical thinking. Climate change
          is measured in periods of 30, 50, 100 and millennial timescales. Climate and weather
          patterns are subject to changes in humidity, winds, precipitation, cloud cover, cosmic ray
          influx and more. Changing human influences like increased population density, land use
          (agriculture, paving/building up cities), large-scale water diversion (James Bay dam, Site C
          dam) and other emissions from daily human and industrial activity also affect regional
          climates. On a wider scale, there are natural factors like black carbon/ash/soot (which
          affect Arctic warming/albedo) and other aerosols from wildfires, ash, gases and aerosols
          from volcanic eruptions, decomposition of biomass, and atmospheric oscillations such as El
          Nino, La Nina, Pacific Decadal (PDO), geothermal activity (below sea level), and changes in
          ocean currents. These can have amplifying or modifying effects on large regions of Canada.

1
    https://www.theguardian.com/world/2019/apr/02/canada-climate-change-warming-twice-as-fast-report

                                                                                                             2|Page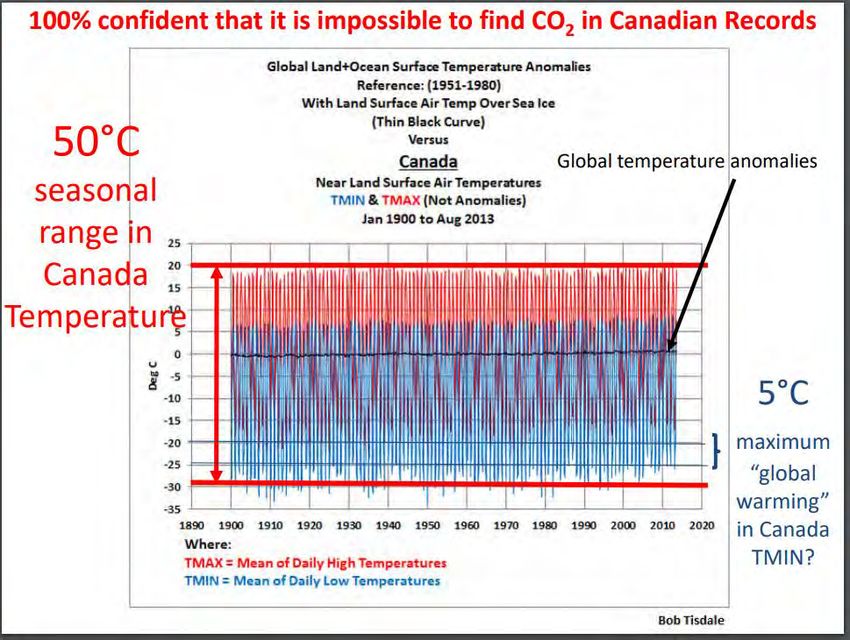
CLIMATE CHANGE YOUR MIND.

           Though some oscillations appear to have a regular cycle (PDO 60 years), others like El Nino,
           which can have global effects, are impossible to predict with any accuracy, nor can the
           length or scope of the impact be determined years in advance. A series of solar and cosmic
           cycles and planetary conjunctions also affect climate. How can carbon dioxide/greenhouse
           gas emissions be more influential than any one, or all of these?
     7.    The Intergovernmental Panel on Climate Change (IPCC) Special Report on Extreme
           Weather in 2012 stated that there is little evidence to support the claim that human
           influence on climate will lead to more extremes. It is curious that CCCR2019 comes to the
           opposite conclusion.
     8.    Most expert scientists in the field of climate reject the use of the Representative
           Concentration Pathway 8.5 (RCP8.5) high end model assessment as being completely
           unrealistic in terms of energy use. However, RCP 8.5 it is used throughout the report,
           frequently with bright ‘red-hot’ visuals.
     9.    Undue influence and content from contributors outside the field of physical sciences
           brings into question the quality of assessment. Reliance on the IPCC AR5 report does
           not reflect the reality of Canada’s unique geological and climatic conditions. Further, the
           AR5 report noted a then 15-year hiatus in global warming, which today reaches nearly 20
           years. The AR5 report weakened the case for human causation of warming, as Dr. Judith
           Curry testified to the US Senate on Jan. 16, 2014, also stating that the rapid rise in carbon
           dioxide (CO2) while temperatures flatlined indicated that:
           a) Carbon dioxide is not a control knob that can fine tune climate
           b) Reducing carbon dioxide emissions to stop global warming may prove to be futile
               in the face of natural variability (solar and ocean cycles and other natural factors
               being more influential).
     10.   Solar influence on Canada’s climate offers more robust evidence of the driver of climate
           change. Importantly, the CCCR2019 report failed to inform its Canadian readers that the
           IPCC climate models failed to correctly simulate the Northern Hemisphere snow cover
           extent for the past 50 to 100 years.
     11.   Since 2005, green billionaires have been funding ENGOs worldwide for millions of
           dollars a year to push the ‘climate catastrophe,’ ‘climate crisis,’ for their own vested
           interests in renewables, global cap and trade and carbon pricings. They have co-opted
           union pension funds and institutional investors to their ‘cause,’ thus skewing markets and
           policies.
     12.   Can so many scientists and government agencies be wrong? Yes, history shows us that
           science, especially when politicized, can go wrong based on faulty premises that cannot be
           questioned. A crucial example is that of Lysenkoism in the Soviet Union where faulty
           agricultural science became government policy. This diktat did not allow for scientific
           dissent on pain of excommunication, incarceration in a mental institute, or execution.2
           Following on his theories, in Maoist China, those ‘deniers’ and ‘right-leaning conservatives’
           who argued against the Great Leap Forward were ‘struggled’ into submission by their peers
           – lack of freedom of speech and scientific inquiry led to the deaths of ~36 million.

2
  https://www.forbes.com/sites/peterferrara/2013/04/28/the-disgraceful-episode-of-lysenkoism-brings-us-global-warming-
theory/#69a698e67ac8

                                                                                                                         3|Page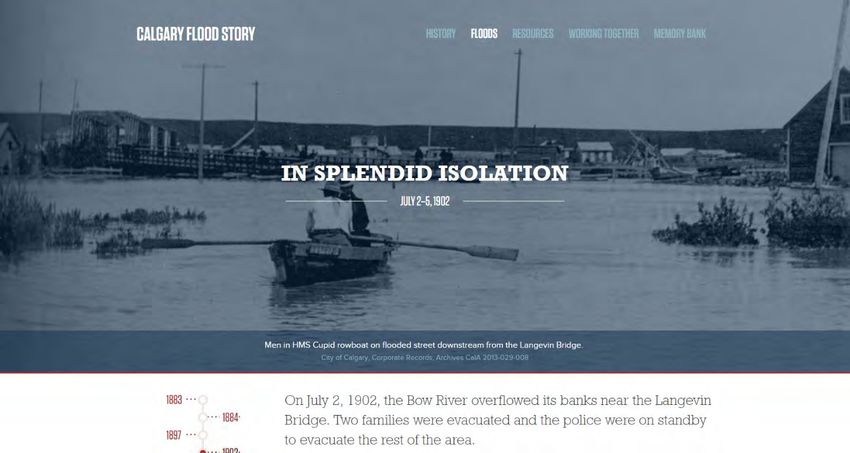
CLIMATE CHANGE YOUR MIND.

Climate Change Your Mind.
You’re Feeling Warmer. Aren’t you?

Responding to the Canadian government’s “Canada’s Changing Climate
Report” CCCR2019 – in Plain Language

The government of Canada issued
a comprehensive report with
future projections of Canada’s
changing climate on April 2, 2019.
The report caused great
consternation in the media and
frightened many people. The
report provided a collection of
headline statements, offered to
the media, including this one,
repeated ad nauseum in the
press:

“Both past and future
warming in Canada is, on
average, about double the
magnitude of global
warming.”       3

A quick search of the internet
reveals that headlines around the world, since 2010 make the same claim, but how can
every place in the world be warming faster than the average?4
Consequently, we find the report to be a compendium of a lot of work, but based on
questionable scientific premises and unsupported projections, which we will discuss in this
rebuttal.

3
  https://www.nrcan.gc.ca/sites/www.nrcan.gc.ca/files/energy/Climate-change/pdf/CCCR_HeadlineStatements-EN-033119-
FINAL.pdf
4 http://tomnelson.blogspot.com/2010/07/settled-science-can-everyplace-really.html

                                                                                                         4|Page
CLIMATE CHANGE YOUR MIND.

Temperatures and Precipitation Might Change Somewhere
Sometime.
Köppen Climate Types Exhibit Common Long-term Characteristics.

Source: By Adam Peterson - Own work, CC BY-SA 4.0, https://commons.wikimedia.org/w/index.php?curid=51168581

Canada is a vast country with distinctive regional climate patterns. The map above uses the
Köppen Climate Classification System. “It is the most widely used system for classifying
the world's climates. Its categories are based on the annual and monthly averages of
temperature and precipitation. The Köppen system recognizes five major climatic types;
each type is designated by a capital letter.” 5

5
    http://www.physicalgeography.net/fundamentals/7v.html

                                                                                                      5|Page
CLIMATE CHANGE YOUR MIND.

Within regions, there are other weather/climate phenomenon such as Chinook winds over
the Rockies into southern Alberta, amplifying or modifying effects of the Great Lakes on
regional conditions. Beyond natural seasonal phenomenon, certain longer-term
atmospheric oscillations, which occur in cyclical patterns – such as El Nino (ENSO), La Nina,
Pacific Decadal Oscillation (PDO), can strongly influence the propensity for natural events
like wildfire risk, drought patterns, precipitation, and coastal tidal events. However, none
of these outcomes or the oscillations are related to human-caused influence on climate.6

               Image shows various locations of various atmospheric oscillations.7

UN Climate Panel Rejects Extreme Weather-Human Attribution

It is curious that the Canadian federal government authors and contributors attribute
weather extremes to human causation because in 2012, the UN Intergovernmental Panel
on Climate Change issued a Special Report on Extreme Weather Risk (IPCC SREX). They
determined that there was little evidence to support the claim of human causation driving
extreme weather. Dr. Judith Curry summarised these findings in her testimony to the US
Senate in 2014, commenting on catastrophic climate claims made by then President Obama
in his Second Inaugural Address:
Obama:
Some may still deny the overwhelming judgment of science, but none can avoid the
devastating impact of raging fires and crippling drought and more powerful storms.
Curry:
This premise is not strongly supported by the scientific evidence:

6
 https://www.whoi.edu/know-your-ocean/ocean-topics/ocean-circulation/el-nio-other-oscillations/
7
 https://opensnow.com/news/post/how-el-nino-la-nina-and-the-pacific-decadal-oscillation-influence-snowfall-in-
the-united-states-unfortunately-it-s-complicated

                                                                                                   6|Page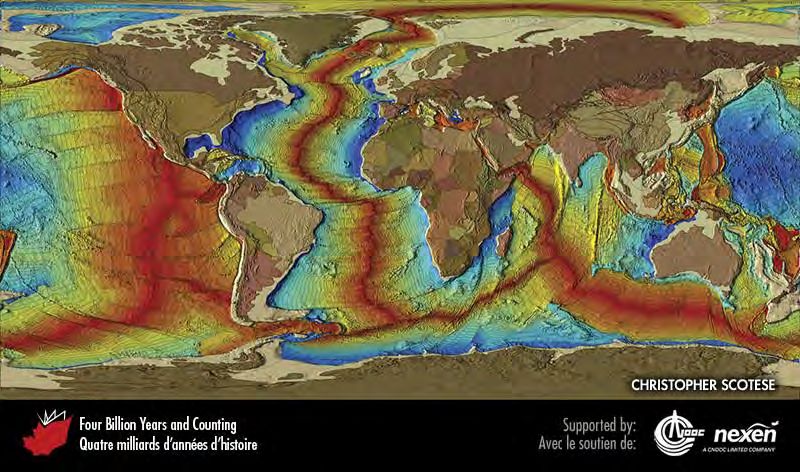
CLIMATE CHANGE YOUR MIND.

          • the science of climate change is not settled, and evidence reported by the IPCC AR5
          weakens the case for human factors dominating climate change in the 20th and early
          21st centuries
          • with the 15+ year hiatus in global warming, there is growing appreciation for the
          importance of natural climate variability
          • the IPCC AR5 and SREX find little evidence that supports an increase in most
          extreme weather events that can be attributed to humans, and weather extremes in
          the U.S. were generally worse in the 1930’s and 1950’s than in recent decades.
Not only is more research needed to clarify the sensitivity of climate to carbon dioxide and
understand the limitations of climate models, but more research is needed on solar
variability, sun-climate connections, natural internal climate variability and the climate
dynamics of extreme weather events.
It is extraordinary that a publication of the Canadian federal government should recite a
long list of possible shifts in weather patterns, claiming these predictions are ‘very likely’
when it is presently impossible to predict the weather for more than a few days hence, and
the world body on climate science rejects the notion of human causation of weather
extremes.

Climate Models – Not a Crystal Ball
“The climate model is a very good tool for understanding climate, but a very bad tool
for predicting climate”

“…the world is much more complicated
then the computer models. I have a good
friend in Princeton who is a computer
expert, Suki Manabe is his name. He is
Japanese but he lives here in Princeton.8
He did some of the first climate models on
carbon dioxide. And he always said from
the beginning “The climate model is a very
good tool for understanding climate, but a
very bad tool for predicting climate”. 9
-physicist Freeman Dyson,
Interview in “The Uncertainty Has Settled” documentary by Marijn Poels

8
    https://scholar.princeton.edu/manabe/home
9
 https://www.marijnpoels.com/single-post/2019/03/05/We-don%E2%80%99t-understand-climate-its-very-complicated-and-were-only-at-the-
beginning-to-understand-what-the-effects-may-be

                                                                                                                    7|Page
CLIMATE CHANGE YOUR MIND.

Climate ‘models’ are computer simulations. They are extremely complex mathematical formulas
that are run on supercomputers. The American Physical Society workshop of Jan. 8, 2014 10
discusses some of the aspects of who commissions these models, how they are structured, what
parameters they are based upon and what success or failure issues are inherent.
Models are ‘run’ with different parameters to see what different outcomes look like. In CCCR2019,
the authors refer to Representative Concentrated Pathways 2.6 and 8.5 (RCP 2.6 and RCP 8.5). You
can see on the graph below, there are two other intermediary representations – RCP 6.0 and RCP
4.5. The green dot in the middle of this image shows where the world sits at present (2017).
The RCP’s are based on different concentrations of fossil fuel use and emissions. RCP 8.5 is the
most extreme and least likely because it is based on a world operating on unmitigated expansion of
coal use. As Roger Pielke, Jr. points out in his article “Opening Up the Policy Envelope”11 it is the
least likely of scenarios, but the most frequently used in policy papers. Why?

         “Yet RCP 8.5 remains a scenario favored in most climate impacts studies published
         in the academic literature. One reason for this is obvious: because the scenario
         generates very high carbon dioxide emissions, the associated climate impacts
         projected in climate models can also be very large, and thus lend continued
         urgency to calls for emissions reductions, and supporting economic models that
         show very high costs of future climate change impacts.” [bold and underline added]
In other words, RCP 8.5 scenarios are used because they justify calls for rapid decarbonization
or high carbon taxes, even though RCP 8.5 is not representative of how the world operates

10
     https://www.aps.org/policy/statements/upload/climate-seminar-transcript.pdf
11
     https://issues.org/opening-up-the-climate-policy-envelope/

                                                                                              8|Page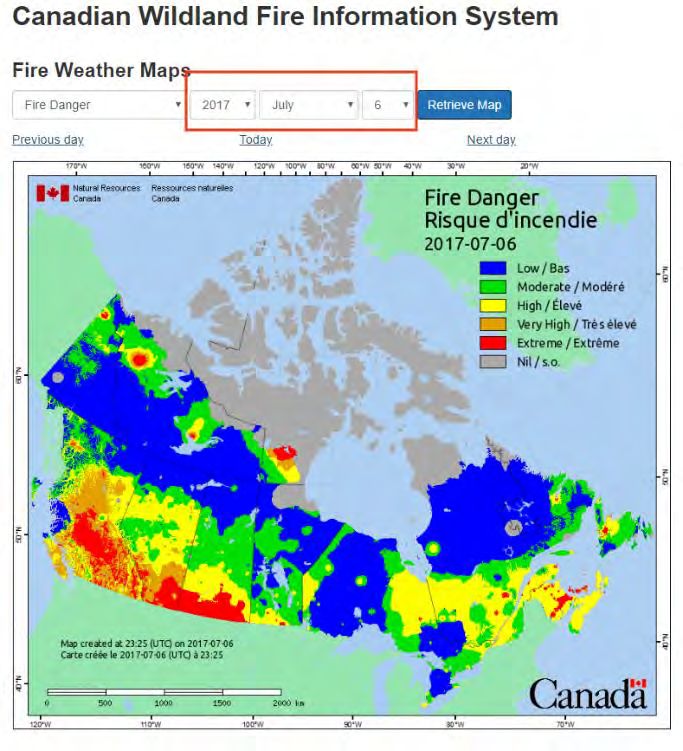
CLIMATE CHANGE YOUR MIND.

today or the type of fossil fuel use/emissions and is not representative of how the world will
operate tomorrow.
In other words, this report misleads the innocent public and the non-scientist policymaker.
Though coal continues to be used world-wide as an affordable, reliable, abundant source of
energy, new Ultra critical, Supercritical, High Efficiency/Low Emissions (HELE) plants reduce
noxious pollutants to a minimum. Near-market-ready technology exists that will extract
graphene directly from carbon emissions in the stack. Carbon Capture and Storage (CCS)
technology is advancing and Canada is a leader in sequestration technology.

Climate Models do not Reflect Observations

If we are to rely on climate models for setting policy, we should expect that the models closely
match observations. As you can see below, based on 102 model runs for the IPCC, the models
project significant warming; the reality is that both satellite data and thousands of weather balloon
records show that global warming has flatlined despite a significant rise in carbon dioxide
emissions from human industry. The models did not predict this ‘hiatus. The theory of
Anthropogenic Global Warming says carbon dioxide from human emissions drives warming – that
is the impetus for the efforts to implement carbon taxes or invent ways to restrict or mitigate
carbon dioxide emissions. The theory is flawed, as you can see below.

       Simplified version of chart from the US Senate testimony of Dr. John Christy, reproduced here (pg. 23)
               https://www.thegwpf.org/content/uploads/2017/03/Climate-Science-March20171.pdf

                                                                                                                9|Page
CLIMATE CHANGE YOUR MIND.
Rapid Decarbonization – Reality or Fantasy?
On page 139 of the CCCR2019, the authors write “Under a low emission scenario (RCP2.6),
annual mean warming in Canada stabilizes at about 1.8°C above the 1986–2005 reference period
after about 2050” implicitly suggesting that if Canada engages in a low emissions scenario,
warming would be only slightly over the much talked-about 1.5°Celsius scenario.
This suggestion fails to acknowledge the reality presented in the graph above, by US climate
policy analyst Roger Pielke, Jr. Nor does it acknowledge the reality of ever-growing emissions
from the developing world, primarily China and India.
• China is by far the largest emitter; in 2017, it constituted almost 28% of the world’s
emissions.
• Contrary to many public perceptions, the United States has reduced its emissions
considerably (i.e. by 793 Mt) over the decade.
• India surpassed Russia as an emitter during this period. Based on current trends, India
may surpass the United States by the middle of the next decade.
• Canada’s emissions from energy combustion in 2017 were listed by BP at 560 Mt,
which ranks tenth in the world according to BP’s data.
10 | P a g eCLIMATE CHANGE YOUR MIND.
• China’s emissions growth from 2007 to 2016 was 2,200 Mt, or 166 Mt per month. In
effect, the increases in China’s emissions every three and a half months exceeded
Canada’s total annual emissions in 2017.12 (ibid table below)
Consequently, even if Canada was to drastically cut emissions, if carbon dioxide was causing global
warming, such warming would continue unabated due to global emissions. Canada’s reductions
would be meaningless. They would certainly have no effect on our domestic climate.
Worse, extreme reductions in emissions in Canada would mean the destruction of our economy, as
explained by Robert Lyman, Ottawa energy policy consultant.
12
https://blog.friendsofscience.org/wp-content/uploads/2018/11/THE-WORLD-OF-CARBON-DIOXIDE-EMISSIONS-brief.pdf
11 | P a g eCLIMATE CHANGE YOUR MIND.
“How can we even begin to understand the magnitude of the changes being proposed? One way is to
look at the sources of energy consumption and related emissions today. In 2005, Canadian emissions
were 738 megatonnes of carbon dioxide equivalent. In 2014, after six years of the worst recession since
the Great Depression, Canadians emitted less, 722 megatonnes. Twenty-six per cent of those emissions
were from oil and gas production, 23 per cent were from transportation, and roughly equal portions of
around 10 per cent were from electricity generation, buildings, industry and agriculture, with waste
and other sources making up a residual 7 per cent. Assuming that emissions do not grow one bit over
the next 32 years as a result of increased economic activity or increased population, achieving a 50 per
cent emissions reduction from 2005 levels would mean reducing emissions to 369 megatonnes CO2
equivalent. That is comparable to completely eliminating the current emissions from oil and gas
production, electricity generation, and all emissions-intensive industries like mining, petrochemicals,
auto and parts manufacturing, iron, steel and cement. Gone. Achieving the aspirational goal of 80 per
cent reduction recommended by the IPCC would mean reducing emissions to 147 megatonnes CO2
equivalent. That would be comparable to reducing Canada’s per capita emissions and our
energy economy to the current levels of Bolivia, Sudan or Iraq.” 13
These countries feature much milder
conditions than Canada, where winter
storms make fossil fuels use a necessity.
Bolivia
Sudan
Iraq
13
http://blog.friendsofscience.org/2017/05/10/can-canada-survive-climate-change-policy/
12 | P a g eCLIMATE CHANGE YOUR MIND.
What Causes Climate Change?
NASA Goddard Space Flight Center - Flickr: Magnificent CME Erupts on the Sun - August 3114
On August 31, 2012 a long filament of solar material that had been hovering in the sun's atmosphere, the corona, erupted
out into space at 4:36 p.m. EDT. The coronal mass ejection, or CME, traveled at over 900 miles per second. The CME did
not travel directly toward Earth, but did connect with Earth's magnetic environment, or magnetosphere, causing aurora
to appear on the night of Monday, September 3. Pictured here is a lighten blended version of the 304 and 171 angstrom
wavelengths taken from the Solar Dynamics Observatory. Cropped
The Sun is responsible for earth’s climate. Though we are far from the Sun, its influence is great.
14
By NASA Goddard Space Flight Center - Flickr: Magnificent CME Erupts on the Sun - August 31, CC BY 2.0,
https://commons.wikimedia.org/w/index.php?curid=21422679
13 | P a g eCLIMATE CHANGE YOUR MIND.
Source: http://www.nap.edu/catalog/18974/solar-and-space-physics-a-science-for-a-technological-society
The Sun drives earth’s climate system, affecting all the factors above, directly and indirectly. Earth
also has its own internal variabilities such as tectonic plate movements, volcanos, cyclical patterns
of ocean currents and changing geomagnetism. Of the factors above, human industrial emissions
only affect atmospheric composition. Humans do have an influence on climate, but this image
should set the perspective on where our influence lies.
Likewise, humans do affect climate, mostly regionally, through land use, water diversion,
agriculture, deforestation and urban centres (Urban Heat Island-UHI). Humans certainly affect the
environment as well, through waste water release, industrial activity, groundwater withdrawals.
We know how to address most environmental matters to mitigate human impact. We can treat
waste water and sewage, we have excellent forest management and reclamation skills, especially in
Canada. We have emissions reductions technology to reduce noxious emissions. Focussing on
mitigating human impact and solving real world problems world-wide would be a far better use of
limited tax dollars, than chasing the carbon dioxide molecule.
14 | P a g eCLIMATE CHANGE YOUR MIND.
100% Confident that CO2 Influence is not Seen in Canadian
Temperature Records
Excerpt of Dr. Willie Soon’s presentation at Friends of Science Society’s “Polar Bears and Solar Flares” event April 10, 2019.
Canada has a seasonal range from cold to warm temperatures of 50°Celsius in the near land surface
air temperature record. Using the recorded daily temperature minimums (TMIN) and maximums
(TMAX) from 1900 to 2013 results in the red and blue colored graph above. A black line in the
middle range shows the global temperature anomaly, indicating a tiny rise. At the bottom of the
scale in the blue, it is clear there is a reduction in minimum temperatures (meaning overall it is less
cold during coldest periods) of about 5°Celsius, but this is at the coldest end of the scale. There is
no corresponding rise in the temperature maximum (which would mean hotter during the hottest
times), which one is led to believe from the CCCR2019 report.
If carbon dioxide (CO2) was causing warming, it should have been visible in an increasing daytime
maximum high, but there is no evidence of it.
Dr. Soon’s presentation on April 10, 2019, “The Sun Also Warms” referenced this peer-reviewed
paper: https://www.mdpi.com/2076-3263/9/3/135
15 | P a g eCLIMATE CHANGE YOUR MIND.
The IPCC dismisses solar variation as the driver of climate, but the IPCC’s mandate is to focus on
human causation. The IPCC cadre of scientists includes no geologists15 and at one point, included
only one solar physicist, citing her own co-authored paper.16 The following graphs use temperature
data from the Berkeley Earth Surface Temperature (BEST) dataset.
In science, it is true that correlation does not prove causation, but there is certainly a closer parallel
between solar irradiance and temperature change in Canada, than there is between carbon dioxide
emissions.
15
https://blog.friendsofscience.org/2019/04/27/intergovernmental-panel-on-climate-change-ipcc-next-report-ar6-due-2022-
%E2%88%92-again-no-geologists/
16 https://motls.blogspot.com/2010/06/judithgate-ipcc-relied-on-one-solar.html
16 | P a g eCLIMATE CHANGE YOUR MIND.
The black brackets [ ]
frame a reference
period used in the
CCCR2019 report. This
period begins in 1986
in cool solar minimum
and ends in 2005
during a hot El Nino
period. Solar
minimums are natural
solar cycle periods; El
Nino is a natural
atmospheric
oscillation. Using this
period as a reference
would give unfairly
skewed results,
leading to a
conclusion that
Canada is warming
‘twice as fast as the
global average’.
As is shown on this graph, the CCCR2019 report uses 1948 as a reference point, a time when
temperatures dropped significantly. This means that referring to this low period as a starting point,
would give a skewed comparison. Even more dramatic is another referenced period from 1986 to
2005 (shown in black brackets [ ]) 2005 was an El Nino year, where naturally-caused high
temperatures were recorded. This would give a false impression that Canada is ‘warming faster
than the rest of the world.’
Despite a
consistent rise in
carbon dioxide
concentration,
temperatures have
flatlined since
about 2002.
Source data from main datasets, via Prof. Ole Humlum’s site “Climate4You.”
17 | P a g eCLIMATE CHANGE YOUR MIND.
As seen in the graph (previous page) of all five major datasets, since 2002, temperatures have
flatlined, despite a significant rise in carbon dioxide (CO2), shown by the upper squiggly line in the
graph on the previous page. The squiggles represent the seasonal rise in carbon dioxide during
winter, when the great plains and forests are covered by snow, and the uptake of carbon dioxide by
plants through spring and summer.
Source: Screenshot from NASA CO2 modelling, red representing CO2 concentration in April 2006.
Source: Screenshot from NASA CO2 modelling, red turns to flat gray as CO2 concentration is all taken up by August by the
massive boreal forests and large agricultural lands across the plains and the steppes of the Ukraine and Russia.
Euan Mearns on carbon cycle: http://euanmearns.com/the-carbon-cycle-a-geologists-view/
18 | P a g eCLIMATE CHANGE YOUR MIND.
Heat Waves, Drought and Other Extremes Unrelated to CO2
Source: http://spacing.ca/toronto/2016/07/09/80th-anniversary-torontos-worst-heatwave/
The hottest temperatures recorded in Canada were in the 1930’s. In 1936, Toronto’s temperatures
reached 40°C in the shade. Desperately hot, people flocked to the beach and slept on the grass in
public parks at night. The IPCC dates human-caused global warming from 1950.
In his 2018 presentation to Friends of Science Society’s “Extreme Climate Uncertainty” event,17 Dr.
Madhav Khandekar showed the audience that extreme weather events are integral to climate and
unrelated to carbon dioxide concentration.
In a video interview, Dr. Khandekar discusses the heat wave of 1936, and also explains that people
live in very hot climates around the world, and they adjust their daily activities accordingly.18
Most people prefer to spend their vacations in warm climates. Much
of the world’s population lives in hot climates.
Dr. John Harper, FGSA, FGAC, PGeol., former director of the
Geological Survey of Canada, explained in his 2016 presentation
“From Ice Age to Nice Age to Dry Age and Back: 600 million years of
Climate Change” that earth’s temperatures have naturally fluctuated
from minus 70°C to plus 70°C for reasons beyond our control. 19
The Okotoks “Big Rock”, sacred to the Blackfoot Nation, was once
under 2 miles of glacial ice. By Coaxial at English Wikipedia, CC BY 3.0,
https://commons.wikimedia.org/w/index.php?curid=
7753012
17
https://friendsofscience.org/index.php?id=2369
18 https://youtu.be/OhM5Qid6lh4
19
https://youtu.be/O-mMpGBxPwI
19 | P a g eCLIMATE CHANGE YOUR MIND.
Fort McMurray Wildfires – Human Causation and Lack of
Preparation
CCCR2019 makes the astonishing claim that the catastrophic Fort McMurray wildfire was due to
Anthropogenic Global Warming, referencing a peer-reviewed study based on modelling. However,
based on evidence, the fire weather index risk map of the 30-year mean shown above (May 2018)
shows no increasing trends.
Compare this with the wildfire risk map on May 4th, 2016, when the Fort McMurray wildfire took off
out of control (see below).
20 | P a g eCLIMATE CHANGE YOUR MIND.
The fire danger map of May 4, 2016 showed an extremely high risk across almost all of Alberta and
Saskatchewan.
Following the 2011 Slave Lake fire, caused by arsonists, the Province of Alberta had conducted a
thorough study and issued the “Flat Top Fire Complex Review.”20 Findings in the report noted that
due to the forest life cycle, the Alberta boreal forest was at risk of major fires due to aging conifers.
Old, dry, or dying conifers are ideal for ‘laddering’ – where fire can quickly climb up to the crown,
consuming the dry kindling-quality branches, and from there sparks and flames easily spread,
especially in windy conditions. Though most people think of wildfire as a summer and fall event
when it is hot, there are many wildfires in the early spring between snow melt and spring rain
when the ground is dry with little green vegetation. The 2012 Flat Top Review had recommended
that all wildfire crews and contractors be staffed and in place by April 15th, to be prepared for that
interim period.
20
https://wildfire.alberta.ca/resources/reviews/documents/FlatTopComplex-WildfireReviewCommittee-A-May18-2012.pdf
21 | P a g eCLIMATE CHANGE YOUR MIND.
In 2015, the new Alberta NDP government had cut water bomber contracts21 as a cost-saving
measure. It is unclear whether wildfire crews were in place by April 15, 2016 in Alberta. The
Canadian Interagency Forest Fire Centre, Inc. (CIFFC) situation report of May 4th, 2016, showed that
there were 17 wildfires in Alberta, all human caused.22 Two were out of control (OC); 29 under
control (UC).
There were exacerbating weather conditions over the winter of 2016. “Despite the warming effects
of El Nino that year, and confusingly, winter conditions were exacerbated by a cold and dry polar
front and jet stream23 which created perfect conditions for curing wood.”24
21 https://edmontonjournal.com/news/local-news/alberta-cuts-nearly-15-million-from-wildfire-management-budget
22 ‘HUM” Human caused can also mean any form of human-wildland interface such as a power line sparking a branch, negligent
campfire management, arson, or spark from ATV/off-road-bike exhaust, etc. https://globalnews.ca/news/2762002/rcmp-say-
fort-mcmurray-wildfire-likely-result-of-human-activity-investigate-if-blaze-was-criminal/
23 https://www.theweathernetwork.com/news/articles/polar-vortex-demystified-bitter-cold-next-week-in-canada/75743
24 https://papers.ssrn.com/sol3/papers.cfm?abstract_id=2929576
22 | P a g eCLIMATE CHANGE YOUR MIND.
British Columbia experienced a rash of wildfires in the summer of 2017.
Under extremely high fire risk conditions in BC in the month of July 2017, as shown in the map
below, we find that about half the fires were started by lightning and half by humans on July 16,
2017 according to the CIFFC situation report above.
23 | P a g eCLIMATE CHANGE YOUR MIND.
CIFFC stats show that the wildfire area burned in
Canada continues to decline.
The CCCR2019 report claims that catastrophic wildfires due to human-caused global warming are
on the rise in Canada and reference the British Columbia 2017 and 2018 wildfire season as
examples. As shown above, the 2017 BC wildfire season was marked by unusually hot, dry
weather, lightning strikes, several arsonists and negligent people. However, the ratio of area
burned is more correlated to the vast amount of deadwood due to pine-beetle infestations.25 In
2018, the press reported that humans were responsible for starting over 400 wildfires in BC.26 The
fire danger map shown to the left for Aug. 27, 2018, shows BC at an
elevated to extreme risk of wildfire, but in the rest of Canada, the risk
was very low. Overall in Canada, the Canadian Interagency Forest Fire
Centre shows there is a decline in hectares burned.27 The largest
wildfire in North America was the Chinchaga Firestorm of 1950, the
smoke pall for which was seen around the world.28 This contradicts
the notion that human-caused climate change is driving wildfires in
Canada. The only human causation seems to be criminal or negligent
in nature.
25
https://blog.friendsofscience.org/2017/09/21/bc-wildfires-human-caused-climate-change-or-pine-beetles-and-a-dry-year/
26 https://nationalpost.com/news/canada/humans-responsible-for-more-than-400-b-c-wildfires-so-far-this-season
27 https://ciffc-uat.yellowdev.net/fire-information/wildfire-graphs
28 https://www.uap.ualberta.ca/titles/194-9781772120035-chinchaga-firestorm
24 | P a g eCLIMATE CHANGE YOUR MIND.
Sea Ice Variability and Polar Bear Survival
Image licensed from Shutterstock. Gajewski, K (2015)- Illustration of Holocene Optimum and location of pollens
Fig. 1. Map of the Canadian Arctic showing location of pollen diagrams used in this study. For references, see Table 1.
Boxes enclose sites used to compute regional averages. The areas used to compute regional averages in Boreal Canada
(Viau and Gajewski, 2009) and Eastern Beringia (Viau et al., 2008) are indicated. The map of the Arctic vegetation is
generalized from CAVM Project Members (2003) and Brandt (2009).
CCCR2019 focuses attention on arctic regions, sea ice variability, permafrost melt due to warmer
northern temperatures, and implications for northern First Nations residents and regional wildlife.
Northern regions are experiencing slightly warmer temperatures, some of which can be attributed
to the distribution of black soot from human industrial activity, wildfires29 and volcanoes which
‘blackens’ the snow and increases the absorption of heat from the sun, rather than reflecting the
heat.
It should be noted that arctic warming is a known, natural phenomenon, which occurs for various
reasons. During the Holocene Optimum (Hypsithermal) 30 31 of some 6-8,000 years ago
temperatures across the north ranged from 1°C to 7.8°C higher than today. Polar bears and most
contemporary northern wildlife survived this balmy period. Scientific evidence indicates the arctic
was ice-free. Polar bear researcher and writer, Dr. Susan Crockford, presented evidence at Friends
of Science Society’s “Polar Bears and Solar Flares” event of April 10, 2019, that polar bear
populations have increased in recent years, despite low fluctuations in sea ice, and indeed, in some
places, they now are so populous and bold that they threaten the lives local northern residents.32 33
29
http://pcl.physics.uwo.ca/publications/files/Bulletin%20of%20the%20American%20Meteorological%20Society%202010%20Fromm.pdf
30
https://www.sciencedirect.com/science/article/pii/S0921818115000417 Gajewski, K (2015)
https://doi.org/10.1016/j.gloplacha.2015.02.003
31
https://tambonthongchai.com/2018/08/20/the-holocene-optimum-period-a-bibliography/ (list of Holocene Optimum peer-reviewed
references)
32 https://friendsofscience.org/index.php?id=2446
33
https://www.macleans.ca/to-kill-polar-bear/
25 | P a g eCLIMATE CHANGE YOUR MIND.
Sea ice is quite variable because the Arctic is an ocean, (unlike Antarctica, which is a snow/ice
covered land mass). The Arctic is an ice pack floating on top of ever shifting warm and cold
currents. In 1906, Roald Amundsen sailed the North West Passage in a wooden boat; in 1942 the
RCMP did the same in the St. Roche. These were cyclical ice-free/reduced ice periods that occurred
long before human emissions were deemed to be affecting climate change or arctic sea ice melt.
Alaska, United States
Russia
Northern
Canadian
Islands
Ellesmere
Island, Canada
Greenland
Russia
Norway
In the image above, The Norwegian Polar Institute illustrates warm and cold currents flowing in
and out of the Arctic sea.34 “The paths of ocean currents in the Arctic. The Gulf Stream, carrying
warm Atlantic water, moves northwards along the coast of Norway. It divides into two main
branches and continues northwards with one branch on either side of Svalbard. In the Arctic Ocean,
the Atlantic water is cooled, becomes heavier and sinks. After circulating in the North Polar Basin,
34
http://www.arcticsystem.no/en/outsideworld/oceancurrents/ (country names added to map for clarity)
26 | P a g eCLIMATE CHANGE YOUR MIND.
the now cold, Arctic water leaves the Arctic Ocean, mainly through the Fram Strait between
Svalbard and Greenland.”
They go on to explain: “The sunlight goes some way towards heating the Arctic but heat also
comes from the south with ocean currents and airstreams. [underline added] One branch of the Gulf
Stream, called the North Atlantic Current, flows along the coast of Norway and continues all the way
to the Arctic Ocean. There it shifts its name to the West Spitsbergen Current, and almost 60 % of the
water entering the Arctic Ocean comes with this. Even though the currents change their name as
they move north, they are all part of the same system, which is an extension of the Gulf Stream.
However, some water also flows in through the Bering Strait and some fresh water enters from the
big Russian and Canadian rivers, which explains why the topmost 45 metres of the Arctic Ocean are
less saline than the water below.”
This would appear to be a more viable explanation for changing sea ice and regional warming, than
warming due to the alleged effect of carbon dioxide warming the atmosphere by perhaps a degree.
Considering grade school science, one recalls that heat rises.
Geothermal Activity – A Forgotten Factor in Sea Ice Variability
Prof. Wyss Yim explains that below the ocean surface – ‘submarine’ – volcanic activity can have a
significant effect on Arctic sea ice variability and can also exacerbate an El Nino.
27 | P a g eCLIMATE CHANGE YOUR MIND.
“In the northern Atlantic Ocean from October 201135 to March 2012, an entirely submarine eruption
occurred off El Hierro Island in the Canary archipelago. The eruption timing was between mid-autumn
to early spring in the northern hemisphere generating warmer sea water than normal and causing the
lowest Arctic sea ice on record in September 2012. In the northern Pacific Ocean from March 2013, an
initially submarine eruption occurred of Nishino-shima Island 940 km south of Tokyo.36 In November
2013, a new volcanic island was formed and both submarine and sub-aerial activities continued until
August 2015. This ‘long’ lasting eruption provided an explanation for the northern Pacific Blob37
which puzzled many scientists who were unaware of the connection with submarine volcanism. The
appearance of warmer seawater than normal on the surface of the north Pacific Ocean led to the
development of strong El Niño conditions during 2014 to 2015 providing an explanation for the
continuous and gradual Arctic sea ice retreat observed during September 2014, September 2015 and
September 2016. The natural release of geothermal heat into the northern hemisphere portions of the
Atlantic Ocean and Pacific Ocean was therefore responsible for the two episodes of major Arctic sea ice
retreat during the last decade. An improvement in the future monitoring of submarine volcanic
activity is needed to provide a better understanding of polar sea ice variability.”38
In his book, “Heaven and Earth,” Dr. Ian Plimer points out that there are thousands of subliminal
active geothermal regions and volcanic eruptions taking place deep in the ocean, that are poorly
documented. These can affect sea temperatures as well as carbon dioxide emissions and ice melt.
Geothermal activity is an important factor in Antarctic ice melt as well39 and the existence of
massive glacial lakes, like Lake Vostok, some 4,000 meters below the ice pack.40
A carbon tax will not reduce the power of Mother Nature.
Additional insights:
AGU Underwater volcano eruption observed off the coast of El Hierro:
https://youtu.be/UaWYfd-hUII
We All Nearly Missed The Largest Underwater Volcano Eruption Ever Recorded
https://www.sciencealert.com/almost-nobody-noticed-largest-underwater-volcano-eruption-ever-
recorded-havre-seamount
35 https://earthobservatory.nasa.gov/images/76229/el-hierro-submarine-eruption
36 https://volcano.si.edu/volcano.cfm?vn=284096
37 https://news.nationalgeographic.com/2017/02/space-map-pacific-blob/
38 https://blog.friendsofscience.org/wp-content/uploads/2018/12/ImpEng2018S-geothermal-ocean-heat.pdf
39 https://www.bbc.com/news/science-environment-41972297
40 http://earthsci.org/education/lake_vostok/vostok.html Plain language resources on Lake Vostok
28 | P a g eCLIMATE CHANGE YOUR MIND.
Floods
CCCR2019 highlights the catastrophic southern Alberta/City of Calgary flood of 2013 as ‘probably’
caused by Anthropogenic Global Warming. This claim ignores the evidence that Calgary had eight of
its worst floods prior to 1933. Had the CCCR2019 panel looked at the Calgary Public Library
website or visited the Glenbow Museum, they could have seen the evidence for themselves.
In 1879 and 1897, the peak flows were much greater than that of the 2013 flood.41 According to
Chris Scott, Chief Meteorologist for The Weather Network, computer models accurately predicted
the rainfall, but cannot predict the hydrological effect or run-off patterns. Anomalous, but not
unknown, meteorological phenomenon exacerbated the outcome of the massive rainfall.
The key factors that led to the tremendous rainfall in Alberta can be summarized as follows:
1. An upside-down or ‘blocked’ jet stream pattern across western
North America
2. A strong area of low pressure that developed and got stuck near
southern Alberta because of the jet
stream pattern.
3. A moist channel of air from the Gulf of
Mexico that was pulled up by the low-
pressure system and slammed up
against the foothills and Rocky
Mountains.42
41
https://www.theweathernetwork.com/news/articles/calgary-floods-it-could-happen-again/8295
42 https://www.theweathernetwork.com/news/articles/alberta-floods-why-is-there-so-much-rain/8124/
29 | P a g eCLIMATE CHANGE YOUR MIND.
City of Calgary police photo of downtown Calgary during 2013 flood, sourced from twitter.
The 100-Year Flood Deception
Pundits and ordinary citizens often hear the term “100-year flood” or “500-year flood” and
naturally assume this means such an event is deemed to only happen every 100 or 500 years. Thus,
false conclusions are drawn, and very poor public policy is made, based on the assumption that
there’s no need to plan mitigation because nothing will happen for a century.
In fact, a 100-year flood could happen every year in succession. The USGS has a very good
explanation of how this technical term used by hydrologists has become misinterpreted by the
general public and media pundits.43
“In the 1960's, the United States government decided to use the 1-percent annual exceedance
probability (AEP) flood as the basis for the National Flood Insurance Program. The 1-percent AEP
flood was thought to be a fair balance between protecting the public and overly stringent regulation.
Because the 1-percent AEP flood has a 1 in 100 chance of being equaled or exceeded in any 1 year, and
it has an average recurrence interval of 100 years, it often is referred to as the "100-year flood".”
“…The 1-percent AEP flood has a 1-percent chance of occurring in any given year; however, during the
span of a 30-year mortgage, a home in the 1-percent AEP (100-year) floodplain has a 26-percent
43
https://www.usgs.gov/special-topic/water-science-school/science/floods-and-recurrence-intervals
30 | P a g eCLIMATE CHANGE YOUR MIND.
chance of being flooded at least once during those 30 years! The value of 26-percent is based on
probability theory that accounts for each of the 30 years having a 1-percent chance of flooding.”
In addition to the reality that anything built on a known flood plain is likely to be flooded at some
point, Robert Muir, P. Eng. has done excellent work showing how the changes in land use in urban
setting, especially paving over previously open land (where flood water flows would be absorbed,
held or redirected, thus mitigating some flood impacts), most cities have paved or cemented all
available surfaces, exacerbating urban flooding dramatically.44 Storm intensity is not increasing,
according to Muir’s work.45 He challenged the Insurance Bureau of Canada and forced CBC to
retract catastrophic claims about flooding and climate change.46
In general, the paving of surfaces increases overland flooding risk in urban areas, particularly
where there are old storm sewers that were designed for low population density, in a time when
other wetlands, streams or natural ponds would uptake a lot of the typical rainfall or run-off.
Most cities are built on paved over wetlands and people have preferred to settle near water bodies
– in the past for access to water for daily needs and easy transportation of goods; in the present,
because of the peaceful, natural views ‘on the riverside.’ This means people are either building on
known flood plains or exacerbating flood risk by building on wetlands.
McKernan Lake was a popular, shallow lake in Edmonton until 1948 when it was drained and infilled to allow for a new
suburb. The ghost of the lake still appears on flood risk maps for the City of Edmonton. 47
Seasonal Flooding
At the time of writing this report, Eastern Canada is facing serious flooding and politicians are
falling over themselves to claim, “this is the new normal, this is climate change.” 48
In Gatineau, Quebec, April 24, 2019, Prime Minister Trudeau, “…accompanied by Gatineau Mayor
Maxime Pedneaud-Jobin, said Canadians must face a “new reality” that the effects of climate change
mean that events such as spring flooding “will be happening more and more frequently.”
44
https://www.slideshare.net/RobertMuir3/infrastructure-resiliency-and-adaptation-for-climate-change-and-todays-
extremes?next_slideshow=1
45 https://www.slideshare.net/RobertMuir3/storm-intensity-not-increasing-factual-review-of-engineering-datasets
46 https://business.financialpost.com/opinion/hyped-up-misleading-insurance-myths-about-severe-weather-flooding-distract-
us-from-real-problems
47 https://edmontonjournal.com/news/local-news/understanding-flash-floods-in-five-edmonton-neighbourhoods
48 https://ottawacitizen.com/news/local-news/rainfall-overnight-causes-more-street-closures-throughout-gatineau-as-water-
levels-continue-to-swell
31 | P a g eCLIMATE CHANGE YOUR MIND.
In fact, no evidence supports such a claim.
As Dr. Madhav Khandekar, former WMO regional expert, past Environment Canada research
scientist of 40 years, past IPCC expert reviewer, peer-reviewer and author of more than 150 peer-
reviewed papers says in this video,49 seasonal flooding in Canada is typically a combination of early
warm temperatures over heavy snowpack and ice jams on rivers. If there are warm temperatures
while the snowpack is still firm, the water rapidly pools and there is no open land to absorb the
run-off. The flood waters often back-up, exacerbated by ice jams on rivers. This is a common
occurrence throughout history, and little seems to be done by residents or municipalities to
prepare for this reality. Since so many homes are on potential flood plains in Canada, shouldn’t
building standards reflect this fact and municipalities require that new homes be elevated to
mitigate potential damage?
Serious flooding and mudslides occur in BC in some places during spring run-off, as Dr. Khandekar
explains, often because some areas have suffered wildfires that have stripped the land of vegetation
or barriers that would normally slow or reduce the flow or accumulation of spring meltwater. As
we have previously shown, the wildfires are unrelated to human-caused climate change and neither
are these floods and mudslides.
49
https://youtu.be/lztpZdu4Nns
32 | P a g eCLIMATE CHANGE YOUR MIND.
Subsidence and Sea Level Rise
https://earthsciencesociety.com/2014/12/10/four-billion-years-and-counting-canada-is-as-old-as-the-earth-and-this-book-tells-all/
We live on an active planet; tectonic plate movement affects many more fragile regions of the
world, such as the ‘ring of fire’ of the Pacific Ocean. The red lines in the above image show where
tectonic plates meet; these are regions of geothermal activity.
However much of Canada is quite stable. In fact, due to the melting
of the ice age glaciers, much of Canada’s land is in the process of
isostatic rebound – a subtle, slow rise as the earth rebounds from the
tremendous pressure of the kilometers of ice that once overlay our
country.
CCCR2019 presumes that sea level rise from melting Greenland or
Antarctic ice sheets will cause sea level rise issues to certain coastal Natural Resources Canada map shows
regional uplift or subsidence.
areas in Canada, but this is not a foregone conclusion.
Even if large masses of Greenland were to melt, the interior of Greenland is shaped as a bowl that
would retain much of the meltwater.50
According to astrophysicist Dr. Nir Shaviv, the sun raises the seas through its constant warming.51
As the oceans warm, the water expands. It’s not carbon dioxide that drives this warming and
expansion. It’s the sun.
50
Maria Assunção Araújo - Porto Basic Climate Science Conference 2018 Day 2, presentation #12.
https://www.portoconference2018.org/presentations.html
51 https://business.financialpost.com/opinion/carbon-week-the-sun-raises-the-seas
33 | P a g eCLIMATE CHANGE YOUR MIND.
Permafrost occurs when the ground remains at or below a temperature of 0°C for a minimum period of two years. Permafrost
occurs not only at high latitudes but also at high altitudes. Almost all the soil moisture in permafrost occurs in the form of
ground ice. Permafrost underlies about half of Canada’s landmass, as well as areas of the seabed in the western Arctic and is
also believed to exist beneath the channels of the Arctic Islands.
Source: https://www.nrcan.gc.ca/earth-sciences/geography/atlas-canada/selected-thematic-maps/16876
As CCCR2019 notes, many northern regions of Canada are facing challenges due to permafrost melt
and some communities face eroding coastlines. This may be seen as sea level rise, but it is due to
subsidence or erosion, neither of which are related to human-caused global warming. In previous
generations, northern residents were nomads, their ancestors simply moved camp to the most
advantageous place for fishing, hunting or seasonal camping. Rather than proposing greenhouse
gas emission targets, perhaps a more practical thing would be to design housing for northern
communities that can be relocated. As more and more permafrost melts, more carbon dioxide and
more methane will be released, however, a carbon tax will not stop that from happening. These are
natural cycles. We must adapt.
34 | P a g eYou can also read