THE CONSERVATION STATUS OF MARINE BIODIVERSITY OF THE WESTERN INDIAN OCEAN - IUCN Portal
←
→
Page content transcription
If your browser does not render page correctly, please read the page content below
THE CONSERVATION STATUS OF MARINE
BIODIVERSITY OF THE WESTERN INDIAN
OCEAN
R. Bullock, G. Ralph, E. Stump, F. Al Abdali, J. Al Asfoor, B. Al Buwaiqi, A. Al Kindi, A. Ambuali,
T. Birge, P. Borsa, F. Di Dario, B. Everett, S. Fennessy, C. Fonseca, C. Gorman, A. Govender,
H. Ho, W. Holleman, N. Jiddawi, M. Khan, H. Larson, C. Linardich, P. Matiku, K. Matsuura,
C. Maunde, H. Motomura, T. Munroe, R. Nair, C. Obota, B. Polidoro, B. Russell, S. Shaheen,
Y. Sithole, W. Smith-Vaniz, F. Uiblein, S. Weerts, A. Williams, S. Yahya, K. Carpenter

                                                                                                      INDIAN OCEAN
                                                                                                        WESTERN

The IUCN Red List of Threatened SpeciesTM - Regional Assessment
About IUCN
IUCN is a membership Union uniquely composed of both government and civil society organisations. It
provides public, private and non-governmental organisations with the knowledge and tools that enable human
progress, economic development and nature conservation to take place together. Created in 1948, IUCN
is now the world’s largest and most diverse environmental network, harnessing the knowledge, resources
and reach of 1,400 Member organisations and some 15,000 experts. It is a leading provider of conservation
data, assessments and analysis. Its broad membership enables IUCN to fill the role of incubator and trusted
repository of best practices, tools and international standards. IUCN provides a neutral space in which diverse
stakeholders including governments, NGOs, scientists, businesses, local communities, indigenous peoples’
organisations and others can work together to forge and implement solutions to environmental challenges and
achieve sustainable development.
Working with many partners and supporters, IUCN implements a large and diverse portfolio of conservation
projects worldwide. Combining the latest science with the traditional knowledge of local communities, these
projects work to reverse habitat loss, restore ecosystems and improve people’s well-being.
www.iucn.org
https://twitter.com/IUCN/

IUCN – The Species Survival Commission
With over 8,000 members, the Species Survival Commission (SSC) is the largest of the six expert commissions
of IUCN and enables IUCN to influence, encourage and assist societies to conserve biodiversity by building
knowledge on the status and threats to species, providing advice, developing policies and guidelines,
facilitating conservation planning, and catalysing conservation action.
Members of SSC belong to one or more of the 140 Specialist Groups, Red List Authorities, Task Forces and
Conservation Committees, each focusing on a taxonomic group (plants, fungi, mammals, birds, reptiles,
amphibians, fishes and invertebrates), or a disciplinary issue, such as sustainable use and livelihoods,
reintroduction of species, wildlife health, climate change and conservation planning.
www.iucn.org/theme/species/about/species-survival-commission
twitter.com/iucnssc

IUCN – Global Species Programme
The IUCN Global Species Programme supports the activities of the IUCN Species Survival Commission and
individual Specialist Groups, as well as implementing global species conservation initiatives. It is an integral
part of the IUCN Secretariat and is managed from IUCN’s international headquarters in Gland, Switzerland.
The Species Programme includes a number of technical units covering Species Trade and Use, the IUCN Red
List Unit, the Freshwater Biodiversity Unit (all located in Cambridge, UK), the Global Biodiversity Assessment
Initiative (located in Washington, DC, USA) and the Marine Biodiversity Unit (located in Norfolk, Virginia, USA).
www.iucn.org/species
THE CONSERVATION STATUS OF MARINE
     BIODIVERSITY OF THE WESTERN INDIAN
     OCEAN
     R. Bullock, G. Ralph, E. Stump, F. Al Abdali, J. Al Asfoor, B. Al Buwaiqi, A. Al Kindi, A. Ambuali,
     T. Birge, P. Borsa, F. Di Dario, B. Everett, S. Fennessy, C. Fonseca, C. Gorman, A. Govender,
     H. Ho, W. Holleman, N. Jiddawi, M. Khan, H. Larson, C. Linardich, P. Matiku, K. Matsuura,
     C. Maunde, H. Motomura, T. Munroe, R. Nair, C. Obota, B. Polidoro, B. Russell, S. Shaheen,
     Y. Sithole, W. Smith-Vaniz, F. Uiblein, S. Weerts, A. Williams, S. Yahya, K. Carpenter

THE IUCN RED LIST OF THREATENED SPECIES™ – REGIONAL ASSESSMENT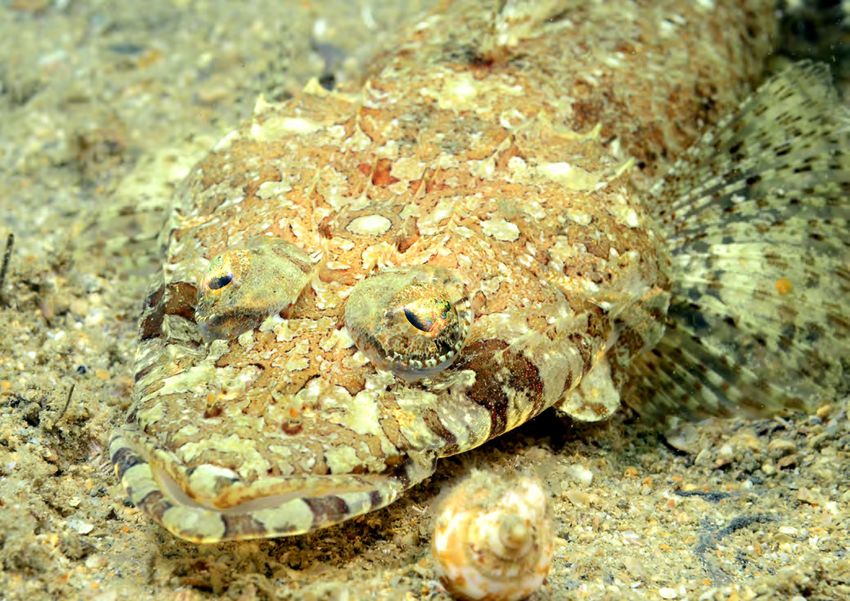
The designation of geographical entities in this book, and the presentation of the material, do not imply the
expression of any opinion whatsoever on the part of IUCN or other participating organisations concerning the
legal status of any country, territory or area, or of its authorities, or concerning the delimination of its frontiers or
boundaries.

The views expressed in this publication do not necessarily reflect those of the IUCN or other participanting
organisiations.

IUCN is pleased to acknowledge the support of its Framework Partners who provide core funding: Ministry
of Foreign Affairs of Denmark; Ministry for Foreign Affairs of Finland; Government of France and the French
Development Agency (AFD); the Ministry of Environment, Republic of Korea; the Norwegian Agency for
Development Cooperation (Norad); the Swedish International Development Cooperation Agency (Sida); the Swiss
Agency for Development and Cooperation (SDC); and the United States Department of State.

Published by:		           IUCN, Gland, Switzerland

Copyright:		              © 2021 IUCN, International Union for Conservation of Nature and Natural Resources

          		Reproduction of this publication for educational or other non-commerical purposes is
             authorised without prior written permission from the copyright holder provided the source is
             fully acknowledged.

          		Reproduction of this publication for resale or other commercial purposes is prohibited
             without prior written permission from the copyright holder.
Citation: 		Bullock, R., Ralph, G., Stump, E., Al Abdali, F., Al Asfoor, J., Al Buwaiqi, B., Al Kindi, A.,
             Ambuali, A., Birge, T., Borsa, P., Di Dario, F., Everett, B., Fennessy, S., Fonseca, C.,
             Gorman, C., Govender, A., Ho, H., Holleman, W., Jiddawi, N., Khan, M., Larson, H.,
             Linardich, C., Matiku, P., Matsuura, K., Maunde, C., Motomura, H., Munroe, T., Nair, R.,
             Obota, C., Polidoro, B., Russell, B., Shaheen, S., Sithole, Y., Smith-Vaniz, W., Uiblein, F.,
             Weerts, S., Williams, A., Yahya, S., Carpenter, K. (2021). The conservation status of marine
             biodiversity of the Western Indian Ocean. Gland, Switzerland: IUCN. vii + 32 pp.

ISBN:			978-2-8317-2098-2 (PDF)

Cover photos: 		          Front - Coral Reef, Zanzibar © F. Di Dario.

			                       Back - Arabian Butterflyfish (Chaetodon melapterus); assessed as Least Concern; by D.P.
			                              Wilson and licensed under CC BY 2.0
Photographs used in this publication remain the property of the original copyright holder and are licensed as either
standard copyright (©) or Creative Commons Attribution 2.0 Generic (CC BY 2.0). See individual captions for
details. Photographs under standard copyright should not be reproduced or used in other contexts without written
permission from the copyright holder (see individual caption for photographer). Photos licensed under Creative
Commons Attribution 2.0 are the work of D.P. Wilson and should not be reproduced without proper attribution. Note
cropping to fit frame was the only modification done to these works.
Layout by:		              Emilie Stump, Gina Ralph and Gabby Saluta

Available from:		 IUCN, International Union for Conservation of Nature
			Rue Mauverney 28
			1196 Gland, Switzerland
			               Tel +41 22 999 0000
			               Fax +41 22 999 0002
			www.iucn.org/resources/publications

More information on the IUCN Red List is available on www.iucnredlist.org.
Table of Contents

Acknowledgements.............................................................................................................................................iv

Executive summary..............................................................................................................................................v

Commonly used acronyms............................................................................................................................... vii

1.      Background
        1.1          The Western Indian Ocean region.................................................................................................. 1
        1.2          Biodiversity and endemism............................................................................................................. 2
        1.3          Threats to marine biodiversity........................................................................................................ 3
        1.4          Assessment of extinction risk: IUCN Red List of Threatened SpeciesTM........................................ 3
        1.5          Project objectives........................................................................................................................... 4

2.      Methods
        2.1          Geographic scope.......................................................................................................................... 6
        2.2          Taxonomic scope............................................................................................................................ 6
        2.3          Preliminary assessments and pre-workshop data collection.......................................................... 7
        2.4          Red List assessment workshops.................................................................................................... 7
        2.5          Post-workshop review.................................................................................................................... 7
        2.6          Methodology for spatial analyses................................................................................................... 8

3.      Results and discussion
        3.1          Conservation status of marine biodiversity..................................................................................... 9
        3.2          Trends by taxonomic group.......................................................................................................... 10
        3.3          Spatial distribution of species....................................................................................................... 12
        3.4          Threats......................................................................................................................................... 15
        3.5          Research needs........................................................................................................................... 17
        3.6          Existing conservation tools........................................................................................................... 18
        3.7          Species conservation successes.................................................................................................. 19

4.      Conclusions
        4.1          Overview...................................................................................................................................... .20
        4.2          Application of project results......................................................................................................... 21
        4.3          General conservation strategies and tools................................................................................... 22
        4.4          Next steps..................................................................................................................................... 23

References......................................................................................................................................................... 25

Appendix: Expert participants......................................................................................................................... 31

                                                                                  iii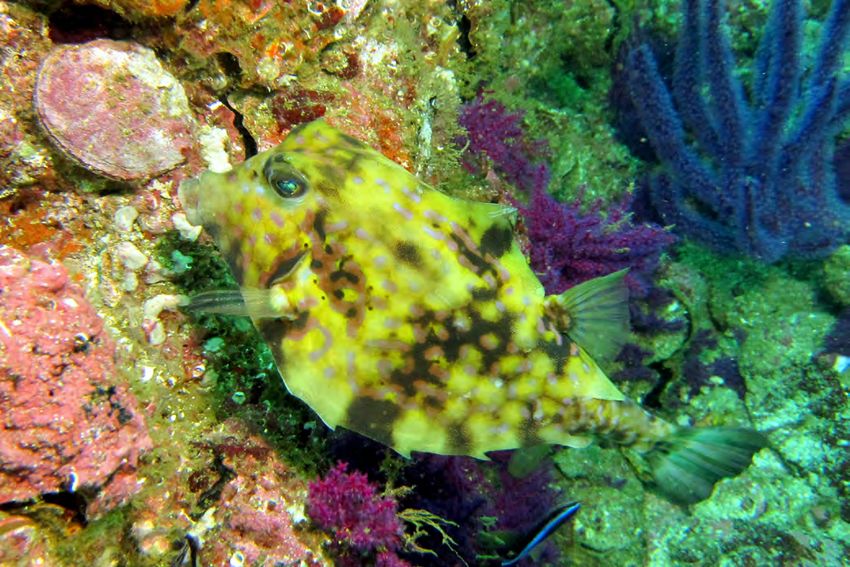
Acknowledgements
This project represents a major expansion of the         Roger McManus and Jean-Christophe Vié for
IUCN Red List process in the Western Indian              their guidance and support of the Global Marine
Ocean and could not have been completed                  Species Assessment initiative of IUCN’s Global
without numerous donors and hundreds of                  Species Programme Marine Biodiversity Unit
experts. The most recent assessments were                since its inception.
completed with the generous support of the
                                                         We extend our gratitude to the Oceanographic
Total Foundation and Toyota Motor Corporation.
                                                         Research Institute of the South African
We thank The Deep and Oceanario de Lisboa
                                                         Association for Marine Biological Research,
for their support of marine IUCN Red Listing
                                                         especially Dr. Larry Oellermann and Ramini
partnerships, which have contributed greatly to
                                                         Naidoo, for hosting the third Red List workshop
the assessments in this report.
                                                         and providing logistical assistance. We also thank
IUCN’s Red Listing process relies on the                 the staff at Sultan Qaboos University for their
willingness of scientists to contribute and              hospitality during the second Red List workshop.
pool their collective knowledge on species, in
                                                         We greatly appreciate the efforts of Caroline
order to make the most reliable and up-to-date
                                                         Pollock and Janet Scott to review the new
assessments. Without such commitment, this kind
                                                         bony fish assessments. We also thank two
of regional overview would not be possible. We
                                                         peer-reviewers for their helpful comments that
would therefore like to acknowledge and thank all
                                                         improved this report.
of the people who gave their time and valuable
expertise during the assessments. Thanks to

 Spotted Sharpnose (Canthigaster solandri); assessed as Least Concern; by D.P. Wilson and licensed under
 CC BY 2.0

                                                    iv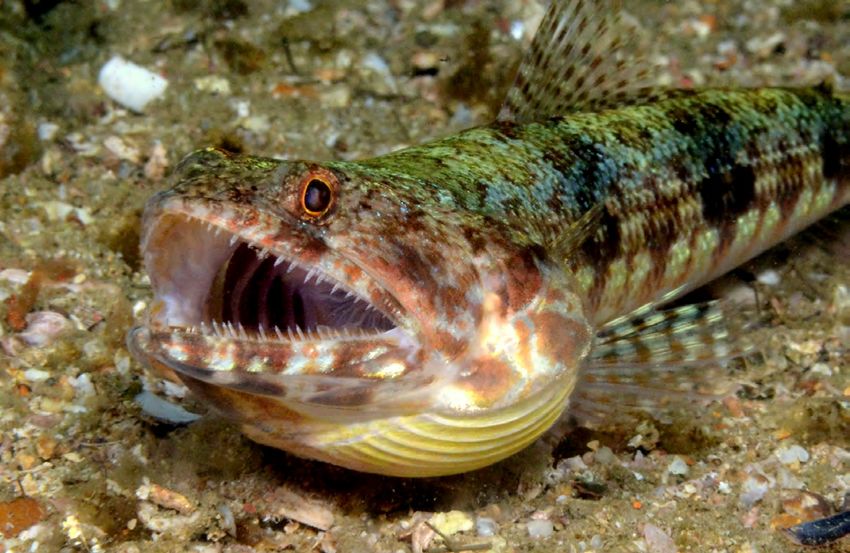
Executive summary
The Western Indian Ocean (WIO) is comprised of             Among the more than 4,000 species
productive and highly diverse marine ecosystems            assessments compiled for this report, 473
that are rich sources of food security, livelihoods,       species were identified as threatened or Near
and natural wonder. The ecological services                Threatened with extinction at the global level,
that species provide are vital to the productivity         according to the IUCN Red List Categories and
of these ecosystems and healthy biodiversity is            Criteria. Incorporating uncertainty in the true
essential for the continued support of economies           status of Data Deficient species, between 7-24%
and local users. The stability of these valuable           of all species were estimated as being currently
resources, however, is being eroded by growing             at risk of extinction, with a best estimate of 8% of
threats to marine life from overexploitation,              all assessed species being threatened. Spatial
habitat degradation and climate change, all of             analyses of species richness across the region
which are causing serious reductions in marine             identified hotspots of threatened species including
ecosystem services and the ability of these                the southern Red Sea and the southern coast
ecosystems to support human communities.                   of India. Major threats were analysed amongst
Quantifying the impacts of these threats and               threatened and Near Threatened species, of
understanding the conservation status of the               which more than 90% were found to be impacted
region’s marine biodiversity is a critical step in         by biological resource use, largely in the form of
applying informed management and conservation              targeted fisheries and bycatch as well as illegal,
measures to mitigate loss and retain the                   unreported and unregulated fishing activities.
ecological value of these systems.                         Overexploitation was flagged as a driver of
                                                           population decline for all threatened and Near
The International Union for Conservation of
                                                           Threatened cartilaginous fishes, mammals
Nature (IUCN) Red List Categories and Criteria
                                                           and sea turtles. The 237 threatened and Near
are the most widely used and objective system
                                                           Threatened reef-building corals are impacted
of quantifying the conservation status of species.
                                                           by the same suite of fishing threats, including
For this report, Red List assessments for marine
                                                           fisheries-related habitat degradation. In general,
fish species were produced and compiled
                                                           habitat degradation and destruction through
with existing assessments for other marine
                                                           pollution, coastal development and other habitat
species groups to generate a comprehensive
                                                           modifications emerged as a major threat across
assessment of the conservation status of the
                                                           assessed species groups. From these analyses,
marine biodiversity of the WIO. The species
                                                           this report highlights trends in research needs
assessed for this report were done so through
                                                           for species in the region, including priorities for
clade-based and regionally focused Red List
                                                           fundamental biological and ecological research
assessment workshops involving hundreds of
                                                           and quantifying trends in the populations of
taxonomic experts from around the world. To
                                                           species.
supplement assessments for marine fishes of the
region, three workshops were held in Tanzania,
Oman and South Africa over the course of three
years from 2017 to 2019. Thirty-one marine fish
experts from 14 countries participated in the three
workshops.

                                                       v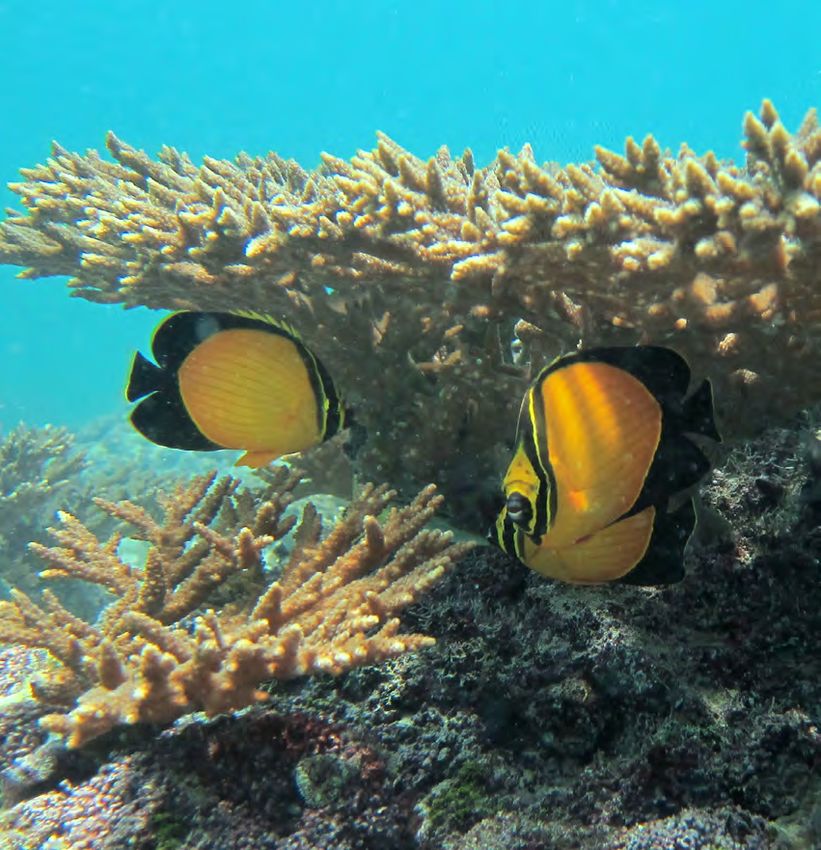
Overall, with a best estimate of 8% threatened Data Deficient, as compared to 11.0-15.8% in
species, the conservation status of the Western other tropical regions. The analyses presented
Indian Ocean region is moderately high, relative here also highlight particularly threatened and
to the status of the same taxonomic suite susceptible taxonomic groups, geographical
of species assessed in other regions. This hotpots of conservation priority as well as trends
comparatively high level of threatened biodiversity in major anthropogenic threats. The assessments
highlights the importance of timely and targeted and analyses submitted in this report should
conservation actions for the biodiversity of inform conservation decision-making processes
the region moving forward. The region has and will be valuable to policymakers, natural
the highest levels of uncertainty in species resource managers, environmental planners and
status with 16.9% of the WIO species listed as NGOs.
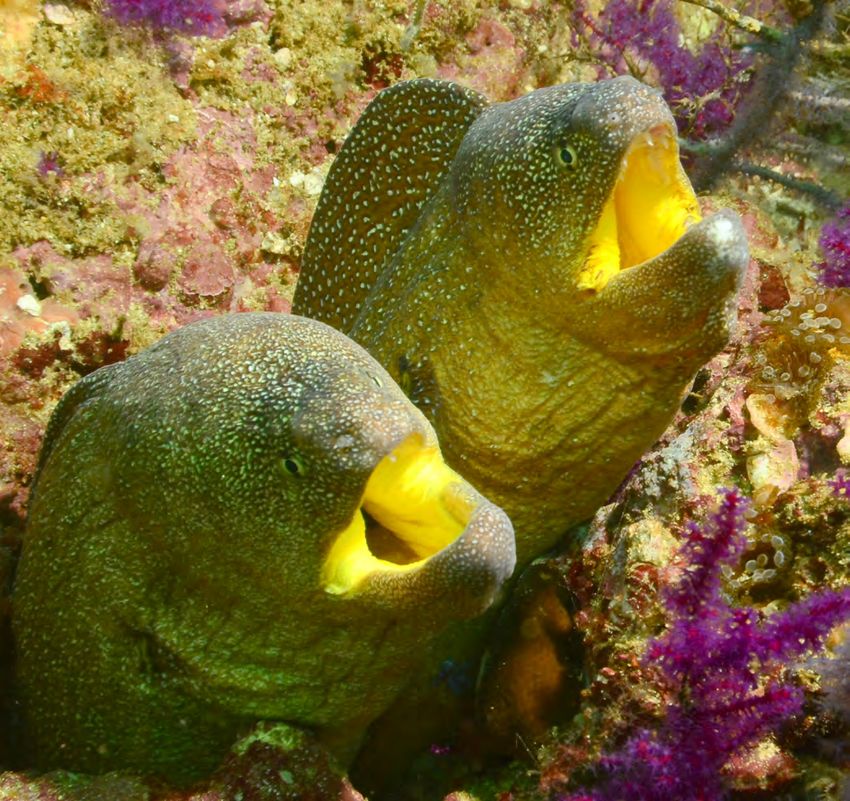
Starry Moray (Gymnothorax nudivomer); assessed as Least Concern; by D.P. Wilson and licensed under CC
BY 2.0
vi
Commonly used acronyms
Red List Categories                                      SYC   Seychelles
   EX		       Extinct                                    SOM   Somalia
   EW		       Extinct in the Wild                        ZAF   South Africa
   CR		       Critically Endangered                      LKA   Sri Lanka
   EN		       Endangered                                 SDN   Sudan
   VU		       Vulnerable                                 TZA   Tanzania
   NT		       Near Threatened                            ARE   United Arab Emirates
   LC		       Least Concern                              YEM   Yemen
   DD		       Data Deficient
   NE		       Not Evaluated

International Organizations
    IUCN       International Union for
               Conservation of Nature
    SSC        Species Survival Commission
    SSG        Species Specialist Group
    RLA        Red List Authority
    MBU        Marine Biodiversity Unit
    FAO        Food and Agriculture Organization
               of the United Nations

Country Codes
   BHR      Bahrain
   IOT		    British Indian Ocean Territory
            (Chagos Archipelago)
   COM      Comoro Islands
   DJI		    Djibouti
   EGY      Egypt
   ERI		    Eritrea
   ATF      French Southern and Antarctic
   		       Lands (Bassas da India, Glorioso
   		       Islands, Ile Europa, Ile Tromelin,
   		       Juan de Nova Island)
   IND      India
   IRN      Iran
   IRQ      Iraq
   ISR		    Israel
   JOR      Jordan
   KEN      Kenya
   KWT      Kuwait
   MDG      Madagascar
   MDV      Maldives
   MUS      Mauritius
   MYT      Mayotte
   MOZ      Mozambique
   OMN      Oman
   PAK      Pakistan
   QAT      Qatar
   REU      Réunion
   SAU      Saudi Arabia

                                                   vii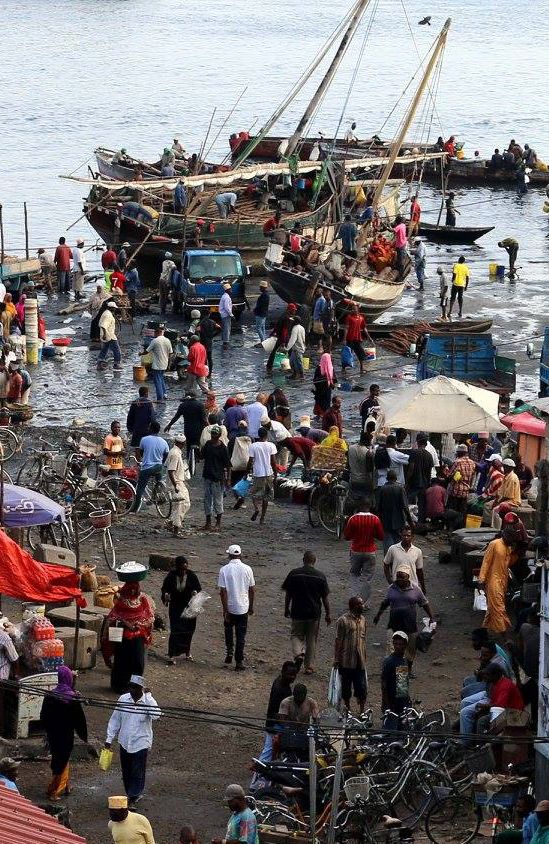
1. Background
1.1 The Western Indian Ocean region                       Some of the most heavily impacted marine biotas
                                                          in the world are in the Western Indian Ocean
The Indo-Pacific Ocean is the largest and most
                                                          where drastic reductions in coral cover occurred
diverse marine ecological system on the planet.
                                                          because of sustained heightened sea surface
On its western periphery, covering approximately
                                                          temperatures and subsequent widespread
30 million km² and spanning the waters of
                                                          bleaching events in the late 1990s (Wilkinson et
32 countries and territories, lies the Western
                                                          al., 1999). Human population growth in the region
Indian Ocean (WIO; Figure 1). Climatically and
                                                          also poses substantial threats to the sustainability
geographically, this is a region of extremes. The
                                                          of coastal biota: many of the countries in the
northeastern range experiences heavy monsoon
                                                          Western Indian Ocean are characterized by high
rains while the northwestern range is bordered
                                                          population growth rates, high population density,
by arid land and is characterized by large semi-
                                                          and substantial rural to urban migrations (UNEP-
enclosed bodies of water such as the Red Sea.
                                                          Nairobi Convention & WIOMSA, 2015).
Shallow coral reef, estuaries, seagrass and
mangrove systems are all found in coastal areas.
The contrasting habitats within the region may
favour differentiated communities and endemism
is likely to be higher where unique habitats occur
(Kier et al., 2009). Unfortunately, due to multiple
factors, this region is understudied and has much
to be discovered (Wafar et al., 2011).

The highly diverse marine biodiversity of the
WIO has been a rich source of food security,
livelihoods and natural wonder for the peoples
in the region (UNEP-Nairobi Convention &
WIOMSA, 2015). The ecological services that
species provide are vital to the existence of these
marine ecosystems (Palumbi et al., 2009) and a
healthy biodiversity is essential for maintaining
a safe operating space for humanity (Rockstrom
et al., 2009). Unfortunately, growing threats
to marine life from overexploitation, habitat
degradation and climate change are seriously               Figure 1: The boundaries of the Western Indian
impacting marine ecosystems globally (Halpern              Ocean, based on the definition used in Fischer
                                                           and Bianchi (1984).
et al., 2008; 2015). These threats are causing
reductions in marine ecosystem services and
the ability of the ecosystem to support human
communities (Worm et al., 2006).

                                                      1
1.2 Biodiversity and endemism and coastal cultural sites (Gossling, 2006).
Biodiversity also provides important aesthetic,
The WIO is associated with areas of high species
cultural and spiritual services to coastal
richness and high endemism. It is ranked as one
communities.
of the world’s richest oceanic regions (Keesing
& Irvine, 2005; Obura, 2012; Veron et al., 2015). Knowledge of marine biodiversity in the
An estimated 15% of all exclusively aquatic WIO continues to expand and has benefited
species known from the Western Indian Ocean greatly from both internationally and locally
are endemic to it (Richmond, 1997; 2001). driven research effort. International research
Across taxa, high levels of endemism have been expeditions, such as the Indian Ocean Expedition
recorded in in the territorial waters of South (1959 to 1965) that supported participants from
Africa, the Red Sea, India, Mauritius, La Reunion, 20 countries, considerably enhanced knowledge
the Seychelles, India and the Maldives (Van der of marine biodiversity beyond shallow and easily
Elst et al., 2005; Keesing & Irvine, 2005; Obura, accessible waters. However, current marine
2012; Briggs & Bowen, 2012; Borsa et al., 2016; biodiversity research efforts are heterogenous
DiBattista et al., 2016). across the region, varying according to the
capacity among the different nations (Keesing &
The productivity of the rich ecosystems of the
Irvine, 2005) and large gaps in sampling effort in
WIO has so far supported economies and
the marine realm of the WIO remain (Wafar et al.,
livelihoods in the region (Samoilys et al., 2015).
2011; Groeneveld & Koranteng, 2017).
Fisheries form a large economic sector in most
nations, providing food security and employment
in coastal communities, and contributing to
national economies and GDPs (Carpenter et
al., 1997; Jiddawi & Ohman, 2002; Belton &
Thilsted, 2014; UNEP-Nairobi Convention &
WIOMSA, 2015). Fisheries in the Western Indian
Ocean region range from dynamic artisanal
fisheries (also called subsistence or small-scale
commercial fisheries), comprising a variety
of gears used in near-shore environments, to
semi-industrial and industrial targeted fisheries
including near-shore shrimp trawling (Jiddawi
& Ohman, 2002; Fennessy & Everett, 2015),
pelagic long-lining and purse-seining (Cochrane
& Japp, 2015), trap fisheries, and mixed
demersal trawling (Carpenter et al., 1997; Belton
& Thilsted, 2014; UNEP-Nairobi Convention &
WIOMSA ,2015).
The biodiversity of the region supports a growing
tourism industry; the economic value of which
has grown rapidly in recent years, and in some
parts of the WIO, exceeds that of fisheries
(UNEP-Nairobi Convention & WIOMSA, 2015;
Gossling, 2006). Tourists are drawn to the Outside Malindi Fish Market, Zanzibar © G.
region’s beaches, lagoons, coral reefs, wildlife, Saluta.
21.3 Threats to marine biodiversity There are nine Red List categories for global
assessments (Figure 2): Extinct (EX), Extinct
Historically low levels of economic development
in the Wild (EW), Critically Endangered (CR),
in parts of the WIO have meant that, in some
Endangered (EN), Vulnerable (VU), Near
areas, the marine ecosystem may have been less
Threatened (NT), Least Concern (LC), Data
impacted by coastal human activity. For example,
Deficient (DD), and Not Evaluated (NE) (IUCN,
arid nations such as Somalia and Sudan have
2012).
low coastal populations densities due to lack of
freshwater and high temperatures, thus limiting
development and exploitation in the coastal
zone (Halpern et al., 2008; Obura et al., 2017).
However, contemporary increases in growth
and development across the region are likely to
increasingly impact marine biodiversity. Previous
regional-scale work has highlighted “hotspots”
of concern in the WIO region; biologically rich
areas where high endemism combines with
multiple threats including coastal and industrial
development, global warming, pollution, and
overfishing (Qasim, 1998; Roberts et al., 2002; Figure 2: The IUCN Red List Categories.
Van der Elst et al., 2005). For example, Kenya,
Tanzania and Mozambique have lost significant
Species that meet the quantitative thresholds
portions of their mangrove shoreline, coral reefs
under one or more of five distinct criteria
have declined due to major bleaching events
are assigned to one of the three threatened
and overexploitation of pelagic and demersal
categories (CR, EN or VU). For species that
fish stocks has been reported since the 1980’s
come very close to, but do not fully meet the
(Obura et al., 2017). Similar findings have been
thresholds for a threatened category, the Near
reported across vast areas of the WIO including
Threatened category is applied. When there
but not limited to the Arabian Gulf, Sri Lanka
are no known major global-level threats, or
and the west coast of India (Gunawardena &
the known threats to a species do not reach
Rowan, 2005; Sale et al., 2011; Vidyasagaran
quantitative thresholds, a species is assessed as
& Madhusoodanan, 2014). These impacts lead
Least Concern. When assessment data indicate
to a loss of ecosystem services from reefs,
unquantified but known serious threats (e.g.,
mangroves and seagrass beds as well as loss
fishing pressure) or that extent of distribution is
of livelihoods, food security and tourism value
poorly understood due to taxonomic uncertainty
(Obura et al., 2017).
or lack of sampling effort, then the Red List
1.4 Assessment of extinction risk: IUCN Red Criteria cannot be applied until further research
List of Threatened SpeciesTM is conducted, and the species is assigned to
the Data Deficient category. The Not Evaluated
The IUCN Red List Categories and Criteria reflect
category is used to indicate a species that is
the principles of extinction risk theory (Mace
recognized as valid, but that has not yet been
et al., 2008) and are the most widely used and
assessed against the Red List Criteria (IUCN,
objective system of quantifying extinction risk
2012); these species are not included on the Red
across all taxa except microbiota (e.g., Butchart
List.
et al., 2005; De Grammont & Cuarón, 2006;
Hoffman et al., 2008).
3decline of the number of mature individuals in a
population. Criterion D addresses species with
extremely small and/or restricted populations, and
Criterion E relies on computer modeled extinction
risk probabilities to estimate extinction risk.
1.5 Project objectives
The conservation status of several important
species that constitute the rich marine
biodiversity of the Western Indian Ocean is
unknown, a situation that can hinder effective
conservation efforts in the region. In order to
overcome this scenario, the IUCN Red List has
formed the basis for many regional conservation
Spot-fin Porcupinefish (Diodon hystrix); planning initiatives. Additionally, IUCN Red List
assessed as Least Concern; by D.P. Wilson and
licensed under CC BY 2.0. assessments are essential to Key Biodiversity
Area (KBA) analyses. KBAs can be designated
Each of the five Red List Criteria addresses one
as targets needing conservation action to protect
or both of the two premises of extinction risk
biodiversity with a larger taxonomic scope.
theory: elevated risk of extinction occurs when (1)
Findings from this project could provide a unique
species’ populations are small and/or (2) species
opportunity to explore the identification of marine
have experienced, are experiencing or are likely
KBAs with broad taxonomic coverage.
to experience population declines at rates that
are biologically infeasible for the population to IUCN Red List assessments are a key tool used
remain viable in the wild (Mace et al., 2008; see in local, national, regional, and global biodiversity
https://www.iucnredlist.org/resources/categories- conservation. Regional or national Red Lists
and-criteria for more information on Red List often form the basis of national listings for
Categories and Criteria). Criterion A is commonly species-at-risk around the world. For example,
applied to wide-ranging species facing identifiable in the USA, global Red List assessments for
threat(s) that cause a population reduction reef-building corals were used as the basis for
beyond a species’ ability to naturally sustain itself. a successful petition to list 88 species of corals
The decline is scaled to the life history of the under the United States Endangered Species
species by the generation length, which is defined Act. Some mega biodiverse countries, such as
as the average age of the parents of a cohort. Brazil, also rely on IUCN Categories and Red
Criterion B addresses species with restricted List assessments in order to build their national
geographic range that are also characterized by conservation strategies and environment action
fragmentation, fluctuations, or declines in range, plans (ICMBio/MMA, 2018). In the WIO region,
habitat or individuals. Two metrics are used to re-assessments of the Red List status of reef-
describe the spatial distribution of extinction risk. building corals are in development, which will
Extent of Occurrence (EOO) is measured as the track progress towards the Aichi Biodiversity
area of a minimum convex polygon that contains Targets and post-2020 biodiversity goals. South
all known or inferred occurrences, and Area of Africa has included Red List status of marine
Occupancy (AOO) is the area within the EOO that species in support of its National Biodiversity
is inhabited by the species. Criterion C is applied Assessment (Van der Bank et al., 2019), as
to species with a naturally small population size well as in supporting rationale for its recently-
and an observed, inferred or estimated continued expanded MPA network (Skowno et al., 2019).
4Celebes Flathead (Thysanophyrs celebica); assessed as Least Concern; by D.P. Wilson and licensed under
CC BY 2.0
There is a distinct need for critical information The specific objectives of this project were to:
to help progress towards international targets
for biodiversity conservation, such as the United • assess the extinction risk of the marine fishes
Nations Sustainable Development Goals (SDGs) of the Western Indian Ocean region;
and the Strategic Plan for the Convention on • analyze trends in the conservation status
Biological Diversity (CBD). The aim of this project of all assessed marine biodiversity in the
was therefore to assess the conservation status Western Indian Ocean;
of WIO marine species and, alongside existing
• analyze trends in major threats and
assessments for other key species groups,
conservation needs across species to
present these data as the foundation for strategic
inform a state-of-knowledge report that can
conservation in the Western Indian Ocean region.
support regional marine and coastal planning
initiatives; and
• build an inter-disciplinary, inter-organizational
network of experts to champion the project
and its findings. conserved and managed
sustainably (e.g. mapping information).
52. Methods
2.1 Geographic scope the available assessments were supplemented
by three Red List assessment workshops focused
The Western Indian Ocean, broadly defined
on species of the Western Indian Ocean.
following Fischer and Bianchi (1984),
encompasses the United Nations Food and Table 1: Number of Western Indian Ocean
Agriculture Organization’s (FAO) fishing area species assessed in each of the 10 functional
groups included in this analysis.
51 as well as the entirety of Sri Lanka (Figure
1). As defined, it is geographically spread over Functional Group Species
about 30 million km², 42% of which overlaps with Mammals 46
Exclusive Economic Zones. The WIO region Sea snakes 19
includes 32 countries and territories, the majority Sea turtles 5
of which are considered developing economies Bony fishes 2990
(UN, 2019). Major currents, including the Agulhas Sharks and rays 264
Current, the Somali Coastal Current, the South Cone snails 183
Equatorial Current, and the Equatorial Counter Sea cucumbers 125
Current, impact the distribution and productivity of Reef-building corals 492
biodiversity in the WIO. Mangroves 26
2.2 Taxonomic scope Seagrasses 17
The analyses in this report reflect more than
4,000 valid marine species in 10 taxonomic
and functional groups (Table 1). Within these
taxonomic groups, only valid species that are
primarily marine, native and present in the
Western Indian Ocean (as defined herein) and
published on the IUCN Red List are included.
Taxa below species level (i.e., subspecies) were
not assessed.
Taxonomy follows the standards adopted by
the IUCN Species Survival Commission (SSC)
Species Specialist Groups (SSGs) and Red List
Authorities (RLAs) responsible for the specific
taxonomic group. Higher taxonomic levels for
the bony fishes primarily follow that set forth
by Nelson (2006), and species-level taxonomy
follows that of the California Academy of
Science’s online database Eschmeyer’s Catalog
of Fishes (Fricke et al., 2020). It is expected that
the majority of Western Indian Ocean species
in these taxonomic and functional groups have
been included in this analysis; however, species
recently described or reported from the Western
Indian Ocean may have been omitted. As Sohal Surgeonfish (Acanthurus sohal); assessed
as Least Concern; by D.P. Wilson and licensed
assessments for marine bony fishes are ongoing, under CC BY 2.0.
62.3 Preliminary assessments and 2.5 Post-workshop review
pre-workshop data collection
Following the workshops, each species’
The IUCN Red List methodology is an objective, assessment was edited, and outstanding
data-driven process based on extinction risk questions resolved through further consultations
theory. For each species, the respective IUCN with workshop participants, as well as with
species authority (e.g., Species Specialist Group members of the relevant Species Specialist
and/or Red List Authority) led the assessment Groups and other experts who did not attend
process. All species-specific information was the workshops. When necessary, distribution
compiled into IUCN’s Species Information Service maps were also revised. Each assessment was
(SIS) database, including data on the taxonomic evaluated by at least one reviewer prior to a final
classification, geographic distribution, population review and consistency check completed by the
status and trends, habitats and ecology, threats IUCN Red List Unit.
and conservation measures.
Three estimates for the proportion of threatened
2.4 Red List assessment workshops species are used to account for the uncertainty
around the true extinction risk faced by Data
The species included in this analysis were
Deficient species. The first of these estimates
assessed during global, clade-based Red List
uses a midpoint and assumes the same
assessment workshops involving hundreds of
proportion of threatened species within the
taxonomic experts from around the world. Three
Data Deficient group as found across other
additional workshops focusing on fishes of the
categories. However, as the true status of Data
Western Indian Ocean were held in Zanzibar,
Deficient species is unknown, a lower and upper
Tanzania (July 2017); Muscat, Oman (June
bound bracket of proportion threatened is also
2018); and Durban, South Africa (August 2019).
calculated. The lower bound assumes that none
Thirty-one marine fish experts from 14 countries
of the Data Deficient species are threatened,
participated in the three workshops (see
while the upper bound assumes that all Data
Appendix for participant lists for each workshop).
Deficient species are threatened (Table 2).
The first day of each workshop consisted of an
Table 2: The equations for the three estimates
overview of the project’s aim and scope, as well of the proportion of threatened species based
as a short training in the use and application on the IUCN Red List (IUCN, 2016). The
IUCN Red List categories include the three
of IUCN Red List methodology. During the threatened categories: Critically Endangered
remainder of the workshops, experts were (CR), Endangered (EN) and Vulnerable (VU);
Near Threatened (NT); Least Concern (LC);
separated into groups based on their taxonomic and Data Deficient (DD).
expertise. Guided by one of the facilitators, the
Estimate Equation
experts reviewed the preliminary assessments
generated during pre-workshop data collection Lower bound (CR+EN+VU)/Assessed
efforts and contributed additional species-specific Mid-point (CR+EN+VU)/(Assessed-DD)
information as available. These data were then Upper bound (CR+EN+VU)/(Assessed-DD)
used to determine if the thresholds and sub-
criteria were met for a threatened listing under at
least one Red List criterion for each species.
72.6 Methodology for spatial analyses pelagic and deep-sea species, distribution maps
were digitized by hand relative to known depth
Expert-vetted and reliable point records, as
preferences and habitat requirements.
well as scientific literature and data on depth
and habitat preferences, were used to generate Species richness analyses were conducted
distribution maps in ArcGIS 10.5 (software toevaluate biodiversity patterns in the Western
by ESRI Corp). For purposes of Red List Indian Ocean region for: 1) assessed marine
assessments, coastal species are understood species; 2) marine species listed in one of
as species residing relatively near the shore the three threatened categories (Critically
in depths shallower than 200 m. Maps for Endangered, Endangered, and Vulnerable); and
coastal species were clipped to a buffered 3) marine species listed as Data Deficient. For
bathymetric layer, based on two-minute spatial all richness analyses, each species’ distribution
bathymetry data made available by the National map was transformed into the World Cylindrical
Marine Fisheries Service of the U.S. National Equal Area Coordinate system and converted
Oceanographic and Atmospheric Administration into a square grid raster of 10 x 10 km cell size.
(Amante & Eakins, 2009). The buffer was Each cell which the species polygon overlapped
either 100 km from the coast or the 200 m was assigned a value of “1”. For each richness
depth contour, whichever was further from the analysis, the selected rasters were added
coastline. This approach standardizes the way together so that the cells of the final raster
coastal species are mapped and produces represented the number of species that occupy
uniform and comparable distribution maps. For each grid cell within the region.
Variegated Lizardfish (Synodus variegatus); assessed as Least Concern; by D.P. Wilson and licensed under
CC BY 2.0
83. Results and discussion
3.1 Conservation status of marine biodiversity Based on these species, the best estimate for
the percentage threatened is 8%. Accounting
Across the more than 4,000 assessed marine
for the uncertainty surrounding the true status
species of the Western Indian Ocean included
of the species listed as DD, the percentage of
here, about 71% were assessed as Least
threatened species ranges from 7%, if none of
Concern (LC). These are primarily widely
the DD species are threatened, to 24%, if all of
distributed and abundant species, or those with
the DD species are threatened.
no known major threats. The three threatened
categories account for a relatively small number Of the threatened species, about 87% were
of species, with 25 assessed as Critically listed under criterion A, indicating a past, present
Endangered (CR), 56 as Endangered (EN) and or future projected population decline. The
195 as Vulnerable (VU). Another 197 species remaining species were listed under criterion B
nearly met the thresholds and conditions for a (26 species), criterion D (10 species); only five
threatened listing and were assessed as Near species were listed under multiple criteria.
Threatened (NT). The remaining species were
assessed as Data Deficient (DD), representing
almost 20% of species (Figure 3).
Figure 3: Percentage of species listed in each of the IUCN Red List categories. CR – Critically Endangered;
EN – Endangered; VU – Vulnerable; NT – Near Threatened; LC – Least Concern; DD – Data Deficient.
93.2 Trends by taxonomic group occur within the WIO were considered
threatened, while none of the 19 species of sea
The number of assessed species and estimates
snakes were considered threatened. Seven of
of percentage threatened varied widely by
the 46 marine mammals, including cetaceans,
taxonomic group (Figure 4, Table 3). Across
pinnipeds and sirenians, were listed as
the taxa included here, the highest and lowest
threatened; however, a high percentage of these
percentage of threatened species occurred in the
species were listed as DD (28%).
marine reptiles. All five of the sea turtles that
Figure 4: Percentage of species listed in each of the IUCN Red List categories by taxonomic group. CR –
Critically Endangered; EN – Endangered; VU – Vulnerable; NT – Near Threatened; LC – Least Concern;
DD – Data Deficient.
Table 3: Number of species and estimates of the percentage of threatened species for each taxonomic group
included here. The percentage of threatened species estimates follow the recommendations in IUCN (2016).
The best estimate is the midpoint, which assumes the Data Deficient species are as threatened as non-Data
Deficient species, while the lower and upper bounds assume that none, and all, of the Data Deficient species
are threatened, respectively.
Taxon Species Lower Midpoint Upper
Mammals 46 15% 21% 43%
Sea snakes 19 0% 0% 21%
Sea turtles 5 100% 100% 100%
Bony fishes 2990 2% 2% 18%
Sharks and rays 264 31% 43% 59%
Cone snails 183 3% 4% 15%
Sea cucumbers 125 8% 22% 72%
Reef-building corals 492 21% 24% 33%
Mangroves 26 0% 0% 0%
Seagrasses 17 12% 13% 18%
10The majority of marine vertebrates are fishes, et al., 2018). A relatively low proportion of bony
with over 17,000 valid species (Fricke et al., fishes were threatened, with only about 2% of
2020). Estimates of fish diversity in the WIO the nearly 3,000 species listed in a threatened
region vary; Smith and Heemstra (1986) report category.
on about 2,200 species from southern Africa
Comprehensive conservation assessments
(Namibia to Mozambique), Heemstra et al. (in
of invertebrates are limited in the WIO, with
press) include well over 3,600 species of coastal
assessments completed only for the cone
fishes in the WIO. While much of the WIO
snails (Gastropoda: Conidae), sea cucumbers
ichthyofauna is of Indo-Pacific origin (Smith &
(Holothuroidea), and reef-building corals
Heemstra, 1986), there are several pockets of
(Anthozoa: Scleractinia). In general, few cone
relatively high endemism; for example, about
snails were threatened, while 22% of sea
15% of marine fishes are endemic to the Red Sea
cucumbers and 24% of reef-building corals were
(Bogorodsky & Randall, 2018; Golani & Fricke,
threatened.
2018) and 13% are endemic to South Africa (Van
der Elst et al., 2005). New species continue to The marine plants, mangroves and seagrasses,
be described throughout the WIO, for example are widely distributed in coastal regions. About
from the Mascarene Plateau (Russell & Tweddle, 30% of the 140 species known globally occur
2013; Russell, 2015; Greenfield & Gordon, 2019; in the WIO region. These species provide
Voronina, 2019) and Zanzibar, Tanzania (Tea et fundamental ecosystem services, including
al., 2019), indicating that our understanding of flood protection, nutrient and organic matter
the diversity of WIO fishes is certainly incomplete. processing, and sediment control, and support
Even large, non-cryptic taxa have been described fisheries in tropical and subtropical fisheries
from this region in the last decade. Among the around the globe (Costanza et al., 1997). Overall,
cartilaginous fishes, including the sharks, rays, the risk of global extinction to these marine plants
skates and chimaeras, the best estimate for the remains low in the WIO, with only two species of
proportion of threatened species was 43%; the seagrasses listed as VU and one as DD.
Arabian Sea has one of the highest proportions of
threatened cartilaginous fishes globally (Jabado
Townsend’s Anthias (Pseudanthias townsendi); assessed as Least Concern; by D.P. Wilson and licensed
under CC BY 2.0
113.3 Spatial distribution of species The shallow, semi-enclosed Persian/Arabian Gulf
was an exception, with lower overall richness
The highest richness of all assessed marine
compared to other coastal areas; the results of
species, with upwards of 1,300 species per 100
its relatively young geological age and harsh
m², occurred in the tropics along the coast of
environmental conditions (e.g., Sheppard et al.,
central East Africa, in the oceanic islands and Sri
2010).
Lanka (Figure 5). Generally, richness was higher
along the coast, as compared to offshore.
Figure 5: Distribution of the marine species of the Western Indian Ocean that have been assessed against the
IUCN Red List Categories and Criteria.
12The east coast of Africa (Kenya, Tanzania and waters as compared to offshore (Figure 6). In
Mozambique), the Western Indian Ocean Islands, the southern Red Sea and along the southern
the Red Sea, the southern coasts of India and coast of India, however, the number of threatened
the coastal regions of Sri Lanka were areas with species was higher than would be expected
highest numbers of threatened species, with based on the overall number of species alone.
higher richness of threatened species in coastal
Figure 6: Distribution of the threatened marine species of the Western Indian Ocean that have been assessed
against the IUCN Red List Categories and Criteria.
13Data Deficient species tended to be patchily assessed as DD. Highest numbers of DD species
distributed throughout the region, which may occur off South Africa, Madagascar, and Sri
be a result of the limited information available Lanka, followed by the Red Sea (Figure 7).
regarding the distribution of many species
Figure 7: Distribution of the Data Deficient marine species of the Western Indian Ocean that have been
assessed against the IUCN Red List Categories and Criteria.
14Figure 8: Proportion of species assessed as threatened (Critically Endangered, Endangered and Vulnerable)
or Near Threatened that are impacted by various threats. Species are often impacted by more than one threat.
3.4 Threats Habitat degradation and destruction through
pollution, coastal development and other habitat
More than 90% of the threatened and Near
modifications emerged as a major threat across
Threatened species are impacted by biological
species groups assessed. These anthropogenic
resource use, either through direct, targeted
activities can lead to physical damage, changes
fisheries, through illegal, unreported and
in chemical water quality (eutrophication),
unregulated fishing or indirectly through
sedimentation, the introduction of pollutants,
bycatch or habitat degradation (Figure 8). In
and microbial contamination. Ultimately, habitat
particular, overexploitation was flagged as a
loss can lead to ecosystem phase shifts in which
driver for all threatened and Near Threatened
the dominant structuring species (i.e., corals,
cartilaginous fishes, mammals and sea turtles;
seagrasses, and/or mangroves) are replaced
these typically long-lived, late-maturing species
(Done, 1992; McManus & Polsenberg, 2004).
may be particularly susceptible to declines (e.g.,
Phase shifts ripple through the ecosystem (Done,
Dulvy et al., 2014). The 237 threatened and
1992), many causing a net loss of biodiversity as
Near Threatened reef-building corals, which
habitat quality declines (McManus & Polsenberg,
represent nearly half of all the species in these
2004).
categories, are impacted by the same suite
of threats, including fisheries-related habitat Climate change further emerged as a major
degradation; climate change and severe weather; driver of extinction risk for some taxa in some
human intrusions and disturbance; invasive sub-regions of the WIO. In the northwestern
and other problematic species, genes and WIO, climate change, aggravated by local
diseases; pollution; residential and commercial stressors such as coastal development, has been
development; and transportation and service implicated in the decline of coral assemblages
corridors. in the Arabian Gulf and Red Sea (Riegl, 2001;
15Burt et al., 2014). The Red Sea has high levels has led to shifting distributions of commercially
of coral endemism (DiBattista et al., 2016), while important fishes and invertebrates, with social,
both regions have limited connectivity to other ecological, and economic impacts that complicate
parts of the WIO, and high and variable salinity resource management (Sink et al., 2012).
and temperature (Sheppard et al., 1992; Riegl,
In addition to species directly affected by climate
2001). Corals in these regions are vulnerable to
change, the survival of some species, such as
environmental fluctuations as they are already
those that are coral dependent (Munda, 1997;
existing at the edge of the environmental and/
Booth & Wellington, 1998; Gardiner & Jones,
or thermal tolerances (Cheung et al., 2009;
2005; Pratchett et al., 2013), is determined by the
Sheppard et al., 2012; Buchanan et al., 2016). In
extent of suitable live coral habitat (Jones et al.,
the southwestern WIO, South Africa has distinct
2004; Munday et al., 2008; Pratchett et al., 2013).
biogeographic zones that are primarily defined by
These taxa are likely to experience population
differences in temperature (Turpie et al., 2000).
declines as a response to reduced habitat
This biogeography contributes to high endemism
availability resulting from climate change effects
in the area (Turpie et al., 2000; Skowno et al.,
(AGEDI, 2015; Buchanan et al., 2016).
2019; van der Bank, 2019). Here, climate change
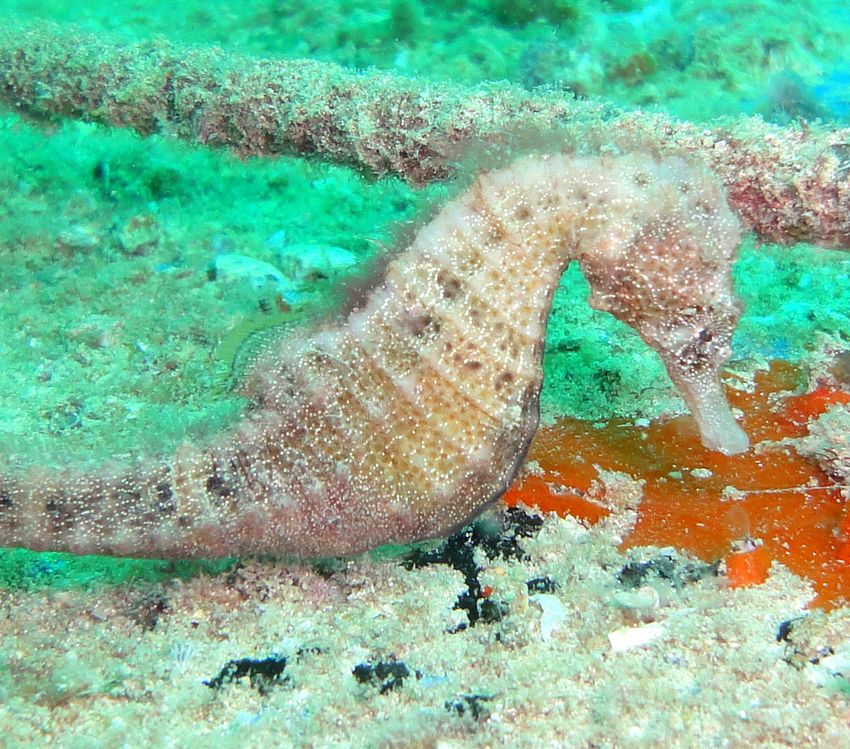
Spotted Seahorse (Hippocampus kuda); assessed as Vulnerable; by D.P. Wilson and licensed under CC BY
2.0
163.5 Research needs
Our results highlight several key research needs,
including those for habitat-forming species and
exploited species. Approaches for economic
valuation can further contribute to biodiversity
conservation.
Habitat-forming species provide valuable
ecosystem services that support both human and
non-human ecosystems; however, limited high-
resolution information is available throughout
much of the WIO on the distribution and
abundance of these species. These research
needs should be elevated within existing
research and resource management frameworks
of the respective nation-states and territories of
the Western Indian Ocean region, and by regional
resource management organizations. Mangroves,
Malindi Fish Market, Zanzibar © G. Saluta.
corals, and seagrasses primarily occur in shallow
fundamental biological and ecological research
waters, and as such a substantial portion of that
at multiple scales, from municipal to regional,
existing biodiversity lies within territorial and EEZ
to support data-driven assessments of the
boundaries (AGEDI, 2015). Outside of national
current status of impacted species. Quantitative
territorial boundaries and EEZs, regional habitat-
metrics such as maximum size, length-frequency
based research programs fulfilled under the
distribution, age at first maturity, assessments of
mandates of Regional Fisheries Management
discard mortality, and catch-per-unit effort can be
Organizations (RFMOs) and arrangements
used to quantify population trends. Quantifying
such as the Southern Indian Ocean Fisheries
population trends is a crucial exercise that
Agreement, have the potential to enhance and
supports resource management and conservation
synthesize the highly variable existing knowledge
programs, as well as the Red List assessment
of the distribution of habitat-forming species.
process.
For example, previous studies have highlighted
the need for a regional approach to coral reef Economic valuation can contribute to biodiversity
mapping in the Persian Gulf (e.g., Burt et al., conservation by enabling the optimal allocation of
2014; Buchanan et al., 2016; Grizzle et al., 2016). limited management resources. Loss of local or
regional biodiversity can result in a corresponding
Overexploitation of target and non-target marine
loss in the provision of goods and services, some
species was identified as a primary driver of
of which have tangible economic value, including
extinction risk in at least 90% of threatened
reduced resilience and resistance to change,
and NT species. Fishes, in general, had a high
declining environmental health, reduced fisheries
proportion of species targeted in single- and
potential, and lost recreational opportunities
multi-species fisheries, while threatened and NT
(Beaumont et al., 2008; de Groot et al., 2010).
mammals, sea turtles and reef-building corals
Valuing these potential losses can empower
were negatively impacted by incidental take as
managers to divert resources towards important
bycatch and fisheries-related habitat degradation.
and attainable biodiversity and ecosystem
Given the susceptibility of many species to fishing
services goals.
activity, there is a pronounced need for greater
characterization of regional fisheries, and for
173.6. Existing conservation tools Many WIO nations are signatories to international
environmental agreements, including the
Municipal, provincial and state/territorial
Convention on International Trade in Endangered
governments are tasked with fulfilling various
Species of Wild Fauna and Flora (CITES), the
environmental mandates, many of which are
Convention on Biological Diversity (CBD), the
focused on economic development, food security,
Convention on Migratory Species (CMS), the
and poverty alleviation. Incorporating marine
International Convention for the Regulation of
biodiversity conservation goals and strategies
Whaling (IWC), the UN Convention on the Law
into existing policy and enforcing policies will
of the Sea (UNCLOS), and the UN Sustainable
ensure continued ecosystem support for coastal
Development Goals (SDGs). These agreements
human communities, contribute to sustainable
have the potential to bolster marine conservation
development initiatives, and can bolster provincial
efforts at the regional scale by aligning the
and national economies through fisheries and
goals of individual nation-states, promoting
tourism.
regional cooperation, drawing political and
The open ocean, or high seas, are cooperatively legal frameworks for use and governance in the
managed by Regional Fisheries Management region’s oceans and seas.
Organizations, international organizations formed
Marine protected areas (MPAs) are another
by participating countries with fishing interests
broadly applied tool. IUCN identifies a protected
in an area. RFMOs such as the Indian Ocean
area as clearly defined geographical space,
Tuna Commission, and agreements such as the
recognized, dedicated and managed, through
Southern Indian Ocean Fisheries Agreement,
legal or other effective means, to achieve the
can implement management actions including
long-term conservation of nature with associated
setting catch and effort limits and implementing
ecosystem services and cultural values (Dudley,
gear restrictions, as well as mandates to advance
2008; Day et al., 2019). MPAs are tailored to
research within their respective domains.
protected management of natural marine areas.
Both management and research functions of
MPAs are created by delineating zones with
these bodies have the potential to advance the
associated permitted and non-permitted uses
marine biodiversity and habitat conservation
(IUCN Global Marine and Polar Programme,
in the region. Additionally, more regionally
2020). The countries and territories of the WIO
specific initiatives offer means to implement and
have designated many small, coastal protected
monitor fisheries management plans, establish
areas, as well as several large oceanic protected
ecosystem approaches to fisheries management
areas, including the British Indian Ocean Territory
and thereby achieve sustainable development
Marine Protected Area (Chagos), UK; Mayotte
goals. One example of such a regional initiative is
and Iles Eparses, France; Amirantes to Fortune
that of the United Nations Industrial Development
Bank and Aldabra Group, Seychelles; South
Organization (UNIDO) project of the Republic of
Africa’s recently expanded MPA network (IUCN,
Sudan, which is building institutional capacities
2004; UNEP-WCMC & IUCN, 2020). In some
for an eco-system approach to management of
cases, these protected areas have assisted
the marine fishery in Sudan with aim to improving
countries in meeting Aichi targets and SDGs.
sustainable management and development of
Enforcement of MPAs is a vital element impacting
artisanal and semi-industrial fisheries (UNIDO,
their conservation benefit (Edgar et al., 2014).
2019).
18You can also read