Marine meteorological forecasts for coastal ocean users - perceptions, usability and uptake
←
→
Page content transcription
If your browser does not render page correctly, please read the page content below
Research article
Geosci. Commun., 4, 361–381, 2021
https://doi.org/10.5194/gc-4-361-2021
© Author(s) 2021. This work is distributed under
the Creative Commons Attribution 4.0 License.

Marine meteorological forecasts for coastal ocean users –
perceptions, usability and uptake
Christo Rautenbach1,2,3 and Berill Blair4
1 Coastaland Estuarine Processes, National Institute for Water and Atmospheric Research (NIWA), Hamilton, New Zealand
2 Institute
          for Coastal and Marine Research, Nelson Mandela University, Port Elizabeth, South Africa
3 Department of Oceanography and Marine Research Institute, University of Cape Town, Cape Town, South Africa
4 Environmental Policy Group, Wageningen University and Research, Wageningen, the Netherlands

Correspondence: Christo Rautenbach (christo.rautenbach@niwa.co.nz)

Received: 23 December 2020 – Discussion started: 26 January 2021
Revised: 5 July 2021 – Accepted: 12 July 2021 – Published: 13 August 2021

Abstract. The present study aims to address a disconnect          African users’ cohort, with strong agreement regardless of
between science and the public in the form of a poten-            sectoral affiliation. New Zealand’s commercial users’ cohort
tial misalignment in the supply and demand of information         had the weakest agreement with all other subgroups. We dis-
known as the usability gap. In this case, we explore the          cuss the implications from our findings on important factors
salience of marine meteorological (metocean) information          in service uptake and therefore on the production of salient
as perceived by users in two Southern Hemisphere coun-            forecasts. Several priorities for science-based forecasts in the
tries: South Africa and New Zealand. Here, the focus is           future are also reflected on, considering anticipated climate
not only on the perceptions, usability and uptake of ex-          change impacts. We conclude by proposing a conceptual di-
treme event forecasts but rather focused on general, rou-         agram to highlight the important interplay between forecast
tine forecast engagement. The research was conducted by           product co-development and scientific accuracy/consistency.
means of a survey, designed around three research ques-
tions. The research questions covered topics ranging from
forecasting tool ergonomics, accuracy and consistency, us-
ability, institutional reputation, and uncertainties related to   1   Introduction
climate change (to name but a few). The online question-
naire was widely distributed to include both recreational and     The accuracy of metocean predictions differ depending on
commercial users. The study focused on identifying poten-         the physical phenomena being forecasted. As an example,
tial decision-making cultures that uniquely impact coastal        vertical ocean column structure parameters might be much
ocean users’ information needs. Cultural consensus analy-         more difficult to predict accurately than the prevailing ocean
sis (CCA) was used to investigate shared understandings and       surface waves (in a very general sense as this statement is
variations in perceptions within the total group of respon-       highly location dependent). The vertical water structure of
dents as well as in sectoral and country-based subgroups. We      both coastal and open oceans is driven by a larger num-
found varying degrees of consensus in the whole group (par-       ber of environmental parameters which inevitably makes the
ticipants from both countries and all sectors combined) ver-      physics, to be solved by numerical techniques, more chal-
sus different subgroups of users. All participants taken to-      lenging (including the requirement for 3D numerical consid-
gether exhibited an overall moderate cultural consensus re-       erations). This contrasts with 2D wave forecasts, which pre-
garding the issues presented but with some variations in per-     dominantly depend on local winds, offshore swell conditions
spectives at the country-level, suggesting potential subcul-      and local bathymetry. Prediction techniques also play a large
tures. Analysing national and sectoral subgroups separately,      role in forecast accuracy and have different computational
we found the most coherent cultural consensus in the South        demands associated with them. These include considerations
                                                                  of forecast time period, spatial extent and dimensionality,

Published by Copernicus Publications on behalf of the European Geosciences Union.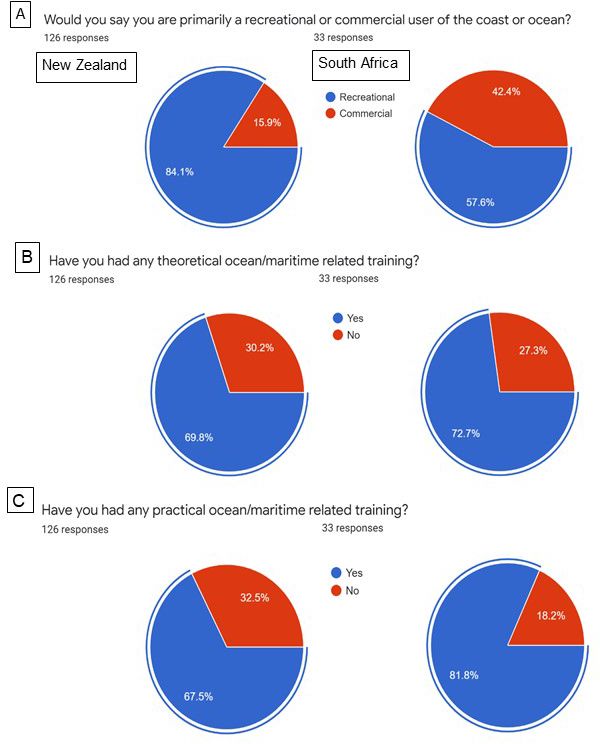
362                                                  C. Rautenbach and B. Blair: Marine meteorological forecast perceptions

temporal resolution, and purpose. In the present study the         enhancement of knowledge do not accompany the dissemi-
perception, usage and uptake of metocean forecasts are as-         nation of forecast information, the forecast has limited rel-
sessed, predominantly focusing on coastal and ocean winds          evance. Operational marine meteorological centres typically
and waves.                                                         serve a wide range of clients with varying needs. The effec-
   Around the world, operational centres clearly articulate the    tiveness with which relevant information is communicated
importance of user-centric (or transdisciplinary) research and     to those clients can differ depending on the user’s domain
development (R&D) (e.g. Ebert et al., 2018). Likewise, the         knowledge and the utilization purpose (e.g. Kirchhoff et al.,
broader climate services literature has focused on potential       2013; Lamers et al., 2018; O’Connor et al., 2005; Wagner
mismatches between the supply and demand of information            et al., 2020). Specific clients often require bespoke solutions
that precipitates the so-called usability gap (Kirchhoff et al.,   not entirely transferable to other users.
2013; Lemos et al., 2012; Meadow et al., 2015; Zulkafli et al.,
2017). Yet, limited anthropological studies have been con-         1.1   Aim
ducted with user perceptions of science-based forecasts as
the main research goal (Doswell, 2003; Silver, 2015) with          The present study aims to evaluate shared meanings of
the objective to gauge the extent to which groups of users         metocean forecast usability as important factors that drive
do or do not share an understanding about what makes fore-         the uptake of products, by engaging with members of the
casts usable. Severe weather warning perception and uptake         broader ocean community, with varying levels of ocean liter-
have been studied in the past (e.g. Sherman-Morris, 2010)          acy and experience (e.g. recreational and commercial users).
but general (non-extreme) forecast usability, preferences and      Confirming the knowledge viewpoints of these subgroups
accuracy perceptions have not been extensively investigated        has not been investigated before and thus forms part of the
(also known as the social aspects of weather or marine fore-       present study. This research thus investigates the differences
casting) (Silver, 2015). The few studies that did investigate      in the shared meanings of geographically separate groups:
the social aspects of weather forecasting include Demuth et        South African and New Zealand users. These two Southern
al. (2011), Katz and Lazo (2011), Lazo et al. (2009) and Sil-      Hemisphere countries are characterized by vastly different
ver (2015). These studies are focused on North American            social structures and ocean states and thus different social
countries (USA and Canada) and also illustrate how impor-          dynamics. Other than sharing the Southern Ocean and aus-
tant weather forecasting is for economic development (Lazo         tral seasons, these countries both have heterogeneous ocean
et al., 2009).                                                     and coastal user communities. From a metocean perspective,
   Weather salience and the connection with atmospheric            they share similar climatologies and latitudes but on different
weather forecasts are discussed in studies by, for exam-           continents with unique metocean dynamics.
ple, Stewart et al. (2012) and Williams et al. (2017). The            Guiding research questions include the following:
term “weather salience” refers to the psychological impor-
tance weather has for a particular individual (Stewart, 2009).     Q1 What important user requirements regarding usability
Several other studies started investigating how users’ tech-          impact marine forecast uptake by coastal ocean users in
nical understanding and competence influence their inter-             New Zealand and South Africa?
pretation and perception of hydro-meteorological products
                                                                   Q2 Will climate change affect the importance of those fac-
(Ramos et al., 2010). Ramos et al. (2010) also encouraged
                                                                      tors in the future?
users’ technical training and direct engagement during opera-
tional forecast and hazard (early warning) tool development.       Q3 Do geographic and sector-specific variations exist in
This is especially true for probabilistic forecasting. Ramos et       levels of agreement pertaining to Q1 and Q2?
al. (2010) also highlighted the importance of exploring more
effective ways of communicating forecasts.                            Questions 1 and 2 gauge present and anticipated fu-
   User community perception is a crucial aspect of any ma-        ture factors that impact forecast usability. The three ques-
rine meteorological (metocean) information sharing or fore-        tions together help us explore whether user perceptions re-
casting. Here the word forecast is used broadly to describe        garding the usability of forecasting products are geographi-
current and future earth system dynamics prediction. Sev-          cally/sectorally localized or if the two user groups share sim-
eral studies have established that active collaboration with       ilar understandings of current and future forecasting needs.
users is needed to strengthen forecast service development,        This was achieved by means of a questionnaire. By under-
as a rich source of specific user interest and routines and        standing users’ points of view, metocean forecasting agen-
as a framework for translating user needs into tractable re-       cies/ companies can focus on providing relevant informa-
search questions (e.g. Bremer et al., 2019; Lemos et al., 2012;    tion in a format that enables effective uptake by better align-
Meadow et al., 2015; Vaughan et al., 2018; Vaughan and             ing the provision of information with its demand. This cov-
Dessai, 2014; Wagner et al., 2020). Codesign of services can       ers both commercial and public services such as commercial
help to provide the best information on relevant scales for all    fishermen, search and rescue agencies, paddle craft clubs and
users and increase the rates of uptake. If user uptake or the      surfers. The dual Southern Hemisphere country investigation

Geosci. Commun., 4, 361–381, 2021                                                       https://doi.org/10.5194/gc-4-361-2021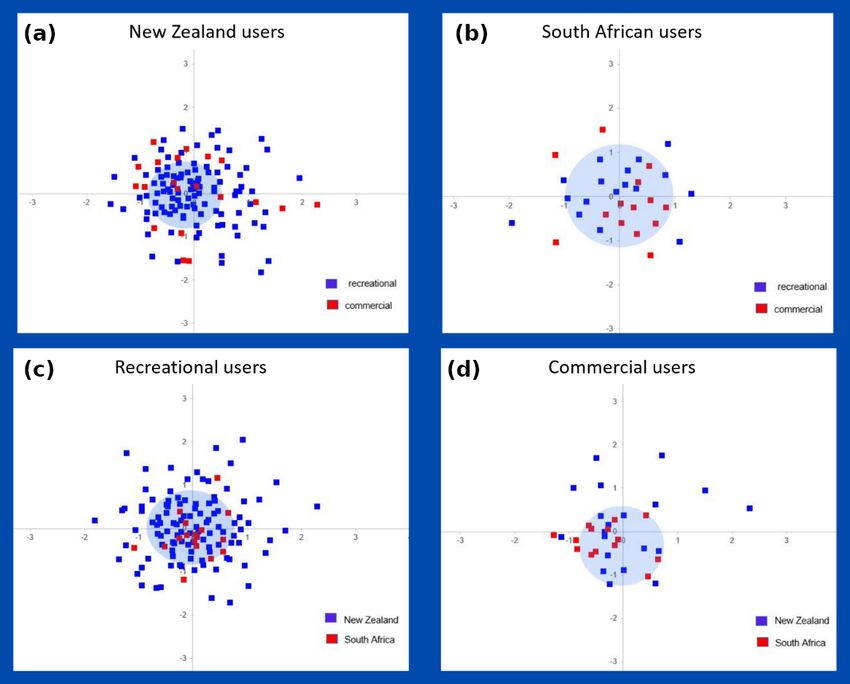
C. Rautenbach and B. Blair: Marine meteorological forecast perceptions                                                     363

also provides a unique and relevant perspective on global,        of risk associated with marine forecast products. Commer-
metocean forecast user needs. This is achieved through inves-     cial fishermen were chosen as the main user group, and their
tigating two countries with extensive coastlines and diverse      study highlighted how important user engagement is for suc-
user communities.                                                 cessful marine forecasting. Once again, semi-structured in-
                                                                  terviews were used, and the study was based in the USA.
                                                                  These studies thus only had one user group as focus and did
2     Background
                                                                  not consider a wider spectrum of typical ocean and coastal
2.1    Perception, preference and uptake of forecasts
                                                                  users. Other studies focusing on forecast co-production in the
                                                                  Northern Hemisphere include Bremer et al. (2019), Lemos et
Silver (2015) investigated the perceptions, preferences and       al. (2012), Lövbrand (2011) and Meadow et al.(2015).
usage of atmospheric forecast information by the Canadian            A distinction may also be made between commercial users
public. Environment Canada acknowledged the fact that their       and the general public, the latter typically being a public
forecasts were reaching millions of citizens, but they were       good concern. The distinction between these user groups
uncertain as to who or for what purpose these forecasts were      might explain some of the results observed by Silver (2015).
being used. They thus investigated how their end users ob-        The suspicion is that commercial or specialist users will dis-
tained, interpreted and used their forecasts (Silver, 2015).      play a higher level of understanding when it comes to techni-
They made use of both semi-structured interviews (n = 35)         cal aspects of forecast usability perception. Doksæter Sivle
and closed-ended questionnaires (n = 268). One of the most        and Kolstø (2016) investigated the use of online weather
interesting findings from Silver (2015) was that forecasts        information for everyday decision-making. Here it became
were mainly used for pragmatic reasons. These would in-           clear that this distinction is also dependent on the task (for
clude checking the weather to decide what to wear for the day     which the forecast is used) and not only on the person or
or for planning social activities, like going away for a week-    group. Marine information and forecast dissemination pa-
end. The typical user did not pay attention to the ambient at-    rameters include ocean winds, waves, temperature, current
mospheric conditions unless it was hard not to notice it (e.g.    velocity, water level and water quality dynamics. Drift pre-
severe weather) (Silver, 2015). They also reported high lev-      dictions, associated with search and rescue operations or oil
els of weather salience with regards to local weather knowl-      spills, are examples of two services with major human and
edge. Most of the public were, however, unable to differen-       environmental consequences.
tiate between products, e.g. what makes them different. This         Limited studies have been performed linking Southern
directly relates to understanding the basics of model fore-       Hemisphere metocean forecasting needs with available fore-
casting horizons as well as spatial resolutions. Silver (2015)    casting products. An example is presented by Vogel and
also reported that the Canadian public trusted the Environ-       O’Brien (2006) where they focused on the uptake of seasonal
ment Canada weather forecasts and actively gave preference        atmospheric forecasts over southern Africa. Hewitt (2020)
to their products. Silver (2015) highlighted numerous topics      also presented a high-level discussion on the challenges
and questions that will be addressed and expanded upon in         faced by the UK Met Office in delivering climate services
the present study, including the trust users have in various      globally, including the Southern Hemisphere. The uptake of
forecast products and why. This question is also even more        a metocean forecast depends on numerous factors beyond
interesting in the light of our changing climate. With the con-   technical accuracy. Some are even related to the “look and
tinuing rise in climate change impacts and changing weather       feel” of the dissemination methods: for example, are the fore-
patterns, user understanding and uptake of forecast products      casts being accessed via simple text messages, smartphone
have never been more important (a sentiment echoed in the         apps or via traditional publicly available media channels?
results of the present study). Here, we will focus on ocean
and coastal users and include marine forecasts as the main        2.2   Geography, operational settings and the cultural
predictand.                                                             dimensions of ocean use
   In the Northern Hemisphere, Finnis et al. (2019) presented
a Canadian study where the marine forecasting needs of fish-      Most user-perception-related studies have been conducted in
ers were investigated and how the available marine fore-          the Northern Hemisphere. Not only does the oceanography
casting products were used in their decision-making pro-          and atmospheric dynamics differ between hemispheres but
cess. They followed a semi-structured interview process           so do the cultures established within them. Both South Africa
and found that there was a “subjective art” to the develop-       and New Zealand are in the Southern Hemisphere at similar
ment/dissemination and uptake of marine forecasts. Without        latitudes. Both countries have a considerable coastline and
a direct distinction between user groups, they found that fore-   are directly exposed to the Southern Ocean. South Africa
casters (commercial/specialist users) gave more attention to      used to be a crucial supply stop for ships traversing between
technical details, like model accuracy and consistency, while     the eastern and western trading routes (Worden, 2007) and
the fishers (commercial/recreational) focused more on us-         currently has a coastline stretching approximately 3000 km.
ability. Kuonen et al. (2019) also investigated the perception    New Zealand, similarly, only has Australia as close-by neigh-

https://doi.org/10.5194/gc-4-361-2021                                                   Geosci. Commun., 4, 361–381, 2021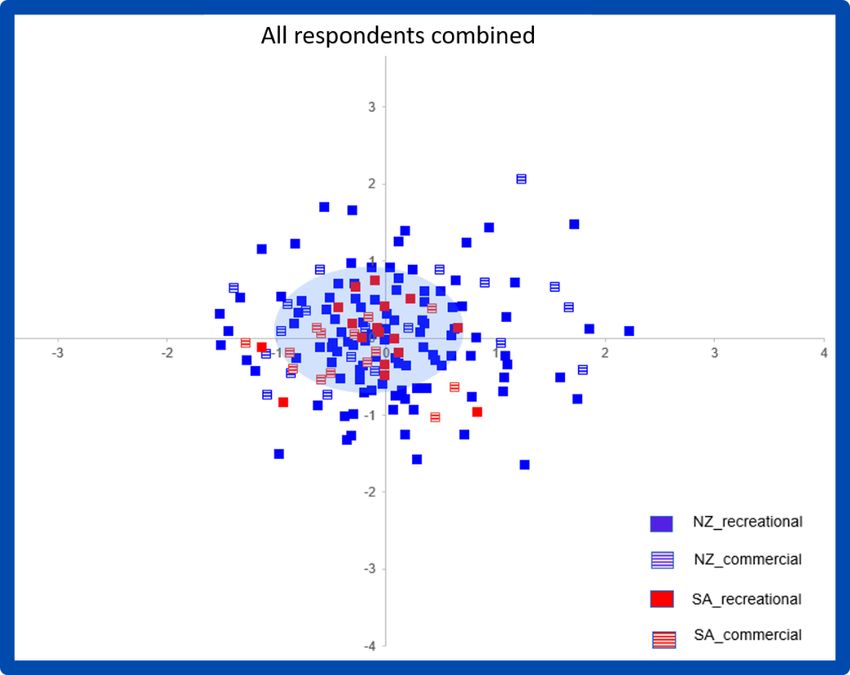
364                                                 C. Rautenbach and B. Blair: Marine meteorological forecast perceptions

bour and is considered being two islands with an approxi-         and these differences impact the temporal and spatial scale
mate coastline of 15 000 km. Due to their geographical loca-      at which information is needed for planning and tactical de-
tions, these extensive coastlines exhibit a variety of coastal,   cisions. Consequently, the socioeconomic value that may be
shelf scale and open ocean dynamics (e.g. Barnes and Raut-        derived from salient forecasting services varies across a wide
enbach, 2020; Chiswell et al., 2015; Godoi et al., 2017; Raut-    spectrum of geographic and sectoral contexts as well.
enbach et al., 2020).                                                As more interdisciplinary research includes diverse stake-
   The seafaring heritage of New Zealand resulted in a nation     holders and their observations about the technical, natural
that tends to be interested and involved in everyday metocean     and human factors that drive the need for information. It
predictions. A large portion of the country is aware of the       is increasingly apparent that understanding user needs, of-
ocean and technically everyone is near the ocean. This is also    ten in cross-sectoral and cross-cultural settings, is a signif-
depicted in the traditional art of New Zealand (Dunn, 2003;       icant challenge. In this research we use the term culture to
Keith, 2007; Ministry for Culture and Heritage, 2014). The        denote learnt ways of knowing; more specifically, we mean
culture and language are also weaved into ocean-based ref-        learned knowledge that shapes people’s approach to ocean
erences and symbolism (Wolcott and Macaskill, 1997). One          resources and ocean information use. Culture affects users’
such example is the Mangopare (hammerhead shark symbol).          perceptions about, and attitudes toward, technologies in gen-
The double Mangopare has been incorporated into the New           eral (Lee et al., 2007; Lim and Park, 2013), as well as the
Zealand MetService’s logo and represents weather predic-          meaning and relative importance of salient scientific infor-
tion and oceanography and their dependence on each other.         mation (e.g. Martinsons and Westwood, 1997). Traditional
This general stance was also reflected in the results presented   interview and questionnaire methods do not always explain
in the present study. South Africa, on the other hand, has        the variation in experiential knowledge that may exist across
a much less direct relationship with the ocean. The Euro-         representatives of a wide range of sectors and decision envi-
pean settlers were most directly linked with trading routes,      ronments. We used cultural consensus analysis (CCA) (Rom-
while the British came to colonize South Africa (Oliver and       ney et al., 1986) to document this variation and to look for
Oliver, 2017). South Africa is also part of the African con-      patterns in user perceptions regarding the important factors
tinent; thus, the traditions and cultures were much more ter-     that make forecast products trusted and used.
restrial focused (Compton, 2011); the Khoisan people being
some of the few with a true and dependant relationship with
the coastal oceans (Kim et al., 2014). Here Khoisan refers to     3   Methods
the first indigenous peoples of southern Africa (Rito et al.,
2013). Recently, South Africa made an active step towards         CCA is a method that can reveal agreements among a group
focusing on the ecosystem services (blue economy) that their      of people as a reflection of shared knowledge (Romney et al.,
vast coastline can offer through a project called Operation       1986). Users’ unique mental models, organizations and cul-
Phakisa. Phakisa roughly translates to “hurry up” in Sesotho      tural domains result from specific practices and operational
(Findlay, 2018).                                                  contexts (refer to Sect. 2.2). Cultural consensus is an appro-
   The type of relationship users cultivate with the ocean,       priate method to assess cultural domains; in this case gaug-
and the resulting information need that is generated, is          ing the extent to which the practices and ocean use contexts
not only driven by geographical contexts but also by sec-         of recreational marine users are of the same cultural domain
toral differences that determine sociomaterial (linked human-     (i.e. they develop and share the same understandings about
technological) settings (Blair et al., 2020; Lamers et al.,       the factors that enhance forecast usability) as professional
2018). Marine meteorological forecast users engage with           users. CCA has been applied to study cultural populations
metocean information as a tool to mitigate risks. Attitudes       and knowledge domains in diverse fields, e.g. in public health
toward risks are a result of a constellation of individual and    (Garro, 1996; Strong and White, 2020; Weller et al., 2012),
cultural factors, tied to bias, attitudes, preferences and so-    natural resource management (Miller et al., 2004; Naves et
cietal influences and dominant world views (Douglas and           al., 2015), tourism studies (Paris et al., 2015; Ribeiro, 2011),
Wildavsky, 1982; Fischhoff et al., 1978; Kahan et al., 2012;      and studies of expert and lay knowledge (Van Holt et al.,
Lichtenstein and Slovic, 2006). These attitudes together can      2016; Medin et al., 2002; Reyes-García et al., 2014).
have a profound impact on the type of weather and climate            This study contributes to knowledge about human dimen-
information sought for decision-making (O’Connor et al.,          sions such as cultural values and understandings that influ-
2005; Kirchhoff et al., 2013). We also know that mariners         ence the direction of forecast products and services develop-
and the organizations underlying navigation develop dis-          ment. The consensus model can show shared understandings
tinctive traits based on unique mental models, organizations      among users of forecasts to reveal patterns of understanding
and decision cultures (Kirchhoff et al., 2013; Kuonen et al.,     and meaning that impact the adoption of services and prod-
2019), and these factors uniquely impact mariners’ infor-         ucts. An advantage of cultural consensus analysis is that a
mation needs (e.g. Wagner et al., 2020). Forecast services        small population of respondents can yield rich observations
are used in distinct ways in different sociomaterial settings,    and data regarding sector- (commercial and recreational) or

Geosci. Commun., 4, 361–381, 2021                                                      https://doi.org/10.5194/gc-4-361-2021
C. Rautenbach and B. Blair: Marine meteorological forecast perceptions 365
locality-specific (South African and New Zealand) views information was collected during the survey. The identities
and knowledge domains as they may exist among partici- of the participants are unknown, even to the authors, and thus
pants (Weller, 2007). The present study aimed to test the fully anonymized. No institutional nor funding agency ethi-
knowledge-domain differences between New Zealand and cal clearance was required.
South African user groups (as well as recreational versus
commercial users) toward what constitutes a salient forecast 3.2 Data analysis
service. There is a common perception that there does exist a
difference between these user groups, but no formal investi- The consensus model (Romney et al., 1986) estimates shared
gation has yet been done to confirm these suspicions. beliefs relying on three basic steps. First, it uses principal
component analysis (PCA) to test whether the responses are
3.1 Questionnaire consistent with an underlying shared model for the topics
covered in the survey. Eigenvalues are calculated to find a
In this study, recreational users include all participants who shared knowledge domain, determined by the presence of
do not use metocean forecasts as part of their daily work a single factor that explains most of the variation in the re-
or do not have a financial gain from the use of such plat- sponses, with a first to second eigenvalue ratio greater than
forms. Commercial users would then automatically be the or equal to 3.0. Secondly, the model provides a measure of
other users, who not only use the platform commercially individual knowledge for each respondent (a type of “com-
but also have responsibility linked with the understanding petence” in the specific shared mental model) by testing
and accuracy of these forecasts. The questionnaire asked the each respondent’s agreement with shared beliefs via a pro-
participant to identify themselves within one of these defi- portion match matrix that has been corrected for guessing.
nitions. The questionnaire was organized around four sub- And finally, it aggregates individual answers to questions
questions linking to our research questions (Q1 and Q2 in by weighting the final cultural model in favour of respon-
Sect. 1.1): dents with high competence. This set of responses produces
1. Which factors impact marine forecast uptake by marine the consensus-based result, an approximation of the collec-
users? tive knowledge of the group. The minimum sample size re-
quired for the consensus model depends on the level of agree-
2. What are the main requirements from users in the ma- ment, the number of informants and the validity of the aggre-
rine forecast environment? gated responses (Weller, 2007). For example, at a low-level
agreement of 50 % (mean competence score of 0.5) at 0.95
3. What is the user perception of existing wave forecasting validity, the minimum sample size is 28 people per group.
platforms? The same at 60 % agreement is 17 people. For data analysis,
4. How important will accurate metocean forecasts be in the present study used the match coefficient method, of the
the future (in light of climate change)? formal consensus model, in the UCINET software package
(Borgatti et al., 2002).
The questionnaire presented propositions in true/false for- Cultural consensus analysis uses “cultural competence”
mat developed around a diverse collection of 27 constructs. in very context-specific ways. Culture refers to shared sets
The constructs were selected in a workshop with experts in of learned knowledge and beliefs among a group of people.
the metocean forecast industry, based on issues that had fre- Competence is the individual’s level of expertise with regard
quently emerged in dealings with users in the past. The work- to the set of questions presented, indicating the proportion of
shop members were from the meteorological service of New items each person knows about the particular domain without
Zealand and the South African Weather Service (SAWS). moral judgement (Weller, 2007). Similarly, the method iden-
Contributing scientists’ competencies spanned atmospheric, tifies the “culturally correct answers” to propositions, from
hydrodynamic, and wave forecasting and observation knowl- consensus-based results or the most frequently held items of
edge. Some scientists also had experience in science commu- knowledge and belief.
nication and client liaison and familiarity with the decision
space (or operational context) of their respective user groups.
4 Results
The resulting propositions regarding these constructs, per re-
search question, were then collected and refined. 4.1 Participant demographics
The questionnaire was widely distributed. The question-
naire was advertised to both recreational and commercial In total there were 157 respondents to the questionnaire. New
users throughout both countries (New Zealand and South Zealand received 126 completed responses and South Africa
Africa). Coastal and ocean users emailing lists and websites received 31. These numbers proved to be sufficient for the
were used to spread the invitation as well as personal con- use of CCA, because the level of agreement (mean compe-
tacts. It is important to note that no ethical issues were en- tence scores ≥ 0.5) and eigenvalue ratios (>3.0) obtained in
countered during the present study. No personal, identifiable all cohorts (New Zealand, South Africa, commercial, recre-
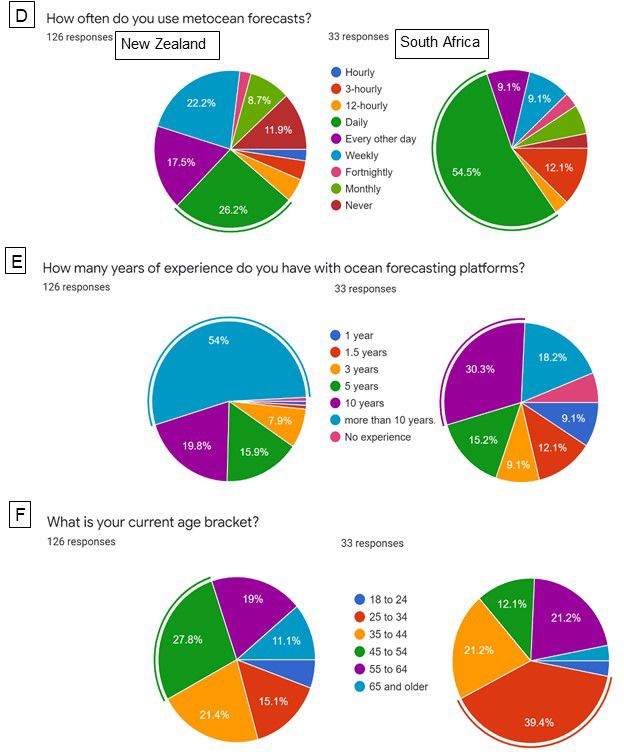
https://doi.org/10.5194/gc-4-361-2021 Geosci. Commun., 4, 361–381, 2021366 C. Rautenbach and B. Blair: Marine meteorological forecast perceptions ational users) were above the required 28 people per group 45 and 54 years old, while in South Africa the majority were (refer to Table 1). It was possible to establish consensus mod- between 25 and 34 years old. Both countries have a signifi- els despite the different participation rates and small sam- cant contribution from the age brackets between 35–44 and ple sizes, because in CCA validity is a function of level of 55–66 with New Zealand also having a significant number of agreement (Weller, 2007). A demographics-related section participants older than 65. was added as a part of the questionnaire. This enabled the In Fig. 2, question G was related to the actual activi- present study to have insights into some crucial information ties respondents (recreational and commercial) engaged in. that could explain trends observed in the CCA. These results Participants were also given the opportunity to add activi- are given in Figs. 1 and 2 and Appendix A. The questions are ties that were potentially not listed in the questionnaire. The listed from A to G together with the total responses. only two activities that stood out as not being listed, and In New Zealand most respondents classified themselves as thus recommended by a few respondents, were waterskiing recreational users (∼ 84 %). South Africa had a similar result and photography. In New Zealand most respondents use the but with a much larger percentage of respondents being com- ocean for fishing activities (31 %), while in South Africa mercial users (∼ 42 %) versus the majority recreational users most respondents were surfers (∼ 21 %). The other signifi- (∼ 57 %). These results are particularly interesting given the cant New Zealand activities were surfing (∼ 14 %), mariners next set of questions (refer to Appendix A, questions B and (∼ 11 %) and paddle craft users (∼ 9 %). The other promi- C). In New Zealand, most of the respondents did in fact have nent South African activities were search and rescue opera- both theoretical and practical ocean/maritime-related train- tions (∼ 18 %) and scientific studies (∼ 18 %). The question- ing (∼ 70 % and 68 % respectively). Even more so in South naire also asked how many years of experience each respon- Africa, with ∼ 73 % and 82 % of respondents receiving theo- dent had in ocean-related activities (these are activities and retical and practical training respectively. Thus, it is not only not the use of forecasting platforms indicated in Fig. 1, ques- individuals engaging with the ocean in a professional man- tion E). For the New Zealand users, 81 % indicated more than ner that received ocean-related training at some point in their 10 years of experience, while South African users revealed lives. This could also mean that even though people work ∼ 60 % with more than 10 years of experience, ∼ 18 % with in an ocean-related industry (technically commercial users), 10 years of experience and ∼ 12 % with 5 years of experi- their relationship with metocean forecasts are for recreational ence. For both countries, very few respondents had less than purposes. There thus might also exist a disconnect between 3 years of experience in ocean-related activities. In Fig. 2 metocean forecasts used professionally (possibly from other the participant distribution in both New Zealand and South specialized, commercial providers and not the same tools Africa is provided. used recreationally) versus freely available tools, platforms In Fig. 3 the participant distribution in both South Africa and products. These thoughts then lead to the next section of and New Zealand is given. As a final note on the geographical questions related to metocean forecasting platform usage and context, ∼ 50 % of New Zealand respondents were from the experience (refer to Fig. 1, questions D and E). Auckland district, ∼ 16 % from the Waikato district, ∼ 11 % In New Zealand the most popular frequency of use ranged from Wellington and ∼ 10 % from Northland. Representa- between daily, weekly and every other day (∼ 26 %, 22 % tion was also received from the other districts (both on the and 18 % respectively). In South Africa most of the usage North Island and South Island). In South Africa most respon- was daily (∼ 55 %), then 3-hourly (∼ 12 %) and every other dents were from the Western Cape province. More specif- day (∼ 9 %). From these results it seems that most people ically, ∼ 49 % from Table Bay and the Atlantic Seaboard, will only look at a forecast once a day, probably for plan- ∼ 15 % from Kommetjie–Cape Point and ∼ 9 % from Si- ning purposes. This agrees with the finding of Silver (2015), mon’s Town in False Bay (also the location of the South where they found that people might consult a forecasting ser- African Navy headquarters). Very few to no participation was vice once during the planning of an outdoors activity. In the received from the eastern provinces of South Africa. context of this study, it will be an ocean- and coastal-related It should be mentioned that the participants were also activity. While South African participants consult forecasts questioned regarding their trust in, and perceptions of, their at a higher frequency, New Zealand participants had much own national weather services. In South Africa it is the more experience compared to the South African respondents: South African Weather Service (SAWS) and in New Zealand ∼ 54 % of New Zealand respondents had over 10 years of ex- the MetService. The greatly diverging perceptions in the perience using metocean forecasting platforms, and ∼ 20 % two groups, regarding their own national weather services had 10 years of experience (refer to Fig. 1, question E). In provider, may present pre-existing biases that would have to South Africa the majority of respondents had 10 years of ex- be addressed subsequently in the consensus analysis. These perience (∼ 30 %) with ∼ 18 % more than 10 years of ex- questions were regarding the meaning of salient services. perience. In general, South Africa had more diversity in age However, both institutes were evaluated very highly and were with a larger contingent with less than 3 years of experience. found to be trustworthy (agreement: New Zealand, NZ, 75 %, These results correspond to the age of participants in Fig. 1, South Africa, SA, 61 %), reputable (NZ 77 %, SA 58 %), question F. In New Zealand most respondents were between high quality (NZ 68 %, SA 84 %) and reliable (NZ 71 %, Geosci. Commun., 4, 361–381, 2021 https://doi.org/10.5194/gc-4-361-2021
C. Rautenbach and B. Blair: Marine meteorological forecast perceptions                                                                                                    367

Table 1. Cultural consensus analysis, group mean competence scores and eigenvalue ratios of the first to second factors for each study region
and sector. An individual’s competence score is the probability that the informant knows (not guesses) the answer to a question, and it is
a value between 0 and 1. A group’s average estimated competence score above 0.5 indicates moderate agreement in the group, pointing to
an underlying model of shared knowledge. Five consensus models were calculated (column 1); for each consensus model, the breakdown
of mean competence scores along group membership is shown for comparison. Conclusions regarding the consensus model are based on
criteria by Caulkins and Hyatt (1999). Here, SD refers to the standard deviation.

  Scope of analysis         Eigenvalue    Mean competence     Mean competence   Mean competence     Mean competence     Mean competence        Negative   Conclusions
                                  ratio         score (SD)    score (SD):            score (SD):         score (SD):          score (SD):    competence
                                                              South Africa         New Zealand      commercial users    recreational users       scores
  Whole-group                     6.34          0.53 (0.17)   0.61∗ (0.12)            0.51 (0.18)         0.53 (0.19)          0.53 (0.17)           1    Coherent
  consensus model                                                                                                                                         model; moder-
  (all respondents)                                                                                                                                       ate agreement
  N = 157
  South Africa                    8.04          0.61 (0.12)   –                                –           0.6 (0.12)           0.6 (0.13)           0    Coherent
  consensus model                                                                                                                                         model; strong
  N = 31                                                                                                                                                  agreement
  New Zealand                     5.36          0.50 (0.18)   –                                –          0.45 (0.20)          0.51 (0.17)           3    Non-coherent
  consensus model                                                                                                                                         model;
  N = 126                                                                                                                                                 multicentric,
                                                                                                                                                          contested
  Commercial users’               4.82          0.52 (0.21)   0.62∗ (0.12)            0.44 (0.23)                  –                    –            1    Non-coherent
  consensus model                                                                                                                                         model; weak
  N = 34                                                                                                                                                  agreement
  Recreational users’              6.4          0.53 (0.17)   0.62∗ (0.13)            0.52 (0.17)                  –                    –            1    Coherent
  consensus model                                                                                                                                         model; moder-
  N = 123                                                                                                                                                 ate agreement
 ∗ significant at p
C. Rautenbach and B. Blair: Marine meteorological forecast perceptions
https://doi.org/10.5194/gc-4-361-2021
Table 2. Level of consensus measured by the frequency of culturally correct answers (CCA) for all propositions. The whole-group CCA is based on the analysis of the entire dataset
consisting of all respondents; the culturally correct answer set (consensus model) is shown as either true/agreement (with a tick) or false/disagreement (with a cross). Numeric values
are percent of responses matching the whole-group CCA in the relevant subgroups. Where a subgroup’s own consensus model (consensus analysis run separately only with members)
deviates from the whole-group CCA, the added icon shows the correct answer in the subgroup.
Topic areas Research questions and propositions Whole-group NZ SA Recreational users Commercial users
CCA subgroup subgroup subgroup subgroup
Which factors impact marine forecast uptake by
marine users?
Ease of use The visual experience offered by a forecast X 84 90 85 88
Easily cross-referenced ge- Easy access to location of interest X 64 55 63 59
ographical parameters
Number of clicks Number of clicks to relevant information (less is X 81 84 80 85
better)
Easily cross-referenced Easy access to variable of interest X 77 84 77 82
physical parameters
Institutional reputation Whether provider is an established entity or a × 56 X 55 X
“newcomer”1
Terminology Use of jargon or scien- Intimidating2 X 56 84 59 71
tific terminology makes
a forecasting site. . .
Untrustworthy × 90 90 90 91
Marketing Word of mouth and recommendation by peers X 90 97 92 88
Accuracy Inaccurate forecasts (loss of trust in provider) X 74 71 74 71
Geosci. Commun., 4, 361–381, 2021
Consistency The consistency of inaccuracies (forecast can still X 66 74 67 68
be useful if consistent)3
Community engagement Interactive features (ability to submit photos, info X 48 61 49 56
is better)
Simple metrics Simplified concepts, graphs and plots, and X 70 74 72 65
easy-to-understand quick uptake scaling of
metocean conditions
Intuition experience User’s own intuition as a part of the safety calculus X 73 84 77 68
or decision-making when predicting conditions
368Table 2. Continued.
Topic areas Research questions and propositions Whole-group NZ SA Recreational users Commercial users
CCA subgroup subgroup subgroup subgroup
What are important requirements from users in the
marine forecast environment?
Speedy answers The length of time taken between navigating to a X 86 100 87 94
forecast service and arriving at the desired data
Bespoke forecast Customizable preferences to facilitate faster X 93 94 92 97
access to desired information
Forecasting horizon A forecasting period between 3 and 7 d X 92 97 93 91
Training Training in the science behind and use of marine X 56 65 55 65
forecasts
https://doi.org/10.5194/gc-4-361-2021
What is the user perception of existing wave
forecasting platforms?
Public platforms have a high reputation X 85 94 87 85
(e.g. Windy, Windguru, among marine users
Magicseaweed and
Buoy Weather). . .
are reliable for most lo- X 65 61 71 ×
cations in the nearshore
are most useful further × 61 48 64 X
away from the coastline
have a likeable visual X 87 94 87 94
appeal
C. Rautenbach and B. Blair: Marine meteorological forecast perceptions
How important will accurate metocean forecasts
be in the future?
Reliability Reliable metocean forecasts will be even more X 82 94 85 79
important
Consequences The consequences of mis-predictions will be more X 73 65 72 68
severe
Climate change Climate change is making the ocean more difficult X 48 68 51 53
to predict
Institutional reputation The scientific reputation of forecast providers will X 75 81 76 79
become more important
Scientific support Science-based forecasts will be more important in X 87 90 87 88
the future.
Training Climate change will make an understanding of the X 75 100 78 88
science behind ocean forecasts more important
1 Respondents suggested that while familiarity and established trust in a provider can encourage uptake of services, users are open to newcomers and view some of their products as very trustworthy. 2 The New Zealand
Geosci. Commun., 4, 361–381, 2021
369
and recreational user subgroups indicated that users are generally able to figure out the meaning of technical terminologies. 3 Respondents noted that while in such cases the forecast can still be useful, the inaccuracies
decrease usefulness.370 C. Rautenbach and B. Blair: Marine meteorological forecast perceptions Figure 1. Summary of demographic questions related to the present study. Here questions D to F are given with questions A to C given in Appendix A, together with their results. not represent meaningful numeric values beyond communi- the highest levels of agreement with other respondents and cating relative distance between objects. Those who had high therefore the highest competence scores. Respondents who levels of agreement with each other are situated close to each are more peripheral and scattered outside the blue zone had other, while those who had high levels of disagreement are lower competence scores: the farther away their location, scattered proportionally farther apart. The blue oval gives an the lower their score. These individuals frequently answered approximate grouping of all respondents who had a compe- propositions differently than the consensus model. Peripheral tence score of 0.6 or higher. The stress value is the distortion individuals located on opposite sides of the plot had high that occurs when data are transposed over multiple dimen- levels of disagreement not only with the consensus model sions. These values are reported in the figure captions and in but also with each other. South African respondents who are all cases meet criteria set by Sturrock and Rocha (2000). outside of the blue zone are still located relatively close to The whole-group consensus model (refer to Fig. 4) indi- the centre, compared with the outliers farthest away who be- cates that most South African respondents (red squares) clus- long in the New Zealand subgroup. New Zealand commercial ter closer and centrally located together with New Zealand users are disproportionately represented on the outside of the respondents (blue squares), who have high individual com- blue oval (13 of 20 individuals) in Fig. 4, aligning with find- petence scores. This group, at the centre of the plot, had Geosci. Commun., 4, 361–381, 2021 https://doi.org/10.5194/gc-4-361-2021
C. Rautenbach and B. Blair: Marine meteorological forecast perceptions                                                         371

Figure 2. Summary of demographic questions related to question G.

ings based on patterns of agreement and mean competence             the issues did not conform well to that of other cohorts (refer
scores (Table 1) in the various subgroups.                          to Table 1).
   Country/sector-specific and community-specific analyses             In the next section we present the answers (the consensus
revealed that commercial users from New Zealand have                results) in each group of analysis, for a comparative analysis
unique patterns of agreement, independent of whether the            of the ways in which locality (national affiliation) and sec-
analysis includes fellow New Zealand users such as in the           toral affiliation resulted in the same or different answers to
New Zealand consensus model with mixed sectors (Fig. 5a)            our questions.
or South African users in the commercial users model with
mixed geographies (Fig. 5d). The visualizations indicate
                                                                    4.2.2   The consensus model: factors that impact user
that commercial users from New Zealand scatter outside
                                                                            uptake of metocean services
the blue oval in disproportionate numbers. Commercial and
recreational users from South Africa demonstrated equally           Table 2 presents the results of the survey. These are the direct
high levels of competence in their shared consensus model           questions and resulting propositions that were distributed in
(Fig. 5b). When the South African commercial and recre-             the survey and form the basis of the present study. The col-
ational user groups were analysed in sector-specific con-           umn titled “Whole-group CCA” is based on the consensus
texts with their New Zealand counterparts (commercial and           analysis of all respondents together, and it shows the ag-
recreational users consensus models), both groups demon-            gregate group belief (culturally correct answer) with either
strated significantly higher shared competence scores than          agreement (tick) or disagreement (cross) with the propo-
New Zealand participants (see also Fig. 5c). This means that        sitions. The other columns indicate the percent frequency
South African respondents have a more homogenous shared             of matching answers (or agreement with the whole-group
mental model among themselves, and they share high lev-             CCA), in each subgroup. In case a subgroup’s own consensus
els of agreement with New Zealand users who attained high           model (consensus analysis run only including its members)
competence scores. Further studies are needed that explore          produced a group belief that deviates from the whole-group
the knowledge domain of New Zealand commercial users,               CCA, the added icon indicates the correct answer in the sub-
with regards to forecast needs and perceptions about existing       group.
services. In this study the number of participants in this co-         The first research question explored which factors impact
hort was too low for a separate consensus analysis. For now,        marine forecast uptake by marine users. These factors range
the conclusion is made that this cohort’s understanding on          from aesthetics to practical considerations, like the number

https://doi.org/10.5194/gc-4-361-2021                                                     Geosci. Commun., 4, 361–381, 2021
372 C. Rautenbach and B. Blair: Marine meteorological forecast perceptions Figure 3. (a) South African and (b) New Zealand participant distribution. of clicks required to get to the required information. All users increase. It is also interesting to note that if a forecast is in- and regions rate the ease of use as being very important. This accurate, there is a significant proportion of the user com- includes easy navigation and ergonomics of the tool or site. munities that would not necessarily stop using the forecast, The opinion of others is also important to all users. So, if as long as the inaccuracies are consistent. The South African a site is being promoted through a community via word of and commercial user subgroups agreed that services from es- mouth, uptake and usage of the forecasting site or tool will tablished entities are trusted more than those offered by new- Geosci. Commun., 4, 361–381, 2021 https://doi.org/10.5194/gc-4-361-2021
C. Rautenbach and B. Blair: Marine meteorological forecast perceptions                                                               373

Figure 4. Nonmetric, multidimensional scaling of agreement in the whole-group analysis (stress = 0.264). The blue oval at the centre is an
approximate grouping of respondents whose competence score was 0.6 or greater.

comers, while all subgroups agreed that intuition (in combi-           pology for salient forecast services that spans geographic
nation with forecast products) helps to keep operations safe.          and sectoral contexts, to the extent it is possible. In doing
   When considering the requirements from users, speedy an-            so, we also aimed to establish subgroup-level perceptions
swers were strongly agreed upon, so much so that 100 %                 that are unique to specific contexts among metocean fore-
of South African respondents, regardless of sectoral affilia-          cast users. Using two Southern Hemisphere countries as test
tion, agreed. All users agreed on a preferred forecast horizon         cases, some shared fundamental factors in salient forecasts,
(3–7 d) and that training on the use of products is needed.            and context-specific distinctions were thus confirmed. Nu-
The conviction about training was not as strong as the other           merous studies acknowledge varying user needs and opin-
propositions, with the sentiment strongest expressed by all            ions but the delineation between recreational and commer-
South African users and the commercial user’s subgroup.                cial users has not been suggested or illustrated before. Un-
Well-known wave forecasting platforms are trusted and en-              derstanding user needs is very well understood in other com-
joyed by all user groups, but perceptions about the location of        mercial industries, but in the everyday metocean forecasts
highest accuracy varied. The fourth and final research ques-           the connection between research, products and user needs
tion is related to climate change and the uncertainties associ-        is not well established. This is even more so in the South-
ated with it. All groups and subgroups agreed that reliability         ern Hemisphere, in everyday (non-extreme) forecasting do-
of metocean forecast will be more important in the future,             mains. Drawing the results together into a clear discussion
and the role of training in forecast use will be even more sig-        requires the consideration of all the results, including the de-
nificant for safe operations. Consensus was weak, however,             mographic description provided in Sect. 4.1. The discussion
around an overall agreement that climate change impacts will           will follow the results presented in Table 2 and draw on all
make the ocean more difficult to predict.                              the other results to elucidate user perceptions, usability and
                                                                       uptake.
                                                                          Another interesting outcome was the user relationship
5   Discussion                                                         with the organization or institution providing the forecast.
                                                                       In the past, users knew of state-owned research institutes
The results presented in Sect. 4 elucidated numerous inter-            with well-established reputations. This instilled trust from
esting behaviours within regional (or sector) groups as well           the users without much question. When new and unknown
as community groups. Part of the aims of the present study             companies brought new products (especially science-related
was to explore the existence of a common or global ty-

https://doi.org/10.5194/gc-4-361-2021                                                          Geosci. Commun., 4, 361–381, 2021
374 C. Rautenbach and B. Blair: Marine meteorological forecast perceptions Figure 5. Nonmetric, multidimensional scaling of agreement in the subgroups. Blue oval at centre is an approximate grouping of respon- dents whose individual competence score was 0.6 or greater. (a) New Zealand ocean users (stress = 0.263); (b) South African ocean users (stress = 0.237); (c) recreational ocean users (stress = 0.258); (d) commercial ocean users (stress = 0.207). products) to the market, users were sceptical (Li et al., tions. The demographics presented in Sect. 4.1 supports this, 2008). Through the development of technology, the pub- as a significant number of users had a lot of experience lic has grown accustomed to providers that they have never with coastal and ocean activities and with metocean forecast- heard of before. Apps, websites and online shopping have ing platforms. Consistently inaccurate forecasts were also changed the way society sees the world and inevitably their mainly perceived as being useful. This also testifies to more trust relationship with tools, products and services. This is re- experienced users as they will be able to recognize recurring flected in the survey results, where the total CCA knowledge inaccuracies and knowingly compensate for these. For ex- model disagreed on whether an institution is established or ample, if a significant wave height forecast for a particular not matters much. The South African and commercial user region is always underpredicted, the users (through experi- subgroups did, however, agree with this statement, aligning ence) can compensate for it. If the inaccuracy is erratic, this with findings from an investigation of the trust in Environ- becomes impossible. The recreational surfing community is ment Canada’s forecasting products (Silver, 2015). There- a good example of a community that applies local knowledge fore, evidence suggests that commercial users do still require daily to compensate for model and forecast inaccuracies. institutional reputation, probably because there will be con- This community tends to be expert metocean forecast users sequences for them based on the reliability of the forecast. and have learnt how to interpret particular synoptic-scale Scientific integrity will continue to be an important factor in events and forecasts to sufficient accuracies of metocean con- users’ trust in products and services and therefore in their ditions in the nearshore. Their interpolation (of wave condi- uptake. tions from the offshore to the nearshore) also exceeds most All user subgroups confirmed that their own intuition plays high-resolution models and (mostly) unknowingly compen- an important role in predicting conditions and safe opera- sate for various coastal processes (like friction, refraction, Geosci. Commun., 4, 361–381, 2021 https://doi.org/10.5194/gc-4-361-2021
C. Rautenbach and B. Blair: Marine meteorological forecast perceptions                                                           375

shoaling, etc.). The same reasoning applies to most commer-            Although everyday use of the coastal ocean in South
cial users (including search and rescue operators).                 Africa is evident (de Vos and Rautenbach, 2019), the vast
   The importance of a bespoke forecast was highlighted by          majority of the public is not as closely linked with the ocean
very high levels of agreement (>90 %) among respondents.            as Kiwis (New Zealanders) are (refer to Sect. 2). This cul-
This aspect of forecast delivery is still underexplored by nu-      tural difference was also observed in the present study where
merous metocean forecast providers and thus requires inves-         a greater contingency of the survey participants in South
tigation and further development. A 3 to 7 d forecast horizon       Africa were commercial users. These also include members
seemed to be preferable for most users. Much like the farm-         of the public who have a more direct technical relationship
ing community, there still exists the need for longer-term and      with the ocean. Even though the New Zealand population
seasonal-scale forecasts as well. These are predominantly           is approximately 10 times smaller than South Africa, the
used for planning purposes by aquaculture farmers, coastal          present study survey obtained approximately 4 times more
hazard assessments and governance authorities (Alexander et         interest in New Zealand, illustrating the influential role of the
al., 2020). But for most users, who also use metocean fore-         ocean among New Zealanders. The distinct consensus pat-
casts daily (refer to Sect. 4.1.), short-term forecasts are most    terns obtained in this study present an image of South African
useful, probably due to pragmatic activity planning purposes        users who are quite homogenous in their understanding of
(Silver, 2015).                                                     salient forecast products and user needs. The New Zealand
   Well-known metocean forecasting platforms were well-             recreation cohort, though a remarkably heterogeneous sec-
reviewed on reputation and visual appeal. These platforms           tor that includes a diversity of ocean uses, still exhibited a
do not necessarily conduct independent research on model            moderate-level agreement with the consensus model (both in
calibration, validation or improvements in the underlying           the country- and sector-specific models). It is noteworthy that
physics. They generally repackage freely available forecast         New Zealand commercial users had weak levels of agree-
products in an easy to understand and ergonomic fashion.            ment in all consensus models. This could be due to the larger
The features of most of these sites are user-centrically de-        range of participants (and thus ocean activities), representing
signed and thus enjoy high esteem from all users (as con-           a wider variety of commercial users (refer to Fig. 2, ques-
firmed by the present study as well). Most of these repack-         tion G).
aged, freely available products are not accurate or reliable in        One limitation of the present study pertains to the method
the nearshore. This is due to model resolution and the pres-        with which the concepts used, as propositions in the sur-
ence of land. Both atmospheric and oceanographic param-             vey, were adopted. We used an expert workshop and liter-
eters do not take nearshore topography or bathymetry into           ature review to brainstorm statements to include in the sur-
account and can thus not solve the relevant physics with high       vey. Although these statements were compiled based on pre-
enough detail. The degree to which these models are inaccu-         vious first-hand engagements with users, and the experts in-
rate will vary depending on the coastal location. The com-          volved had many years of combined experience around the
mercial user subgroup CCA model was the only cohort that            topic, the most ideal setting would have involved dedicated
disagreed with the proposition that these models or platforms       focus group discussions or in-depth interviews with users to
are reliable in the nearshore. This is an indication that com-      elicit a list of concepts for the survey. Such a workshop was
mercial users are more aware of the underlying assumptions          planned but made impossible due to the evolving Covid-19
of these models. This is also reflected in the South African        situation. The survey represented what amounted to current
cohort, as their commercial representation was larger (refer        thought on the subject, and these new perspectives from two
to Sect. 4.1). These models are in fact more useful and accu-       Southern Hemisphere countries, with different cultures, still
rate further away from land and again the general knowledge         demonstrated numerous coherent opinions and perceptions.
base disagreed with this. Only the commercial users agreed          The valuable insights presented here are useful for both lo-
with this, theoretically, correct statement.                        cal and global forecast agencies who must cater for a global
   This perception or sentiment indicates that all users have a     market and public good.
concept of the unknown related to climate change and the fu-
ture, in general. Interestingly, when it comes to the uncertain-    5.1   A general conceptual user decision quality
ties of the future, all users and subgroups agree that scientific         framework
reputation is important. This indicates that users understand
that scientific rigour is needed to analyse and accurately ac-      To summarize the lessons learnt from engagement with the
count for possible change. This is supported by the topical         user of metocean information, the following conceptual ma-
area postulations regarding institutional reputation, scientific    trix is presented. Here, it is asserted that users’ decision qual-
support and training. One-hundred percent of South African          ity is a function of the service provider’s awareness of user
users, across both communities, agree that training will be         needs and the accuracy, consistency and salience (how fore-
required in the future to help users understand the science         cast is packaged and communicated) of a product. Decision
behind ocean forecasts.                                             quality is defined as the users’ ability to make informed deci-
                                                                    sions correctly. Thus, the user is empowered to make the cor-

https://doi.org/10.5194/gc-4-361-2021                                                      Geosci. Commun., 4, 361–381, 2021
You can also read