How modelling paradigms affect simulated future land use change
←
→
Page content transcription
If your browser does not render page correctly, please read the page content below
Earth Syst. Dynam., 12, 211–231, 2021
https://doi.org/10.5194/esd-12-211-2021
© Author(s) 2021. This work is distributed under
the Creative Commons Attribution 4.0 License.

                                How modelling paradigms affect
                                simulated future land use change
                                    Calum Brown1 , Ian Holman2 , and Mark Rounsevell1,3
            1 Institute
                      of Meteorology and Climate Research, Atmospheric Environmental Research (IMK-IFU),
            Karlsruhe Institute of Technology, Kreuzeckbahnstraße 19, 82467 Garmisch-Partenkirchen, Germany
       2 School of Water, Energy and Environment, Cranfield University, Vincent Building, Bedford MK43 0AL, UK
                         3 School of Geosciences, University of Edinburgh, Edinburgh EH8 9XP, UK

                                    Correspondence: Calum Brown (calum.brown@kit.edu)

                                        Received: 6 July 2020 – Discussion started: 6 August 2020
                          Revised: 17 January 2021 – Accepted: 19 January 2021 – Published: 23 February 2021

      Abstract. Land use models operating at regional to global scales are almost exclusively based on the single
      paradigm of economic optimisation. Models based on different paradigms are known to produce very different
      results, but these are not always equivalent or attributable to particular assumptions. In this study, we compare
      two pan-European integrated land use models that utilise the same climatic and socio-economic scenarios but
      which adopt fundamentally different modelling paradigms. One of these is a constrained optimising economic-
      equilibrium model, and the other is a stochastic agent-based model. We run both models for a range of sce-
      nario combinations and compare their projections of spatially aggregate and disaggregate land use changes and
      ecosystem service supply levels in food, forest and associated environmental systems. We find that the mod-
      els produce very different results in some scenarios, with simulated food production varying by up to half of
      total demand and the extent of intensive agriculture varying by up to 25 % of the EU land area. The agent-
      based model projects more multifunctional and heterogeneous landscapes in most scenarios, providing a wider
      range of ecosystem services at landscape scales, as agents make individual, time-dependent decisions that reflect
      economic and non-economic motivations. This tendency also results in food shortages under certain scenario
      conditions. The optimisation model, in contrast, maintains food supply through intensification of agricultural
      production in the most profitable areas, sometimes at the expense of land abandonment in large parts of Europe.
      We relate the principal differences observed to underlying model assumptions and hypothesise that optimisation
      may be appropriate in scenarios that allow for coherent political and economic control of land systems, but not in
      scenarios in which economic and other scenario conditions prevent the changes in prices and responses required
      to approach economic equilibrium. In these circumstances, agent-based modelling allows explicit consideration
      of behavioural processes, but in doing so it provides a highly flexible account of land system development that
      is harder to link to underlying assumptions. We suggest that structured comparisons of parallel and transparent
      but paradigmatically distinct models are an important method for better understanding the potential scope and
      uncertainties of future land use change, particularly given the substantive differences that currently exist in the
      outcomes of such models.

Published by Copernicus Publications on behalf of the European Geosciences Union.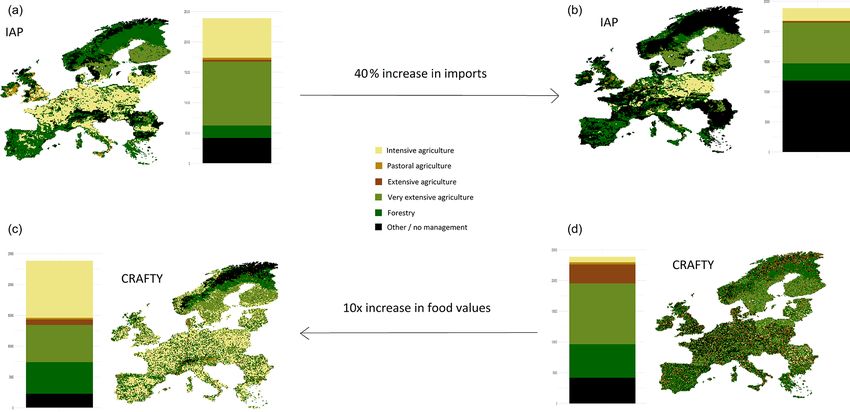
212                                       C. Brown et al.: How modelling paradigms affect simulated future land use change

1   Introduction                                                   Alexander et al. (2017), for instance, found that model type
                                                                   explained more variance in model results than did the cli-
Computational models of the land system make essential             matic and socio-economic scenarios, but they were not able
contributions to the exploration of environmental and socio-       to determine exactly why.
economic changes, supporting efforts to limit climate change          These previous comparisons reveal a major challenge: the
and reverse biodiversity loss (Harrison et al., 2018; Rogelj et    shortage of models that take distinct approaches in similar
al., 2018). Such models are particularly useful for exploring      geographical and thematic areas, which would therefore al-
conditions that do not currently exist and therefore cannot be     low for more controlled and informative comparison exer-
observed, as well as for understanding past and present land       cises. Most established models, especially those operating
use impacts (Filatova et al., 2016; Smith et al., 2019). As a      over large geographical extents, share a basic approach that
result, the scope and complexity of land system models have        optimises land use against economic, climatic and/or envi-
been steadily increasing, with many now representing multi-        ronmental objectives. Technical and geophysical constraints
ple land sectors (e.g. agriculture, forestry and urbanisation)     are often treated in detail, while social, institutional and
within an Earth system context (e.g. incorporating economic,       ecological factors are rarely included (Brown et al., 2017;
climatic, hydrological and energy systems) (Harrison et al.,       de Coninck et al., 2018; Obermeister, 2019). Large areas of
2016; Kling et al., 2017; Pongratz et al., 2018).                  system behaviour remain underexplored as a result (Brown
   Nevertheless, simulating expected or desired future             et al., 2016; Huber et al., 2018; Meyfroidt et al., 2018), with
changes under novel circumstances remains a substantial            the likely consequence that established findings have implicit
challenge. Because comparable alternative findings are rare,       biases and blind spots. These can be especially problematic
model results often go unchallenged and may be misinter-           for the simulation of future scenarios in which neglected as-
preted as predictions of how the future will develop rather        pects of land system change become prominent (Estoque et
than projections dependent upon underlying assumptions             al., 2020) and can be partially if not fully revealed by struc-
(Low and Schäfer, 2020). This could be particularly mislead-       tured comparison exercises.
ing in social systems such as those underpinning human land           In this article, we take advantage of the development of
use, wherein no universal laws or predictable patterns exist       two conceptually distinct but practically equivalent models
to guide the representation of human behaviour in models.          of the European land system to make a direct comparison
Modellers must therefore choose between a range of con-            between alternative modelling paradigms. We use the term
tested theoretical foundations, practical designs and evalua-      “modelling paradigm” here to refer to a methodological ap-
tion strategies (Brown et al., 2016; Meyfroidt et al., 2018;       proach that is based on a distinct theoretical description of
Verburg et al., 2019).                                             the system in question: in this case “top-down” and “bottom-
   In this complex context, the proper analysis and interpre-      up” approaches frequently identified as paradigms in the lit-
tation of model outputs are just as important as proper model      erature (Brown et al., 2016; Couclelis, 2002). These mod-
design but have received less attention. Steps such as stan-       els, an Integrated Assessment Platform (IAP) and an agent-
dardised model descriptions, open access to model code, ro-        based model (ABM) share input data to run under the same
bust calibration, evaluation and verification, benchmarking,       internally consistent scenario combinations. The former is a
and uncertainty and sensitivity analyses are all necessary to      constrained optimising economic-equilibrium model, and the
ensure that model results are interpreted appropriately (Bal-      latter is a stochastic behavioural model. We run both mod-
dos and Hertel, 2013; Sohl and Claggett, 2013). Currently,         els for combinations of Representative Concentration Path-
few if any of these steps are taken universally and rigorously     way (RCP) climate scenarios and Shared Socioeconomic
in land use science (van Vliet et al., 2016; Brown et al., 2017;   Pathway (SSP) socio-economic scenarios (O’Neill et al.,
Saltelli et al., 2019). This study focuses on one in particu-      2017), and we compare their projections of territorial and ag-
lar: the comparison or benchmarking of independent land use        gregate land use change and ecosystem service provision. We
models against one another.                                        use this analysis to understand the effects and importance of
   Comparison is especially important for land use models          the different assumptions contained in each model for sim-
because a range of very different conceptual and technical         ulated land use futures and draw general conclusions about
approaches could be valid for simulating social–ecological         the contributions of both approaches to understanding land
dynamics (Filatova et al., 2013; Brown et al., 2016; Elsawah       system change.
et al., 2020). In the absence of fair comparisons, it is im-
possible to objectively choose between these approaches or
to identify the assumptions on which their outputs are most        2   Methods
conditional. However, while comparisons of model outputs
have been made (Lawrence et al., 2016; Prestele et al., 2016;      This paper uses two contrasting models of the European land
Alexander et al., 2017), their ability to link particular out-     system: CRAFTY-EU (Brown et al., 2019b) and the IM-
puts to particular methodological choices has been limited by      PRESSIONS Integrated Assessment Platform (IAP) (Har-
the sheer number of differences between individual models.         rison et al., 2015, 2019). Both models cover all European

Earth Syst. Dynam., 12, 211–231, 2021                                                https://doi.org/10.5194/esd-12-211-2021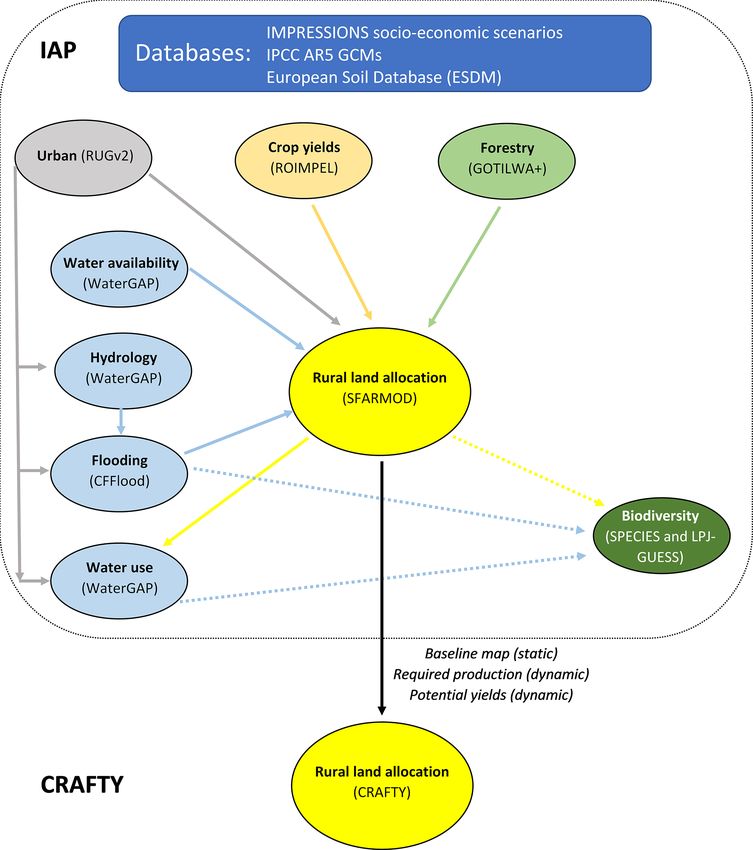
C. Brown et al.: How modelling paradigms affect simulated future land use change                                              213

Union member states except Croatia, and they also cover             (Arneth et al., 2014) to simulate land use change over
the UK, Norway and Switzerland. The IAP’s simulated base-           large geographical extents while capturing key behaviours
line land use map, land use productivities, scenario condi-         of decision-making entities (agents) that include individual
tions and ecosystem service provision levels were used in           land managers, groups of land managers, and institutions or
CRAFTY-EU, making them uniquely equivalent examples of              policy bodies (Holzhauer et al., 2019). Modelled land man-
different modelling paradigms (Fig. 1). Both models were            ager agents compete for land on the basis of their abilities
run for a subset of socio-economic and climatic scenario            to produce a range of ecosystem services that society is as-
combinations, and their outputs were systematically com-            sumed to require. In CRAFTY-EU, these services include
pared, as described below.                                          provisioning (food crops and meat, timber), regulating (car-
                                                                    bon sequestration), cultural (recreation) and supporting ser-
2.1   Model descriptions
                                                                    vices (habitat provision through landscape diversity). The
                                                                    abilities of agents to supply these services under given bio-
IMPRESSIONS IAP is an online model of European land                 physical and socio-economic conditions are derived either
system change that incorporates sub-models of urban devel-          from IAP model results (Fig. 1) or from basic assumptions
opment, water resources, flooding, coasts, agriculture, forests     linking land uses to service levels, as explained in Brown
and biodiversity. Within this cross-sectoral modelling chain,       et al. (2019b). Satisfying demands for services brings eco-
rural land use is allocated within 30-year time slices ac-          nomic and non-economic benefits to individual agents, with
cording to a constrained optimisation algorithm that main-          benefits quantified as functions of unsatisfied demand. In this
tains equilibrium between the supply and demand for food            case, these functions are linear and equivalent for all ser-
and (as a secondary objective) timber by iterating agricul-         vices, meaning that the benefit of production of each ser-
tural commodity prices (cereals, oilseeds, vegetable protein,       vice increases equally per unit of unmet demand, providing
milk, meat, etc.) to promote agricultural expansion or con-         a clear basis for model comparison. Economic benefit repre-
traction (Audsley et al., 2015). This model therefore aims to       sents income from marketable goods and services, and non-
satisfy food demand (taking account of net imports) and does        economic benefit represents a range of motivations from sub-
so optimally subject to constraints imposed by biophysical          sistence production to the maintenance of societal, cultural
and socio-economic conditions. Calculations are carried out         or personal values associated with particular services or land
across overlapping geographically unstructured clusters of          uses. Ecosystem service production levels are determined by
cells with similar biophysical conditions (based on soil and        the natural productivity of the land and the form and inten-
agroclimate), with profitability thresholds used to determine       sity of agents’ land management. The outcome of the com-
which land use and management intensity offer the greatest          petitive process at each annual time step is determined by
returns across each cluster. Land use proportions within each       agent-level decision-making that is not constrained to gener-
100 × 100 grid cell represent the aggregations of the optimal       ate the greatest benefit, and agents are parameterised here to
solutions for each (up to 40) associated cluster. At cell level,    continue with land uses that provide some return rather than
this aggregation therefore represents the (spatially weighted)      abandon their land but to gradually adopt significantly more
optimised land use solution for each cluster containing the         beneficial alternatives if available.
grid cell in question. The clustering recognises that different        Importantly for this study, CRAFTY-EU is parameterised
biophysical conditions (soil and agroclimate) differentially        on the basis of the IAP, taking IAP outputs as exogenous
influence the suitability, productivity and profitability of dif-   conditions and replacing only the land allocation compo-
ferent crops and different agricultural systems (arable, dairy,     nent to provide alternative land use projections under iden-
etc.), leading to heterogeneity in agricultural land use within     tical driving conditions (Fig. 1). CRAFTY-EU is initialised
a grid cell. The IAP runs from a present-day simulated base-        on the IAP’s baseline map and is known to only diverge from
line land use configuration to the mid-2080s under combined         that stable baseline “solution” as scenario conditions change
climatic and socio-economic scenarios. The IAP has been             (Brown et al., 2019b). Land use productivities, in terms of
applied and evaluated in a large number of studies includ-          potential yields and ecosystem service provision levels of
ing sensitivity and uncertainty analyses (e.g. Brown et al.,        the simulated land use systems under the agronomic scenario
2014a; Harrison et al., 2015, 2016, 2019; Kebede et al., 2015;      conditions at cell scale, are also calculated from IAP outputs
Holman et al., 2017a, b; Fronzek et al., 2019). A full model        dependent on land use allocation, with the result that pro-
description and the online model itself are available at http://    ductivities are set to zero when the IAP determines produc-
www.impressions-project.eu/show/IAP2_14855 (last access:            tion to be economically infeasible. For ecosystem services
19 February 2021).                                                  with economic values (meat, crops and timber), agents in
   CRAFTY-EU is an application of the CRAFTY frame-                 CRAFTY therefore make production choices that conform
work for agent-based modelling of land use change (Brown            to this basic level of economic feasibility while still being
et al., 2019b; Murray-Rust et al., 2014) that covers the            able to select a range of economically optimal or sub-optimal
same extent as the IAP at the same (10 arcmin) resolution.          land uses. A full description of the model can be found in
CRAFTY uses the concept of agent functional types (AFTs)            Brown et al. (2019b), and an online version with access to

https://doi.org/10.5194/esd-12-211-2021                                                Earth Syst. Dynam., 12, 211–231, 2021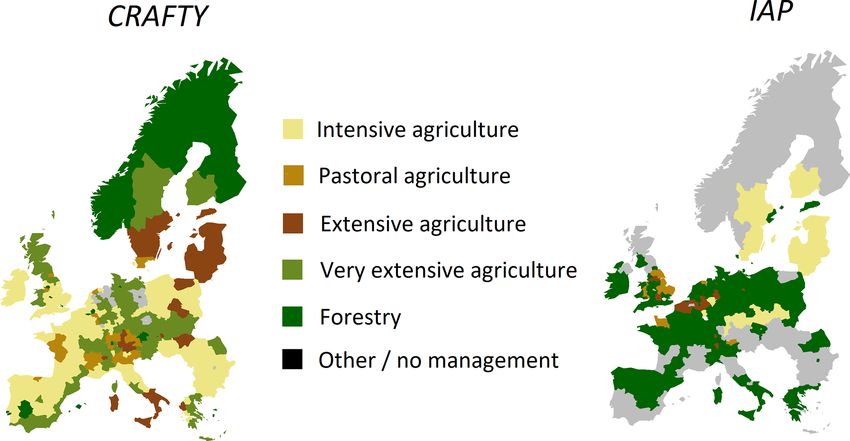
214                                         C. Brown et al.: How modelling paradigms affect simulated future land use change

Figure 1. Simplified schema showing the structure of the IAP in terms of its component meta-models and its relationship to CRAFTY in
this study. Results presented in this study are taken from the alternative land allocation models (yellow), and results from the biodiversity
model are not used. The information transferred from the IAP to CRAFTY utilises all of the inputs to SFARMOD and describes initial and
scenario-dependent conditions affecting agent decision-making in CRAFTY.

the full model code can be found at https://landchange.earth/            land-based sectors (Table 2a; Kok et al., 2019). For this
CRAFTY (last access: 19 February 2021).                                  study, RCPs were simulated in the IAP using outputs from
                                                                         two global–regional climate models (EC_Earth/RCA4 for
                                                                         RCP2.6 and HADGEM2-ES/RCA4 for RCP4.5 and 8.5 –
2.2   Climate and socio-economic scenarios                               Table 2b; Harrison et al., 2019). Scenario outcomes are de-
Seven combinations of climatic and socio-economic scenar-                scribed for CRAFTY-EU in Brown et al. (2019b) and for the
ios were simulated based on the Representative Concen-                   IAP in Harrison et al. (2019) and Papadimitriou et al. (2019).
tration Pathways (RCPs) and Shared Socioeconomic Path-                   In addition to these established scenarios, one scenario com-
ways (SSPs) (O’Neill et al., 2017). The RCPs and SSPs                    bination (RCP4.5–SSP3) was simulated with additional vari-
were combined, taking account of internal consistency with               ations in model parameterisations. This scenario was chosen
their associated greenhouse gas emissions. RCP2.6 was com-               as producing particularly divergent results between the two
bined with SSP1 and 4; RCP4.5 was combined with SSP1,                    models, and parameter values were altered to constrain the
3 and 4, and RCP8.5 was combined with SSP3 and 5 (Ta-                    differences in model responses to the scenario and therefore
ble 1). The SSPs have been further developed for Europe                  to reveal the roles of underlying assumptions in producing
through a stakeholder engagement process that included in-               the observed divergence. Specifically, we increased imports
terpretation and quantification of key drivers of change in              in the IAP by 40 % (to mimic an observed underproduction

Earth Syst. Dynam., 12, 211–231, 2021                                                        https://doi.org/10.5194/esd-12-211-2021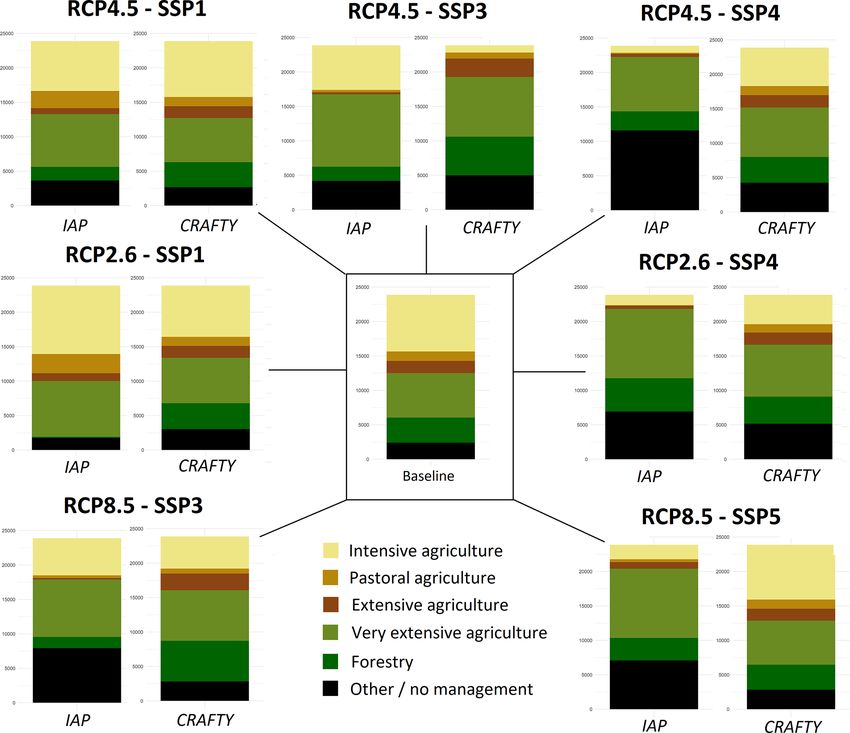
C. Brown et al.: How modelling paradigms affect simulated future land use change                                                       215

Table 1. Climatic and socio-economic scenario identities, summaries and main findings.

                  SSP1                          SSP3                         SSP4                               SSP5
                  Socio-economic conditions     Social and economic          Large economic inequalities and    Emphasis on social and
                  gradually improve through     conditions worsen, with      fluctuations develop, low social   economic development,
                  economic growth, stable       limited and ineffective      cohesion, but high                 fossil fuel exploitation,
                  government, high social       political responses          technological investment and       and technology
                  cohesion and international                                 environmental protection
                  cooperation
  RCP2.6          IAP simulates more                                         Widespread agricultural
  Very low        intensive and pastoral                                     extensification and
  climate         agriculture and very                                       abandonment in the IAP
  change          little forest.                                             and more forestry, but
                  CRAFTY increases                                           with undersupply of
                  forest at the expense                                      timber (agriculture shifts
                  agriculture. Undersupply                                   to optimal areas). More
                  of timber                                                  intensive agriculture in
                  (especially in the                                         CRAFTY, but with undersupply
                  IAP) and undersupply                                       of food
                  of food (only                                              (agriculture persists in
                  in CRAFTY).                                                less optimal areas).
  RCP4.5          Small differences,            Limited change in            Widespread agricultural
  Intermediate    with the IAP having a         the IAP but dramatic         abandonment in the IAP.
  climate         slight shift towards          loss of intensive            CRAFTY supply levels
  change          pastoral and very             management in                exceed demand.
                  extensive agriculture,        CRAFTY, along with
                  with less forest.             fragmentation,
                                                temporal dynamism
                                                and supply shortfalls.
  RCP8.5                                        Limited change in                                               Widespread
  High climate                                  both models, with                                               agricultural
  change                                        more extensification,                                           extensification and
                                                forest and                                                      abandonment in the
                                                multifunctional                                                 IAP. Limited
                                                production in                                                   change in
                                                CRAFTY.                                                         CRAFTY, with
                                                                                                                supply levels
                                                                                                                exceeding demand.

of food in CRAFTY) and increased the value of food produc-               This is possible because the models used share much of their
tion in CRAFTY by 10 times (to compensate for reductions                 information and design features but adopt distinct paradigms
in supporting capital levels responsible for the underproduc-            for modelling the process of land allocation itself (Fig. 1, Ta-
tion of food).                                                           ble 3).
                                                                            The IAP and CRAFTY-EU belong to distinct paradigms in
                                                                         the sense that the IAP is an example of a top-down model that
2.3   Conceptual framework
                                                                         simulates change at the system level – in this case through
The model comparison presented here is motivated by the                  an assumption of constrained economic optimisation - while
hypothesis that the nature of simulated land use allocation is           CRAFTY is an example of a bottom-up model that simulates
one dominant source of uncertainty in land use modelling, as             change at the level of individual decision makers – in this
opposed to uncertainty in crop yields, biophysical conditions            case through an assumption of behavioural choices made at
or other land system characteristics. The selected models                the level of local land systems (Brown et al., 2016; Coucle-
therefore allow us to keep the latter factors common and ex-             lis, 2002). These paradigms usually have different uses and
plore how different factors that influence land use allocation,          justifications: the (dominant) top-down approach is compu-
such as profitability, non-economic motivations, demand lev-             tationally efficient, tractable and more in line with economic
els and socio-economic conditions, affect model outcomes.                theory, although it is rarely justified as an accurate repre-

https://doi.org/10.5194/esd-12-211-2021                                                      Earth Syst. Dynam., 12, 211–231, 2021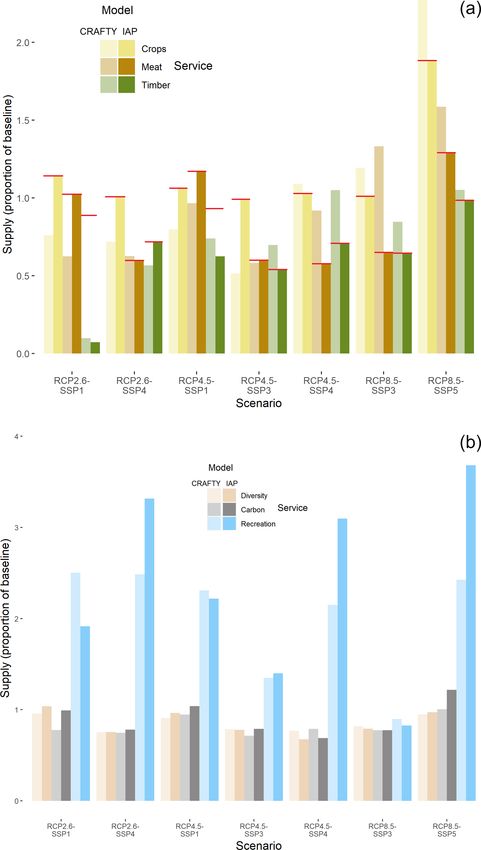
216                                             C. Brown et al.: How modelling paradigms affect simulated future land use change

Table 2. (a) Details of the socio-economic scenarios (Shared Socioeconomic Pathways, SSPs) as simulated by the IAP. Values are shown
for the 2080s time slice. Table adapted from Harrison et al. (2019). (b) Details of the climate scenarios used in both models. RCP denotes
Representative Concentration Pathway. GCM: general circulation model, RCM: regional climate model. The change in temperature (1T )
and change in precipitation (1Pr) are relative to 1961–1990, and they affect productivities as simulated by meta-models in the IAP, which
are then fed into the alternative land use models (Fig. 1). Further details are available in Harrison et al. (2019).

                           (a)
                           Socio-economic scenario                            SSP1             SSP3            SSP4           SSP5
                           Climate change (RCP pairing)                       Very low/        Intermediate/   Very low/      High
                                                                              intermediate     high            intermediate
                           EU population change (% change from                0.4              −38             −22            47
                           2010)
                           Food imports (absolute % change)                   −13              −5              4              18
                           Increase in arable land used for biofuel           9                19              9              14
                           production (% change from 2010)
                           Land allocated to agri-environment                 6                2               5              0
                           schemes (e.g. set-aside, buffer strips,
                           beetle banks) (%; baseline is
                           approx. 3 %)
                           Change in dietary preferences for beef             −82              0               0              53
                           and lamb (% change from 2010)
                           Change in dietary preferences for                  −34              35              35             74
                           chicken and pork (% change from 2010)
                           Change in agricultural mechanisation               ( 133            −35             133            133
                           % change from 2010)
                           Change in agricultural yields (% change            −19              −35             89             89
                           from 2010)
                           Change in irrigation efficiency                    −57              53              −57            −57
                           (% change in water efficiency relative
                           to 2010); −50 % = water halved per unit
                           food
                           Reducing diffuse source pollution from             1.9              0.9             0.9            0.9
                           agriculture by reduced inputs of
                           fertilisers and pesticides (higher value =
                           less input) (absolute value relative to
                           optimum nitrogen)
                           Water savings due to behavioural                   52               0               0              −30
                           change (% change from 2010)
                           Water savings due to technological                 45               0               29             29
                           change (% change from 2010)
                           GDP (% change from 2010)                           259              48              200            724
                           Change in energy price (oil; % of 2010)            162              350             267            75
                           Household externalities (preferences for           5                4               2              5
                           lived environment: 1 = urban;
                           5 = country); baseline = 3
                           Compact vs. sprawled development (low =            High             Low             Medium         Low
                           sprawl; medium or high = compact);
                           baseline = med
                           Preference to live by the coast                    Low              Low             Med            High
                           (low–high); baseline = med

                                          (b)
                                          Emission scenario          RCP2.6           RCP4.5           RCP8.5
                                          Climate change             Very low         Intermediate     High
                                          GCM                        EC_Earth         HadGEM2-ES       HadGEM2-ES
                                          RCM                        RCA4             RCA4             RCA4
                                          GCM sensitivity            Intermediate     High             High
                                          European 1T /1Pr           1.4 ◦ C/4 %      3.0 ◦ C/3 %      5.4 ◦ C/5 %

Earth Syst. Dynam., 12, 211–231, 2021                                                                          https://doi.org/10.5194/esd-12-211-2021
C. Brown et al.: How modelling paradigms affect simulated future land use change 217
Table 3. Summary comparison of the two models used in this study across a range of characteristics, many of which stem from the distinct
modelling paradigms used. Further details are provided in the text and the references cited therein.
IAP CRAFTY-EU Key differences
Modelling Top-down model that Bottom-up model that represents Entirely distinct
paradigm represents land use change land use change as emergent from conceptualisation of
as a single systemic responses of multiple land use change within
response to drivers entities within the system shared reductionist
(modelling) approach
Theoretical Consistent with positivist Consistent with methodological Neither model explicitly
basis and classical economic individualism and subjective theory-driven but both are
theories of system-level expected utility theory of decision- consistent with opposing
dynamic equilibrium making given uncertainty and non- theoretical movements
under exogenous pressures economic motivations (Murray-
(Brown et al., 2016) Rust et al., 2014; Brown et al.,
2016)
Land Optimisation to satisfy Individual agent decisions based Land allocation is
allocation food demand, subject to on competition to satisfy demands imposed in the IAP but
constraints imposed by for ecosystem services emergent in CRAFTY
biophysical and socio- and therefore more
economic conditions variable
Variables Defined in Table 2 Potential and realised ES provision Most inputs are shared
considered levels (derived from the IAP and directly or indirectly,
(inputs) dependent on the variables in Table 2) although the IAP more
and agent abilities to produce explicitly includes
ecosystem services, sensitivities to biophysical conditions
capital levels, willingness, and and CRAFTY human
time-dependent probability of behaviour
abandoning their cells or
relinquishing to other land uses
when at a competitive
disadvantage, and abilities to
search for new cells to take over.
Mathematical Produces single, optimal Stochastic and path-dependent; The IAP is more
characteristics results (subject to produces sub-optimal and variable mathematically
constraints) at each results constrained, but
time slice complexity of “option
space” makes results of
both models difficult to
anticipate
Evaluation Extensively evaluated, Extensively evaluated, including No significant
including uncertainty uncertainty analyses and difference, noting that
analyses and comparison comparison to independent data neither model targets
to independent data and and other models (Alexander et al., accurate reproduction of
other models (e.g. Brown 2017; Brown et al., 2014b, 2018b; observed changes
et al., 2014; Harrison et al., Holzhauer et al., 2019; Seo
2015, 2016, 2019; Kebede et al., 2018)
et al., 2015; Holman et al.,
2017a, b; Fronzek et al.,
2019)
Uncertainty Well-understood, with Well-understood, with land use CRAFTY has
and land use outcomes most outcomes most sensitive to yields sensitivities to
sensitivity sensitive to temperature, (including climate effects), import behavioural parameters
precipitation, yields and levels and (to lesser extent) agent not present in the IAP
import levels (Kebede et behaviour (Brown et al., 2018b)
al., 2015)
https://doi.org/10.5194/esd-12-211-2021 Earth Syst. Dynam., 12, 211–231, 2021218 C. Brown et al.: How modelling paradigms affect simulated future land use change
Table 3. Continued.
IAP CRAFTY-EU Key differences
Spatial 10 arcmin (approx. 16 km 10 arcmin (approx. 16 km in Europe), Identical resolution for
resolution in Europe), with up to with continuous variation in defined classes, but
40 forms of land use and characteristics within 17 forms of different forms and
management proportionally land use and management extents of variation
distributed within each within those classes
cell
Temporal Time slices: baseline, Annual 2016–2086 CRAFTY has higher
resolution 2020s, 2050s, 2080s temporal resolution
Principal Research, education, Research, education CRAFTY less used in
uses capacity building (students stakeholder engagement
and stakeholders)
sentation of how land use decisions are made in practice (in responds more to smaller changes in conditions than does
fact the evidence tends to contradict it; e.g. Chouinard et al., CRAFTY and that the models are likely to diverge as time
2008; Schwarze et al., 2014; Appel and Balmann, 2019). The goes on and as the magnitude of changes increases.
bottom-up approach, in contrast, is more exploratory and of-
ten criticised for producing uncertain results, but it explicitly 2.4 Comparison
attempts to achieve greater process accuracy (Brown et al.,
2016). In this study, both models are run until the mid-2080s (de-
Neither of these models is intended to accurately predict fined as a 30-year time slice in the IAP and the year 2086
real-world land use change but to project land system dy- in CRAFTY-EU). Both use a spatial grid of resolution
namics on the basis of complex and integrated processes 10 arcmin × 10 arcmin (approximately 16 km × 16 km in Eu-
founded on a small number of key transparent assumptions. rope), but simulated land classes differ between the two mod-
This comparison is therefore intended first and foremost to els (as described in Brown et al., 2019b) and are standard-
explore the reasons for simulated land use changes, and does ised here as described in Table 4 to focus on major compa-
not speak directly to observed land use changes. Neverthe- rable forms of agricultural and forestry management. These
less, both models have been extensively used and evaluated, aggregate land use classes are not homogeneous or uniform
and both respond stably and predictably to driving conditions across the simulations as they allow for a range of manage-
(Brown et al., 2014a, 2018b, 2019b; Harrison et al., 2016, ment forms within them. We therefore also compare ecosys-
2019; Holman et al., 2017b). Both also have similar uses, be- tem service production levels, which account for actual forms
ing intended to support academic research, education and, to of management simulated in each cell. Urban land use is not
some extent, capacity building with stakeholders to increase compared as its locations are shared by both models.
understanding of the importance of socio-economic and cli- The comparison of these land use classes was made at two
matic changes, systemic inter-relationships in the land sys- spatial resolutions: across the whole of the modelled domain
tem, and geographic regions that may be particularly vulner- (without reference to spatial configurations) and across 323
able or resilient to change. As a result, the comparison does Nomenclature of Territorial Units for Statistics (NUTS2) re-
not consider model purpose or the suitability of either model gions. NUTS2 resolution was chosen for the spatially explicit
for direct policy support, prediction or other unintended uses. comparison instead of the original 100 model resolution to
Further, some of the effects of the different land allocation limit the impact of relatively uninformative differences in the
mechanisms contained in these models are apparent a priori. allocation of individual cells and to focus instead on system-
As a bottom-up agent-based model, CRAFTY is less con- atic differences in model responses to the simulated scenar-
strained than the IAP, with multiple outcomes being possible ios. This choice also reflects the fact that neither model is
from a given set of input conditions. At the same time, land intended to predict cell-level outcomes but to provide illus-
use decisions are subject to behavioural inertia in CRAFTY, trative realisations of scenario outcomes, with the cell-level
with agents unwilling to change existing land uses and moti- results of CRAFTY-EU differing between individual runs be-
vated by non-economic factors that can counteract price sig- cause the model is stochastic and path-dependent. At NUTS2
nals. The IAP will always identify the optimal result subject level, only differences between the models affecting at least
to economic drivers and modelled constraints, and it does so 5 % of the relevant cells were included in the analysis. In
without reference to the previously simulated time point (i.e. the following sections (the Results and Discussion sections),
is not path-dependent). It is therefore expected that the IAP CRAFTY-EU is referred to simply as CRAFTY for brevity.
Earth Syst. Dynam., 12, 211–231, 2021 https://doi.org/10.5194/esd-12-211-2021C. Brown et al.: How modelling paradigms affect simulated future land use change 219
Table 4. Land use classes used in the comparison and their composition. Derivations from the full range of CRAFTY and IAP classes are
given in Table A1.
Land use classes for comparison Explanation
Intensive agriculture Intensive forms of agriculture primarily dedicated to crop production but including
some grassland
Extensive agriculture Extensive forms of arable and pastoral agriculture
Pastoral agriculture Dedicated and primarily intensive pastoral agriculture
Very extensive management Management for any service that is of the lowest intensity and leaves land in a
nearly natural state
Forestry Active management for timber extraction and other forest services
Other/no management Land that is not actively managed for agriculture or forestry, but which can have a
range of natural or human-impacted land cover
The presentation of the results below is structured to re- generally less intensive agriculture and higher supply lev-
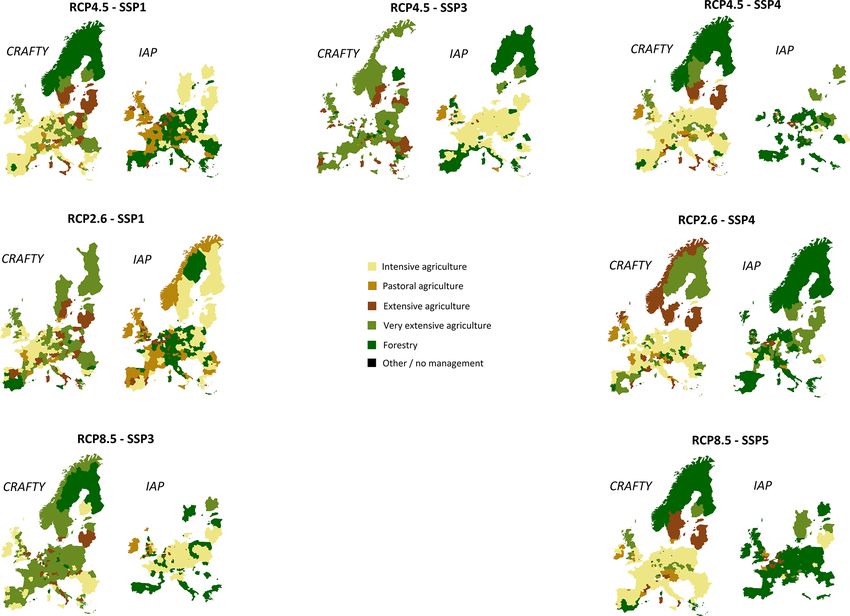
veal the effects of the paradigmatic differences between the els (even exceeding demand in the higher climatic produc-
models (and not to assess the models’ shared characteristics). tivities of RCP4.5 and 8.5) (Fig. 3a). In contrast, the IAP
First, we compare outputs from each scenario at EU scale to projects a dramatic move away from intensive agriculture
identify the principal differences that arise in the simulations. in SSP4 and 5 as a consequence of greatly increased pro-
Because the scenarios relate to the modelling paradigms in ductivity requiring a smaller agricultural area to meet de-
different ways (e.g. allowing for stronger or weaker eco- mand. This loss of agricultural management in previously in-
nomic signals), this allows us to link the results to particu- tensively managed areas is far more pronounced in the IAP
lar modelling choices. We then compare results at NUTS2 than in CRAFTY, wherein the wider range of valued ecosys-
level to identify relatively minor or hidden differences be- tem services supports more management and, in some cases,
fore experimenting with forced convergence to test the role oversupply of services (Fig. 3). The extent of agricultural
of particular parameters and assumptions in each model. abandonment is greatest in the IAP under intermediate cli-
mate change (RCP4.5), whereby increased yields in some ar-
eas reduce the relative competitiveness of agricultural land
3 Results in less productive areas. Differences in the simulated extent
of intensive arable management are equivalent to 25 % of the
3.1 EU-level aggregate comparison EU land area in some cases.
SSP3 produces considerably smaller responses in the IAP,
The responses of the two models to scenario conditions are with some areas of all land use types going out of manage-
notably different in most cases (Figs. 2 and 3, Table 1), al- ment and with far larger areas of the intensive agriculture
beit within similar broad limits (Fig. 2). The greatest similar- class remaining than in SSP4. CRAFTY outcomes for SSP3
ities in terms of aggregate land use classes occur in the SSP1 are highly dependent on the climate scenario, with RCP4.5
simulations, in which both models produce land systems that producing the strongest response, most notably in terms of
remain similar to the baseline, with large areas of intensive a large shortfall in the supply of crops (of up to 56 % of de-
agriculture and small areas of land not managed for agricul- mand; Fig. 3a). In this case, widespread extensification of
ture or forestry. The IAP results include more dedicated pas- land use occurs, with little intensive agriculture remaining
toral land and the CRAFTY results more forestry. In all sim- by the end of the simulation and a slight increase in land go-
ulations with very low climate change (RCP2.6), CRAFTY ing out of agricultural or forestry management. In RCP8.5
produces an undersupply of food and both models produce these changes are less pronounced, with only small changes
an undersupply of timber; these shortfalls are reduced under from intensive agriculture to extensive and forestry manage-
intermediate climate change (RCP4.5), whereby productivity ment. These changes occur because SSP3 includes deteri-
is slightly higher (Fig. 3). CRAFTY produces smaller imbal- orating inherent agricultural productivity and also substan-
ances between food and timber supplies due to its equivalent tial declines in capital values that support land management
valuation of all modelled services. (particularly financial, human and manufactured capitals). In
In other scenarios, the IAP responds most strongly to SSP4 CRAFTY, these simultaneous changes make it difficult for
and 5, while CRAFTY responds most strongly to SSP3. At agents to maintain intensive management against competi-
aggregate level, CRAFTY produces similar results in the tion from extensive and less capital-dependent forms of man-
SSP4 and 5 simulations as in SSP1 (Fig. 2), though with
https://doi.org/10.5194/esd-12-211-2021 Earth Syst. Dynam., 12, 211–231, 2021220 C. Brown et al.: How modelling paradigms affect simulated future land use change Figure 2. Simulated land use classes for each scenario in each model in the mid-2080s. Bars show the number of cells occupied by each class out of the total number of 23 871 cells (y axes). Climate scenarios (RCPs) are arranged in rows. The baseline is identical in both models and is therefore only shown once. agement. The increased yields in some parts of Europe pro- provide other services and because of the gradual decision- duced by climate change in RCP8.5 make this scenario more making of agents that spreads abandonment decisions over conducive to the maintenance of intensive management. multiple time steps. The models also respond very differently to the SSP5 sce- Together, these scenario results show that the IAP re- nario (paired only with RCP8.5). In the IAP, large areas sponds most strongly to scenarios with conditions in which switch to extensive and other/no management classes, while agricultural productivity increases and which therefore lead there is very little overall change in CRAFTY. The differ- to reduced need for agricultural land and, in this model, ences between the models’ responses are mainly due to the extensification and agricultural abandonment (which occurs higher yields and improved technological conditions in SSP5 over larger extents in the IAP than in CRAFTY). CRAFTY making large areas of intensive agriculture surplus to require- responds less strongly to such conditions because agents ments. These surplus areas are no longer intensively man- have a (parameterizable) unwillingness to change or abandon aged for agriculture in the IAP by the 2080s, but they are in their land use in the absence of a more viable alternative and CRAFTY (resulting in an oversupply of food) because they because a wider range of services produces returns for those Earth Syst. Dynam., 12, 211–231, 2021 https://doi.org/10.5194/esd-12-211-2021
C. Brown et al.: How modelling paradigms affect simulated future land use change                                                         221

Figure 3. (a) Supply levels of services for which both models attempt to satisfy demand. Supply levels are shown for each scenario, and
demand levels (derived from the IAP) are indicated by a red line for each service. IAP supplies are unequal to demand levels only where the
IAP reports an underproduction of a particular service (in these results, timber in SSP1 simulations). A supply value of 1.0 (y axis) is equal
to baseline supply. (b) Supply levels of services for which only CRAFTY attempts to satisfy demands (while the IAP does not). IAP supply
levels here are calculated using CRAFTY production functions and then set as demands for CRAFTY. Demand levels are therefore equal to
IAP supply by default and are not indicated by a line as in (a). A supply value of 1.0 (y axis) is equal to baseline supply.

https://doi.org/10.5194/esd-12-211-2021                                                       Earth Syst. Dynam., 12, 211–231, 2021
222                                             C. Brown et al.: How modelling paradigms affect simulated future land use change

                                                                               Notwithstanding the smaller-scale fragmentation of land
                                                                            uses in CRAFTY (see below), these results show that at this
                                                                            aggregate level, CRAFTY has a tendency (except in SSP3)
                                                                            to concentrate intensive agriculture at mid-latitudes, exten-
                                                                            sive agriculture in the southern Baltic states and very exten-
                                                                            sive land uses at the European latitudinal extremes. Forestry
                                                                            is distributed in the western UK and central–eastern states in
                                                                            particular. The IAP results are less consistent but show a ten-
                                                                            dency to produce pastoral agriculture in the west and forestry
                                                                            more widely. Many of these differences may reflect the val-
                                                                            uation of a wider range of services in CRAFTY, leading to a
Figure 4. Territorial differences between the models’ results across        concentration of intensive management in the most produc-
all scenarios at NUTS2 level. Colours identify the most over-               tive areas where it can maintain relative competitiveness. As
represented land use type in each region in the CRAFTY and IAP              above, they also reflect the differences in the conditions to
results relative to the result of the other model (i.e. the land use with   which the models respond, with the IAP particularly sensitive
the biggest difference in occurrence in that region). Grey is shown         to changes in demand that do not have spatial manifestations
where no land use type has an over-representation of more than 5 %          and CRAFTY more sensitive to capitals that are maximised
of the region’s cells. Scenario-specific results are shown in Fig. B1.      in climatically suitable but also politically stable and affluent
                                                                            countries.
agents. Conversely, CRAFTY responds most strongly to sce-
narios in which conditions affecting agricultural productivity              3.3   Convergence experiment
worsen because agents rely more strongly on a range of cli-                 The scenario combination RCP4.5–SSP3 was chosen as hav-
matic and socio-economic conditions. Many of these condi-                   ing particularly different results from the two models, so it
tions deteriorate in SSP3, making intensive agriculture less                was used to examine the potential for convergence in model
competitive than extensive agriculture or other multifunc-                  settings and results. In this scenario, CRAFTY produces a
tional land uses and causing intensive agents to be easily re-              highly fragmented land system with areas of abandoned or
placed (competition is a more rapid process than abandon-                   extensively managed land scattered throughout Europe and a
ment in the CRAFTY parameterisation used here).                             substantial shortfall in food production. The IAP, in contrast,
                                                                            produces large contiguous agricultural areas with far more
3.2   Territorial comparison                                                intensive management (albeit of greatly reduced productiv-
                                                                            ity) and less forestry, satisfying food demands. To control for
Within the aggregate differences between model results there
                                                                            the main differences in scenario conditions in each model,
are some consistent spatial and territorial patterns (Fig. 4).
                                                                            we increased food imports in the IAP to produce lower pro-
Across scenarios, the IAP often places more pastoral and
                                                                            duction levels in the EU, as observed in the CRAFTY result,
very extensive land use classes in western Europe in partic-
                                                                            and we increased food prices in CRAFTY to produce greater
ular, while CRAFTY often has more intensive agriculture at
                                                                            support for intensive agriculture, as observed in the IAP re-
mid-latitudes and forest in eastern and northern areas (Figs. 4
                                                                            sult. In the absence of these major differences, any remaining
and B1). These differences are very scenario-dependent,
                                                                            divergence in model outputs could be attributed to other fac-
however, and as with the aggregate summaries above, the
                                                                            tors.
spatial patterns produced by one model in SSP3 resemble
                                                                               In terms of aggregate land system composition, the
those produced by the other model in SSP4. In SSP4, the
                                                                            changes in the IAP (an increase of 40 % in food imports) did
IAP projects substantially more very extensive agricultural
                                                                            not lead to a result approaching the original CRAFTY results
management and forest management than CRAFTY, while
                                                                            (Fig. 5). While the extent of intensive agricultural manage-
the nearly inverse is true for SSP3 (reflecting implicit as-
                                                                            ment did decrease, this led to widespread agricultural aban-
sumptions that overproduction is not penalised in CRAFTY
                                                                            donment rather than additional extensive or forestry man-
and that intensive agriculture retains an efficiency advantage
                                                                            agement (demand which was already satisfied), with remain-
over extensive in the IAP). CRAFTY also produces a great
                                                                            ing food production being even more concentrated in certain
deal more forest management in RCP2.6–SSP1, with inten-
                                                                            intensively managed parts of Europe (particularly the east).
sive arable agriculture dominating only in the most produc-
                                                                            Large parts of southern and northern Europe fell out of agri-
tive parts of France, Germany and the UK. SSP1 is also the
                                                                            cultural management, with other regions and countries being
scenario in which the IAP produces the most concentrated
                                                                            managed only for forestry. Other results (above) suggest that
areas of intensive pastoral agriculture, particularly in Ireland,
                                                                            the IAP would have more closely resembled the CRAFTY re-
the UK and France.
                                                                            sult had there been an explicit driver for extensification rather
                                                                            than simply an effective decrease in demand levels.

Earth Syst. Dynam., 12, 211–231, 2021                                                          https://doi.org/10.5194/esd-12-211-2021
C. Brown et al.: How modelling paradigms affect simulated future land use change 223
Figure 5. Cell-level and EU-level results for the RCP4.5–SSP3 scenario with and without alternative parameterisations designed to introduce
analogous driving conditions to each model in turn. The IAP experiment is shown in (a, b), and the CRAFTY experiment is at the bottom. The
original IAP result (a) moves towards the original CRAFTY result (d) with a 40 % increase in imports allowing less production of food within
Europe, resulting in widespread land abandonment in the new IAP result (b). The original CRAFTY result (bottom right) moves towards the
original IAP result (a) with a 10-fold increase in food prices used to stimulate production, resulting in far more intensive agriculture in the
new CRAFTY result (c). In neither case do the new results reproduce the original extremes.
From the more extensively managed and fragmented ini- senting major distinct paradigms. While conclusions are in-
tial result produced by CRAFTY, a 10-fold increase in food evitably limited by the breadth of the comparison, in par-
prices did come closer to the initial IAP result, although there ticular by the many characteristics that are shared between
was more intensive agriculture and less land under other the selected models (Table 3), our results do reveal large and
or no management. The distribution of land uses was strik- consistent differences that emerge from the different ways in
ingly different, however. Unmanaged land mainly occurred which those models represent land system change.
in the same areas, and concentrations of forestry overlapped The consequences of top-down and bottom-up perspec-
to some extent, but the agricultural land in the CRAFTY re- tives are apparent in the form, extent, rate and patterns of land
sult remained highly fragmented across much of Europe. In use change as the models respond to scenario conditions.
this case, CRAFTY produced sufficient food to satisfy de- The IAP’s consistent profitability thresholds within a deter-
mand. ministic optimising framework respond strongly to increas-
ing yields or decreasing demands when the model produces
widespread agricultural abandonment outside the most pro-
4 Discussion
ductive land. Conversely, CRAFTY’s heterogeneous compe-
tition process within a stochastic agent-based framework re-
Understanding the contributions of different modelling
sponds more strongly to decreases in productivity when the
paradigms to land use projections is important for two main
model produces extensification and expansion of agriculture.
reasons. The first reason is that almost all large- to global-
This difference is also apparent in our convergence exper-
scale land system models share a single paradigm (economic
iment, in which increased imports in the IAP lead to re-
optimisation of land uses), raising the risk of biases in model
duced agricultural area, ensuring efficient production where
results and resultant unrecognised knowledge gaps (e.g. Ver-
competitiveness is highest rather than the extensification that
burg et al., 2019; Elsawah et al., 2020; Müller et al., 2020).
CRAFTY produces. Increasing food prices in CRAFTY did
The second reason is that different paradigms are known to
generate aggregate land use proportions similar to those of
produce very different outcomes but for reasons that remain
the IAP, albeit with largely distinct spatial distributions, sug-
unclear (Alexander et al., 2017; Prestele et al., 2016). The
gesting that agents become more “optimal” in behaviour
focused comparison presented here is therefore intended to
when greater competitive advantages are available.
identify and explain key differences between models repre-
https://doi.org/10.5194/esd-12-211-2021 Earth Syst. Dynam., 12, 211–231, 2021224 C. Brown et al.: How modelling paradigms affect simulated future land use change To some extent these differences are traceable to the un- in the IAP may become unrealistically high in scenarios in derlying mathematical structures of the models, with the which economic and social conditions are very challenging IAP identifying any change in optimal configurations and (Hamilton et al., 2020; Pedde et al., 2019). In both models, CRAFTY maintaining existing and multifunctional land uses the simulation of the European land system as distinct from where possible. But the results are also subject to model the rest of the world requires implicit but shared assump- sensitivity and uncertainty. Previous analyses show that the tions about conditions in other regions and their relationships IAP responds most strongly to changes in demand levels and to Europe. Alternative assumptions would inevitably lead to climate-driven yields and that their effects outweigh those of different outcomes and, perhaps, greater differences between socio-economic scenarios (Brown et al., 2014a; Kebede et the two models’ results. As conceptual alternatives, there- al., 2015). CRAFTY has similar sensitivities complemented fore, neither of these necessarily captures the true dynamics but not overwhelmed by simulated agent behaviour (Brown of food prices and production levels, which remains a ma- et al., 2018b, 2019b). Together these suggest that the effects jor challenge for land system modelling (Müller et al., 2020; and differences we find are robust and traceable to model de- Pedde et al., 2019). sign interacting primarily with climatic scenarios (RCPs) and Beyond differences at aggregate level, another notable fea- with socio-economic scenarios (SSPs) to a lesser extent. ture of the results shown above is that CRAFTY produces far Particularly influential is the representation in CRAFTY of more small-scale heterogeneity in land use than does the IAP. individual and societal desires for a range of ecosystem ser- This heterogeneity is particularly pronounced in CRAFTY’s vices, which means that extensive management practices that SSP3 simulations (Fig. 5) and reflects a basic modelling ap- provide recreation, carbon sequestration or landscape diver- proach: the simulation of time-dependent decisions affect- sity, for example, are adopted instead of land abandonment. ing individual cells, with agents parameterised here to aban- This is not necessarily tied to the modelling paradigm; op- don land only if it provides no returns and then only grad- timisation can in principle be performed across a range of ually. This effectively precludes the system-level optimisa- criteria, potentially accounting for many more (economically tion practised by the IAP, which does not account for indi- valued) ecosystem services, although this remains conceptu- vidual land use decisions. Individual-level heterogeneity is, ally and computationally challenging (Newland et al., 2018; inevitably, very difficult to parameterise precisely, although Seppelt et al., 2013; Strauch et al., 2019). The non-optimising participatory techniques have some promise in this respect representation used in models such as CRAFTY is closer (Elsawah et al., 2015). Conversely, (constrained) optimis- to the reality of how land use actually changes (Appel and ing models like the IAP produce results that may not repli- Balmann, 2019; Schwarze et al., 2014) but still requires ad- cate observed rates or spatial structures of land use change ditional parameterisation and rigorous uncertainty analysis (Brown et al., 2019a; Low and Schäfer, 2020; Turner et al., (Verburg et al., 2019). In either case, there is strong justi- 2018), but they can introduce spatial dependencies as further fication for including a wide range of ecosystem services, constraints on optimisation in order to approximate spatially particularly those such as carbon sequestration that may gain mediated social processes such as imitation (Brown et al., distinct values in different future scenarios (Estoque et al., 2018a; Meiyappan et al., 2014). Bottom-up models in gen- 2020; Kay et al., 2019). eral tend to be less precisely specified, so they produce more One consequence of simulating the demand and supply of variable results (or are more “skittish”, as Couclelis, 2002, a range of ecosystem services is that the relative economic put it). They are also generally less often compared against support available for food production becomes a key deter- observational (or other modelled) data, and while their flex- minant of the balance of different land uses because agricul- ibility makes fitting to data notably feasible in principle, ture, while still dominant in area, must compete with alter- their inherent tendency to produce variable results means that native management options. Models such as the IAP seek to the production of any one particular outcome does not have maintain food supplies, even at the expense of other services the apparent significance that it does for a more constrained such as timber production, while models such as CRAFTY model. Both models used here have been compared against allow supply levels to emerge from simulated decisions and “observed” land use data to some extent, with an example are therefore capable of producing shortfalls. All the results application of CRAFTY compared and calibrated to MODIS of the models are affected by this basic assumption about land cover data (Seo et al., 2018) and the IAP (and hence, in- whether equilibrium does or will exist in the food system directly, CRAFTY) calibrated to match CORINE land cover and further by the extent of disequilibrium that is tolerated and NUTS2 yields (Harrison et al., 2015). and the mechanism by which that extent is defined. For in- Notwithstanding the gains to be made by better under- stance, food prices in CRAFTY can respond to shortfalls in standing the relative performance of different modelling production through a number of parametric functions, while paradigms, it is essential to recognise some hard limits. No the in the IAP prices are automatically adjusted within broad land use model is intended or able to provide calibrated rep- limits to ensure that demand and supply match. However, resentations of all the mechanisms responsible for land use shortfalls in food production in CRAFTY do not lead to sim- change, especially under imagined future conditions. Mod- ulated hunger, societal unrest or migration, and food prices els of this kind are inevitably reductionist in nature and omit Earth Syst. Dynam., 12, 211–231, 2021 https://doi.org/10.5194/esd-12-211-2021
You can also read