An assessment of ballistic hazard and risk from Upper Te Maari, Tongariro, New Zealand
←
→
Page content transcription
If your browser does not render page correctly, please read the page content below
An assessment of ballistic hazard and risk from Upper Te
             Maari, Tongariro, New Zealand
________________________________________________________________________________

                                        A thesis

           submitted in partial fulfilment of the requirements for the degree

                                           of

                             Master of Science in Geology

                                           at

                             The University of Canterbury

                                          by

                               Rebecca Hanna Fitzgerald

        _________________________________________________________________

                           University of Canterbury
                                         2014

                                                                                   i
TABLE OF CONTENTS
Abstract .......................................................................................................................... iv
Acknowledgments ..........................................................................................................viii
Chapter 1: Introduction .................................................................................................... 1
   1.1 Context of study ...................................................................................................................... 1
   1.2 Risk management framework ............................................................................................... 3
   1.3 Outlines of thesis structure/research methodology .......................................................... 6
Chapter 2: Literature review ............................................................................................. 8
   2.1 Introduction ............................................................................................................................. 8
   2.2 Geological setting .................................................................................................................... 8
      2.2.1 Taupo volcanic zone (TVZ).............................................................................................. 8
      2.2.2 Tongariro Volcanic Centre (TgVC) ................................................................................. 9
   2.3 Te Maari eruption history .................................................................................................... 10
   2.4 Ballistic hazard impacts ........................................................................................................ 15
   2.5 Ballistic impact distribution maps ....................................................................................... 16
   2.6 Ballistic models ...................................................................................................................... 19
Chapter 3: Research component ..................................................................................... 22
   3.1 Introduction ........................................................................................................................... 22
   3.2 Overview 6 august 2012 eruption of upper Te Maari ...................................................... 22
   3.3 Methodology.......................................................................................................................... 24
      3.3.1 Orthophoto mapping .................................................................................................... 24
      3.3.2 Fieldwork ........................................................................................................................ 25
      3.3.3 Ballistic trajectory model .............................................................................................. 26
      3.3.4 Ballistic vulnerability ..................................................................................................... 27
   3.4 Results ..................................................................................................................................... 30
      3.4.1 Spatial distribution of impact craters ......................................................................... 30
      3.4.2 Relationship between crater size, distance and direction from the vents and
             the crater size distribution within the ballistic field ............................................... 33
      3.4.3 Relationship between crater size and block size ...................................................... 35
      3.4.4 Ballistic trajectory model .............................................................................................. 37
           3.4.4.1 Model parameters and results for the August 2012 eruption ......................... 37
             3.4.4.1.1 Number of eruption pulses, vent location and direction of particle
                       deposition .......................................................................................................... 37

                                                                                                                                                      i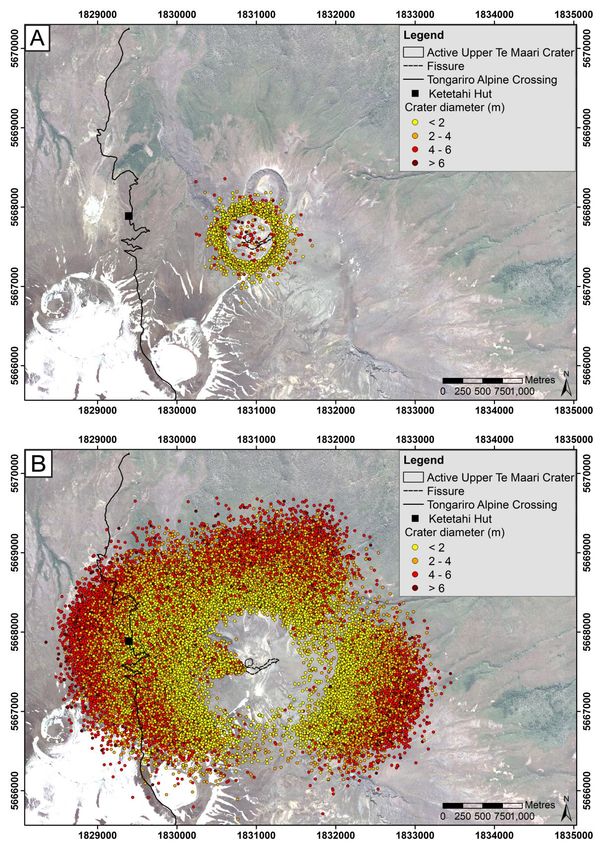
3.4.4.1.2 Number of erupted particles ............................................................................. 39
            3.4.4.1.3 Particle density and diameter ........................................................................... 41
            3.4.4.1.4 Rotation angle ..................................................................................................... 41
            3.4.4.1.5 Inclination angle .................................................................................................. 41
            3.4.4.1.6 Particle collisions................................................................................................. 42
            3.4.4.1.7 Initial particle velocity (Vi) ................................................................................. 42
            3.4.4.1.8 Gas flow velocity (Vg) and distance over which this affects particle
                       transport ............................................................................................................ 43
   3.5 Discussion ............................................................................................................................... 47
       3.5.1 Mapped ballistic impact distribution .......................................................................... 47
       3.5.2 Efficiency of explosion energy conversion into ballistic kinetic energy ................. 47
       3.5.3 Ballistic trajectory model .............................................................................................. 48
       3.5.4 Application of the calibrated model to future ballistic hazard from Upper Te
              Maari ............................................................................................................................. 49
       3.5.5 Ballistic vulnerability along the Tongariro Alpine Crossing ..................................... 52
   3.6 Summary................................................................................................................................. 54
Chapter 4: Limitations and future work .......................................................................... 55
   4.1 Ballistic modeling .................................................................................................................. 55
   4.2 Hazard processes................................................................................................................... 57
   4.3 Vulnerability ........................................................................................................................... 57
Chapter 5: Conclusions .................................................................................................. 59
References ........................................................................................................................................... 62

Appendices .......................................................................................................................................... 71

   Appendix A. Volcanic hazards maps as a medium for hazard assessment .......................... 71
   Appendix B. Electronic appendices a to g ................................................................................. 72

TABLE OF FIGURES
Figure 1. ISO 31 000 risk management framework ................................................................. 4

Figure 2. Location map of A: volcanoes comprising Tongariro Volcanic Centre (TgVC) and
           B: young eruptive vents trending NNE – SSW ...................................................... 10

Figure 3. Photo of Ketetahi Hut ballistics damage ................................................................ 15

                                                                                                                                                       ii
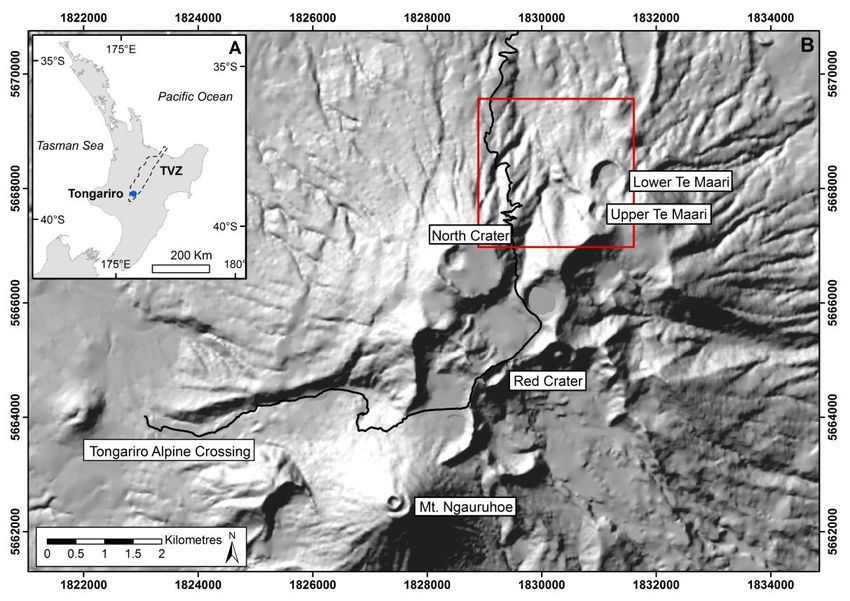
Figure 4. Location map of the Tongariro Volcanic Centre and Digital Elevation Model (of the
           northern section of Tongariro ...................................................................................... 24

Figure 5. Orthophotos of Upper Te Maari Crater ........................................................................ 25

Figure 6. Rotation angle and inclination angle model parameters ........................................... 27

Figure 7. Area of hazard from a ballistic impact .......................................................................... 29

Figure 8. Photos of ballistic impact craters .................................................................................. 31

Figure 9. Ballistic impact crater distribution ................................................................................ 32

Figure 10. Impact crater size distribution ..................................................................................... 34

Figure 11. Relationship between block and crater size .............................................................. 36

Figure 12. Acoustic data of eruption pulses ................................................................................. 38

Figure 13. Spatial and size distribution of impact craters .......................................................... 45

Figure 14. Impact crater distributions for potential future eruption scenarios ...................... 50

Figure 15. Ballistic vulnerability along the Tongariro Alpine Crossing...................................... 53

TABLE OF TABLES

Table 1. Historical eruptions of Upper Te Maari ......................................................................... 14

Table 2. Number of impact craters mapped compared to the number of impacts found .... 35

Table 3. Eruption parameters for each of the five pulses ......................................................... 39

                                                                                                                                iii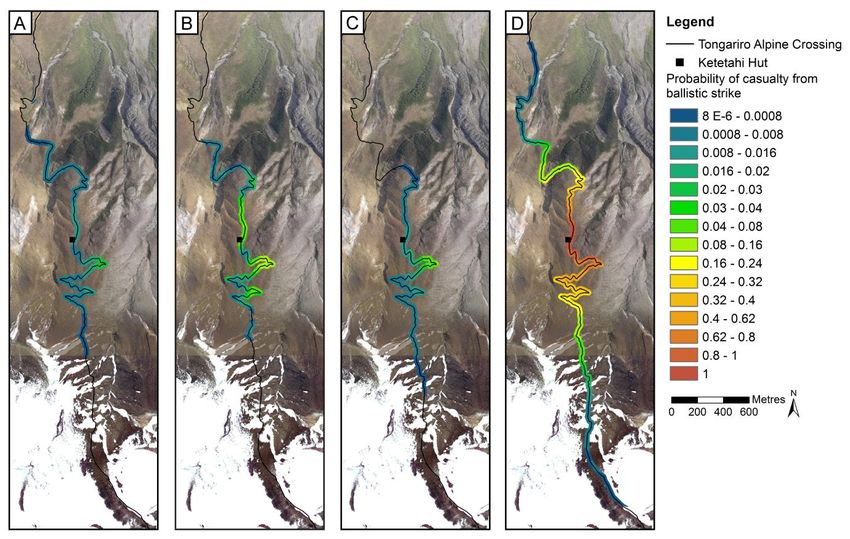
ABSTRACT
Explosive volcanic eruptions frequently expel ballistic projectiles, producing a significant
proximal hazard to people, buildings, infrastructure and the environment from their high
kinetic and thermal energies. Ballistic hazard assessments are undertaken as a risk
mitigation measure, to determine probabilities of eruptions occurring that may produce
ballistics, identify areas and elements likely to be impacted by ballistics, and the potential
vulnerabilities of elements to ballistics.

The 6 August, 2012 hydrothermal eruption of Upper Te Maari Crater, Tongariro, New
Zealand ejected blocks over a 6 km2 area, impacting ~2.6 km of the Tongariro Alpine
Crossing (TAC), a walking track hiked by ~80,000 people a year, and damaging an overnight
hut along the track. In this thesis ballistic hazard and risk from Upper Te Maari Crater are
assessed through a review of its eruptive history, field and orthophoto mapping of the 6
August ballistic impact distribution, forward modelling and analysis of possible future
eruption scenarios using a calibrated 3D ballistic trajectory model, and analysis of the
vulnerability of hikers along the impacted Tongariro Alpine Crossing.

Orthophoto mapping of the 6 August ballistic impact crater distribution revealed 3,587
impact craters with a mean diameter of 2.4 m. However, field mapping of accessible regions
indicated an average of at least four times more observable impact craters and a smaller
mean crater diameter of 1.2 m. By combining the orthophoto and ground-truthed impact
frequency and size distribution data, it is estimated that approximately 13,200 ballistic
projectiles were generated during the eruption.

Ballistic impact distribution was used to calibrate a 3D ballistic trajectory model for the 6
August eruption. The 3D ballistic trajectory model and a series of inverse models were used
to constrain the eruption directions, angles and velocities. When combined with eruption
observations and geophysical observations and compared to the mapped distribution, the
model indicated that the blocks were ejected in five variously directed eruption pulses, in
total lasting 19 seconds. The model successfully reproduced the mapped impact distribution
using a mean initial particle velocity of 200 m/s with an accompanying average gas flow
velocity over a 400 m radius of 150 m/s.

                                                                                            iv
Assessment of the vulnerability of hikers to ballistics from the August eruption along the TAC
utilised the modelled spatial density of impacts and an assumption that an average ballistic
impact will cause serious injury or death (casualty) over an 8 m2 area. It is estimated that the
probability of casualty ranged from 1% to 16% along the affected track (assuming an
eruption during the time of exposure). Future ballistic hazard and vulnerability along the TAC
are also assessed through application of the calibrated model. A magnitude larger eruption
(than the 6 August) in which 10x more particles were ejected, doubled the affected length of
the TAC and illustrated that the probability of casualty could reach 100% in localised areas of
the track. In contrast, ballistics ejected from a smaller eruption did not reach the track as
was the case with the 21 November 2012 eruption. The calibrated ballistic model can
therefore be used to improve management of ballistic hazards both at Tongariro and also,
once recalibrated, to other volcanoes worldwide.

                                                                                              v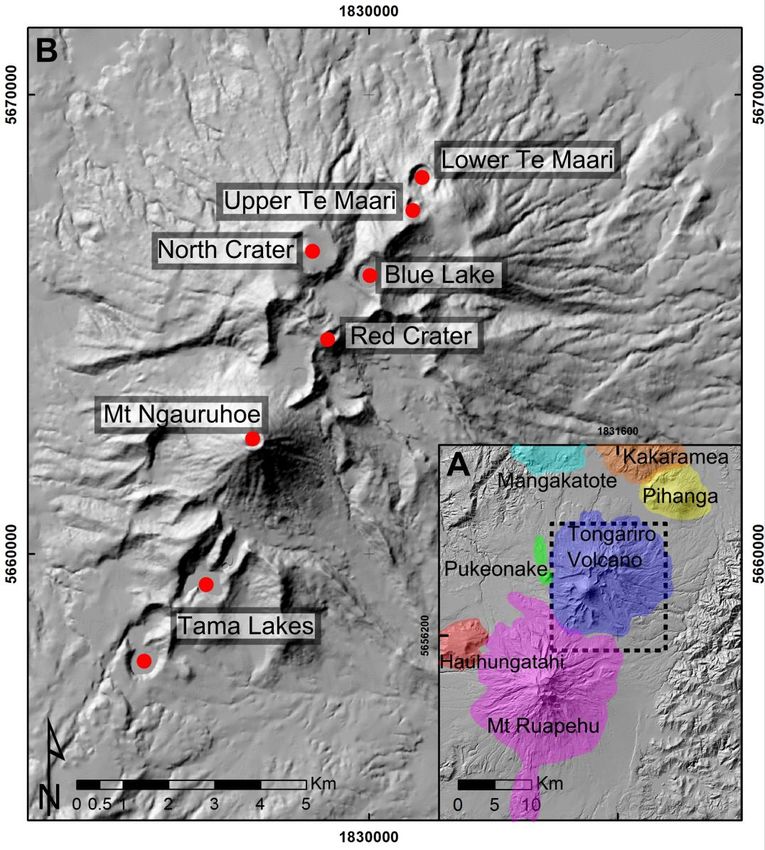
vi
vii
ACKNOWLEDGEMENTS
Firstly thanks to my amazing supervisors Ben Kennedy, Tom Wilson, Art Jolly and Gert Lube
for all the support, guidance and discussions. Ben and Tom, thank you for creating such an
awesome thesis topic for me, for always being so positive and enthusiastic, for all the
opportunities you’ve given me and for dealing with all my last-minute submissions (sorry!). I
also want to acknowledge Kae Tsunematsu without whom I would not have any models to
present. Thank you for always being so kind and understanding when I would ask for models
to be rerun!

I would like to acknowledge my field assistants Emma Rhodes, James Cowlyn, Matt Edwards
and Aaron Lister. Thanks for being so willing to help out and for always carrying the heavy
stuff - especially the DCP!

To everybody in office 401 – I don’t think there has ever been a better office. Thanks for the
laughs, the entertaining office pranks, my terrarium, free reign over the heater, and most of
all for helping me at the end – I honestly could not have finished without you. Additionally
thanks to all the other staff and students who make the department such an awesome
place.

Thanks to the Department of Conservation, especially Harry Keys, Ngāti Hikairo ki Tongariro
and Ngāti Tuwharetoa for allowing me to carry out fieldwork on Tongariro.

This project was supported by funding from the Mason Trust and Project Tongariro, without
which fieldwork would not have been possible.

Thank you to the technical and administrative staff who have helped me along the way, in
particular Kerry Swanson, Sacha Baldwin-Cunningham, Janet Brehaut, Janet Warburton and
Pat Roberts.

                                                                                           viii
And last but not least, a big thank you goes to my family for always supporting and
encouraging me, for all the late night food deliveries, for the motivating phone calls when I
really needed it, and for just being generally awesome.

                                                                                           ix
CHAPTER 1: INTRODUCTION
1.1 CONTEXT OF STUDY
Volcanic eruptions produce a number of hazards that can impact society. Of these, volcanic
ballistic projectiles, frequently ejected from explosive eruptions, represent a significant
proximal hazard to people, buildings, infrastructure and the surrounding environment. Their
high impact and sometimes thermal energies can result in death or serious injury (Blong
1984; Baxter and Gresham 1997), building damage (Pistolesi et al. 2008; Wardman et al.
2012; Jenkins et al. 2014), ignition of both buildings and the environment they impact (Zobin
et al. 2002; Alatorre-Ibargüengoitia et al. 2006; Wardman et al. 2012), and damage to the
surrounding environment. The impacts of volcanic hazards such as ballistic projectiles can
be reduced through volcanic risk management including volcanic hazard and risk
assessments, volcanic surveillance and risk mitigation strategies such as land use planning,
eruption warnings and volcanic engineering.
Hazard assessments are undertaken to determine the likelihoods of events occurring that
may produce hazards and the areas that may be impacted by these hazards (Thouret et al.
2000; Alatorre-Ibargüengoitia et al. 2006; 2012). The likelihood of consequences (e.g. death
or serious injury) from exposure to the hazard are determined in risk assessments (Blong
1996). For ballistic risk assessments this may involves a review of the volcanic eruption
history to determine past eruption magnitudes and frequencies to inform probabilities of
future eruptions; determining the nature and extent of past ballistic distributions through
field mapping or remote sensing, and possible future distributions through ballistic
trajectory modelling; and identifying assets in the area that may be impacted, such as
people and buildings, and their vulnerability to the hazard (e.g. likelihood of death or
damage) (Nadim 2013).
Ballistic hazard and risk assessments are used as the basis for risk management strategies,
such as implementing evacuation and exclusion zones, designing engineering solutions for
the built environment, and land use planning (Sparks et al. 2013). However, creating a
complete assessment can be challenging, requiring a large amount of information which can
1be challenging to collect. For example, field mapping is time consuming, labour intensive
and can be hazardous due to the risk of further eruption; subsequent ash deposition can
obscure impact craters; and remote mapping may be limited by image resolution. As a
result, those managing the risk of ballistic hazards at active volcanoes have tended to use a
precautionary hazard assessment approach, where a concentric hazard zone is used to
account for uncertainty in directionality of eruption pulses. The radius of the zone is
typically identified by the maximum travel distance of a ballistic for various magnitude
eruption scenarios, informed by field surveys or ballistic trajectory models (Alatorre-
Ibargüengoitia et al. 2006; 2012; Jolly and Taig 2012). However, this can lead to large areas
being classified potentially hazardous which can compromise social and economic activities
within those areas, especially if risk management treatments are applied. Balancing the risk
to life against the impact of risk management treatments is a substantial issue for
contemporary volcanic risk management (Sparks et al. 2013). Therefore there is increasing
need and emphasis placed on producing quantifiable, transparent and customised ballistic
hazard and risk assessments, especially in situations where social and economic activities
require access to hazardous zones.
A recent example of this was the 6 August, 2012 hydrothermal eruption at the Upper Te
Maari Crater, Tongariro Volcano, New Zealand. The eruption produced a range of volcanic
hazards including ashfall (as far away as Napier, ~110 km from the vents), at least three cold
surges, a debris avalanche and ballistics (Lube et al. 2014; Pardo et al. 2014; Procter et al. in
press). Ballistics and surges were considered to be the main threats to life produced in the
eruption, with ballistics impacting a ~6 km2 area which included 2.6 km of the Tongariro
Alpine Crossing (TAC), hiked by ~80,000 people each year, and Ketetahi Hut. It was the first
eruption to occur from Upper Te Maari since 1899 (Scott and Potter 2014) and was followed
by a smaller eruption on 21 November, 2012. This eruption is thought to have ejected
ballistics, but were not ejected far enough to pose a risk to the TAC. There was concern that
these events might have been the beginning of a prolonged episode, similar to the 1896 - 97
eruption episode, which would create an ongoing ballistic and surge hazard to the TAC (see
Jolly and Taig 2013). Ballistic hazard and risk assessments were completed prior to re-
opening of the TAC to the public, however, due to the risk of further eruption and the need
for timely assessments, these were based on very preliminary field mapping data with
2impact densities from a single area of interest (Ketetahi Hut) used to estimate hiker
vulnerability for the entire affected track (from the August eruption; Jolly and Taig 2012;
2013).
This study aims to produce a detailed assessment of ballistic hazard and risk from Upper Te
Maari Crater. This will be achieved through:
1) A review of mapped ballistic distributions at other volcanoes around the world.
2) A review of the eruptive history of Upper Te Maari and its eruptive styles and
frequencies.
3) Field and orthophoto mapping of the 6 August, 2012 ballistic impact crater
distribution.
4) Calibration of the Tsunematsu et al. (2013) ballistic trajectory model using the 6
August ballistic impact distribution, and refinement of eruption parameters through
inverse modelling.
5) Forward modelling of three possible future eruption scenarios using the calibrated
Tsunematsu model.
6) Vulnerability analyses along the Tongariro Alpine Crossing, incorporating variations
in ballistic impact density along the impacted track.
1.2 RISK MANAGEMENT FRAMEWORK
The risk management framework, produced by the International Standards Organisation
(ISO), was used as a conceptual framing of this thesis. This framework provides different
research organisations and research groups with a common guideline to risk reduction
through a process of risk identification, analysis, evaluation and treatment (Figure 1; ISO
2009). Following the Upper Te Maari eruptions, GNS Science utilised this framework to
produce risk assessments, as such, the framework is outlined to show how this study
contributes to managing the hazard and vulnerability associated with volcanic ballistic
projectiles ejected from Upper Te Maari Crater, Tongariro (Jolly and Taig 2012; 2013).
3Figure 1. ISO 31 000 risk management framework (ISO 2009).
Risk is a product of hazard and vulnerability and is expressed in the equation:
Hazard x Vulnerability = Risk
Hazard is defined as a natural event (such as a volcanic eruption) that has the potential to
cause harm or loss of life and damage to buildings, infrastructure and the environment. The
probability of occurrence of the event within a specific time period and a given area, and the
magnitude of the event are also incorporated (Marker 2013; Nadim 2013). The term
vulnerability refers to the degree to which a person, buildings or infrastructure is likely to
experience harm, loss or damage from exposure to the hazard (Cutter 2013). Risk refers to
the probability that harm, loss or damage will occur as a result of the hazard.
The first step in the risk management process is to establish the context, including the scope
and objectives, of the study. This is followed by risk identification in which all potential
4volcanic hazards within a specific area are identified and their impacts characterised. This
step also includes identifying all elements (i.e. people, infrastructure, buildings) that are at
risk from the hazard and how they relate spatially and temporally with the hazard, and their
potential vulnerabilities (Crozier and Glade 2005). In volcanic risk assessment, hazard maps
are a primary communication tool used to portray this information to decision makers, the
public and other scientists (Sparks et al. 2013; Appendix A). Hazards are identified through
review of previous events that have occurred in the area of interest from geologic and
literature investigations (Tilling 1989; Blong 1996; Sparks et al. 2013). Essentially, this step
identifies all factors that require further investigation in the risk analysis step (Crozier and
Glade 2005). In this study, based on the 2012 Te Maari eruptions, ballistics were identified
as a considerable ongoing hazard and hikers along the Tongariro Alpine Crossing as
elements that may be impacted, requiring further analysis.
The risk analysis and evaluation steps focus on developing an understanding of the
identified risks, in order for them to be compared and prioritised (ISO 2009). This involves
assessments of the frequency and magnitude of the volcanic hazards and the vulnerabilities
of the exposed elements. The assessments can be deterministic, probabilistic or a
combination of both. Deterministic assessments use hypothetical eruption scenarios based
on previous eruption data (typically the maximum credible events) to determine the impact
of volcanic hazards on the elements. However, several limitations are evident including:
uncertainty of risks due to subjective judgements by experts; scenarios can only be assessed
one at a time; and the likelihood of the risks are not quantified (Kaye 2008). For this reason
probabilistic assessments are increasingly desired. Probabilistic assessments are used to
determine the probability of a hazard occurring and its associated damage from a range of
scenarios (varying in magnitude and frequency), with limited subjective input. The degree of
damage in each scenario can be determined by incorporating fragility functions into the
probabilistic risk assessment. Vulnerability or fragility functions are probabilistic functions
which relate the amount of damage to an element, or vulnerability, to hazard intensity (e.g.
ashfall thickness, ballistic impact density). They are helpful during risk assessment as it can
be seen under which conditions damage or disruption can occur and where mitigation
measures may help reduce damage and risk. This information can also be presented in a
hazards map to illustrate levels of hazard and risk around a volcano. A combination of
5deterministic and probabilistic methods are used in this study to assess ballistic hazard and
vulnerability from Upper Te Maari. Eruption frequency and magnitude are determined from
the eruptive history of Upper Te Maari and a frequency-magnitude split used to estimate
probabilities of occurrence for three eruption sizes (probabilistic). These scenarios are then
modelled using a 3D ballistic trajectory model in order to analyse and compare hazard and
vulnerability in possible future scenarios (semi-quantitative deterministic).
Risk treatment, the final step in the risk management framework, is aimed at reducing the
hazard and/or vulnerability of the elements within the affected area. Reduction of volcanic
hazards in most cases is difficult and sometimes impossible as they are natural events that
are not easily controlled (Blong 1996). Thus, it is more beneficial to focus on reducing the
vulnerability rather than the hazard. Vulnerability can be reduced through: implementation
of various mitigation strategies/actions/techniques developed through the integration of
laboratory and field analysis; volcanic surveillance that may indicate volcanic unrest, leading
to closures and evacuations; and education and communication with the public about the
volcanic hazards and risks they may face and how they can reduce their personal
vulnerability (Blong 1996; Tilling 2008). Vulnerability reduction at Upper Te Maari is
ongoing. The hazard maps and analysis initiated in this thesis are presented to facilitate and
promote vulnerability reduction at Upper Te Maari and other volcanoes worldwide.
1.3 OUTLINES OF THESIS STRUCTURE/RESEARCH METHODOLOGY
Chapter 1 provides an introduction to ballistic hazard, hazard and risk assessments and an
overview of the risk management framework as a conceptual framework for this thesis.
Chapter 2 is focussed on risk identification through a literature review on the geological
setting, eruptive history of Te Maari and its eruptive frequency, ballistic impacts, ballistic
distribution maps and ballistic models. Chapter 3 describes the field study on the 6 August
2012 eruption ballistic distribution, results from the calibration of the ballistic trajectory
model to the field results, and hazard assessments on this and two possible future eruption
scenarios. Risk analysis and evaluation were completed through determination of
vulnerability along the Tongariro Alpine Crossing (TAC) to a person at the time of exposure,
for the three eruption scenarios. This was achieved through ascertaining the area of hazard
6produced by a ballistic and the impact density from each scenario. Chapter 4 describes
limitations of the study and opportunities for future work. Conclusions are drawn in Chapter
5.
Chapter 3 is a journal article which has been accepted and is in press as part of the Journal
of Volcanology and Geothermal Research Special Issue: Tongariro Volcano. For this paper, I
completed the vast majority of field mapping, orthophoto mapping and data analysis, as
well as writing the vast majority of the paper. Collaboration with co-authors was required as
part of data collection and manuscript preparation, which I outline here:
Ben Kennedy (senior supervisor; UC), Tom Wilson (co-supervisor; UC), Art Jolly
(associate supervisor; GNS Science) and Gert Lube (associate supervisor; Massey
University) provided discussion on data analysis and interpretation and conceptual
development of the research as part of normal academic supervisory relationship.
Kae Tsunematsu, Mount Fuji Research Institute, collaborator. Kae ran the ballistic
trajectory model from her computer in Japan, though using my field data and with
me leading the source parameter selection and completing analysis.
Eric Breard, Massey University, collaborator. Eric provided additional data (~20
crater locations) collected that outlined the edge of the ballistic field to the east and
south, outside the orthophoto extent and which I was not able to reach in the field
Jo Pawson, University of Canterbury, collaborator. Field assistant - mapping.
Michael Rosenberg, GNS Science, collaborator. Provided block data GNS collected
near the crater and around Ketetahi Hut in the days immediately following the
eruption).
Shane Cronin, Massey University, collaborator. Provided discussion on data analysis
and interpretation.
7CHAPTER 2: LITERATURE REVIEW 2.1 INTRODUCTION A literature review was conducted to address the thesis research aims and objectives by: understanding the geology of the study area; assessing Upper Te Maari’s eruption history to understand eruptive style and the frequency of eruptions; identifying impacts to people and buildings from ballistic strike; reviewing published ballistic distribution maps in relation to fully identifying hazards; and reviewing the progression of models of ballistic trajectory to introduce the model used in this study. 2.2 GEOLOGICAL SETTING 2.2.1 TAUPO VOLCANIC ZONE (TVZ) The boundary between the Pacific and Indo-Australian plates controls much of New Zealand’s current geology. In the northern part of New Zealand subduction of the oceanic Pacific Plate beneath the North Island (continental Indo-Australian Plate) occurs obliquely at a rate of 42 – 50 mm/yr. (Cole 1990; De Mets et al. 1994; Bibby et al. 1995). This is expressed by the Taupo-Hikurangi arc-trench system, contiguous with the northern Tonga- Kermadec arc system, extending from the Hikurangi Trough east of the North Island to the Taupo Volcanic Zone at the western edge of the system (Carter 1980; Cole and Lewis 1981; Cole 1990). The Taupo Volcanic Zone (TVZ) denotes the currently active arc and back-arc basin and the location of active volcanism from the Late Pliocene (~2 Ma) to the Quaternary (Cole 1990; Wilson et al. 1995). The TVZ stretches from Ohakune to the edge of the continental shelf (~100 km offshore), some 300 km in length and at its maximum 60 km in width, in a NNE - SSW trend (Cole 1990; Wilson et al. 1995). Extension rates vary along the TVZ due to the oblique subduction and subsequent clock-wise rotation of the forearc, with ~15 mm/yr occurring at the Bay of Plenty decreasing to
the northern and southern sections have more dextral shear and smaller eruptive volumes
compared with the central section which has greater eruptive volumes and is purely
extensional.

2.2.2    TONGARIRO VOLCANIC CENTRE (TgVC)

The Tongariro Volcanic Centre (TgVC), located at the southern tip of the TVZ, is comprised of
four large volcanoes (Tongariro, Ruapehu, Pihanga and Kakaramea), three smaller centres
(Pukeonake, Mangakatote and Hauhungatahi) and four craters near Ohakune (Cole 1986;
1990; Figure 2A). Eruptive products of the TgVC are predominantly calc-alkaline medium K
andesites with minor occurrences of basalt and dacite (Cole et al. 1986; Graham and
Hackett 1987). Based on the compositional variation in lava flows and pyroclastic units,
Gamble et al. (1999), Hobden et al. (1999), Price et al. (2005) and Kilgour et al. (2013)
propose that magma in the TgVC is erupted from a complex system of multiple small holding
chambers, such as dikes and sills, in the crust and upper mantle rather than larger crustal
magma reservoirs.

Pebbles of Mt. Ruapehu andesite found in Lower Pleistocene conglomerates indicate
volcanism at the TgVC has occurred for at least 300 ka (Fleming 1953). Many of the older
vents of the TgVC (Kakaramea and Pihanga) are aligned in a SE orientation, differing from
the younger post 20 ka vents that are oriented NNE – SSW (Cole et al. 1986; Graham and
Hackett 1987). The younger vent lineation parallels the trend of the Taupo Fault Belt, a
dense system of normal faults that accommodate the extension in the back-arc basin, and
the present day subduction system (Graham and Hackett 1987; Berryman and Villamor
1999).

Tongariro Volcano, the second largest volcanic edifice (c. 60 km3) in the TgVC, is comprised
of at least 17 overlapping composite volcanic cones, the youngest being Ngauruhoe (Cole et
al. 1986; Hobden et al. 1999). K – Ar age determination by Hobden et al. (1996) indicates
that Tongariro Volcano has been active for at least 275 ka, with the oldest units found at
Tama Lakes. Main periods of cone growth were found to have occurred between 210 and
200 ka, 130 and 70 ka, and 25 ka to the present day. Topping (1974) and Cole and Nairn
(1975) divide the Tongariro lavas into older (>20 ka) and younger (
original topographic expression is left of the older lavas, inferred to have erupted from the
NW – SE oriented line of vents. The younger lavas erupted from the NNE – SSW trending line
of vents including North Crater, Blue Lake, Tama Lakes, Ngauruhoe, Red Crater and Te Maari
(Cole 1978; Figure 2B). The latter three vents have also been the location of the most recent
activity.

Figure 2. Location map of A: volcanoes comprising Tongariro Volcanic Centre (TgVC) and B: young
eruptive vents trending NNE – SSW (DEM is NZSoSDEM v1.0 09 Taumarunui 15 m).

2.3     TE MAARI ERUPTION HISTORY

The Te Maari craters, located on the NE flank of Tongariro, include Upper Te Maari crater
(200 m in diameter), Lower Te Maari crater (400 – 500 m wide and 60 – 80 m deep circular
crater) and a series of seven small explosion craters northeast of Lower Te Maari (Moebis

                                                                                            10
2010). Age dating of deposits in and around Te Maari suggests that the area may have been
active for hundreds to thousands of years. Eruptions from Te Maari have ranged from rare
Plinian events (~10 ka eruptions) to the more common and smaller hydrothermal events
(summarised in Table 1). These have occurred both individually and as eruption episodes
(1896 – 1897 and 2012). Ballistics were noted in only 3 of the 22 historical eruptions (the 15
December, 1896 eruption, the 6 August, 2012 eruption studied in this thesis and the 21
November, 2012 event), however may have been produced but gone unnoticed or
unrecorded in more due to the remoteness of the location 100 years ago. Using all possible
historical eruptions (22) over the 145 year eruption history, results in an average eruption
frequency of 0.15 per year. However, the majority of the eruptions are grouped together in
three periods of heightened activity (1869, 1892 – 1899, and 2012) over 145 years. The
annual frequency of occurrence of a period of heightened activity during a period of
dormancy is then 0.02 per year. The 2012 eruptions could be considered to be the beginning
of a period of heightened activity that may still be ongoing, indicating the probability of
eruption may be currently higher than the average frequency over 145 years. An average
frequency of occurrence can be found using the 1892 – 1899 period of heightened activity in
which 19 eruptions occurred over seven years, indicating an eruption frequency of 2.7 per
year.
Nairn et al. (1998) propose Lower Te Maari as a possible source of the Te Rato Lapilli and
Poutu Lapilli, tephras of the ~10,000 ka multiple vent Tongariro Plinian eruption episode.
Beneath the pyroclastic apron surrounding Upper Te Maari are multiple lava flows
extending towards the NW and into Lower Te Maari Crater. Using dendrochronology,
Topping (1974) dated the flows as having a maximum age of 1528AD. Local Maori often
witnessed eruptions over the past few hundred years from Lower Te Maari (Cowan 1927),
however the first written account of activity did not occur until 1839, when Bidwill recorded
steam rising from the Northern slopes, likely Lower Te Maari (Gregg 1960).
Accounts of historical eruptions from Upper Te Maari Crater were collated by Scott and
Potter (2014) and inform much of the following summary of eruptive activity between 1869
and 1899.
11The first eruption from Te Maari recorded in written accounts occurred in early 1869 and is
attributed to the formation of Upper Te Maari Crater (Cowan 1927). Hill (1891; 1892)
describes an ash column with a “bright red flame” that deposited “dust, pumices and
ashes". A further ash-producing eruption was recorded on the 30 November 1892 (New
Zealand Herald, 6 December 1892; Gregg 1960; Cole & Nairn 1975). The latter produced a
900 m high column consisting of ash and pumice lapilli, and pyroclastic density currents
(PDCs) that reached SH46 around 3 km from the vent (Hill 1893). Pardo et al. (2014) propose
that the eruption was hydrothermal or phreatomagmatic in nature.
A series of eruptions, or an eruption episode, commenced on 13 November 1896 with two
explosive eruptions of ash and lapilli with possible incandescence (Evening Post, 14
November 1896; Otago Daily Times, 24 December 1896). Ash producing eruptions
continued intermittently between the 24 November and the 1 December with larger
eruptions on the 27 and 30 November (New Zealand Herald, 1 December 1896; Otago Daily
Times, 24 December 1896). Samples of ash collected on the 29 November were very fine
grained, suggesting the 27 November eruption may have been phreatomagmatic (Scott and
Potter 2014). A few weeks later on the 15 December 1896, Upper Te Maari erupted again
though more explosively than any of the previous eruptions in this episode. The eruption
produced a >6 km high ash plume, which had a dark red glow at the base, depositing ash as
far away as Napier. Incandescent blocks and bombs weighing up to 4 tonnes were ejected as
far as 800 m from the vent and a 33 m wide rift was produced upslope. Deposits of “mud,
stones and sand” produced in the eruption were found to extend to Ketetahi and Red Crater
(Poverty Bay Herald, 16 December 1896; New Zealand Herald, 5 January 1897; Bay of Plenty
Times, 13 January 1897; The Press, 16 January 1897; Friedlaender 1898). Pardo et al. (2014)
propose that the “mud, stones and sand” may be surge deposits and that the eruption may
be comparable to a Vulcanian style with the production of surges, incandescent ballistics
and extensive ashfall. Ash eruptions were witnessed again on the 21 December 1896, 25
January 1897 and 6 February 1897, with the latter said to be the largest plume witnessed in
this sequence (Auckland Star, 21 December 1896; New Zealand Herald, 26 January 1897 &
28 January 1897; Evening Post, 8 February 1897; Bay of Plenty Times, 12 February 1897).
The final three eruptions in this sequence occurred on the 17 and 22 September and 18
October 1897. The 22 September eruption consisted of steam and ash, however the nature
12of the earlier and latter eruptions are not known (Poverty Bay Herald, 18 September 1897;
Colonist, 21 October 1897). Eruptive activity occurred again at Upper Te Maari between 29
and 30 August 1899 producing an ash plume (New Zealand Herald, 6 September 1899).
An increase in seismicity beneath the northern slopes of Tongariro was noted by GNS
Science from the 12 July 2012 (Jolly et. al. 2014). Sampling of fumaroles near Upper Te
Maari commencing on the 21 July 2012 also revealed an increase in magmatic signatures
(Christenson et al. 2013). This unrest preceded a hydrothermal eruption from Upper Te
Maari Crater on the 6 August 2012 at 11:52pm NZST (Rosenberg 2012). The eruption
generated a debris avalanche, ~8 km high ash plume, multiple surges and ballistic blocks
that travelled up to 2.3 km from vent (Crouch et al. 2014; Lube et al. 2014; Procter et al. in
press). A more detailed description is provided in Chapter 3.
Three months after the August eruption on 21 November 2012, a second smaller event
occurred. This eruption happened during the day (1:25pm NZST) and was both recorded on
monitoring webcams and observed by hikers along the Tongariro Alpine Crossing (TAC). An
ash column (3 – 4 km in height) and two small low density pyroclastic flows were generated
though did not travel more than a few hundred metres. Finger jets can be seen in videos of
the eruption, likely carrying ballistics, however there is no evidence to show them travelling
far from the vents (Scott and Fournier 2012a; Scott and Fournier 2012b).
13Table 1. Historical eruptions of Upper Te Maari (modified from Scott and Potter 2014)
Date Description of activity References
Ash eruption, probable formation of Upper Te Maari Crater, Possible
Early 1869 Strombolian eruption ("bright red flame in ash cloud, would burst at top of Hill 1891 & 1892; Cowan 1927; Cole and Nairn 1975
ash cloud and fall in little pieces like snow")
30 Nov. 1892 Ash eruption ~900m in height, accompanied by PDCs New Zealand Herald (6 December 1892); Cole and Nairn 1975
13 Nov. 1896 2 explosive ash-lapilli eruptions Evening Post (14 November 1896); Otago Daily Times (24 December 1896)
24 Nov. 1896 Explosive ash eruption New Zealand Herald (25 November 1896); Otago Daily Times (28 November 1896)
25 - 30 Nov. Ash eruptions on most days (6 in total), larger eruptions on the 27th New Zealand Herald (1 December 1896); Otago Daily Times (24 December 1896);
1896 (possibly phreatomagmatic due to fine grained ash) and 30th. New Zealand Herald (1 December 1896)
1 Dec. 1896 Ash eruptions continued, brown ash component Evening Post (1 December 1896); Friedlaender 1898
Explosive Vulcanian eruption >6 km in height, 15 minutes long, ash column
Poverty Bay Herald (16 December 1896); The Press (16 January 1897);
15 Dec. 1896 with dark red glow at base, ejected incandescent blocks/bombs, extensive
Friedlaender 1898; Pardo et al.2014
fine and pumiceous ash fall as far as Napier, possible surges
21 Dec. 1896 Ash eruption Auckland Star (21 December 1896)
25 Jan. 1897 Ash eruption New Zealand Herald (26 & 28 January 1897)
6 Feb. 1897 Ash eruption, largest seen in eruptive sequence Bay of Plenty Times (12 February 1897)
17 Sept. 1897 Eruption (no information on whether steam or ash) Poverty Bay Herald (18 September 1897)
22 Sept. 1897 Eruption of steam and "smoke" NZ Herald (23 September 1897)
18 Oct. 1897 Eruption (no information on whether steam or ash) Colonist (21 October 1897)
29-30 Aug. 1899 Ash eruption New Zealand Herald, 6 September 1899
Magmatic hydrothermal eruption. Produced 8 km ash column, debris
6 Aug. 2012 Rosenberg 2012; Crouch et al.2014; Lube et al.2014; Procter et al. in press
avalanche, ballistics up to 2.3 km, and at least 3 PDCs
21 Nov. 2012 Eruption producing ash column and PDCs Scott and Fournier 2012a
142.4 BALLISTIC HAZARD IMPACTS
Volcanic ballistic projectiles constitute a major proximal hazard to people, infrastructure and
the surrounding environment. Particles range from centimetres to metres in diameter and
may be juvenile (bombs) or lithic (blocks) in nature (Steinberg and Lorenz 1983; Yamagishi
and Feebrey 1994; Bower and Woods 1996; Alatorre-Ibargüengoitia et al. 2012). They can
travel up to ~10 km from the vent (Steinberg and Lorenz 1983; Alatorre-Ibargüengoitia et al.
2012) at up to hundreds of metres per second (Minakami 1942; Nairn and Self 1978;
Fagents and Wilson 1993).
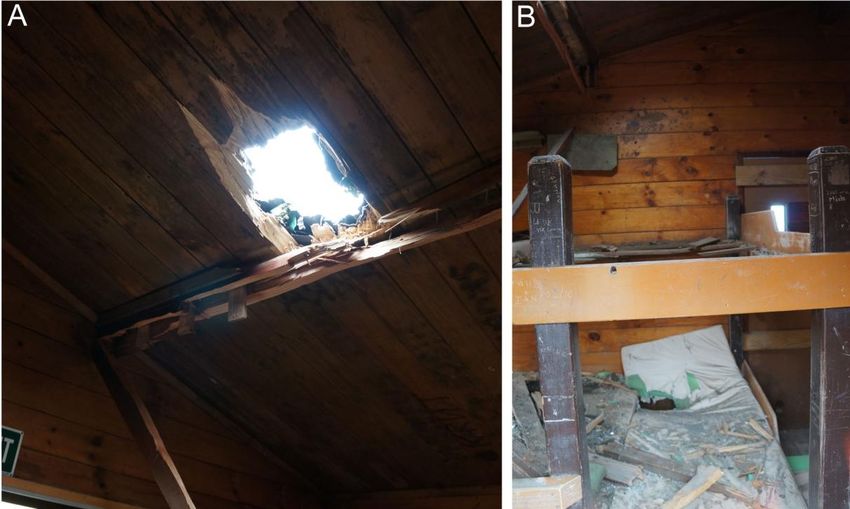
Figure 3. Damage to Ketetahi Hut from ballistics ejected in the 6 August, 2012 Upper Te Maari
eruption. The ballistic penetrated the roof (A), passing through two bunk beds (B) before puncturing
through the floor (photo credit: Emma Rhodes).
Projectiles have high kinetic and impact energies, capable of penetrating buildings and
causing serious injury or death to those they strike (Figure 3). Alatorre-Ibargüengoitia et al.
(2012) estimate the kinetic energy of projectiles from VEI 2 – 4 eruptions to be ~106 J – far
greater than the energy needed (400 – 1000 J) to penetrate a metal sheet roof (Jenkins et al.
2014). Ballistics ejected in the 2010 eruption of Pacaya Volcano, Guatemala punched
through metal sheet roofs and additionally ignited some of the impacted dwellings (due to
15the high thermal energy) ~3 km from the vent (Wardman et al. 2012; Jenkins et al. 2014).
Fires were also started by ballistics during the 1994 – 1998 eruptions of Popocatépetl
(Delgado-Granados et al. 2001) and the 1999 – 2001 eruption at Colima (Zobin et al. 2002).
Blong (1984) describes accounts of both injury and death as a result of ballistic strike from
volcanic eruptions. Three children suffered from fractured skulls in the 1902 Soufriere St
Vincent eruption, and one victim had his thoracic cavity pierced and collar bone broken in
the June 1914 eruption of Mt Lassen. In the March 1944 eruption of Vesuvius three fatalities
occurred from falling bombs up to 5 km from the vent. Five people died and seven were
seriously injured from ballistics in the 14 January 1993 eruption of Galeras Volcano,
Colombia (Baxter and Gresham 1997). Injuries included skull, jaw, temporal bone, hand and
leg fractures, burns, concussion, and lacerations and contusions. Kinetic energies >80 J are
suggested by Baxter and Gresham (1997) to be the threshold of lethality of ballistics. They
propose a particle weighing 10 kg carries a 90 % probability of death travelling at 6 – 13 m/s.
Ballistic velocities are generally much faster than this, thus presenting a high level of hazard
and vulnerability to people. However, the probability that a person is hit by a ballistic is
dependent on the distribution and impact density around a volcano.
2.5 BALLISTIC IMPACT DISTRIBUTION MAPS
Ballistic impact distribution maps are used to identify the nature and extent (e.g. size and
shape of the ballistic field and the variation of impact density) of the ballistic hazard.
Published maps are not common and, when they are published, are often incomplete
(either only displaying the outer edges of the field or only portions of the field) (Minakami
1942; Nairn and Self 1978; Self et al. 1980; Yamagishi and Feebrey 1994; Robertson et al.
1998; Houghton et al. 2011). This is due to a multitude of reasons including: the risk of
further eruption; subsequent deposition of ash or precipitation obscuring craters; the time
consuming and labour intensive nature of field mapping; and when mapping can be done
remotely (e.g. aerial photos, video, thermal imagery) is hampered by resolution. Maps can
include locations of ballistic particles, impact craters when ballistics are not easily found, or
a combination of the two. Impact maps can be used to understand eruption dynamics such
16as direction, angle and velocity, and can indicate size of eruption (how far ballistics travelled). They are important constituents of volcanic hazard maps. Complete maps have been produced by Pistolesi et al. (2008) and Gurioli et al. (2013). A combination of field surveys and aerial photos were used by Pistolesi et al. (2008) to map the impact field produced by the 5 April 2003 eruption of Stromboli. Both crater and blocks were located, though blocks
km with impact craters up to 6 m in diameter and blocks up to 1.2 m) eruptions, though do
not provide individual impact locations.

The boundary of the ballistic field and 200 blocks and bombs in eight radiating profiles (from
the vents) were mapped by Self et al. (1980) from the Ukinrek Maar eruptions in 1977. Two
distributions were found: an earlier eruption had ejected blocks 2 – 3 m in diameter up to
700 m from the crater increasing in size with distance; and a later eruption of bombs and
blocks that travelled the same distance as the previous distribution but projectiles
decreased in size with distance.

Isopleth maps of ballistic fields are presented in Kilgour et al. (2010) and Houghton et al.
(2011). Kilgour et al. (2010) mapped the ballistic fallout from the 25 September 2007
Surtseyan eruption of Mt. Ruapehu, though again individual ballistic locations are not
presented. A combination of orthophoto analysis and field surveys (though limited due to
the risk of further eruption) were used to map the northerly directed strew field in which
blocks up to 2 m were ejected up to 2 km from the vent. Ballistic ejecta (
2.6    BALLISTIC MODELS
Ballistic blocks and bombs generated in volcanic eruptions decouple from the eruptive
column to follow nearly parabolic trajectories (Minakami 1942; Wilson 1972; Fagents and
Wilson 1993). Models of particle transport are valuable tools in both ascertaining eruption
dynamics (correlating initial particle velocity with deposition distance) and modelling and
assessing ballistic hazard.

To determine the initial velocities of ballistics ejected from eruptions of Asama volcano,
Japan, Minakami (1942) created a mathematical expression that related ejection velocity
and angle to the distance the ballistic travelled (based on mapping of the outer edges of the
impact field), including the effects of drag and wind speed.

The initial velocity of ballistics ejected in the 1968 eruption of Arenal Volcano was estimated
using a model derived by Fudali and Melson (1972). In the absence of ballistic size
(projectiles broke and scattered on impact), the authors used impact energy derived from
crater size and a series of ballistic trajectory calculations to estimate ballistic size and
maximum initial velocity. Both this and the previous model assume a spherical ballistic
shape to determine their drag coefficient.

The first mathematical algorithm that modelled ballistic trajectories was developed by
Wilson (1972). Trajectory was expressed through a rectangular coordinate system and a 4 th
order Runge-Kutta method, taking into account gravity and drag forces (assuming a
cylindrical shape rather than spherical due to its aerodynamic properties) and allowing for
changes in atmospheric properties with height. Wilson explored fall times of clasts of
varying size and density from various heights, and the ranges of clasts ejected as a function
of initial velocity, ejection angle and clast density and size. Steinberg and Lorenz (1983)
apply a variation of this model to improve previous particle velocity estimates at Asama
(Minakami 1942), Arenal (Fudali and Melson 1972) and Shiveluch Volcanoes.

Calculations and models prior to the 1990s assumed a still, ambient atmosphere into which
ballistics were ejected. This resulted in overestimations of drag on particles and

                                                                                            19
subsequently initial particle velocity. Fagents and Wilson (1993) recognised that the air
overlying the vent is displaced en masse in volcanic explosions, at speeds initially
comparable to the ejected clasts. Ballistics are essentially coupled initially with the displaced
surrounding air, reducing the drag force to nearly zero, until the air and ballistics
progressively decouple at which time drag increases. An additional model describing the
explosion process is applied prior to the trajectory model devised by Wilson (1972). The
ejected material initially behaves as a coherent plug before reaching a maximum velocity, at
which the ballistics are then launched into the decelerating gas flow field. Once launched,
trajectory is then modelled using the Wilson (1972) model (though drag is now proportional
to the square of the ballistic velocity relative to the moving air, rather than the still
atmosphere in the original model).
Bower and Woods (1996) followed Wilson (1972) and Fagents and Wilson (1993) in using
equations of motion to model ballistic trajectory. Their model differs, however, from
Fagents and Wilson in that they model the trajectory of ballistics from small eruptions,
ejected from above the crater after separating from the collapsing jet at the crater rim and
encountering a still atmosphere. Bower and Woods (1996) propose particles are accelerated
when coupled with the jet phase within the conduit and vent until a shockwave is produced
as the jet meets the crater, causing the jet to decelerate but the ballistics to decouple and
continue with their original velocity.
‘Eject!’, a computer programme modelling ballistic trajectory, was developed by Mastin
(2001) to allow users to model their own scenarios. Following Wilson (1972), trajectory is
modelled using a rectangular coordinate system and a Runge-Kutta method. Users can
define the drag coefficient, ballistic shape, particle density and diameter, atmospheric
properties, ejection angle and initial velocity. A function quantifying the zone (distance) of
reduced drag around the vent was also added, similar to Fagents and Wilson (1993).
In previous models the drag coefficients used were of geometrical shapes (e.g. sphere, cube
and cylinder). Alatorre-Ibargüengoitia & Delgado-Granados (2006) measured the drag
coefficients (Cd) of volcanic particles in a subsonic wind tunnel. They found that C d
depended mainly on particle shape and texture and that the lowest Cd values should be
20applied in models to calculate maximum possible range. These results were then
incorporated into a ballistic trajectory model. Alatorre-Ibargüengoitia et al. (2012) coupled
this model with an eruptive model that considered caprock acceleration and consumption of
energy during fragmentation, informing ballistic velocity.
The aforementioned ballistic models, and the many others not mentioned, consider
movement of particles only in two dimensions and are only capable of modelling individual
particles. Tsunematsu et al. (2013) developed a three dimensional model that simulates the
trajectory of multiple ballistics and includes the effects of particle collision – something not
previously considered. The model is also the first to output the spatial distribution of the
ejected ballistics on the ground (assuming a flat surface), allowing direct comparison to
impact distribution maps. Trajectories are modelled using equations of motion and a
discrete event simulation method. Required input parameters include rotation and
inclination angle (ejection angle and standard deviation), initial particle velocity, particle
density and diameter, ejection direction, displacement of ejection points from the vent
centre (spread of ejection points), the number of particles ejected (per burst if more than
one eruption burst), and time interval between bursts. The model, originally designed for
Strombolian eruptions, is utilised for hydrothermal eruptions in this study, and the effects of
drag and the initial coupling of particles and gas jet is also introduced.
21CHAPTER 3: RESEARCH COMPONENT
3.1 INTRODUCTION
Chapter 3 contains the new research component of this study in which field and orthophoto
mapping of the 6 August ballistic distribution, calibration of the Tsunematsu (2013) model,
forward modelling of possible future eruption scenarios and vulnerability analyses along the
TAC are presented. It draws on the literature review undertaken in Chapter 2. The chapter
is structured in the follow way:
Detailed overview of the 6 August, 2012 Upper Te Maari eruption.
Methodology describing how orthophoto and field mapping of the 6 August ballistic
distribution were carried out, past ballistic trajectory models and the adopted
Tsunematsu et al. (2013) model, and how ballistic vulnerability is calculated.
Results of both the spatial and crater size distribution from ballistic block impacts of
the 6 August 2012 eruption, obtained through a combination of orthophoto mapping
and ground truthing. The crater distribution is then combined with acoustic data,
observations of vent morphology, and eyewitness accounts of the eruption to
parameterise a ballistic trajectory model (Tsunematsu et al. 2013).
Discussion in which the calibrated model is used to forward model the ballistic
hazard from two other possible future eruption scenarios. Ballistic vulnerability
along the impacted TAC is then calculated using the method described in the
methodology, for the 6 August modelled distribution as well as the two possible
future scenarios.
Conclusion summarising main results.
3.2 OVERVIEW OF 6 AUGUST 2012 ERUPTION OF UPPER TE MAARI
On 6 August 2012 at 23:52 (GMT +12) a small ~19 s hydrothermal eruption occurred at
Upper Te Maari, following a collapse and subsequent debris avalanche from the
hydrothermally altered western flank of the crater (Jolly et al. 2014, Procter et al. in press).
The eruption formed a ~430 m long arcuate fissure, split into a wider (>50 m) and deeper
22You can also read