Analysis of Microplastics - Status Report Sampling, preparation and detection methods
←
→
Page content transcription
If your browser does not render page correctly, please read the page content below
Status Report
W ithin the f ram ework program

Plastics in the Environment
S our c es • S ink s • S o lu tio n s

Analysis of Microplastics
Sampling, preparation and detection
methods

As of: May 2021
BMBF Research Focus „Plastics in the Environment“                     May 2021
Status Report Analysis of Microplastics

Author:
Dr. Ulrike Braun

 German Federal Institute of Material         Umweltbundesamt (UBA)
 Reserach (BAM)                               ulrike.braun@uba.de

Editors:
Dr. Ulf Stein, Ecologic Institute, Berlin
ulf.stein@ecologic.eu
Hannes Schritt, Ecologic Institute, Berlin
hannes.schritt@ecologic.eu

Contributing authors:
Dr. Korinna Altmann, BAM Berlin
Dr. Claus G. Bannick, UBA Berlin

Dr. Roland Becker, BAM Berlin
Hajo Bitter, TU Darmstadt

Dr. Mathias Bochow, GFZ Potsdam
Dr. Ulrike Braun, BAM Berlin

Dr. Georg Dierkes, BfG Koblenz
Dr. Kristina Enders, IOW Warnemünde
Dr. Kyriakos A. Eslahian, BS-Partikel GmbH Mainz

Dr. Dieter Fischer, IPF Dresden
Dr. Corinna Földi, BfG Koblenz
Prof. Monika Fuchs, HTW Berlin
PD Dr. Gunnar Gerdts, AWI Helgoland

Dr. Christian Hagendorf, Fraunhofer CSP Halle
Claudia Heller, HTW Berlin

PD Dr. Natalia P. Ivleva, TU München

2

BMBF Research Focus „Plastics in the Environment“                           May 2021
Status Report Analysis of Microplastics

Prof. Dr.-Ing. Martin Jekel
Prof. Dr. Jutta Kerpen, Hochschule RheinMain

Franziska Klaeger, IOW Warnemünde
Dr. Oliver Knoop, TU München

Prof. Dr. Matthias Labrenz, IOW Warnemünde
Prof. Dr. Christian Laforsch, Universität Bayreuth

Nathan Obermaier, UBA Berlin
Dr. Sebastian Primpke, AWI Helgoland

Dr. Jens Reiber, WESSLING GmbH
Dr. Susanne Richter, Fraunhofer CSP

Mathias Ricking, UBA Berlin
Dr. Barbara Scholz-Böttcher, Universität Oldenburg

Dr. Friederike Stock, BfG Koblenz
Dr. Stephan Wagner, UFZ Leipzig

PD Dr. Katrin Wendt-Potthoff, UFZ Magdeburg
Dr. Nicole Zumbülte, TZW Karlsruhe

Acknowledgments
The authors want to thank Dr. Saskia Ziemann, Daniel Venghaus, Markus Gahleitner,
Cordula Witzig, Dr. Ingo Sartorius, Dr. Sabine Lindner, Marco Kunaschk, Dr. Korbinian
Freier, Katharina Wörle, Dr. Christian Scheid and Dr. Peter Schweyen for their valuable
comments and contributions to this paper.

3
BMBF Research Focus „Plastics in the Environment“                                                                   May 2021
Status Report Analysis of Microplastics

Table of contents
1. Introduction .................................................................................................................. 6

      1.1 The research focus "Plastics in the Environment“ ............................................... 6
      1.2 About this status report ....................................................................................... 7

2. General principles ........................................................................................................ 8
      2.1 Objective ............................................................................................................. 8
      2.2 Definitions ........................................................................................................... 9

      2.3 Classification ..................................................................................................... 10
      2.4 Representation of results .................................................................................. 11

      2.5 Quality control ................................................................................................... 12

3. Identification of research objective and research question ........................................ 13
      3.1 Content determination ....................................................................................... 13
      3.2 Particle determination........................................................................................ 14

      3.3 Characterization of specific properties .............................................................. 14

4. Selection of the detection method ............................................................................. 15
      4.1 Spectroscopic methods ..................................................................................... 16
      4.2 Thermoananalytic methods ............................................................................... 23

      4.3 Chemical methods............................................................................................. 27
      4.4 Comparison of methods .................................................................................... 29

5. Selecting the Sampling Method ................................................................................. 32
      5.1 General ............................................................................................................. 32

      5.2 Water samples .................................................................................................. 35
      5.3 Solid and sludge samples ................................................................................. 39

      5.4 Atmospheric samples/ airborne particles........................................................... 41
      5.5 Biota samples .................................................................................................... 44

6. Selecting of the treatment method ............................................................................. 47
      6.1 General ............................................................................................................. 48
4
BMBF Research Focus „Plastics in the Environment“                                                                   May 2021
Status Report Analysis of Microplastics

      6.2 Density separation............................................................................................. 49

      6.3 Electrostatic separation ..................................................................................... 51
      6.4 Chemical treatment ........................................................................................... 52

      6.5. Enzymatic Processing ...................................................................................... 54
      6.6 Chemical extraction ........................................................................................... 55

7. Metrology and validation ............................................................................................ 56
      7.1 Reference materials .......................................................................................... 56
      7.2 Development of quantitative methods ............................................................... 59
      7.3 Operation of interlaboratory comparisons ......................................................... 60

      7.4 Testing processes and products ....................................................................... 63

8. Annex ........................................................................................................................ 65

5
BMBF Research Focus „Plastics in the Environment“ May 2021
Status Report Analysis of Microplastics
1. Introduction
The subject area "Plastics in the Environment" is multifaceted and encompasses various
aspects. Alongside many unresolved "research questions", microplastics (MP) analysis
in particular has proven to be a very complex task. There are still many unanswered
questions in this relatively new field of research. At the same time, it is undeniable that
MP are ubiquitously present and detectable. This has already been demonstrated by
numerous studies. However, it has been difficult to validate and reproduce the results
and consequently to draw comparisons between them. Even after several years of
experience, the analysis of MP is still a major challenge for many laboratories;
standardized and validated methods are still under development.
It is therefore all the more important to engage in an interdisciplinary discussion on
sampling, sample preparation and detection methods. This status report summarizes the
current state of knowledge on these topics from the last three years of work within the
research focus "Plastics in the Environment - Sources • Sinks • Solutions" and its
precursor projects. It presents proven methods for specific research questions and thus
forms an important basis for the further development and harmonization of MP analysis.
1.1 The research focus "Plastics in the Environment“
The German Federal Ministry of Education and Research (BMBF) is funding a total of 20
collaborative projects and a scientific accompanying project with around 40 million euros
over the period 2017-2021 as part of the research focus "Plastics in the Environment -
Sources • Sinks • Solutions" (www.bmbf-plastik.de). The aim of the research is to
scientifically assess problems associated with plastic waste in their entirety for the first
time and to close existing knowledge gaps.
More than 100 institutions from the fields of science, industry and practice are involved
in what is currently the world's largest research focus on the impact of plastics on the
environment. The research projects can be assigned to five different topic areas, which
are organized along the entire life cycle of plastics:
• Green economy: material flows, value chains, technologies
• Consumption, consumer behavior, trade and production, governance
• Recycling technologies
• Input pathways, transport, decomposition and retention in the limnic systems
• Seas and oceans as sinks and accumulation areas
6BMBF Research Focus „Plastics in the Environment“ May 2021 Status Report Analysis of Microplastics The interdisciplinary nature of the research focus is intended to provide a better understanding of the environmental impacts of undesirable plastic inputs, starting from soils, through river basins, and into the oceans. In addition, approaches to reducing and preventing inputs will be identified and implemented. The spectrum of topics covers the improvement of certain plastic materials with regard to their environmentally compatible degradability. It also encompasses the investigation of input pathways into soils and water bodies, the analysis of possible toxic effects on aquatic organisms as well as the strengthening of environmental awareness among consumers. As key users and implementers of innovations, companies are involved in the development and realization of the research projects since the beginning. 1.2 About this status report This status paper was prepared within the framework of the cross-cutting issue 1 "Analytics and reference materials" of the research focus. It summarizes the contents of the project discussions and coordination within the cross-cutting issue. The organization of this ongoing process of development or elaboration has been supported by several events. The status report presents a summary of the physicochemical methods for the analysis of MP used in the research focus "Plastics in the Environment". The present recommendations are based on the current state of knowledge of the analysis of MP and are directed at actors in science as well as potential users in practice. Scientists from the following collaborative projects of the research focus participated in the preparation of the status report via workshops, contributions and feedback loops: EmiStop, ENSURE, MicBin, MicroCatch_Balt, MikroPlaTaS, PLASTRAT, PLAWES, RAU, REPLAWA, RUSEKU, SubµTrack and TextileMission as well as the two predecessor projects MiWa and BASEMAN. 7
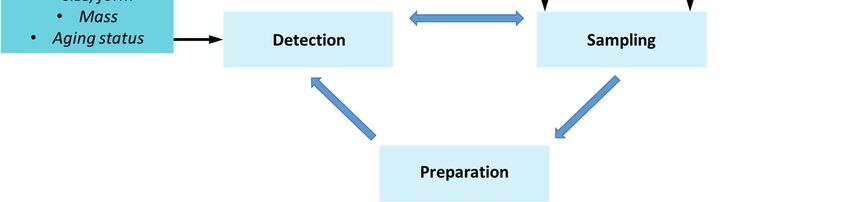
BMBF Research Focus „Plastics in the Environment“                                May 2021
Status Report Analysis of Microplastics

2. General principles
2.1 Objective

Different methods are necessary to answer the respective questions and goals. This
includes not only the detection methods, but also the related sampling and sample
preparation procedures extending to the statistical evaluation of the results. At the end,
we include an overview of strengths and limitations of different methods depending on
the problem to be addressed. A major objective is the safe and traceable examination of
the transport and input paths of MP into different environmental media, such as water
and soil, using the respective appropriate measurement and examination methods.

A schematic representation of the interrelations of MP analysis is shown in Figure 1. The
MP analysis consists of three sub-steps, which are complex in handling and analytical
results: sampling, sample preparation and detection.

Figure 1: Schematic representation of the connections in MP detection

Usually the objective of a measurement or a measurement program is based on a clear
question or a technical or evaluation concept, which is based on necessary evaluation
parameters, e.g. integration into an overall ecological context, limit values for monitoring.

Based on the specific question, a suitable detection method is selected, which
generates different MP information: polymer type, contents, number, shape, size,
degradation state.

8
BMBF Research Focus „Plastics in the Environment“                                               May 2021
Status Report Analysis of Microplastics

The environmental area to be sampled e.g. water, soil / sediment but also the product
area to be sampled, which includes compost, sewage sludge as well as drinking water,
determines the sampling procedure. The sampling procedure must ensure that a
representative portion of the medium is sampled with sufficient analyte content for the
selected detection method.
The sample preparation depends on the environmental matrix to be analyzed (e.g.
quality of natural accompanying organic materials, proportions of inorganic substances),
the sample quantity to be analyzed and the chosen detection method. Consequently,
different procedures are necessary depending on the environmental sample and the
detection method.

The following questions should therefore be answered at the beginning of every MP
analysis:

      •   Which objective is to be achieved with the measurements?
      •   What kind of results shall be achieved with the measurements?
      •   Which environmental media / which products are to be sampled?

2.2 Definitions1
In German the terms plastic or macroplastic and microplastic adapt the English term
"plastics" and are colloquial terms for plastic or microplastic. By definition, the term
plastics covers only thermoplastics, including polyethylene (PE), polypropylene (PP),
polystyrene (PS), polyethylene terephthalate (PET), polyamide (PA), polymethyl
methacrylate (PMMA) and polyvinyl chloride (PVC), and thermosetting plastics, including
epoxy resins (EP), polyurethane resins (PUR) and polyester resins (UP). Elastomers
built up from synthetic polymers, e.g. styrene-butadiene rubber (SBR), ethylene-
propylene-diene rubber (EPDM). Products based on predominantly synthetic polymers
(e.g. textile fibers, coatings, tires) are also taken into account in current research
activities. These materials and products can also release microparticles that are
identified as synthetic polymers. For simplification, all the materials mentioned above

1   Terms and definitions of plastics in the environment, Cross Cutting Issue 3 “Terms and Definitions”.
9
BMBF Research Focus „Plastics in the Environment“ May 2021
Status Report Analysis of Microplastics
are colloquially summarized in this document by the term "plastics / microplastics (MP) /
macroplastics".
The classification of processed, natural polymers (e.g. viscose fibers, cellulose hydrate)
or chemically modified, natural polymers (e.g. cellulose acetate, vulcanized natural
rubber) is still open, since they can hardly be distinguished as MP particles from
naturally occurring polymers.
2.3 Classification
It is recommended to classify MP analyses into size classes in accordance with Table 1.
This improves the methodological applicability of procedures (feasibility of filtration,
detection limits in the detection method, among others) and enables the classification of
particle quantities and contents in impact analyses (e.g. for environmental assessment).
Table 1: Particle size classification (*assuming spherical particles with a density of 1 g/cm3)
Large
Classification Microplastic
microplastic
Particle size 5,000 – 1,000 – 500 –
100 – 50 50 – 10 10 – 5 5–1
classes /µm 1,000 500 100
Average particle
size in size class / 3,000 750 300 75 30 7.5 3
µm
Mass of an
individual particle* / 14.13 0.221 0.014 2.2E-04 1.4E-05 2.2E-07 1.4E-08
mg
Number of particles
in 14.13 mg 1 64 1 000 6.4E+04 1.0E+06 6.4E+07 1.0E+09
(Ø = 3 mm particle)
The classification is based on a numerical model and the "historical definition" with the
numbers 1 and 5 mm. The following size classes are proposed: 5,000 - 1,000 µm,BMBF Research Focus „Plastics in the Environment“ May 2021
Status Report Analysis of Microplastics
The table also shows in which relation to the size class the mass of a spherical,
individual particle (with density 1 g/cm3) decreases or the number of particles at a
defined mass (e.g. 14.13 mg) increases.
This classification was developed specifically for MP and therefore differs from other
classification systems. The particle sizes and the particle size distribution have an
influence on the material properties of the solid(s). In the different technical and scientific
areas (e.g. water, soil, air, civil engineering, geology), different classification systems
with different limits for the characterization of solids have been developed2. A universal
particle classification system therefore does not exist.
2.4 Representation of results
The aim is to depict a uniform presentation of the results (exception biota, see 6.5).
Therefore, the following information should always be provided in the future:
i. MP number (possibly polymer type) per volume for sampled waters / liquids / air
volume (number / L) or per total dry mass for sampled solids (number / kg)
including indication of the investigated particle size range.
ii. MP mass (possibly polymer type) per volume for sampled waters / liquids / air
volume (µg / L) or per total dry mass for sampled solids (mg / kg) including
indication of the investigated particle size range.
An accurate description and traceable documentation of the amount of the
environmental aliquot sampled, the prepared laboratory sample and the test sample
shall always be provided. Details can be found in the individual chapters on detection,
sampling and preparation.
It should be noted that the conversion between particle masses and particle numbers is
highly erroneous due to necessary assumptions (e.g. spherical particle shape) and was
2In the field of soil science in Germany, the classification of soil types is based on the grain size composition
of the mineral soil substance according to the predominant grain fraction into the main soil types clays, silt,
sands and loams. The limiting sizes are based on the numbers 63 µm and 2 mm. The value 63 µm is also
used in the Surface Water Ordinance (Oberflächengewässerverordnung) for the specific characterization of
solids with regard to heavy metals.
11BMBF Research Focus „Plastics in the Environment“ May 2021 Status Report Analysis of Microplastics only performed for illustrative purposes in Table 1. A conversion between particle numbers and masses is generally not recommended. 2.5 Quality control At all times during analysis (sampling, preparation, detection), maximum "plastic-free" working conditions must be ensured. This includes avoiding the use of plastic sampling and laboratory equipment and using alternatives made of metal, glass or silicone. An exception is the use of plastics that are not to be detected or evaluated. Samples in the laboratory should always be handled in clean room workbenches (laminar flow benches), especially during sample preparation to avoid contamination via e.g. air. To avoid contamination during detection, the use of air cleaners/filters is recommended if the detection procedures cannot be operated within laminar flow benches. If this is not possible, the documentation of blank values of the room air e.g. over the measurement period is recommended. The determination and documentation of control tests shall be performed and documented taking into account all analytical steps and under comparable conditions (same steps, same duration, same volume) for all samples (even if the working atmosphere and environment is free of plastics or low in plastics). The documentation and determination of blank values or process blank values for the applied preparation and detection methods is absolutely necessary, since contamination during sampling, sample preparation and detection (contamination by air transfer) are critical points. Specific recommendations are given in the chapters on detection. Determination and documentation of recovery rates using defined reference materials (particle number and/or mass for MP of different polymer types / densities, particle sizes and shapes) shall be presented for all methods. For this purpose, separate recommendations are given in the chapter on reference materials. Likewise, examination of particle stability of different polymers under the conditions of the described sampling (e.g. pressure filtration), sample preparation (e.g. chemical preparation, ultrasound) and detection conditions shall be documented with suitable reference materials. Depending on polymer type, particle size and especially the aging condition, degradation of smaller particles (surface oxidation) and/or fragmentation of brittle, larger particles may occur. 12
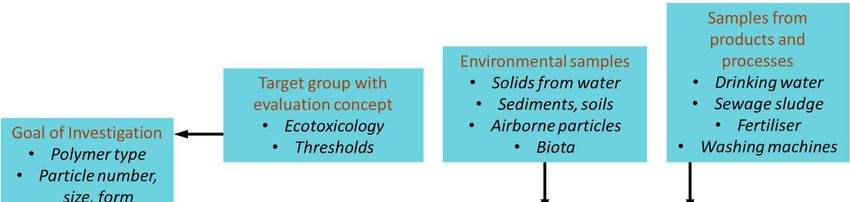
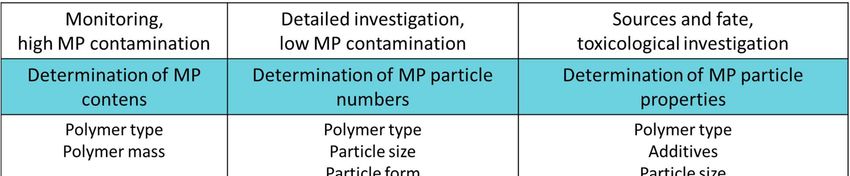
BMBF Research Focus „Plastics in the Environment“                                 May 2021
Status Report Analysis of Microplastics

3. Identification of research objective and research question
Specification of a detection method depends specifically on the objectives and questions
of a project or an existing requirement. Currently two main paths are followed in
detecting MP: 1) MP content determination of the different polymers, 2) MP particle
numbers and sizes are determined specifically for each polymer. The individual
characterization of specific properties of isolated MP particles is rare due to the high
effort.
The detection of very small MP particles (below 5 µm) is comparatively time-consuming,
but is of particular interest from a human and ecotoxicological point of view. Smaller
particles are likely to have more relevant effects (e.g. transitions in the cellular domain)
than larger particles. In addition, the properties of individual particles (surface
morphology and chemical structure) can also be decisive for the analysis of effects.
However, there are no reliable findings in this regard yet.

An overview of the research objectives and detection methods is shown in Figure 2 and
will be defined in more detail in the following sections.

3.1 Content determination

From a regulatory point of view, MP contents are an important parameter to estimate the
basic occurrence of polymers. They are useful for regular, repeated determination of MP
within the scope of monitoring and for controlling the effect of measures against plastic
contamination.

In addition to clear assignment of the polymer type, it must be defined in advance for
which nominal particle size range these determinations should be made. This
subdivision into size classes (Table 1) makes it possible to assign the MP contents to a
specific particle size range.

Fundamentally, it must be considered that a few large particles mask many small
particles in terms of mass balance. Low quantities of small particles contribute only
slightly to the mass.

13
BMBF Research Focus „Plastics in the Environment“                                  May 2021
Status Report Analysis of Microplastics

3.2 Particle determination
The determination of particle number, size and shape gives a detailed picture of the
occurrence of MP in environmental samples. Particle shape, number and size can
differentiate the particles of the different polymers. Basically, it can be said that in terms
of numbers, significantly more small than large particles are found.
The detection of very small particles (< 5 µm or < 10 µm, respectively) is very complex
and only marginally possible for real samples so far. As a rule, samples have to be
prepared in advance for particle determination.

3.3 Characterization of specific properties

The individual characterization of specific properties of isolated particles, e.g. aging
condition, surface structure or condition and the analysis of additives can be relevant for
the evaluation of interactions with the environment, but also of sources, input paths and
retention. Such analyses can be important for the evaluation of toxicological properties,
but they require prior, sometimes very complex, isolation of individual particles.

Figure 2: Identification of examination objective and result

14
BMBF Research Focus „Plastics in the Environment“                                 May 2021
Status Report Analysis of Microplastics

4. Selection of the detection method
A basic distinction is made between three different detection methods. Spectroscopic
methods are used to detect characteristics of the specific chemical structure of polymers
and to assign reference spectra. In thermoanalytical methods, the sample is pyrolyzed
under inert conditions and specific decomposition products of the individual polymers
are detected. Finally, certain plastics can also be broken down through chemical
processes and specific decomposition products of polymers or elements from additives
or from plastic itself can be detected and used for classification. Chemical processes do
not include those that dissolve MP as a largely intact polymer and thus extract it from
the matrix (see Chapter 6.6).
Spectroscopic detection methods facilitate the determination of polymer types as well as
the number, size/size distribution and shape of MP particles. Thermoanalytical/chemical
detection methods determine polymer types and MP contents. Both detection methods
are complementary to each other. Relatively speaking, the obtained data can be
compared between the approaches; with the current technical possibilities, however, the
data cannot be superimposed from one onto the other.
When measuring real samples using purely imaging techniques (e.g. light and electron
microscope) and particle counting techniques (e.g. light scattering, laser scattering,
Coulter Counter) there is a high risk of misinterpretation, because MP particles cannot
be identified clearly compared to e.g. naturally occurring particles. Therefore, it is
essential to perform these tests with reference and blank samples.

15
BMBF Research Focus „Plastics in the Environment“                                           May 2021
Status Report Analysis of Microplastics

4.1 Spectroscopic methods
Infrared spectroscopy
Sebastian Primpke, Gunnar Gerdts3

One of the most common methods for the non-destructive determination of the chemical
structure based on covalent bonds of a known substance/chemical is infrared
spectroscopy. This method uses mid-infrared radiation (MIR) to excite the covalent
bonds of a chemical compound to oscillate by absorbing the irradiated energy. The
different proportions of bonds in a molecule and thus different excitable vibrations result
in specific spectra that act like a "fingerprint" and can be matched via databases or with
other data analysis methods. The sample must be free of water; otherwise its IR
spectrum will cover the spectrum of the analyte.
In general, detection by IR (infrared) or FTIR (Fourier-transform infrared spectroscopy)
offers different measurement principles based on reflection and/or transmission. In
transmission measurement, the sample is completely penetrated by the IR radiation,
resulting in a spectrum of the complete particle. However, this type of measurement is
susceptible to total absorption above a certain particle or layer thickness and materials
with a high soot content, whereby either spectral details or the complete signal is lost.
When using reflection, the IR beam is directed onto the sample and the reflected
radiation is detected; however, this requires a highly reflective sample. This method is
therefore performed on highly reflective surfaces (e.g. gold-coated filters). By means of
attenuated total reflection (ATR), in which a crystal is pressed onto the particles and the
spectrum at the interface between crystal and sample is measured, the surface structure
of the particle in particular can be detected.

Due to this variety of measurement possibilities, infrared spectroscopy is often used for
the detection of MP. ATR-FTIR spectrometry is very common for larger particles

3 S. Primpke, R.K. Cross, S.M. Mintenig, M. Simon, A. Vianello, G. Gerdts, J Vollertsen, 2020, Journal of

Applied Spectroscopy, 3702820917760.
S. Primpke, S.H. Christiansen, W. Cowger, H. De Frond, A. Deshpande, M Fischer, E. Holland, M. Meyns,
B.A. O’Donnell, B.E. Oßmann, M. Pittroff, G. Sarau, B. Scholz-Böttcher, K. Wiggin, 2020, Applied
Spectroscopy 2020, Vol. 74(9) 1012–1047.
16
BMBF Research Focus „Plastics in the Environment“                                May 2021
Status Report Analysis of Microplastics

(approx. > 500 µm). Smaller particles (approx.
BMBF Research Focus „Plastics in the Environment“                               May 2021
Status Report Analysis of Microplastics

algorithms/approaches for spectrum assignment. A freely available variant that can
analyze both large data sets and individual spectra is the siMPle software (www.simple-
plastics.eu).
The detection limit for µ-IR spectroscopy depends on the instrument used, the
measurement parameters and the optics; usually particles down to a size of 10 µm can
be identified and quantified.

To use this method effectively for particles smaller than 500 µm, chemical or enzymatic
sample preparation is usually necessary to remove the (in)organic matrix particles and
reduce the number of potential particles. However, these measures are not always
sufficient, so that a partial analysis is performed. In such a case, at least 50 particles
(>500 µm) or 50% of the filter area (
BMBF Research Focus „Plastics in the Environment“                                            May 2021
Status Report Analysis of Microplastics

Near infrared spectroscopy
Mathias Bochow4

The near infrared (NIR) is the spectral range of the electromagnetic spectrum adjacent
to the MIR, in which we find the so-called overtones and combination bands of the
(fundamental) absorption bands located in the MIR. As in vibrational spectroscopy in the
MIR, molecules are stimulated to vibrate by electromagnetic radiation. The energy thus
absorbed by the molecules is missing in the reflectance spectra as well as in the
transmittance spectra. Since the spectral ranges in which this stimulation occurs are
molecule-specific (spectral fingerprint), the position, shape and intensity of the
absorption bands present in the spectrum can be used to identify and quantify
substances. For this purpose, automated statistical methods from the field of
chemometrics are usually used and a comparison with reference spectra from spectral
databases is performed.
Reflection measurements are the common measuring principle. NIR spectrometers are
available as point spectrometers and imaging spectrometers. A point spectrometer can
be used for contact measurements, e.g. on a particle, similar to the ATR measurement
in the MIR. However, since the measuring head consists of an optical lens, whereby the
position of the measuring spot cannot be determined exactly, this measuring principle is
only suitable for macroplastics (particles > 1 mm). In addition, a larger area can be
measured in an integrated way by increasing the measuring distance. In doing so, a
single spectrum is obtained for the measured area. Based on the measured spectrum,
statistical methods can be used to determine the degree of coverage of the measured
spot with the target material (polymer) or the content of the target material in the matrix
in mass percent. For this purpose, a calibration by reference samples with known
degrees of coverage or mixing ratios of the polymer(s) and the matrix to be examined is
necessary in advance. Since there are transportable, field-suitable NIR spectrometers
("IR guns") in addition to laboratory equipment, such a quantification can also be

4   L.K. Schmidt, M. Bochow, H.K. Imhof, S.E. Oswald, Environ. Pollut. 2018, 239, 579–589.
A. Paul, L. Wander, R. Becker, C. Goedecke, U. Braun, Environ Sci Pollut Res 2019, 26, 7364–7374.
T. Kuester, S. Zhou, K. Segl, M. Bochow, Frontiers in Environmental Science, 2020, submitted.
19
BMBF Research Focus „Plastics in the Environment“ May 2021 Status Report Analysis of Microplastics performed in situ. Furthermore, NIR spectrometers can also be introduced into a sample (e.g. into soil) by means of a measuring probe. Experience shows that the detection lower limit for polymers in practice is about 1 m% of polymers in soil samples or a coverage of the measuring spot from 5 f%; however, this is strongly dependent on the surrounding matrix and substrate as well as the transparency and brightness of the polymer. Imaging spectrometers resolve the area to be measured into numerous individual measurements analogous to FPA-based FTIR spectroscopy. An image of the sample is generated with a separate spectral measurement for each pixel. Depending on the optical lens used, the pixel sizes are in the range of 50 µm or larger and correspond approximately to the diameter of the smallest detectable MP particle. The analysis with methods from the field of image processing enables automatic counting and size calculation of the identified MP particles. While NIR spectroscopy has been used for decades as a standard method for online quality assurance in food production or for online sorting of plastic packaging in recycling, the first experimental methods for MP analysis in water or soil samples have only recently become available. Due to the comparatively very high measuring speed (10 min for a 47 mm diameter filter) and relative insensitivity to contaminants such as biofilms, NIR spectroscopy allows a very high sample throughput. In any case, the sample must be filtered on glass fiber filters without organic binder before measurement and dried in a drying oven at max. 50 °C. For NIR measurements there is currently no information available about the determination of process and laboratory blank values. 20
BMBF Research Focus „Plastics in the Environment“                                                May 2021
Status Report Analysis of Microplastics

Raman spectroscopy
Natalia P. Ivleva, Dieter Fischer, Nicole Zumbülte5

Raman spectroscopy is a non-destructive analytical method based on the effect of
inelastic light scattering on molecules. Raman spectroscopy provides "fingerprint"
spectra. Both polymers (type of polymer) and additives (e.g. pigments, oxides) as well
as inorganic and organic ingredients can be identified with this method. The coupling of
Raman spectroscopy with confocal optical microscopy (Raman microspectroscopy, µ-
Raman spectroscopy) and the use of a laser in the visible range allows a spatial
resolution of down to 1 µm and even below (up to approx. 300 nm). µ-Raman
spectroscopy is not sensitive to water. This enables the additional examination of MP in
aqueous and (micro)biological samples.
A major drawback of Raman spectroscopy for the detection of MP in environmental
samples is interference by fluorescence, which can be caused by (micro)biological,
organic (such as humic acids) and inorganic compounds (such as clay minerals) in the
matrix. Therefore, it is recommended to subject the MP samples to a sample preparation
step prior to Raman detection. Furthermore, the choice of suitable measurement
parameters (laser wavelength and power, photobleaching and acquisition time, as well
as objective magnification and confocal mode) is important to minimize or avoid
interference from strong fluorescence. In addition, the removal of the (in)organic
accompanying matrix from complex (environmental) samples leads to a significant
enrichment of the MP particles.

Despite the processing, a (high) number of natural particles are still to be expected in
environmental samples. A fractional filtration of the particles into different size classes

5P. M. Anger, E. von der Esch, T. Baumann, M. Elsner, R. Niessner & N. P. Ivleva, 2018, Trends in
Analytical Chemistry 109 214-226.
J. Brandt, L. Bittrich, F. Fischer, E. Kanaki, A. Tagg, R. Lenz, M. Labrenz, E. Brandes, D. Fischer, K.-J.
Eichhorn. 2020, Applied Spectroscopy 74(9) 1185-1197.
Y. K. Müller, T. Wernicke, M. Pittroff, C. S. Witzig, F. R. Storck, J. Klinger, N. Zumbülte, 2020, Analytical &
Bioanalytical Chemistry 412 555-560.
C. Schwaferts, V. Sogne, R. Welz, F. Meier, T. Klein, R. Niessner, M. Elsner & N. P. Ivleva, Analytical
Chemistry 2020 92(8) 5813-5820.
21
BMBF Research Focus „Plastics in the Environment“                                May 2021
Status Report Analysis of Microplastics

before measurement is helpful. Since a very high number of particles have to be
analyzed, an automation of µ-Raman spectroscopy is necessary. Currently some
commercial and open source programs (https://gitlab.ipfdd.de/GEPARD/gepard and
TUM-ParticleTyper (doi.org/10.1371/journal.pone.02347) can be used for this purpose.

Statistical methods can be used to determine a minimum number of particles that are to
be randomly selected and chemically identified on a filter. To ensure statistical certainty
of the measurements, however, at least 20 % of the filter surface should be measured,
since an inhomogeneous distribution of the MP particles may be present due to the
process. The detection of particles > 5 µm or >10 µm can be realized for the entire filter
(e.g. 10 mm or 25 mm diameter). With µ-Raman spectroscopy MP particles down to
1 µm can be examined. However, when analyzing particles this small, only a (very)
small part of the filter (a few % of the surface) can be measured. If the sample is
inhomogeneous, larger errors can occur when extrapolating the results to the entire filter
area. Therefore, a homogeneous particle distribution on the filter must be ensured

For automated µ-Raman spectroscopy detection, gold-coated polycarbonate filters as
well as silicon and Teflon filters have proven to be particularly well suited.

To realize a reliable µ-Raman detection, blank values must be determined. Laboratory
blank values become necessary, if e.g. sample preparation and MP detection take place
in separate laboratories. At least 3 (optimally 10) laboratory blank values are
recommended. The laboratory blank values (incl. examination of ultrapure water
systems, filtration system, particle & fiber input during filtration and identification &
quantification) determine internal MP contamination and help to find or eliminate the
sources of contamination. In addition, at least 1 process blank value should be
determined for each time-limited series of measurements in order to consider the
contamination during sampling, sample preparation and detection.

A combination of field-flow fractionation and µ-Raman spectroscopy has shown clear
potential for the analysis of plastic particles in the submicro range. Using model
samples, it has already been possible to realize chemical identification of different
submicroparticle fractions (including plastic particles and inorganic particles down to
200 nm).

22
BMBF Research Focus „Plastics in the Environment“                                        May 2021
Status Report Analysis of Microplastics

4.2 Thermoananalytic methods
Pyrolytic methods
Barbara Scholz-Böttcher, Georg Dierkes, Ulrike Braun6

At high temperatures, plastics decompose into characteristic fragments or
decomposition products if the environment is free of oxygen. The generated volatile
pyrolysis products refer directly to the nature of the polymer and allow conclusions about
its chemical composition. To increase the analytical significance, pyrolysis systems are
usually connected to a gas chromatograph, ideally with mass-spectrometric detection
(GC/MS system). With respect to the instrumentation, there are two different types of
pyrolysis units and their respective gas chromatographic coupling.
The online pyrolysis (Py), performed with filament, micro oven or Curie-Point pyrolizers,
is usually directly connected to the injection system of the gas chromatograph. The
sample is pyrolyzed in a suitable sample cup (target), under inert gas (e.g. helium) and
over a ramped temperature gradient or at constant temperature (for plastics e.g. 500 -
700 °C). The resulting volatile pyrolysis products are transferred directly into the GC/MS
system in a helium stream, followed by a chromatographical separation and subsequent
mass-specific detection.
In Thermal Extraction Desorption (TED), the sample is decomposed under inert gas
during a controlled heating process (up to approx. 600 °C) in a thermobalance. The
thermobalance is connected to the GC/MS system via a thermoextraction desorption
module. The thermally released volatile pyrolysis products, if requested, of a certain
temperature range, are sorbed on a solid phase, then thermodesorbed in a helium
stream, and identified by means of GC/MS.

The gas chromatographic separation and detection of the resulting pyrolysis products in
the mass-selective detector allows the identification of individual, single MP particles,

6   M. Fischer, B. M. Scholz-Bottcher, Analytical Methods 2019, 11, 2489-2497.
G. Dierkes, T. Lauschke, S. Becher, H. Schumacher, C. Földi, T. Ternes, Analytical and Bioanalytical
Chemistry 2019, 411, 6959-6968.
E. Duemichen, P. Eisentraut, M. Celina, U. Braun, Journal of Chromatography A 2019, 1592, 133-142.
23
BMBF Research Focus „Plastics in the Environment“                               May 2021
Status Report Analysis of Microplastics

but also the simultaneous detection of individual polymers in plastic mixtures or in
natural environmental samples. For isolated particles, the generated gas chromatogram
(pyrogram) is equivalent to a "fingerprint" for the respective plastic. Plastics can be
reliably identified by comparison of these pyrograms with reference pyrograms from own
databases or literature collections. Depending on their thermal fragmentation behavior,
the pyrograms of plastics contain multiple (e.g. PE, PP, PET), few (e.g. PS) or only
individual (e.g. PMMA), prominent pyrolysis products. For these pyrolysis products, the
corresponding ion chromatograms can be extracted from the pyrogram recorded during
GC/MS analysis. Positive signals at the corresponding retention times allow the
identification of the corresponding polymers even from the more complex mixtures.

Thermoanalytical methods can also detect relevant components of tire abrasion (e.g.
SBR/BR) both qualitatively and quantitatively. The analysis of SBR/BR can be carried
out according to ISO/TS 21396:2017-12 (Rubber - Determination of mass concentration
of tire and road wear particles (TRWP) in soil and sediments – Pyrolysis-GC/MS
method) (see also chapter 4.3.)
If pyrolysis is carried out under exactly reproducible conditions, there is a correlation
between the area under the signals of the indicator ions in the ion chromatogram and
the mass of the respective polymer present in the sample cup. This response is linear in
a system-dependent concentration range. By integrating the respective signals, the
mass of the polymers can thus be determined reproducibly. This requires an external
calibration of the respective polymers. The overall data quality can be improved
considerably by adding an internal standard (e.g. deuterated PS).
Depending on the MP content and the amount of (in)organic accompanying matrix,
quantification from complex environmental samples is possible directly or after
appropriate sample preparation. The organic accompanying matrix in particular can lead
to pyrolysis products that might interfere with the indicator ions and lead to rapid
contamination of the system. The proportion of inorganic accompanying matrix directly
affects the effective sample volume used for the measurement, since volumes used in
thermoanalytical methods are limited to a few µg to mg, depending on the given method.
In contrast to the organic accompanying matrix, the effect of the natural inorganic
accompanying matrix on the composition and yield of the pyrolysis products is of
negligible importance to a certain degree.
Thermal methods also require parallel processing of 1-2 process blank values per
reprocessing series. This is obligatory in order to realistically assess any secondary

24
BMBF Research Focus „Plastics in the Environment“                                May 2021
Status Report Analysis of Microplastics

contamination or carry-over caused by sample processing, and, if necessary, to be able
to make appropriate corrections to the measured values. It is also recommended to
integrate the samples used for calibration into the respective measuring sequence as
well.

Calorimetric methods
Hajo Bitter7

Another category of thermoanalytical determination methods is calorimetry. In this
method, phase transitions of polymers and their heat flows are used to draw conclusions
about MP contents.

Differential Scanning Calorimetry (DSC) is traditionally used to determine thermal
properties of plastics, such as specific heat capacities and glass-transition or melting
temperatures. An empty reference crucible and a sample crucible are heated or cooled
down simultaneously at constant rates in a furnace. If heat is absorbed (endothermic) or
released (exothermic), temperature differences are recorded by sensors underneath the
crucibles and converted into heat flows. The results are thermograms with peaks or
steps.
Melting processes only exist for plastics with crystalline fractions (e.g. PE, PP, PA or
PET). They are endothermic and temperature specific for these plastics. Another
important parameter is the specific melting enthalpy. It is proportional to the crystalline
fraction of a plastic and can be used to quantify single substances or mixtures. Plastics
without crystalline fractions, such as PVC or PS, cannot be determined by this method.
Two pieces of information are processed for accurate detection: Individual plastics are
identified on the basis of the melting temperatures, the area of a melting peak then gives
the enthalpy of melting. For calibration, different masses of known plastics are weighed,
melted and the areas and temperatures of the resulting melting peaks are determined.
In the case of samples of unknown composition, the first step is to search for melting
peaks. The peak temperatures are determined from in-house databases or scientific

7   Bitter, H., Lackner, S., Chemosphere 2020, 258, 127388.
25
BMBF Research Focus „Plastics in the Environment“                             May 2021
Status Report Analysis of Microplastics

literature. Then the areas of the identified melting peaks are determined and converted
into masses using calibration lines or literature values.

Maximum sample quantities per measurement are in the range of 30 to 40 mg, the limit
of detection (LOD) is about 50 µg (polymer dependent). The latter is comparatively high,
which makes the method less susceptible to process or laboratory blank values, but
absolutely necessitates sample preparation to increase the MP content of a sample.

26
BMBF Research Focus „Plastics in the Environment“                                       May 2021
Status Report Analysis of Microplastics

4.3 Chemical methods
Stephan Wagner8

An alternative analytical approach for the determination of plastics in environmental
samples is based on the detection of individual chemical components of plastics. If parts
of the polymer, additives or individual elements contained in the plastics are detected,
these are referred to as chemical methods.

The use of additives depends on the type of polymer and the use of the plastic. For
example, only a few additives are permitted for materials in contact with food, whereas
both organic and inorganic additives are used in construction materials (insulation
material, drainage pipes, tarpaulins) and tires. Elements such as iron or titanium, for
example, are used as pigments or bromine and zinc in flame retardants. Zinc is also a
component of tires. The detection of such elements enables the determination of a MP
content if the proportion of material/additive added to the polymers is known.
This chapter presents a chemical process approach using the example of tire abrasion.
Tire material consists of 30 or more individual components. For a quantification of tire
abrasion, it is therefore necessary to define marker compounds, with which the amount
of tire abrasion in an environmental sample can be determined. In this context, the
element zinc is used as a marker compound for quantification.

As zinc is contained in tires in stable and relatively high concentrations (approx. 1 m%),
the environmental concentration of tire abrasion can be determined by zinc analysis. In
addition to the determination of the element zinc as a marker compound,
thermoanalytical methods such as Py-GC/MS or TED-GC/MS can also be used to
qualitatively and quantitatively determine the marker compounds for SBR/BR in tires
(see 4.2).

8 S. Wagner, T. Hüffer, P. Klöckner, M. Wehrhahn, T. Hofmann, T. Reemtsma, 2018 Water Reseach 139,

83 – 100.
P. Klöckner, T. Reemtsma, P. Eisentraut, U. Braun, A.S. Ruhl, S. Wagner, 2019, Chemosphere 222, 714 –
721.
27
BMBF Research Focus „Plastics in the Environment“                                 May 2021
Status Report Analysis of Microplastics

As a result of the rolling friction between vehicle tires and road surface, small tire
particles are worn off from the tire tread, which then form aggregates with mineral
particles. These aggregates are called tire and road wear particles (TRWP). During
sample preparation, the TRWPs have to be separated from other zinc-containing
particulate materials (zinc from e.g. steel refinements). Density separation is a common
procedure in MP analysis for the separation of matrix components (see chapter 6). For
density separation, sodium polytungstate solution diluted with water to a density of 1.9
g/ml is used with subsequent centrifugation. The TRWP rise and accumulate in the
floating fraction. This fraction is separated from the rest of the sample, dried and
weighed. The dried sample is chemically digested using microwave-assisted acid
digestion to dissolve the zinc components as completely as possible into the aqueous
solution.

The quantification of the zinc concentration in this solution is carried out by inductively
coupled plasma optical emission spectrometry (ICP-OES) or by ICP mass spectrometry
(ICP-MS). The measured zinc concentration is used to determine the content of zinc in
the light fraction of the solids (which floated during density separation), which in turn is
used to calculate the content of tire abrasion in the total weighed sample. This
calculation is based on an average zinc content in tire treads of approx. 1 m%. Based on
the assumption that TRWP consists of 50 m% of tire abrasion particles and 50 m% of
mineral particles, the content of TRWP in the total sample can be determined.
Depending on the sample matrix, particles containing zinc that do not originate from tire
abrasion may also be present in the light fraction. If the TRWP concentration is very low
and there are zinc sources other than tires, an incorrect determination is possible.
Analysis of environmental samples has provided indications that density and zinc
concentration may vary as TRWPs age in the environment. Zinc can leach out of the
particle and TRWP aggregates may break. Both processes would result in
misquantification.

28
BMBF Research Focus „Plastics in the Environment“                              May 2021
Status Report Analysis of Microplastics

4.4 Comparison of methods
A comparison of the methods is shown in tables 2 and 3. The determined values / data
are based on the measurements of environmental samples. The existing detection
methods differ - independent of the parameters for sampling and preparation - in their
methodological performance and feasibility per measurement. These include the
analyzable sample mass or particle number within the scope of a measurement, the
detection limits with regard to particle size and mass, the necessary preparation of the
sample in the measuring device, and the measuring and evaluation time per
measurement.
The detection methods differ from one another in the type of result and performance of
the measurement result. This includes information on the type of polymer and possible
additives, the aging condition, the determination of particle number, size, shape and
surface condition as well as contents.

29
BMBF Research Focus „Plastics in the Environment“                                                  March 2021
Status Report Analysis of MP

Table 2: Overview of methodical parameters for detection methods, without consideration of the sample composition in particular (organic/inorganic) and sample
preparation; abbreviation of methods, see appendix.

 Properties                 Spectroscopic                                                                                   Thermoanalytical                               Chemical
                            µ- Raman     IR / FTIR           µ ATR-          ATR-FTIR        NIR             NIR            Py-GC/MS* TED-                   DSC           ICP-MS
                                         (µ-/FPA-)           FTIR                                            Imaging                     GC/MS

 Sample template for        Prepared        Prepared         Isolated        Isolated        Sample          Prepared       Isolated         Sample          Isolated      Sample
 measurement                filter          filter           particles       particles                       filter residue particles /                      particles /
                            residue         residue                                                                         prepared                         prepared
                                                                                                                            sample                           sample
 Maximum analyzable         undefined       undefined        undefined       undefined       undefined       undefined µg-mg                 mg              mg            mg
 mass in sample

 Maximum particle-          103 – 105       103 – 105        undefined       undefined       undefined       103 – 105      undefined        undefined       undefined     undefined
 number per filter

 Dimension                  d-h             d-h              min             min             min             h - min        h                h               h             min
 measuring time (real
 environ. sample)
 Lower detection limit      1 – 5 µm        10 µm            25 - 50 µm      500 µm          ~ 1 m% ***      50 µm,         0.01 - 1 µg      0.5 – 2.4 µg ~ 50 µg
 (in practice)                                                                                               5 f% ***       (abs)**          (abs.)**

* Various superstructures of the pyrolysis unit (e.g. Curie point, filament, micro furnace). ** depending on polymer type and pyrolysis unit and inorganic dilution. ***
m% = mass percent, f% = area percent

30
BMBF Research Focus „Plastics in the Environment“ March 2021
Status Report Analysis of MP
Table 3: Overview of result generation of the detection methods (abbreviation of the methods, see appendix, OF = surface).
Properties Spectroscopic Thermoanalytical Chemical
µ Raman IR / FTIR µ ATR-FTIR ATR-FTIR NIR NIR Py-GC/MS* TED- DSC ICP-MS
(µ-/FPA-) Imaging GC/MS
Type of polymer yes yes yes yes yes yes yes yes partially just tires
crystalline
Detectable pigments no no no no no yes no no no
additives
Aging condition surface partly surface surface no no oxidation no no no
oxidation oxidation oxidation
Particle number yes yes yes yes no yes no no no no
size, shape
Contents no no no no no no yes yes yes yes
31BMBF Research Focus „Plastics in the Environment“ March 2021
Status Report Analysis of MP
5. Selecting the Sampling Method
Sampling generally involves representative extraction of specific MP particles from an
environment in which a large number of natural particles often occur. MP particles can
also be embedded in natural matrix components. There are two basic points to consider
when taking samples:
• Representative occurrence of the feature carriers relevant to the material to be
examined
• Availability of a sufficient amount of the analyte to be tested depending on the
requirements of the detection method (LOD = limit of detection, or LOQ = limit of
quantitation)
Sampling programs and methods are therefore determined by the environmental
medium or product to be sampled, the research question and the related detection
methods.
In the following sections, key features for sampling under different framework conditions
will be mentioned. Each soil type, body of water, product and installation has special
features which must be regarded and considered throughout the sampling process.
When setting up examination programs, the spatial and temporal conditions should also
be considered as far as plastic inputs and outputs are concerned (point sources, diffuse
sources, continuous, discontinuous). These may be rather similar (e.g. sampling air) or
vary, depending on the different media, e.g. combined sewer overflows or organic
fertilizers.
5.1 General
Claus Gerhard Bannick, Mathias Ricking, Nathan Obermaier
To achieve the different goals for a specific examination requires a suitable sampling
method as well as the appropriate technical equipment. Examination goals could be:
• the uniform characterization of environmental media (e.g. water, soil, air), biota
(e.g. fish, mussels), materials (e.g. compost, sewage sludge, construction waste)
or products (e.g. organic fertilizers, foodstuffs)
• the determination of an average concentration, e.g. for freight calculations
• the determination of magnitude of a possible dispersion of contents over time
32You can also read