Gender disparities in UK research publishing: Differences between fields, methods and topics - Profesional de ...
←
→
Page content transcription
If your browser does not render page correctly, please read the page content below
Gender disparities in UK research
   publishing: Differences between fields,
   methods and topics
   Mike Thelwall; Mahshid Abdoli; Anna Lebiedziewicz; Carol Bailey

   How to cite this article:
     Thelwall, Mike; Abdoli, Mahshid; Lebiedziewicz, Anna; Bailey, Carol (2020). “Gender disparities in UK re-
     search publishing: Differences between fields, methods and topics”. Profesional de la información, v. 29, n. 4,
     e290415.
     https://doi.org/10.3145/epi.2020.jul.15
                                                                                          Manuscript received on February 06th 2020
                                                                                                        Accepted on June 05th 2020

                     Mike Thelwall *                                                  Mahshid Abdoli
                     https://orcid.org/0000-0001-6065-205X                            https://orcid.org/0000-0001-9251-5391
                     University of Wolverhampton                                      University of Wolverhampton
                     Statistical Cybermetrics Research Group                          Statistical Cybermetrics Research Group
                     Wulfruna Street                                                  Wulfruna Street
                     Wolverhampton WV1 1LY, UK                                        Wolverhampton WV1 1LY, UK
                     m.thelwall@wlv.ac.uk                                             m.abdoli@wlv.ac.uk

                     Anna Lebiedziewicz                                               Carol Bailey
                     https://orcid.org/0000-0002-2606-7655                            https://orcid.org/0000-0002-2734-4060
                     University of Wolverhampton                                      University of Wolverhampton
                     Statistical Cybermetrics Research Group                          Statistical Cybermetrics Research Group
                     Wulfruna Street                                                  Wulfruna Street
                     Wolverhampton WV1 1LY, UK                                        Wolverhampton WV1 1LY, UK
                     anna.l@wlv.ac.uk                                                 c.bailey@wlv.ac.uk

Abstract
Gender disparities persist in UK research, with female minorities in most science, technology, engineering and mathe-
matics (STEM) subjects but female majorities in others. The nature of the gender disparity differences between subjects
needs to be understood if effective remedial actions are to be targeted at STEM subjects suffering from a lack of women,
in contrast to other subjects without shortages. Evidence from the USA suggests that women engage more in people-re-
lated subjects, qualitative methods, veterinary science and cell biology and men engage more in thing-related subjects,
power/control fields, patient-related research, abstraction and quantitative methods, except surveys. This article inves-
tigates gender disparity differences in UK first authorship for journal articles in nearly all of science split into 26 broad
and 308 narrow Scopus fields. The results largely replicate the USA but suggest that more life science topics may be fe-
male-associated in the UK and patient-related research might not be male-associated. UK STEM gender parity initiatives
might therefore emphasise people-oriented, and perhaps socially positive, aspects of currently masculine STEM topics
and approaches (e.g., abstraction, mathematical quantitative methods), and promote female-friendly topics, methods
and goals within male-dominated fields in addition to tacking implicit and explicit sexism and providing a supportive
working environment.
Keywords
Gender inequalities; Gender gaps; Scientific publishing; Disciplinary differences; Careers; Academic careers; Gender.

e290415                                                    Profesional de la información, 2020, v. 29, n. 4. e-ISSN: 1699-2407   1
Mike Thelwall; Mahshid Abdoli; Anna Lebiedziewicz; Carol Bailey
1. Introduction
Female academics are rare in many UK STEM fields, according to HESA data (see below). The female STEM minority is
a common –but not universal– international problem, whether due to explicit discrimination, implicit discrimination,
socially constrained choices, or individual preference. Other subjects with large UK gender disparities include econo-
mics (28% female UK academic staff in 2016) (Tenreyro,
2017), biological sciences (61% female postgraduates in The reasons why gender disparities vary
2011-12: Society of Biology, 2013) and nursing (probably greatly between fields within UK acade-
90%+ female, see below; also 94% female in the USA: mia are poorly understood
Mott & Lee, 2018).
The reasons why gender disparities vary greatly between fields within UK academia are poorly understood. This under-
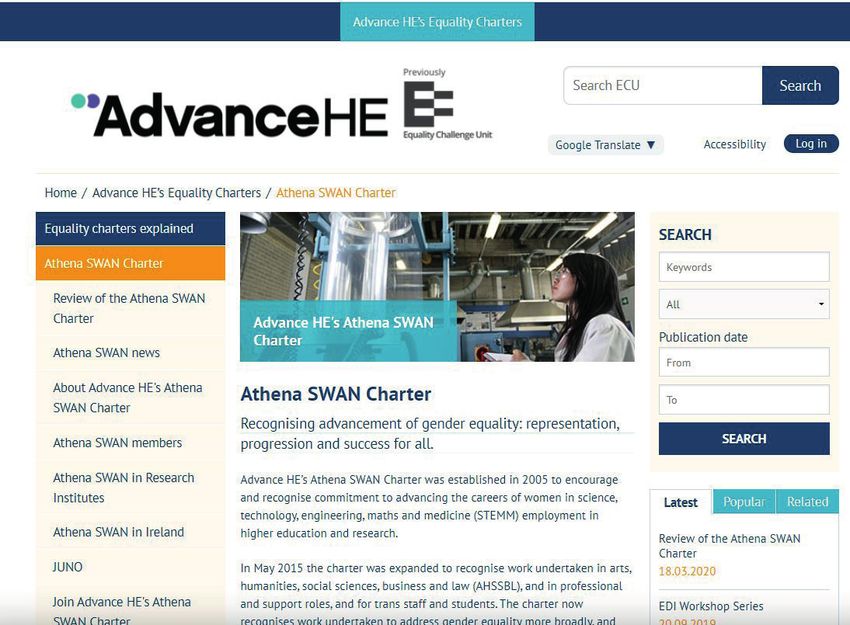
mines attempts to assess whether current initiatives, such as Athena SWAN, promote optimal strategies for increasing
female participation and career progression in STEM (e.g., Armstrong; Jovanovic, 2017; Lipton, 2017).
http://www.ecu.ac.uk/equality-charters/athena-swan
The following theories have been proposed to explain current field differences in gender disparities, and the lack of
women in STEM subjects in some countries, in terms of constraints on female career choices:
1) Biological sex differences in abilities.
Although there may be marginal differences in some relatively minor abilities (Hines, 2011; Rippon, 2019), these
are insufficient to account for large differences between fields.
2) Socialised gender differences in capabilities.
Although girls outperform boys in science tests in most countries, with the gap being largest in countries with
the greatest gender inequality (Stoet; Geary, 2018), there is evidence of childhood social factors leading to gen-
der capability differences in favour of boys for STEM in the USA. For example, whilst younger girls in the USA are
equally capable as boys at computing, older girls fall behind after choosing to take fewer optional computing
classes (Cheryan; Ziegler; Montoya; Jiang, 2017). Less early experience of physics and engineering may also exp-
lain lower average female capability in these fields in the USA (Cheryan; Ziegler; Montoya; Jiang, 2017). Gender
differences in beliefs about capability can lead to differing interests (Shapiro; Williams, 2012) and career choices
(e.g., Tellhed; Bäckström; Björklund, 2017), therefore translating into later life capability differences.
3) Gender conformity.
From a sociological perspective, identifying as male or female rather than non-binary means tending to choose
behaviours and activities associated with that gender (e.g., clothes, fiction reading, hobbies) even though ever-
yone engages in some activities typical of another gender (e.g., cross-dressing, men reading chick-lit, women
boxing) (Lindsey, 2016). In this context, academic fields (or careers) that are believed to be gender-imbalanced
would be gender non-conforming for one gender. Gender conformity pressure can be powerful (Gordon; Krieger;
Okechukwu et al., 2017) but it is not known whether this is a strong career choice motivation in the UK since
gender non-conformity is increasingly accepted (BSA, 2018). Female role models have been proposed as a partial
solution to this, but evidence for their efficacy is mixed (Cheryan; Drury; Vichayapai, 2013; Cheryan; Siy; Vicha-
yapai; Drury; Kim, 2011; Young; Rudman; Buettner; McLean, 2013). For example, the perception of nursing as
suitable for UK women has been
attributed to nurse and statisti-
cian Florence Nightingale (Chris-
tensen, 2017), but statistics re-
mains male-dominated. Gender
role assumptions in society and
within education also probably
restrict career choices (Robnett,
2016).
4) Explicit discrimination by gender or
biological sex at key career stages (e.g.,
recruitment, tenure).
Recruiters may make assump-
tions about the capabilities of
candidates based on their gen-
der (e.g., Moss-Racusin; Dovidio;
Brescoll; Graham; Handelsman,
2012; Reuben; Sapienza; Zinga-
les, 2014), although a large-scale
http://www.ecu.ac.uk/equality-charters/athena-swan
US study suggests an overall 2:1
e290415 Profesional de la información, 2020, v. 29, n. 4. e-ISSN: 1699-2407 2
Gender disparities in UK research publishing: Differences between fields, methods and topics

       preference for female tenure track applicants across almost all academic fields (Williams; Ceci, 2015). Male-do-
       minated appointment and promotion committees may have a greater affinity with similar men (Van-den-Brink;
       Benschop, 2012), perpetuating existing gender disparities. Some STEM fields may have generated chilly climates
       for female researchers (Stockard; Greene; Richmond; Lewis, 2018). More subtly, highly successful US male bio-
       logists have been found to train fewer women than the sector average in biology, although this could be due to
       self-selection bias (Sheltzer; Smith, 2014).
5) Implicit discrimination within careers by gender or biological sex.
       Failure to account for the greater average responsibility of women in informal carer roles (Dahlberg; Demack;
       Bambra, 2007; ONS, 2013) and time off for childbirth or childcare in promotion or tenure are important exam-
       ples of implicit discrimination that can disproportionately harm women’s career prospects (e.g., Brown; Watson,
       2010; England, 2010). Women may also be discouraged when in minority (e.g., Main, 2018).
       Personal choice may also be a factor in gender disparity differences between fields, and the unpopularity of
       STEM amongst US/UK women. One puzzling US study found a much greater tendency for US women to leave
       (academic and non-academic) STEM careers for non-STEM careers (50% professional) compared to women in
       non-STEM professional careers. The study found that higher salary, training, and job satisfaction did not lead to
       greater STEM retention (Glass; Sassler; Levitte; Michelmore, 2013). This suggests that STEM-specific factors are
       relatively subtle and difficult to quantify, so personal choice may be a key factor.
Two theories emphasise female choice as a determinant of participation rate differences between fields.
1) Biological sex differences in preferences.
       There is some evidence of a sex-related genetic component to interests. For example, some toys are preferred by
       boys or girls before they learn gender differences, a gender difference that is mimicked in some non-human pri-
       mates (Hines, 2011). This may transfer into later career choices to some extent (Su; Rounds; Armstrong, 2009).
2) Socialised gender differences in career goals.
       Women in the USA have been shown to be more likely to have communal goals for their career, such as generating
       a social impact or having time for family life, whereas men are more likely to want status (agentic goals) (Diekman;
       Steinberg, 2013). These goals are presumably socialised. They overlap with the people/thing preferences discussed
       above in terms of career preferences, since working with people often leads to socially positive outcomes (Yang;
       Barth, 2015). Family preferences do not seem to affect whether a STEM qualified female chooses a STEM career,
       although men choosing STEM are more likely to expect to be childless (Sassler; Glass; Levitte; Michelmore, 2017).
       Overall, evidence mostly from the USA suggests that the most direct reason for the differing female participation
       rates in STEM and other subjects is that women have different subject preferences to men (Ceci; Williams, 2011),
       whatever the fundamental causes of those preferences. Thus, it is important to understand why some academic
       subjects are relatively unattractive to women.
This study assesses field differences in gender disparities in UK research publishing to give finer grained insights than
available from national statistics. The focus is on research publishing rather than research employment for three reasons:
- whilst academic employment statistics are available for the UK (see below), available classifications of research publi-
  cations are finer grained;
- publication metadata can give even finer-grained and different insights into research interests; and
- the results are internationally comparable, whereas employment statistics are not, and are not always collected or
  published.
A secondary goal is to assess differences with the USA              This study assesses field differences in
(from a previous similar study: Thelwall; Bailey; Tobin;
                                                                    gender disparities in UK research publi-
Bradshaw, 2019) because these may illuminate under-
lying factors contributing to different outcomes in the             shing to give finer grained insights than
two countries. Although local context has a substantial             available from national statistics
influence on gender imbalances in science (Etzkowitz;
Kemelgor; Uzzi, 2000) and the UK and USA organise higher education differently, they share a common primary lan-
guage and aspects of culture. The people/things theory is used to guide the analysis rather than the communal/agentic
goals theory because the latter is impractical to apply to fields. Any failure of this theory to explain the results suggests
that other theories (e.g., communal/agentic or hypotheses from the first set above) may be needed instead or in addi-
tion. The research questions are as follows.
        RQ1: How do author gender disparities vary between broad and narrow fields for UK journal articles? Are there
        differences from the USA?
        RQ2: How do author gender disparities vary between topics, methods and styles for UK journal articles? Are
        there differences from the USA?

e290415                                                    Profesional de la información, 2020, v. 29, n. 4. e-ISSN: 1699-2407   3
Mike Thelwall; Mahshid Abdoli; Anna Lebiedziewicz; Carol Bailey
2. Background
There are large international differences in social expectations about the types of jobs that are suitable for women for
historical reasons (e.g., Alesina; Giuliano; Nunn, 2013). An analysis of 115 field categories from arXiv and PubMed found
substantial differences in the proportions of female authors between fields and countries, with the UK being about
average on a world scale (Holman; Stuart-Fox; Hauser, 2018). Contrasting greatly with the UK, women have dominated
Malaysian academic computer science at all levels (Othman; Latih, 2006). Over a decade ago, women dominated under-
graduate education in Iran in all areas except engineering, despite previous (and ongoing) government attempts to block
women from “masculine” academic subjects in prestigious universities (Haeri, 2013; Mehran, 2009; Shavarini, 2005). In
the EU, women form the majority of scientists and engineers in Lithuania, Bulgaria, Latvia, Portugal and Denmark (Euros-
tat, 2019). This section focuses on the USA and UK, however, as the primary comparison in the current paper.
The UK and USA organise academia differently. In the
Women in the USA are more likely to be
UK, most universities are public whereas equivalent US
degrees take longer and there are many private and sta- found in people-oriented rather than
te funded universities. Salaries for UK academics below thing-oriented careers
(full) professor level are relatively standardised, with na-
tionally agreed pay scales. Career-long publishing is necessary for periodic research assessments (www.ref.ac.uk) and
usually for promotion. In the US, academics typically start as an assistant professor and apply for tenure after about
seven years, needing to provide evidence of research achievements. Ongoing publishing in both countries would pre-
sumably help subsequent promotion and other career prospects and may be encouraged at university level to enhance
prestige or the positions in university or department rankings (e.g., U.S. News department rankings for the USA or in-
ternational university league tables for both countries). Contracts in the USA are typically for 9 months per year, with
faculty often applying for research funding grants or extra summer teaching to cover the remaining three months. The
lack of standardised US pay scales means that academics in higher status fields like law, economics and engineering are
paid more in some institutions (US Department of Labor, 2019; Watson, 2019), further enhancing their status. Failure
to get US tenure may lead to academics moving to a different institution or joining a teaching-focused two-year college.
Because of the different organisations of the university systems, gender may influence academic careers and publishing
differently in each country. Other factors, such as universities in relatively isolated campuses in the USA may also in-
fluence the career prospects of researchers in relationships if the career of one partner is prioritised: this problem is
recognised through support for dual career couples:
http://www.hercjobs.org/dual-careers
2.1. People/things or communal/agentic goals in the USA and exceptions
As mentioned in the introduction, women in the USA are more likely to be found in people-oriented rather than thing-orien-
ted careers (Su; Rounds; Armstrong, 2009; Su; Rounds, 2015). Social and family impact (communal goals) tend to be more
important career goals for US women in comparison to personal status (agentic goals) for US men (Diekman; Brown; Johns
ton; Clark, 2010; Diekman; Steinberg; Brown; Belanger; Clark, 2017; Diekman; Steinberg, 2013). This largely overlaps
with the people/thing hypothesis because social impact fields are likely to involve people. Although the communal/agentic
theory has more direct evidence in the sense of matching what people claim their career goals are, the current article focu-
ses on the people/thing hypothesis because this aligns better with the methods used. It aligns better because it is relatively
straightforward to check whether a description of a research topic aligns with people or things (or neither). In contrast, the
communal/agentic goals theory is more about perceptions and it is problematic to infer whether a topic would be studied
because researchers perceived that it would support their communal or agentic goals.
One previous study has examined the
people/things hypothesis for research
publishing in the USA, comparing the
proportion of female first authored ar-
ticles within broad and narrow Scopus
categories and detecting gendered ter-
ms used in article titles, keywords and
abstracts for articles published in 2017
(Thelwall; Bailey; Tobin; Bradshaw,
2019). The results were broadly consis-
tent with the people/things hypothesis
in the sense that people-related fields
tended to have higher proportions of
female first authors and thing-related
fields tended to have higher proportions
of male first authors. This extended to
methods, with women being more likely
http://www.hercjobs.org/dual-careers
to use qualitative methods and men be-
e290415 Profesional de la información, 2020, v. 29, n. 4. e-ISSN: 1699-2407 4
Gender disparities in UK research publishing: Differences between fields, methods and topics

ing more likely to use quantitative methods. A female tendency to use qualitative methods, relative to males, and a co-
rresponding male tendency to use quantitative methods has also been found in many international studies of individual
fields (e.g., Nunkoo; Thelwall; Ladsawut; Goolaup, 2020; Williams; Kolek; Saunders; Remaly; Wells, 2018). There were
important exceptions in the USA study, however. Relatively high female interest in veterinary science and cell biology
could not easily be explained by their topics due to the absence of people, although they might both offer social impact
goals. Similarly, there was relatively high male interest in research involving patients (i.e., people) and abstraction (e.g.,
pure maths, logic), despite the absence of a focus on things. Men were also more interested in people-related fields in-
volving power or control, including law and politics, perhaps because they fulfil status goals (Diekman; Steinberg, 2013).
Thus, in academia, the people/things hypothesis fits the USA to a large extent, with important exceptions that seem to
fit the communal/agentic goals theory.
A study of India with similar methods also found broad agreement with the people/things hypothesis but substantial
differences from the USA, such as veterinary science being the most male field, women forming a lower proportion
overall, and narrower differences in gender proportions between fields (Thelwall; Bailey; Makita; Sud; Madalli, 2019).
2.2. UK context
The people/things and communal/agentic hypotheses have not been tested in the UK but people/things can be chec-
ked against public statistics about course enrolments and academic staff. According to the relatively broad categories
reported by the UK Higher Education Statistics Agency (HESA), in 2016/7, a minority of UK postgraduate degrees were
awarded to women in science (44%) but a majority (52%) in non-science subject areas (HESA, 2018a). Whilst women
were less likely to complete a research degree in most STEM fields, gaining only a quarter of qualifications in Engineering
& Technology and Computer Science, they were a majority in the Biological Sciences (Table 1). Largely people-oriented
subject areas (Education, Languages, Subjects Allied to Medicine, Social Sciences) mostly have substantial female majo-
rities, and largely thing-based fields (Physical Sciences, Engineering & Technology, Computer Science) have substantial
male majorities. In comparison, 58% of all UK degrees were awarded to women, with female to male (F/M) ratios varying
from 3.73 (Subjects Allied to Medicine) to 0.23 (Engineering & Technology).

Gender proportions in postgraduate degrees do not necessarily translate into similar gender proportions in academia
because of historical factors (e.g., there are more female students now than 20 years ago, when some current staff were
recruited) and career choices (e.g., a higher proportion of postgraduate female mathematicians may prefer maths tea-
ching than maths research).
Although women in the UK receive 57% of undergraduate degrees and 47% of postgraduate research degrees (HESA,
2018b: Table K), there are fewer female acade-
mics (44%), full professors (25%) (HESA, 2018b:  Table 1. Research-based postgraduate degree awards in the UK 2016/7 (e.g., PhD,
                                                 MPhil) in descending order of female proportion*
Table B), and university governing board mem-
bers (32%) (Sherer; Zakaria, 2018). Lower pro-                   Subject area                  Students   Female       F/M
portions of women at senior academic levels       Veterinary Science                                85      71%        2.40
may be partly due to historically higher gender
                                                  Education                                      1,045      68%        2.12
inequalities and greater female ambivalence
about status goals, with men tending to garner    Languages                                      1,620      62%        1.61
higher prestige indicators (Kandiko-Howson;       Biological Sciences                            3,935      61%        1.59
Coate; De-St-Croix, 2018). As mentioned abo-      Subjects Allied to Medicine                    1,985      58%        1.40
ve, low proportions of women in senior posi-
                                                  Medicine & Dentistry                           2,455      56%        1.28
tions could also be partly due to implicit bias,
such as by predominantly male senior promo-       Mass  Communications    & Documentation          250      56%        1.27
tion committees more valuing male gendered        Agriculture & Related Subjects                   225      56%        1.25
achievements. Women were more likely to           Creative Arts & Design                           880      52%        1.10
have a primarily teaching role than to conduct
                                                  Social Studies                                 2,385      50%        1.02
teaching and research, with 52% of academics
on teaching-only contracts being female, 41%      Law                                              520      45%        0.82
on teaching and research contracts and 47%        Historical & Philosophical Studies             1,990      44%        0.80
(i.e. the sector average) on research-only con-   Business & Administrative Studies              1,280      44%        0.78
tracts (HESA, 2018b: Table B). This would be
                                                  Architecture, Building & Planning                455      42%        0.70
consistent with a mid-career choice for women
to temporarily or permanently switch to a tea-    Physical Sciences                              3,515      36%        0.56
ching-only role (perhaps related to child-care    Mathematical Sciences                            735      27%        0.37
responsibilities).                                Computer Science                               1,105      25%        0.34
Some women may accept temporary teaching                 Engineering & Technology                   3,690       25%        0.33
only roles in the hope of longer-term perma-             Total (incl. combined)                    28,155       47%        0.88
nence and more time for research (Dyer; Wal-
kington; Williams; Morton; Wyse, 2016). As              *Source: HESA, 2018c: Figure 18.

e290415                                                     Profesional de la información, 2020, v. 29, n. 4. e-ISSN: 1699-2407   5
Mike Thelwall; Mahshid Abdoli; Anna Lebiedziewicz; Carol Bailey

part of this, they may produce lower quality     Table 2. Full-time and part-time academic staff in the UK 2016/7 by HESA cost centre, in
research with their limited scholarship time     descending order of female proportion*
to stay in contact with their field. Probably     HESA cost centre                                   Total**     Female         F/M
because of a greater share of teaching-only       Nursing & Allied Health Professions                  10,030      75%          2.99
contracts, women may write fewer journal
                                                  Education                                             8,990      67%          2.02
articles than men (for UK social science:
                                                  Modern Languages                                      5,865      66%          1.93
Schucan-Bird, 2011), reducing their long-
term research career prospects.                   Health & Community Studies                            2,980      65%          1.90
                                                  Social Work & Social Policy                           2,895      65%          1.82
Although the classification systems are
different, there are some differences in          Psychology & Behavioural Sciences                     6,955      61%          1.55
gender proportions between research-ba-           Continuing Education                                    930      60%          1.48
sed postgraduate degree awards (Table 1)          English Language & Literature                         4,890      56%          1.29
and academic staff (Table 2) for Veterinary       Sociology                                             3,145      55%          1.23
Science (71% female postgraduate awards
                                                  Catering & Hospitality Management                       655      54%          1.16
vs. 54% female staff) and Law (45% vs. 52%),
                                                  Veterinary Science                                    1,390      54%          1.16
despite broad overall similarity. Differences
could be due to gender balance changes            Clinical Medicine                                    24,305      53%          1.15
over time, gender differences in the pipeli-      Law                                                   5,660      52%          1.07
ne between research degrees and academic          Art & Design                                         10,375      51%          1.06
jobs, or classification anomalies (academic       Anthropology & Development Studies                      920      51%          1.04
staff may be classified by department rather
                                                  Anatomy & Physiology                                  1,865      50%          1.02
than by specialism, such as subject specia-
lists within education departments).              Pharmacy & Pharmacology                               2,325      50%          1.00
                                                  Classics                                                650      49%          0.96
As mentioned above, gender disparities in
                                                  Agriculture, Forestry & Food Science                  1,145      49%          0.95
employment do not necessarily translate di-
rectly into gender disparities in publishing,     Clinical Dentistry                                    1,535      47%          0.88
as measured in the current article (whether       Biosciences                                          13,965      46%          0.84
in the UK or USA). Whilst many previous stu-      Area Studies                                            375      45%          0.83
dies have found men to publish more jour-         Archaeology                                             775      45%          0.80
nal articles (Nielsen, 2016; Rørstad; Aksnes,
                                                  Music, Dance, Drama & Performing Arts                 7,855      43%          0.76
2015; Van-Arensbergen; Van-der-Weij-
den; Van-den-Besselaar, 2012), this seems         Business & Management Studies                        15,455      43%          0.74
to be due to job type differences, such as        History                                               3,520      42%          0.71
more women working part time and in tea-          Media Studies                                         4,670      41%          0.70
ching-focused jobs (Ceci; Ginther; Kahn;          Geography & Environmental Studies                     2,395      39%          0.65
Williams, 2014), rather than differences be-
                                                  Politics & International Studies                      3,385      37%          0.59
tween genders within comparable jobs. For
                                                  Theology & Religious Studies                            715      37%          0.58
example, gender disparities in productivity
for ecology researchers disappear after fac-      Sports Science & Leisure Studies                      2,875      36%          0.57
toring out career breaks and self-citations       Earth, Marine & Environmental Sciences                3,675      35%          0.53
(Cameron; White; Gray, 2016).                     Architecture, Built Environment & Planning            4,065      34%          0.52

2.3. Recent UK academic gender in-                Economics & Econometrics                              2,970      30%          0.42

equality research                                 Philosophy                                            1,115      30%          0.42

According to the United Nations Develop-          Chemistry                                             4,310      29%          0.41
ment Programme (UNDP), the UK (rank 28            Chemical Engineering                                  1,225      26%          0.35
out of 188 in the world) had less gender in-      Mineral, Metallurgy & Materials Engineering           1,200      26%          0.34
equality than the USA (rank 48), partly due to    Mathematics                                           4,690      23%          0.31
a slightly higher proportion of women in em-
                                                  Civil Engineering                                     1,985      23%          0.30
ployment (F: 56.9%; M: 68.7% in the UK; F:
                                                  IT, Systems Sciences & Computer Software
56.0%; M: 68.4% in the USA) (UNDP, 2016).         Engineering
                                                                                                        6,875      22%          0.29
There do not seem to have been any claims
                                                  General Engineering                                   3,805      22%          0.28
about causes of gender inequalities in acade-
                                                  Physics                                               5,175      19%          0.23
mia that are UK-specific (there are many for
the USA: Thelwall; Bailey; Tobin; Bradshaw,       Mechanical, Aero & Production Engineering             5,135      17%          0.21
2019) or that apply to the UK but not the         Electrical, Electronic & Computer Engineering         4,380      15%          0.17
USA. Recent UK-specific academic gender           Total                                              204,095       46%          0.84
inequalities research has focused instead on
                                                 *Source: HESA, 2018d: second chart
the steps necessary to promote successful fe-    **The counts are of full-person equivalents, which is like the standard full-time
male careers in STEM subjects or overall.        equivalent calculation but excludes time working in unrelated roles.

e290415                                                   Profesional de la información, 2020, v. 29, n. 4. e-ISSN: 1699-2407          6
Gender disparities in UK research publishing: Differences between fields, methods and topics Conflicting opinions from interviews with 55 staff members from one UK medical school suggested that the most impor- tant interventions needed were for childcare, career progression, general, or financial/strategic policy initiatives (Bryant; Burkinshaw; House; West; Ward, 2017). Failure to provide support at key stages of careers may have a long-lasting effect (Maddrell; Strauss; Thomas; Wyse, 2016). Athena SWAN is the main UK higher education initiative to tackle gender inequality, comparable in goals to Advance in the USA, which uses a grant-based strategy (Rosser; Barnard; Carnes; Munir, 2019). UK institutions can apply for certi- fication that they are compliant with the goals, ultimately leading to a Gold Award for “beacons of achievement in gen- der equality” (Barnard, 2017), and require at least a Silver Award to apply for one source of funding (Rosser; Barnard; Carnes; Munir, 2019). It seems to be contributing to an overall more positive culture of willingness to address gender inequalities in the UK (Maddrell; Strauss; Thomas; Wyse, 2016). Nevertheless, the amount of time taken on work to achieve the benchmarks for awards may be detrimental to the long-term careers of individual (mainly female) resear- chers and the programme cannot tackle wider societal issues (Caffrey; Wyatt; Fudge; Mattingley; Williamson; McKevitt, 2016; Ovseiko; Chapple; Edmunds; Ziebland, 2017). Promoting gender inequality without Athena SWAN can also be time-consuming, especially if not in a supportive environment (Wright; Cooper; Luff, 2017). Probably because of the complexity of the issue, no research has demonstrated the case-and-effect impact of Athena SWAN on female careers, although there are clear university policy changes and strategies to track progress (Rosser; Barnard; Carnes; Munir, 2019). Whilst Athena SWAN awards require concrete evidence of progress, a survey of UK me- dical schools with Silver Awards found that Silver Award status had not improved female researcher careers (Gregory‐ Smith, 2018). The head of an Athena SWAN Gold Award chemistry department has argued that progress can be made through a combination of pro-active actions, such as searching for suitable female applicants, and continual small steps that improve the working lives of all staff (Welton, 2016). 3. Methods 3.1. Research design This article focuses on research publishing as a window to gain insights into gender disparity differences between fields. The research design was (RQ1) to assess the proportion of female first authors in broad and narrow fields to identify field differences in gender disparities and (RQ2) to use word association analyses to identify gender disparities in research topics, methods or styles. Scopus was used in preference to the Web of Science for its narrower subject categories: 334 Scopus categories listed at: https://www.elsevier.com/solutions/scopus/how-scopus-works/content compared to 153 WoS categories listed at: https://images.webofknowledge.com/images/help/WOS/hp_research_areas_easca.html And for compatibility with a previous study of the USA. The gender of the first author was used because in all broad fields the first author contributes most to the research (Larivière; Desrochers; Macaluso; Mongeon; Paul-Hus; Sugimoto, 2016). Ignoring all author genders after the first is a simplifying assumption that serves to reduce gender biases by a small amount. For example, the assumption is always correct for solo research and for research where all authors have the same gender. It is only incorrect when an article has multiple authors of mixed genders, and an author after the first with a different gender has had a substantial input. Alphabetical author lists have a very small impact on some fields in practice (see below). Biological fields with influential last authors are more problematic because a senior male last author may have often designed and funded a study ca- rried out by a junior female author, causing a systematic bias. In this case, the junior female would have at least chosen the narrow topic and lab for her research (e.g., PhD) and agreed to the individual study even if she had not selected or designed it. Non-binary genders are ignored because they cannot be detected from first names and there are too few to give useful information with the statistical approach used here. For the same reason, research is characterised as from the UK if the first author has a UK affiliation, irrespective of their nationality and the affiliations and nationalities of any other authors. For RQ1, simple authorship gender proportions were calculated for each broad and narrow Scopus field. For RQ2, the terms used in article titles, keywords and abstracts were combined and compared between male first-au- thored and female first-authored UK journal articles, both within and across narrow fields. Terms with statistically sig- nificant gender differences were then assessed for indications of topics, methods and styles. This is an indirect and non-comprehensive way of addressing RQ2 but is a practical method for getting insights into gender disparities across academia. 3.2. Data The basic dataset consisted of records for all documents of type journal article in Scopus (excluding reviews, letters, editorials etc.) that were published in 2017 and had a first author with a UK affiliation and a first name from which a gender could be inferred with high accuracy. The year 2017 was chosen to give the most recent available complete year. e290415 Profesional de la información, 2020, v. 29, n. 4. e-ISSN: 1699-2407 7
Mike Thelwall; Mahshid Abdoli; Anna Lebiedziewicz; Carol Bailey

The records were downloaded from Scopus in February 2018, over a month after the end of 2017, and so should be
reasonably complete. Queries of the form:

             SUBJMAIN(1105) AND DOCTYPE(ar) AND SRCTYPE(j) AND AFFILCOUNTRY(“United Kingdom”)

were used for each of the 308 Scopus narrow fields (excluding the 26 overlapping broad field categories 1100 to 3600,
but including 1000 Multidisciplinary) (Scopus, 2018: the AJSC tab of the Source title list spreadsheet). In the illustrative
query above, 1105 is the field code for Ecology, Evolution, Behavior and Systematics. Scopus returns a maximum of 5,000
articles per query and so the queries for each field with over 5,000 articles were repeated in reverse sorting order to
download an additional (up to) 5,000 matches, when necessary. This resulted in a complete set of records for all fields.
Records where the first author did not have a UK affiliation were removed, leaving 142,636 Scopus journal articles from
2017 with a UK-affiliated first author.
Each article was assigned to one or more narrow fields, when it was returned for the query for that narrow field. These
narrow fields are the standard Scopus journal-level categories. Scopus assigns journals to all categories where they fit
well, but can sometimes also assign them to apparently inappropriate categories (Wang; Waltman, 2016). This creates
the risk that some of the findings are caused by Scopus classification anomalies rather than gender disparities. Such
instances are flagged, in the text when identified.
Each article was assigned to one or more broad fields containing the narrow fields of the article, again using the Scopus
journal classifications.
Each article was attributed a first author gender or, if no gender could be found, the article was discarded. Author gender
was inferred using a look-up table of 1,021 male names and 3,937 female names, culled from the USA 1990 census and
only including names that are used at least 90% of the time by the same gender. This matched 65% of the UK first au-
thor records (92,058 articles). A further 14% of UK first authors used initials, leaving 21% using unclassified first names.
The USA census was chosen since the UK has no similar source. Gender APIs were not used (although they would have
increased the number of gendered papers by about 8%, if using records that were at least 90% monogender based on at
least 100 social media profiles) because they are not transparent and exploit genders declared in social media profiles,
which are less reliable than census data. The most common ungendered names were Alex (339 articles), Nicola (302),
Robin (213), Jamie (212), Sam (196), Ali (179), Jan (164), Wei (140), Lee (137), and Konstantinos (127). Of these, only
Konstantinos is monogender (male, as shown by Googling, konstantinos site:ac.uk). Nicola is mainly female in the UK but
male for Italian researchers in the UK (Google, nicola site:ac.uk), and Ali is a mainly male name but an occasional short
form of Alison and Alicia (Google, ali site:ac.uk).
3.3. Alphabetisation checks
The assumption that the first author gender is the main author gender may be violated when article authors are listed
alphabetically. The extent of alphabetisation of each narrow field was estimated by comparing the level of alphabe-
tisation with that expected by chance. First author gender errors due to alphabetisation were rare overall (2%), but
most prevalent (for a field with >50 articles) in Discrete Mathematics and Combinatorics (12%). Male-to-female and
female-to-male errors largely cancel out, however, leaving a maximum net difference of 2% for any field. Thus, the pro-
portions of authors of each gender in a field are largely unaffected by alphabetisation. The statistical power of the word
association tests for some individual fields is weakened by the occasional swapping of first author genders, however, but
this cannot cause false positive results.
3.4. Gender detection accuracy checks
The gender detection heuristic is not always correct. To its accuracy, a set of 1,000 UK first authored articles from 2017
was selected from the entire dataset (before removing ungendered articles) with a random number generator and their
first authors classified for gender, when possible, by searching for their home page online and identifying a picture or
gendered pronoun pointing to a gender assignment. Author first names were not used to assign them a gender, even
when apparently obvious. This produced a list of apparently correct genders for the researchers, which was used to
compare with the results of the automatic method.
Compared to the human-classified genders, the automatic method had precision of 97.5% and recall of 66.4% for men
with a gender that could be identified online. The gender assignment program was therefore rarely incorrect when de-
ciding that a UK researcher was male (only 2.5% errors for this) but could only find about two thirds (66.4%) of the male
researchers in the set (the rest were classified as female or unknown). The method had a corresponding precision of
99.5% and recall of 70.8% for women with a gender that could be detected online. The gender assignment program was
therefore almost never incorrect when deciding that a UK researcher was female (only 0.5% errors for this) and could
find well over two thirds (70.8%) of the female researchers in the set (the rest were classified as male or unknown).
RQ1: Proportion of articles in each broad and narrow field, by first author gender
For each broad and narrow field, the proportion of articles with a male or female first author was calculated. Because
the gender detection algorithm is more accurate for women than for men, a direct comparison of the numbers of male

e290415                                                   Profesional de la información, 2020, v. 29, n. 4. e-ISSN: 1699-2407   8
Gender disparities in UK research publishing: Differences between fields, methods and topics and female first-authored articles in each field for RQ1, as detected by the algorithm, would be misleading. A correction factor was therefore calculated to give a corrected estimate of the number of male and female first authored articles in each field. Multiplying by precision/recall gives a correction factor to estimate the number of UK first authors of each gender, 1.470 for men and 1.406 for women. This compensates both for occasional gender classification errors and for more female UK scientist first names being detectable. The same procedure has been applied to the US data used for comparisons (with a set of US author name data) so that the results should not be influenced by international differen- ces in the rate of detecting male or female genders from names. The results were analysed with the people/things theoretical dimensions discussed above because these are relatively straightforward to apply to fields (i.e., the extent to which the fields involve people or things) in comparison to the communal/agentic goals theory (i.e., the extent to which the fields satisfy personal communal or agentic goals). To aid a discussion of the people/things dimensions, classifications of the broad and narrow fields singled out for discussion were taken from a prior paper (Table A1 of: Thelwall; Bailey; Makita; Sud; Madalli, 2019). These had been made by three people with a library science degree or PhD on the scale of 1 (very people-oriented subject) to 5 (very thing-oriented subject). The score for each field was the score chosen by at least two, otherwise the average of the three. RQ2a: Words used more often by one gender in article titles, abstracts and keywords overall All words were extracted from the titles, abstract and keywords of all gendered articles in the dataset. The number of articles containing each word was calculated separately for men and women to give an overall gendered word frequency table. The number of articles in each of the 308 narrow fields containing each word was also calculated separately for men and women, giving an additional 308 field specific gendered word frequency tables. For each word in the overall gendered word frequency table, a 2x2 chi-squared test was employed to detect whether there was statistical evidence that it was used disproportionately often by UK male or female first authors. To give a simple example with artificially low numbers, if the term family was used in 20 out of 1000 female first-authored articles (2%) and 5 out of 500 male first-authored articles (1%) then the chi-squared value of 2.03 for the resulting 2x2 table is insufficiently large to reject the null hypothesis that the two genders have the same underlying tendency to use the term family in their research. Thus, whilst there could be a gender difference in the use of this term, the gender disparity is not large enough to support this conclusion. The first name gender detection precisions are high enough for these tests to be accurate. All gender assignment errors would weaken the power of a test but would not generate spurious results because they would only add noise to the data. Since this chi-squared test was repeated for each term, there is a high chance of spurious positives (i.e., evidence of a gender difference when the difference in the data is due to chance factors rather than an underlying gender difference in tendency to use the term). This was guarded against with the Benjamini-Hochberg (1995) procedure, which increases the chi-squared threshold in a systematic way that keeps the chance of making at least one false positive conclusion below 5%. Terms that occurred too infrequently to give a positive chi-squared test were first discarded to increase the power of the Benjamini-Hochberg procedure. The result of this procedure is a list of terms for which there is statistical evidence of gender differences in their use by researchers to use in journal article titles, abstracts or keywords. RQ2b: Words used more often by one gender in article titles, abstracts and keywords within narrow fields The above science-wide list is likely to generate terms that are closely associated with research topics but may not identify gender differences that occur between authors researching the same topic (e.g., recurring methods choices). To search for these, for each narrow field having at least 50 articles with gendered authors, a list of the 20 most gendered terms was generated from the field specific gendered word frequency tables mentioned above using the chi-squared test described above, but without the Benjamini-Hochberg correction. This produced a set of lists of gendered terms, one for each narrow field. The narrow field gendered term lists were then merged and terms that occurred in at least 12 were reported. These are terms that have gender differences in use in at least 12 fields. Terms with less than 70% of the differences being in the same gender direction were excluded. Whilst this is not a rigorous statistical procedure and the numbers 20 and 12 abo- ve were arbitrarily chosen, it produces terms that are likely to have gendered associations across multiple narrow fields. The threshold of 50 above was chosen heuristically as large enough to remove small fields for which gender differences could be due to a small number of authors. The result of this procedure is a list of terms that are frequently most used by the same gender in multiple narrow fields. RQ2ab: Reasons for gender differences in term use The above two procedures (sections RQ2a and RQ2b) produced lists of words used disproportionately often by one gender overall or within multiple narrow fields but did not give insights into why these differences occurred. For some words, the reasons might be guessed but for others there was not a clear reason and so all gendered words detected were systematically investigated to find out why there was a gender disparity. Reading a sample of articles containing a term is insufficient because this can reveal why a term is used by not why it is used more by one gender. Follow-up word e290415 Profesional de la información, 2020, v. 29, n. 4. e-ISSN: 1699-2407 9
Mike Thelwall; Mahshid Abdoli; Anna Lebiedziewicz; Carol Bailey

association analyses were used instead because these can           Table 3. Four categories of paper based on the first author gender and
take into account differences between genders and fields.          whether the paper title, abstract or keywords contained a given term.

                                                                  Paper content \ First author gender Male     Female
For each gendered word, three word association analyses
(as described below) were conducted and triangulated to          With term                            MW         FW
detect the core issue causing the gender imbalance in its        Without term                         MO         FO
use (see Table 3 for an explanation of the codes).
- Overall gendered term use: A word association analysis examined terms that occurred more often in articles written by
  the selected gender authors and containing the term compared to the remaining articles (men: MW vs. FW+MO+FO;
  women: FW vs. MW+MO+FO).
- Term use by each gender separately: A word association analysis examined terms that occurred more often in articles
  written by the selected gender authors and containing the term, compared to articles written by the same gender
  authors and not containing the term (men: MW vs. MO; women: FW vs. FO).
- Gender differences in use of the term: A word association analysis examined words that were more frequent for the
  selected gender than the other gender for documents containing the term (men: MW vs. FW; women: FW vs. MW).
A word association analysis involves examining words that frequently occur in the same document as the target word.
Each word association analysis here consisted of the first author:

- Visually inspecting the list of terms that associate with the selected word.
- Reading 40 matching article titles/descriptions/keywords using the Key Word in Context (KWIC) approach, selected
  using a random number generator (for the first one of the three word association analyses only since the results are
  the same).
- Combining the first two steps to identify the underlying cause(s) or semantic/contextual patterns.
For example, the FW vs. MW+MO+FO word association analysis for the female term coded found 89 associating terms
(i.e., terms often found in female documents containing coded), including: thematically, filmed, transcribed, verbatim,
mealtime, interview, thirty-five, cluster-randomised, theme, alcohol-related, staff, coding, qualitative, checked. The first
random KWIC selection was the sentence, “Interviews were transcribed, coded and analyzed using framework” from the
abstract of the article, “Qualitative study of welcome houses: a recent initiative designed to improve retention in thera-
peutic communities”. After scanning the complete list of 89 terms and 40 KWIC results and repeating this for the other
two word association analyses (FW vs. FO and FW vs. MW), the female-associated term coded was classed as having a
female association due to its use in describing research interviews.
The time-consuming nature of this categorisation process (typical for qualitative methods) is necessary because of term
ambiguity. For example, the term coded was frequently used in the dataset in the context of signal processing and pro-
gramming, but these uses did not cause the gender bias in favour of women.
RQ2ab: Categories of reasons for gender differences in term use
The word association analysis results were used by the first author to categorise each term found by either word fre-
quency analysis (overall and within subject) into broad and narrow themes, as reported in the last two tables in this
paper. For example, the term coded was eventually grouped within the theme Interview inside the larger category Qua-
litative Methods.
The broad and narrow themes were chosen to align with
the similar themes reported for the prior USA paper as
                                                                There are substantial variations in gen-
far as possible to so that any international differences        der disparities for broad fields
found could not be due to differences in the classifica-
tion process. With this approach, UK-USA differences should only occur when the UK data cannot fit the USA situation
rather than when a different UK explanation is selected from a range of plausible explanations that might include that
chosen for the USA.

4. Results
The results are briefly analysed in terms of the people/things dichotomy and prior USA findings.
RQ1: Research fields
There are substantial variations in gender disparities for broad fields, with over twice as many female first-authored
papers in Veterinary Science and Nursing, and over three times as many male first-authored papers in Mathematics and
Physics (Table 4).
The rank order of the broad fields reflects the people/things dimensions to some extent, but not closely. Ignoring the
small Veterinary Science broad field, people-oriented Nursing and Psychology are at the top and thing-oriented Physics
and Astronomy, Computer Science, Engineering, and Mathematics are at the bottom. Both Veterinary Science and Im-
munology and Microbiology have a high proportion of female first authors, despite not focusing on people. Similarly,
Economics, Econometrics & Finance is near the bottom, despite an apparent absence of things.

e290415                                                  Profesional de la información, 2020, v. 29, n. 4. e-ISSN: 1699-2407          10
Gender disparities in UK research publishing: Differences between fields, methods and topics
Table 4. First author gender ratios for all 26 Scopus broad fields together the subfields with the highest and lowest ratios of female-authored papers
to male-authored papers (qualification for the 237 narrow subfields: at least 50 gendered UK first authored Scopus journal articles in 2017; n=92,058
articles overall). F/M odds ratios were multiplied by 1.406/1.470 to correct first name gender identification biases. Values from the USA are included
for comparison (Thelwall; Bailey, Tobin; Bradshaw, 2019).
Fields/ F/M F/M P/T Most female narrow subfield*** F/M
Broad field
Used UK USA* ** Most male narrow subfield UK
Veterinary 4 -
2.25 1.49 2.7
(n=67) 0 -
21 Maternity and Midwifery 19.13
Nursing 2.11 1.93 1
8 Issues, Ethics and Legal Aspects 0.98
7 Developmental and Educational Psychology 2.13
Psychology 1.51 0.93 2
7 Experimental and Cognitive Psychology 1.13
6 Parasitology 1.62
Immunology & Microbiology 1.32 0.75* 3
5 Applied Microbiology and Biotechnology 0.82
9 Cognitive Neuroscience 1.43
Neuroscience 1.08 0.82 3
7 Sensory Systems 0.74
47 Obstetrics and Gynecology 2.48
Medicine 1.05 0.74 2
42 Orthopedics and Sports Medicine 0.41
4 -
Dentistry 0.96 0.33* 1
0 -
22 Gender Studies 4.75
Social Sciences 0.93 0.76 2
22 Human Factors and Ergonomics 0.55
Biochemistry, Genetics & Molecular 15 Aging 1.64
0.87 0.67* 4
Biology 14 Structural Biology 0.51
13 Speech and Hearing 2.62
Health Professions 0.85 0.99* 1
3 Physical Therapy, Sports Therapy & Rehab. 0.57
5 Toxicology 1.24
Pharma, Toxicology & Pharmaceutics 0.83 0.69 2.7
4 Drug Discovery 0.52
Arts & Humanities 13 Language and Linguistics 1.31
0.74 0.64 2
11 Philosophy 0.38
11 Animal Science and Zoology 1.05
Agricultural & Biological Sciences 0.72 0.49 4
10 Soil Sciences 0.44
12 Health, Toxicology and Mutagenesis 1.05
Environmental Science 0.70 0.52 3
12 Ecological Modeling 0.40
10 Marketing 1.01
Business, Management & Accounting 0.62 0.47 2
8 Organizational Behavior & Hum. Res. Man. 0.60
7 Inorganic Chemistry 0.64
Chemistry 0.48 0.39 5
6 Physical and Theoretical Chemistry 0.38
8 Polymers and Plastics 0.65
Materials Science 0.48 0.39 5
7 Electronic, Optical & Magnetic Materials 0.35
3 Information Systems and Management 0.54
Decision Sciences 0.48 0.32* 4
3 Statistics, Probability and Uncertainty 0.41
5 Renew. Energy, Sustainability & Environment 0.57
Energy 0.47 0.26* 5
4 Energy Engineering and Power Technology 0.39
8 Catalysis 0.50
Chemical Engineering 0.47 0.47* 5
5 Fluid Flow and Transfer Processes 0.12
13 Stratigraphy 0.63
Earth & Planetary Sciences 0.43 0.35 3.7
11 Geotechnical Eng. & Engineering Geology 0.30
3 Economics and Econometrics 0.40
Economics, Econometrics & Finance 0.41 0.28 3
3 Finance 0.37
16 Media Technology 0.67
Engineering 0.40 0.32 5
14 Engineering (misc) 0.22
12 Human-Computer Interaction 0.82
Computer Science 0.40 0.30 5
11 Hardware and Architecture 0.23
10 Acoustics and Ultrasonics 0.41
Physics & Astronomy 0.30 0.24 5
10 Statistical and Nonlinear Physics 0.20
14 Modeling and Simulation 0.38
Mathematics 0.27 0.22 5
10 Geometry and Topology 0.08
*large UK/US rank differences;
**P/T: People-thing orientation estimated by three librarians independent of this project (1=very people-oriented subject - 5=very thing-oriented subject).
***hyphens indicate no qualifying (>50 articles) fields
e290415 Profesional de la información, 2020, v. 29, n. 4. e-ISSN: 1699-2407 11Mike Thelwall; Mahshid Abdoli; Anna Lebiedziewicz; Carol Bailey
Individual narrow fields with over 50 gendered Table 5. First author gender ratios for Arts and Humanities subfields with at least
articles reveal more extreme gender imbalances, 50 gendered UK first authored Scopus journal articles in 2017). Values from the
USA are included for comparison (Thelwall; Bailey; Tobin; Bradshaw, 2019).
from Maternity and Midwifery (19 female first-au-
thored articles for every male first-authored arti- F/M**
Narrow field P/T*
cle) to Geometry and Topology (12.5 male first-au- UK USA
thored articles for every female first-authored
Language and Linguistics 2 1.31 0.97
article). For gendered UK first authored articles, a
female first author in Maternity and Midwifery is Visual Arts and Performing Arts 1 1.10 1.00
therefore 240 times more likely than in Geometry Arts and Humanities (misc) 2 0.99 0.75
and Topology. Conservation 4 0.99 0.91
The results reflect the same broad people/thing Literature and Literary Theory 3 0.87 0.72
pattern as the USA and some of the exceptions. History 2 0.67 0.44
Compared to the USA, there are more UK fema-
Archeology (arts and humanities) 2.7 0.63 0.46
le first authors overall (UK: 43%; USA: 37%, after
applying correction factors to both). This may be History and Philosophy of Science 2 0.51 0.58
related to the slightly lower gender disparities in Religious Studies 1 0.51 0.34
general employment in the UK (UNDP, 2016 as Music 1 0.46 0.70
mentioned above). There may also be other sys-
Philosophy 2 0.38 0.28
temic causes of the overall UK-US differences re-
lated to tenure and academic employment diffe- *P/T: People-thing orientation estimated by three librarians independent of this
project (1=very people-oriented subject - 5=very thing-oriented subject).
rences, such as more women in teaching-focused **F/M odds ratios were multiplied by 1.406/1.470 to correct first name gender
institutions or jobs. There are more female first identification biases.
authors than in the USA in all broad fields except
one (Health Professions) and one tie (Chemical Table 6. First author gender ratios for Social Sciences subfields with at least 50
Engineering). Taking this into account, the small gendered UK first authored Scopus journal articles in 2017). Values from the
USA are included for comparison (Thelwall; Bailey; Tobin; Bradshaw, 2019).
Veterinary Science and Dentistry areas are much
more female in the UK, as are: Biochemistry, Ge- F/M**
netics and Molecular Biology; Decision Sciences; Narrow field P/T*
UK USA
and Energy. Psychology is ranked third in both
Gender Studies 1 4.75 1.86
countries but is male in the USA and substantially
female in the UK. Conversely, two areas are more Demography 1 1.59 1.15
male in the UK: Health Professions; Chemical En- Life-span and Life-course Studies 1 1.50 1.33
gineering (the same UK-USA F/M ratios, but lower Health (social science) 1 1.40 1.45
ranked in the UK than the USA).
Linguistics and Language 2 1.32 1.07
The Arts and Humanities broad area is analysed in Education 1 1.28 1.17
detail here because it includes contrasting fields
Social Sciences (misc) 2 1.25 1.04
with subjects that non-experts can recognise (Ta-
ble 5). There are moderately varying gender dispa- Anthropology 1 1.19 0.93
rities. The people/thing dimensions provide little Communication 1 0.90 0.98
explanation for these results because performing Library and Information Sciences 3 0.88 1.14
arts is the only component with an explicit focus
Cultural Studies 2 0.87 0.83
on people, whilst Conservation has a focus on
things and both Archeology (arts and humanities) Sociology and Political Science 2 0.85 0.65
and Music have elements of things (artefacts, ins- Public Administration 1 0.83 0.58
truments respectively). The most male field, Phi- Law 2 0.77 0.53
losophy, is also the only abstract field. As for the
Development 3 0.76 0.59
USA, this field is an exception to the people/things
hypothesis. The position of Music is influenced by Transportation 3 0.71 0.54
the inclusion of technical articles about music in Geography, Planning and Development 3 0.66 0.56
some journals in this category. Urban Studies 2 0.63 0.52
Compared to the USA, the Arts and Humanities are Safety Research 2 0.60 0.48
more female overall in the UK. The rank orders of Archeology 3 0.60 0.42
the Arts and Humanities subfields are broadly si-
Political Science and International Relations 2 0.57 0.31
milar, except that Music is much more male in the
UK. In the case of Music, its male skewing in the Human Factors and Ergonomics 1 0.55 0.41
UK compared to the USA reflects extra computer *P/T: People-thing orientation estimated by three librarians independent of this
science research into music technology in the UK project (1=very people-oriented subject - 5=very thing-oriented subject).
rather than a difference in core arts and humani- **F/M odds ratios were multiplied by 1.406/1.470 to correct first name gender
identification biases.
ties music research. For example, 14% of UK Music
e290415 Profesional de la información, 2020, v. 29, n. 4. e-ISSN: 1699-2407 12You can also read