ECONtribute Discussion Paper No. 095
←
→
Page content transcription
If your browser does not render page correctly, please read the page content below
ECONtribute
Discussion Paper No. 095

    Gender Differences in Financial Advice

            Tabea Bucher-Koenen                                Andreas Hackethal
              Johannes Koenen                                 Christine Laudenbach

May 2021                                                                                    www.econtribute.de

             Funding by the Deutsche Forschungsgemeinschaft (DFG, German Research Foundation) under
                 Germany´s Excellence Strategy – EXC 2126/1– 390838866 is gratefully acknowledged.
Gender Differences in Financial Advice
Tabea Bucher-Koenen, Andreas Hackethal, Johannes Koenen, and Christine Laudenbacha
March 8, 2021
Abstract
We show that financial advisors recommend more costly products to female clients, based on
minutes from about 27,000 real-world advisory meetings and client portfolio data. Funds recom-
mended to women have higher expense ratios controlling for risk, and women less often receive
rebates on upfront fees for any given fund. We develop a model relating these findings to client
stereotyping, and empirically verify an additional prediction: Women (but not men) with higher
financial aptitude reject recommendations more frequently. Women state a preference for delegat-
ing financial decisions, but appear unaware of associated higher costs. Evidence of stereotyping is
stronger for male advisors.
JEL Codes: G2, E2, D8
Keywords: credence goods, financial aptitude, consumer protection, financial literacy,
discrimination
a
Contact: Tabea Bucher-Koenen, ZEW - Leibniz Centre for European Economic Research and Mannheim
University tabea.bucher-koenen@zew.de; Andreas Hackethal, Goethe University Frankfurt and SAFE,
hackethal@em.uni-frankfurt.de; Christine Laudenbach, University of Bonn, laudenbach@uni-bonn.de; Jo-
hannes Koenen, ARC Econ, johannes.koenen@arc-econ.com. The authors greatly benefitted from discus-
sions with Renée Adams, Rob Alessie, Tobias Berg, Axel Börsch-Supan, Tobias Gesche, Anastasia Gr-
ishina, Michael Haliassos, Christian Kubitza, Daniel Krähmer, Annamaria Lusardi, Steffen Meyer, Alexan-
dra Niessen-Ruenzi, Farzad Saidi, Oliver Spalt, Konrad Stahl, Melissa Prado, Maarten Van Rooij, Hans-
Martin von Gaudecker, Annika Weber, and Joachim Winter. We are very grateful to seminar participants in
Mannheim, Bonn, Frankfurt, Regensburg, Stockholm, and at the Innsbruck Winter Summmit on (Un)Ethical
Behavior in Markets (2019), SGF Conference (2019), the Showcasing Women in Finance Workshop (Luxem-
bourg 2019), the CEPR Fifth European Workshop on Household Finance (2020).We gratefully acknowledge
research support from the Leibniz Institute for Financial Research SAFE. Funding by the German Research
Foundation (DFG) through CRC TR 224 (Project C01) is gratefully acknowledged.1 Introduction
Who is most in need of sound financial advice? An important group involves individuals who
have difficulties making financial choices on their own, either due to insufficient aptitude or a lack of
confidence in their decision making. Systematic empirical evidence has identified that women have
lower financial literacy as well as lower confidence in their financial decisions. This basic result holds
controlling for a wide range of factors, from wealth and income to education and the household
decision making context (Lusardi and Mitchell, 2014; Bucher-Koenen, Lusardi, Alessie, and van
Rooij, 2017; Bucher-Koenen, Alessie, Lusardi, and van Rooij, 2021). At first glance, financial
advice could therefore be particularly beneficial to women on average. A strain in the literature on
financial advice provides an important caveat, by emphasizing that the incentives of advisors (e.g.,
due to kickbacks or career concerns) and their clients are not necessarily aligned, which may lead
to mis-selling (see, e.g., Inderst and Ottaviani, 2012; Egan, Matvos, and Seru, 2019). Clients whose
aptitude is or appears to be low could be particularly susceptible to mis-selling, if they are judged
to be less likely to observe the actual quality of advice. If women are subject to stereotyping, they
would be particularly affected. Our central question therefore is: Do advisors treat men and women
differently? And if yes, Why so?
In this paper we analyze in detail whether and how financial advice differs depending on the
gender and aptitude of clients, as well as which mechanisms are able to explain these differences.
We provide unique empirical evidence from real-world financial advisory meetings between clients
and advisors at their bank. These data allow us to analyze key dimensions of advisors’ recommen-
dations, especially the type of product and its costs. We analyze how these are related to client’s
gender and financial aptitude. We find striking and robust evidence that financial advice given
to women differs systematically from advice given to men. Funds recommended to female clients
are significantly more expensive conditional on funds’ risk categories and client characteristics. In
particular, advisors are significantly more likely to recommend expensive (in terms of their annual
costs) bank own products to women than to men. Moreover, male clients are significantly more
likely to receive a rebate on purchase fees than women by the same advisor for any given fund that
is recommended.
The question is: Why? We develop a theoretical mechanism that could explain the observed
differences, which is related to the fact that financial advice is a type of credence good (see, e.g.,
Dulleck and Kerschbamer, 2006; Dulleck, Kerschbamer, and Sutter, 2011). In such a context,
knowledgeable clients are more likely to be able to assess product quality. This implies, that they
have better outside options and are better able to judge the quality of advice received. Advisors
incentivized by career concerns, sales commissions and kickbacks might attempt to sell costly or
less suited products to clients who appear clueless.1 First, if advisors cannot observe clients’
true financial aptitude, but only a noisy signal that is on average informative, then clients who
appear to be knowledgeable (here: men) will on average receive better advice, while clients who
1
This is, e.g., similar to Chen and Gesche (2019); Inderst and Ottaviani (2012); Stoughton, Wu, and
Zechner (2011); Mehran and Stulz (2007).
1appear to be less knowledgeable (here: women) will receive worse (more expensive) advice.2 This
is reflected by the empirical evidence we document. Second, since gender is only a noisy signal of
financial aptitude, there are women with high financial skills. From this, we derive an additional
testable hypothesis: Women with high financial literacy skills are more likely to reject financial
advisors’ recommendations. For men, who on average receive high-quality advice, the probability
of rejection should not depend on their financial aptitude. In accordance with this hypothesis, our
data show that only women with higher financial literacy are in fact more likely to reject advisor
recommendations; this pattern is not observed for men.
Such detailed real-world evidence on advisor client interactions has been lacking so far. The
main reason for this is that it is extremely difficult to observe details of meetings between advisors
and clients, which makes it challenging to evaluate the quality of advice in actual interactions.
Other studies primarily focus on experimental settings and examine specific aspects of interactions
with advisors (see, e.g., Mullainathan, Noeth, and Schoar, 2012; Bhattacharya, Kumar, Visaria,
and Zhao, 2020; Brock and De Haas, 2020). In contrast to this, we use detailed administrative
bank data including the minutes of advisory meetings between advisors employed by the bank
and clients, as well as information on clients’ portfolios and investment decisions. According to
German law since January 2010, advisors are mandated to document all client advisory meetings
in written form, including the motivation for and duration of the meeting, the advisor’s prod-
uct recommendations, along with a justification for each recommendation. We use this protocol
data and complement it with additional administrative data on client portfolios and transactions.
Moreover, for a subset of clients we can link to data from a survey which contains information on
motivations, financial literacy, and preferences. Further, we commissioned an independent survey
of financial advisors to better understand differences in their perceptions of male and female clients.
Our main administrative data set contains information from around 27,000 advisory meetings that
took place between January 2010 and December 2017. We observe characteristics of the client and
the outcomes of the meetings: For the meeting outcomes, we have characteristics of the product
being recommended (type, risk, fee structure, and fund identifier) as well as information on whether
the client implemented the recommendation. For the client characteristics, among other things we
observe the clients’ gender, wealth, risk tolerance, age and the duration of their relationship with
the bank. From the linked client survey, we observe a test-based measure of financial literacy as
well as motivations for seeking advice and product preferences for a subset of clients.
The evidence we find fully matches our supply-side driven theoretical mechanism; i.e., advisors
have an incentive to tailor more expensive recommendations to clients that appear to have a lower
aptitude. At the same time demand-side differences, like for example, differences in client prefer-
ences, could contribute to the empirically observed patterns. Bank own balanced funds could be
tailored to clients’ preferences for low-maintenance all-in-one products. Instead of being driven by
strategic behavior or preconceptions of advisors, female clients may demand different products (at
2
This use of simple heuristics when judging groups can be motivated by stereotyping as described by
Bordalo, Coffman, Gennaioli, and Shleifer (2016).
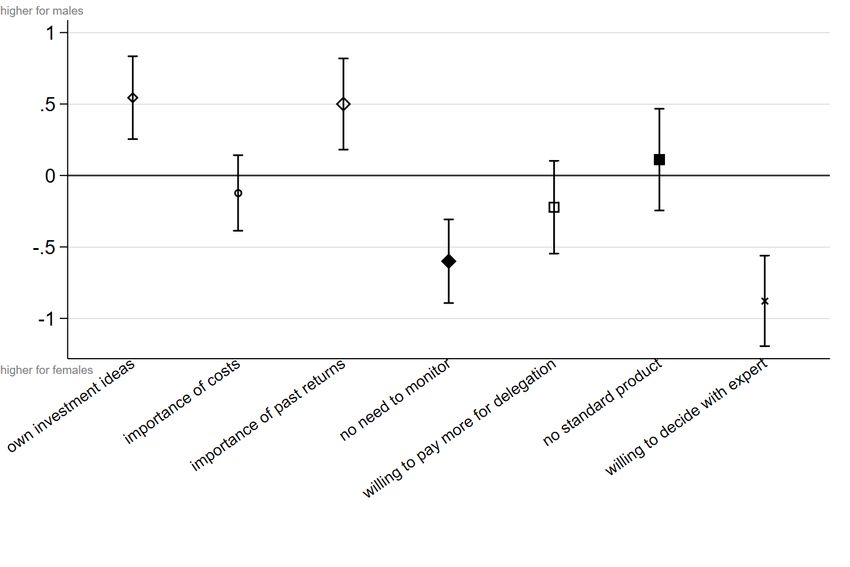
2higher costs) compared to male clients, in return for not having to build and regularly re-balance
their portfolios. In our client survey, a significantly higher share of women states that it is a relief
to delegate financial decisions. In addition, men significantly more often indicate to be looking for a
second opinion and reassurance with regard to their investments. These findings are also reflected
in the responses from our advisor survey: Advisors state that men are more likely to approach
advisors with specific investment ideas, while women are more willing to make joint decisions with
an expert and, in general, dislike having to monitor their portfolio on a regular basis. Taking these
findings into account, balanced funds (and their high fund fees) would not necessarily indicate
poor advice or mis-selling, but would rather imply a catering or “peace of mind” effect in line
with Gennaioli, Shleifer, and Vishny (2015). However, in our administrative bank data we do not
find evidence that women have a higher preference for these specific bank own balanced funds and
actively seek them out. They are also not significantly more likely to follow recommendations for
bank own balanced funds than men. Finally, substantially less expensive balanced funds, which
would fulfill women’s low maintenance requirement are available in the market (and are among the
observed recommended products), but are not recommended to women significantly more often.
However, we can go one step further and examine the premises under which advisors sell bank own
and other products to their clients. For this purpose, we conduct a textual analysis of the meeting
protocols, in which advisors are required by law to provide an explanation for their recommendation.
The main result of this analysis is that advisors appear to tailor the recommendation of these
relatively expensive bank own balanced funds to women’s preferences for hand holding and peace
of mind.
Whether or not the higher recommendation rate of the bank’s own balanced funds can be (at
least partly) explained by women’s stronger preference for delegation, it remains an open question
whether they are aware of the higher fees they pay, compared to funds with the same risk category
and similar returns. To understand the economic relevance of the observed differences in costs,
we perform a simple back of the envelope calculation. The higher fees for the most frequently
recommended bank own balanced fund in our sample (compared to a combination of the average
cost equity and bond funds in our sample) would result in a ten year difference in final wealth of
around 1,455 Euro (3,890 Euro after 20 years) based on a 10,000 Euro initial investment. If we
compare it to a balanced index fund (which also comes with little monitoring effort) the differences
are even more pronounced.
This issue is critical, since we find strong evidence for low understanding of the associated costs
(or cost illiteracy) in our sample in general, and in particular among women. Thus, even though the
evidence suggests that women tend to look for investment opportunities that allow them decision
delegation and an easy solution to their portfolio management, it does not seem to be the case that
the clients who follow these recommendations are aware of the price they pay. Finally, while the
catering effect can explain the recommendations of the bank own funds which carry higher annual
management fees, it is hard to come up with a preference based explanation for the lower likelihood
of rebates being offered to women for given products.
3As a last step, our administrative bank data allows us a further venue into better understanding
the interactions between financial advisors and their clients: the possibility that the advisor’s gender
may also contribute to the observed outcomes. We find that male advisors on average appear to
offer recommendations with a larger equity share and higher category of risk. This is in line with
findings in the literature that clients’ portfolios seem to reflect their advisors’ preferences (Foerster,
Linnainmaa, Melzer, and Previtero, 2017), as men are on average less risk-averse. Moreover, we
are able to show that it is mainly male advisors that engage in differentiating recommendations
across client gender. Specifically, we find that male advisors are more likely to recommend the bank
own funds to female compared to male clients. They on average recommend higher cost products
and offer fewer rebates to women compared to men. No such differences are found among female
advisors. Reflecting this finding, it is only the male advisors in our advisor survey who state that
female clients are more subject to stereotyping compared to men.
We contribute to several strands of literature. First and foremost we contribute to the litera-
ture on financial advice. With regard to costs and benefits of financial advice in general, some
systematic issues have been uncovered. On the one hand, studies comparing do-it-yourself and
advised individual investor portfolios suggest that on average, advisors have a negative impact on
portfolio performance (Hoechle, Ruenzi, Schaub, and Schmid, 2018, 2016; Chalmers and Reuter,
2020; Hackethal, Haliassos, and Jappelli, 2012). Egan, Matvos, and Seru (2019) and Honigsberg,
Hu, and Jackson (2021) document frequent misconduct among US financial advisors with limited
consequences for the offending advisors. On the other hand, advice is also shown to improve finan-
cial planning and to ameliorate investment mistakes.3 While we do not examine the general benefit
of financial advice, we add an additional layer of complexity to the analysis by showing that advice
might have different benefits to clients with different observable and unobservable characteristics.
However, it is important to note that our analysis does not allow us any conclusions on whether
men and especially women should consult advisors in the first place.
Regarding the willingness to pay for advice, a theoretical framework by Gennaioli, Shleifer, and
Vishny (2015) and survey-based evidence from the client perspective (Weber, 2020; Rossi and
Utkus, 2020) show that private households might be willing to pay for other services rather than
returns, namely peace of mind and hand holding, when consulting an advisor.4 In line with this,
we also find that women are more likely to state that, without the help of an advisor, they would
not invest at all. On the cost side, we can confirm previous findings showing that fees are often not
taken into account in clients’ evaluation of advisory services.
Our analysis also contributes to a line of research on gender differences or stereotyping in financial
markets. This literature so far has focused mainly on credit markets. For example, Alesina,
3
Specifically, mistakes such as under-diversification as well as home or local bias (Hoechle, Ruenzi,
Schaub, and Schmid, 2016; Gaudecker, 2015), and the disposition effect (Hoechle, Ruenzi, Schaub, and
Schmid, 2016).
4
In line with the idea that the evaluation of advice has many subjective components and is not based
on the assessment of financial returns only, Stolper and Walter (2018) find, that clients are more willing to
follow advice given by advisors, who are more like them in terms of demographic similarities.
4Lotti, and Mistrulli (2013) find that compared to male business owners, female business owners in
Italy pay higher interest rates conditional on risk characteristics.5 In a recent paper, Brock and
De Haas (2020) show that female loan applicants are significantly more likely to get their approval
only conditional on the presence of a guarantor. In addition, the authors are also able to show
that the effect is concentrated among young, inexperienced, and gender-biased loan officers. We
contribute to this literature by examining gender differences in investment advice to retail clients.
Moreover, we show that in this context stereotyping seems to be more pronounced among male
advisors. Related to this, Bhattacharya, Kumar, Visaria, and Zhao (2020) show in a field study
using trained “auditors” that women are more likely than men to receive recommendations that are
associated with lower diversification (single stocks). In our context, this dimension of the quality of
financial advice is less relevant, since advisors overwhelmingly recommend investment funds (and
not individual stocks) in accordance with European financial market regulations. Instead, we focus
on the costs associated with the recommended products and provide evidence that women receive
recommendations for significantly more expensive products.6
Lastly, on a more general note, the basic mechanism in our theoretical framework is not limited
to the domain of financial advice but applies to many credence goods (Dulleck, Kerschbamer, and
Sutter, 2011). For example, individuals who appear more intimate with the subject of cars should
receive better advice from their mechanics. Other relevant applications include taxi services (see
Balafoutas, Beck, Kerschbamer, and Sutter, 2013), health care (see Gottschalk, Mimra, and Waibel,
2020), or legal matters.
Our findings have considerable welfare implications. The fact that women are more likely to
receive recommendations for more expensive products is worrisome in the light of many gender gaps
documented in economics and finance. To name but a few, women have been found to earn lower
incomes, plan and save less for retirement, accumulate less wealth and invest less in risky assets.
They also have lower financial literacy skills and are less confident in their financial decisions.
Adding to this, we find that women receive higher cost product recommendations by advisors.
This might in the medium and long run exacerbate the gender difference in asset accumulation and
ultimately contribute to lower financial well-being of women compared to men.
2 Data
For our empirical analysis, we make use of three unique data sets. First, we have access to
administrative client-advisor data of a large German bank. This data includes the protocols of
advisory meetings. We are able to match the meeting protocols to clients’ portfolio holdings and
transaction data. Our second data set results from an academic survey of bank clients carried
out by university researchers (solely for research purposes). For a subsample of clients in the
5
This also relates to the literature on ethnic discrimination in credit markets in the US (see Cavalluzzo
and Cavalluzzo (1998) and Blanchflower, Levine, and Zimmerman (2003) for reviews).
6
Grinblatt, Ikäheimo, Keloharju, and Knüpfer (2016) argue that variations in risk-adjusted returns on
mutual fund portfolios result largely from differences in fees.
5administrative data set, we can match survey respondents to advisory clients. Third, we conducted
an additional online survey of bank advisors in Germany – independent of the previous data –
which was carried out by the research company YouGov, a survey agency which is widely used in
economics and finance research.
2.1 Bank Data
2.1.1 Administrative Data
We use data on private clients receiving investment recommendations from financial advisors
employed by a large German bank operating a nationwide branch network. Our main source
of information are advisory minutes that provide detailed information on meetings of clients with
financial advisors. Since January 2010, advisors are mandated by law to document all client advisory
meetings in written form, including the motivation for and duration of the meeting, as well as the
advisor’s final product recommendations, along with a justification for each recommendation. Our
data covers 26,747 advisory meetings between 13,239 retail clients and 4,604 advisors. The meetings
took place between January 2010 and December 2017. We are able to complement this rich source
of information with data on clients’ security transactions and demographic information, which are
also taken from the bank’s records.
In Germany, as in many other European countries such as Sweden, Italy, and France, financial
advice to retail investors is primarily provided by banks. This marks an important difference to
the US, where advice to retail investors is often provided by independent financial advisors.7 Most
German households seek out advice from their house bank in the context of financial decisions.8
When opening an account with the bank providing our data, clients are assigned a designated
advisor. In the retail segment, the client-advisor match is based on branch location, but it is
otherwise independent of customer characteristics. Bank customers either conduct transactions
unassisted or consult with their advisor. Complete delegation of financial decisions is rare in
Germany and mostly limited to the wealthiest customers who are not part of our data set. In the
context that we study, there are no direct fees for seeking advice. Bank customers pay for financial
advice indirectly through product fees and commissions, that are (partly) channeled to the bank.
The advisors in our sample are full-time employees of the bank who have completed a three-year
vocational training. They are paid a fixed wage in accordance with the collective wage agreement
of the banking industry as well as a variable component. The variable component (up to 10% of
total salary) is typically a function of team or branch performance, acquisition of new client assets,
and surveyed client satisfaction. While advisors are not individually compensated for their sales
performance, career concerns provide indirect sales incentives, with the bank benefiting more from
sales of some types of products (Hoechle, Ruenzi, Schaub, and Schmid, 2018).
7
Similarly, the United Kingdom is an exception among European countries with independent advisors
playing an important role.
8
A recent survey indicates that 69% of households in Germany consult with a financial advisor when
making financial decisions (Statista, 2020).
6Clients and advisors. All clients in our sample interact with a bank advisor at least once over
the sample period. On average, both female and male clients consult the bank for advice about
twice during our sample period. Panel A of Figure A1 in the appendix shows the distribution of
the number of meetings by client. For about one quarter of the clients we observe only one advisory
meeting in our sample period. Around 23% of the clients are observed twice, and about half of
the sample is observed three or more times within the sample period. Panel B of Figure A1 shows
the distribution of protocols over calendar months. The figure reveals that that there are seasonal
patterns in the distribution of advisory meetings, which we will account for in our analyses by
controlling for time fixed effects.
Summary statistics on the overall sample as well as split by gender are reported in Table 1. In
Panel A we show statistics at the client level, in Panel B we report statistics at the recommendation
and meeting level. Slightly less than half (46 percent) of the clients in the sample are female. The
median client is 65 years old or older. Clients in our sample are on average risk-averse, with the
majority willing to take only moderate financial risk (55% are in the second lowest category on a
1-4 scale). In line with findings in the literature, male clients show a higher risk tolerance (47%
are in the moderate risk category) compared to female clients (61% are in the moderate category).
The average financial wealth in our sample is around EUR 108,000 (median EUR 67,501).
The majority of client-advisory meetings takes place in person: 86% for female, 84% for male
clients. In only a small fraction of cases advice is received over the phone. About three-quarters of
the meetings take 30 minutes or longer (see Panel B in Table 1).
Overall we observe recommendations by 4,604 different advisors, who are approximately balanced
by gender (48 percent are male). However, there is wide variation in the number of observations
per advisor. This is due to the fact that our sample is a draw across bank clients, rather than
advisors.9 Among those clients for whom we observe more than one meeting, 20 percent of the
follow-up meetings are with a new advisor. Advisor changes in the retail segment are not uncommon
and are mostly driven by fluctuations in the career position or the location of bank employees.
Product recommendations. As a result of regulatory tightening and ensuing compliance con-
cerns, large banks have standardized financial advice services, especially in the retail client segment.
Advisors at the bank are supposed to pick recommendations from a pre-selected list of actively man-
aged mutual funds, covering different asset classes and risk categories. Individual stocks, individual
bonds, certificates, index funds, or exchange traded funds (ETFs) can also be recommended and
discussed with the clients. In principle the bank maintains an open fund architecture, which means
that advisors have a bank’s own funds as well as outside options in their menu. As a result of
standardization, the 10 products that are recommended most often account for 40% of all purchase
recommendations in our sample (see Figure A2 in the Appendix). All of these top 10 products
are actively managed mutual funds, 7 of which are bank own products. Overall the bank’s own
balanced fund products also account for the lion’s share of fund recommendations to retail clients.
9
We observe exactly one meeting for 27 percent of advisors, for 30 percent of the advisors we observe
more than five meetings.
7These products are multi-asset funds that invest both in stocks and bonds with different allocations
and are designed to provide an all-in-one portfolio solution to retail clients.10
Figure A3 in the Appendix shows the distribution of recommendations across product types by
gender. It closely mirrors the precepts of the bank’s standardized advisory approach. Overall,
funds are the most recommended product category to both male and female clients. However,
female clients receive recommendations for funds more frequently than men (67% for female versus
64% for male clients). The frequency of single bond recommendations is comparable (11% for
female versus 10% for male clients). Single stocks are rarely recommended, and if so, they are
more often recommended to male than to female clients (4% versus 2% of all recommendations in
our sample). Given their predominance, the main focus of our analyses is on recommendations to
invest in mutual funds.
Quality of recommendations – product costs. In general, there are two aspects of the
quality of advisor recommendations, (1) risk adequacy and (2) fees. The Markets in Financial
Instruments Directive (MiFID) of the European Parliament and the European Council (2004 and
2006) stresses risk adequacy, requiring investment recommendations to match investor risk prefer-
ences.11 Mullainathan, Noeth, and Schoar (2012) consider retail financial advice as high quality if
it provides the clients with a broadly diversified, but low-cost portfolio. The recommended mutual
funds that we observe are diversified products. We therefore assess the fees of the fund recommen-
dations (for otherwise comparable funds) as the main criterion for recommendation quality. As
opposed to returns, which at least in part result from luck, fund fees can directly be influenced by
the advisor.
Fees for mutual fund purchases typically have two components: initial up-front fees (loads) paid
upon purchase of a mutual fund, and recurring fees summarized by the annual expense ratio paid
annually in proportion to the amount invested. Funds differ considerably with regard to their
annual expense ratios, as will be discussed further in the next section. The fund’s annual expense
ratio applies equally to all investors and is payed to the firm managing the fund. In case of bank
own funds, a significant fraction of recurring fees accrues to the bank. Hoechle, Ruenzi, Schaub,
and Schmid (2018) study a comparable bank setting in Switzerland and show that trades in bank
own mutual funds are the most profitable for the bank in the context of retail financial advice. We
observe characteristics of the recommended funds including their annual management fees.
Upfront fees paid upon fund purchase are directly collected by the bank. While the annual
expense ratios apply to all clients purchasing the same fund, upfront loads paid upon purchase can
be adjusted to the individual client. In particular, advisors can offer discretionary rebates (up to
100 percent) on the upfront charge. From the advisory minutes, we observe whether the advisor
granted a partial or full rebate on the upfront load of a recommended fund. About 26% of all fund
10
We exclude recommendations for a topic specific in-house fund from our data. The distribution of this
fund was accompanied by comprehensive marketing campaigns, which we cannot control for.
11
Investment firms are required to obtain “information as is necessary for the firm to understand the
essential facts about the customer” (Article 35, 1) and to elicit the customer’s “preferences regarding risk
taking, his risk profile, and the purpose of the investment” (Article 35, 4).
8recommendations come with a rebate on the up front load (see Panel B in Table 1). Figure A4 in
the Appendix shows that there is considerable variation at the level of individual funds with regard
to whether a rebate was granted to clients or not.12 The graph shows, that rebates being granted
is not a feature of certain specific funds. There are no funds for which a rebate is always granted,
about 18% of the recommended funds never come with a rebate. For slightly more than 30% of the
recommended funds, a rebate on the upfront load is offered for at least 30% of the sales observed
in the data.
Adherence to advisor recommendations As an outcome of the advisory meeting, we can
observe if recommendations are implemented afterwards by the client. We define a recommendation
as implemented, if the client buys the recommended security within 30 days after the meeting.
Overall, 62% of all recommendations are followed by the clients within 30 days (see Panel B in
Table 1).
2.1.2 Client Survey Data
In an independent research project, a random sample of all clients of the bank was invited to
participate in academic surveys, which are conducted to gain deeper insights into the decision
making process of private households. The resulting data is only available to researchers (not to
the bank or the advisors). We make use of the responses of those clients that can be matched to
our protocol data, and refer to this source of information as the client survey. Overall, we are able
to match survey and protocol data for up to 485 clients (1,342 recommendations), depending on
the survey questions under consideration.
In the surveys, clients for example answer questions regarding the motivation for seeking advice
and general attitudes toward investment and financial markets. Additionally different measures of
test-based financial literacy and knowledge with regard to fund investing were collected. All clients
in the client survey answered six questions related to financial aptitude: The financial literacy
questions entail the Big Three financial literacy questions by Lusardi and Mitchell (2014), and
additional questions about the riskiness of different savings products and institutional knowledge
about investment funds. We group the literacy questions into four general questions of financial
literacy and three questions of fund specific knowledge. The distribution of the correct answers
to the financial literacy and the fund literacy questions is shown in Figure A5 in the Appendix.
Since two of the fund literacy questions are specifically concerned with the understanding of funds’
costs we are also using a two question cost literacy indicator in some of our analyses in Section
5. Moreover, the surveys also assessed clients agreement to the statement “The stock market is a
sealed book to me” (mean of 3.3 on a 1-7 scale). The wording of all financial literacy questions can
be found in Tables B1 and B2 in the Appendix.
12
For the graph, we consider only funds that are recommended for at least 50 times.
92.2 Advisor Survey
From the client survey, we are able to derive some insights into the motivations of individuals
seeking financial advice. Mirroring this, we are equally interested in possible preconceptions and
subjective assessments on the side of advisors. To gain insights into these channels, we designed,
commissioned and ran a survey with the help of the research company YouGov that targeted
individuals with experience working as financial advisors in Germany (advisor survey). Note that
the advisor survey was not run among the bank’s advisors.
The survey was run in July 2020 and participants were compensated according to an internal
reward system for their participation. Overall, we collected data from 103 active financial advisors
working either for a bank or independently.13 About one third of the surveyed advisors are female
and 58% are older than 45 years. Sample statistics and further information on the questions are
reported in Appendix D.
3 Gender Differences in Product Recommendations and
Fees
The key question to be answered in this section is whether there are significant differences between
recommendations to male and female clients, in particular with regard to the costs of products. To
be able to make meaningful cost comparisons, we need to take the nature of the products being
recommended into careful account: The costs (e.g., expense ratios) of funds are product specific,
and generally higher-risk products are associated with higher costs. So as a first step, we need
to better understand the products being recommended and whether there are observable gender
differences in this regard. First, we study the types of products that are recommended as well as the
associated levels of risk. In the second step, we focus on the cost dimension of the recommendations,
and analyze whether there are systematic differences in the costs of funds recommended to male vs.
female clients controlling for product specifics. Finally, we test whether the effective costs incurred
by clients differ at the individual fund level.
3.1 Fund Type and Risk Level
In line with the recommendations of the MiFID, the main product category featured in the
recommendations are funds. Figure 1 presents the distribution of fund recommendations by fund
type and gender. It is immediately apparent that female clients are substantially more likely to
receive recommendations for one of the bank’s own balanced funds (71% for female versus 60% for
male clients). This category of funds will be of particular interest below. Balanced funds which are
not under the bank’s own management are recommended to men slightly more often (6% to men
13
We excluded data from insurance advisors since their expertise is for different types of products. Results
are robust to the inclusion of respondents, who do no longer work as financial advisors, but have worked as
an advisor in the past and which were also excluded from the sample.
10vs. 4% to women). Male clients are also significantly more likely to get recommendations for pure
equity funds (22% for male versus 14% for female clients). Bond funds are recommended to men
and women with similar probability (6% for female versus 5% for male clients). Next, we consider
how these differences feed into the risk of the products that are recommended to male and female
clients.
The resulting differences in risk levels become apparent from Panel A of Figure 2. Funds are
assigned into seven risk classes depending on the average volatility over the last five years, in
accordance with MiFID. Funds in category 1 exhibit the lowest risk level, category 7 implies high
risk. The figure shows the distribution of fund recommendations over the seven fund risk categories
differentiated by gender. Female clients are more likely to receive recommendations for lower-risk
products (i.e., there is more mass on lower risk categories for women than for men).
These findings could be due the fact that a lower risk-tolerance is observed in women than in men
on average, so the differences in recommendations could simply be driven by clients’ preferences.
To better understand these channels, next, we analyze in detail what drives the risk level of funds
that are recommended in a multi-variate regression framework.
Empirical specification. Our aim is to obtain a detailed understanding of the relationships
between product-risk, financial advice and client gender. Therefore, we apply three different vari-
ables to measure different risk dimensions of a fund being recommended. First, equity is a dummy
equal to one if a recommended fund is a pure equity fund. This applies to 18 percent of all fund
recommendations. Second, equity share is the share of equity in a fund’s holdings. The equity
share varies between 0 percent (pure bond and money market funds) and 100 percent (pure equity
funds). Equity shares of balanced funds take intermediate values, depending on their investment
strategy.14 The average equity share over all fund recommendations is 48 percent. Third, we use
the fund risk category, ranging between 1 and 7. The average fund that is recommended in our
sample falls into category 4.
Does the finding hold that advisors recommend different funds and levels of risk to women than
to men, even when controlling for client risk preferences and a broad set of personal characteristics
and the circumstances of the meeting? We run linear regressions using the three measures of fund
risk as the dependent variable. The unit of observation is a single recommendation resulting from
one of client i’s advisory meetings. We estimate linear regression models of the form:
yij = β0 + β1 f emalei + β2 characteristicsi + β3 meetingij + µt time + µa advisorij + ij (1)
The dependent variable y is one of our three risk measures for the recommended fund, for
client i in meeting j. The variable f emale is an indicator equal to one if the client is female.
characteristicsi captures the client’s personal and financial characteristics. The perhaps most rel-
evant control measures the personal risk tolerance of the client (on a 1-4 scale from very low to
14
Equity allocations of funds are taken from the Morning star data base.
11very high). The variable is a legally binding (MiFID) assessment of the client’s risk preferences,
and therefore a mandatory part of the protocols. Further client characteristics are the log financial
wealth with the bank, dummies for age groups, and occupational and educational status (employed,
manager, and academic (PhD)). We also include variables to control for the circumstances of the
meeting (meetingij ). These are indicators for whether advice was received in person rather than
over the phone and whether the meeting took longer than 30 minutes. We also control for the
length of the relationship the client has with the bank in years. All regressions include year-times-
month fixed effects. Following Foerster, Linnainmaa, Melzer, and Previtero (2017), we also include
advisor fixed effects µa to control for advisor heterogeneity. Standard errors are clustered at the
client level.
Results. Table 2 presents the results of the regression for the different dependent variables
(Columns 1-3). Columns 4 and 5 represent robustness checks, in which we restrict the sample to
fund recommendations with an equity share greater than 0 (therefore excluding recommendations
for bond and money market funds). For each dependent variable and each specification, we find
that women receive less risky recommendations, even if risk preferences (and a wide range of
other characteristics) are explicitly controlled for. Women are on average 2pp less likely to receive
an equity fund recommendation (Column 1) than men with identical measures of risk attitude.
Compared to an average of 18% equity fund recommendations, this translates to a substantial 11%
lower likelihood to receive an equity fund recommendation for women. Column 2 shows that funds
recommended to women have a 1.59pp lower equity share compared to men, controlling for risk
tolerance. Limiting the sample to only recommendations with a positive equity share, the observed
difference is even larger, at 2.33pp (Column 4). Compared to the average equity allocations, this
corresponds to a 3.4% to 5.0% lower equity share – again, note that this is based on the same risk
preferences and controlling for a wide range of other characteristics. Finally, the risk categories of
recommended funds are significantly lower for women than for men (Columns 3 and 5), which is
in line with the descriptive results from Figure 2. For each of the specifications, the measure of
the client’s risk tolerance is highly significant and has the expected effect. Clients with higher risk
tolerance are more likely to receive recommendations for equity investments.15 These results show
that, taking into account and controlling for client risk preferences, advisors tend to recommend less
risky products to female clients. This result is highly relevant in and of itself, since it documents
that there are significant differences in financial advice offered to male and female clients.
There are further significant differences in advice related to categories of products. A product
category that is of particular interest is balanced funds managed by the bank employing the advisor.
From the perspective of the bank – and the advisor via career concerns or incentives – sales in this
type of product are particularly profitable (see Hoechle, Ruenzi, Schaub, and Schmid, 2018). In
15
Nevertheless, it is possible that the available risk assessment on a 4-point scale does not entirely reflect
clients’ risk preferences. For a subsample of clients who participated in the survey we additionally have a
self-assessed survey measure of risk preferences on a 7-point scale. When we include this measure instead
of the risk measure reported in the protocol, our findings remain unchanged with regard to sign and size of
coefficients.
12Column (6) of Table 2, we present the results of a regression in which the dependent variable is a
dummy indicating a recommendation for one of the bank’s own balanced funds. Women are 3 pp
more likely to receive a recommendation for one of the bank’s own products compared to men (an
increase of 4.6% relative to the average share of recommendations of bank own products of around
65%). For this type of product, we do not find a monotone relationship with risk preferences, it is
more likely to be recommended for clients with intermediate levels of risk tolerance.
Therefore, women receive systematically different recommendations both regarding the type and
the risk level of products. Next, though, we address the main question that we are interested in:
The costs and fees associated with the observed recommendations.
3.2 Product Fees
In the next set of analyses we look at differences in fees across products recommended to men
and women. As a starting point, we consider the annual expense ratios. Simply comparing average
expense ratios of the funds recommended to male and female clients at first glance results in a
slightly higher fee for female clients. For them, the average annual expense ratio is 1.90 percent,
while it is 1.87 for male clients (p-value of paired t-test is 0.00). Still, this comparison fails to take
a number of relevant factors into account. In particular, fees are generally higher for more risky
funds (Gennaioli, Shleifer, and Vishny, 2015), and they increase in the level of active management
(Linnainmaa, Melzer, and Previtero, 2020). The evidence in our data reflects these findings. Panel
B of Figure 2 shows the relationship between total expense ratios and fund risk; higher risk cate-
gories are generally associated with higher costs, but the fees for pure equity funds are on average
lower compared to actively managed balanced funds with a high equity share. Given our previous
result that male clients receive recommendations with significantly higher levels of risk and equity
shares, the observation that average fund fees are slightly higher for female clients therefore is quite
puzzling. In order to make sense of this puzzle, we need to examine the costs of recommendations
while taking product risk into account.
In the following, we study cost differences in recommendations using two different dependent
variables. The first is the annual expense ratio associated with a recommendation, mirroring the
discussion above. Note that this variable involves a potential endogeneity issue when controlling for
product risk, which is related to our previous analyses: The risk category of products recommended
to clients also depends on their gender, as shown above. Simply controlling for this (endogenous)
risk category in a regression that also includes gender might introduce a dependence in the related
error terms. To address this issue, we construct a second dependent variable inspired by Linnain-
maa, Melzer, and Previtero (2020): a risk category specific fee ranking. Prior to constructing this
variable, it is important to note that there is substantial variation in the annual expense ratios
within risk categories, as Figure 2 Panel B shows. In the lowest risk category 1, we observe a
difference of 70 basis points between funds with the lowest fees and those with the highest fees. In
the highest risk category 7 this difference is 197 basis points. The highest spreads (around 300 basis
points) as well as the costliest individual funds are observed in the ”intermediate” risk categories
133 through 5. In fact, the spreads within these categories by far exceed the differences in average
costs observed across categories. While the average costs of funds do depend on the risk categories,
for an individual fund the relative ranking within the category is therefore more relevant.
To build a risk category specific fee ranking, we sort funds into quintiles according to their an-
nual expense ratios for each fund risk category (from 1 to 7). This means that within each risk
category we measure the 20% cheapest (lowest quintile) up to the 20% most expensive (highest
quintile) products among those that were recommended. The average expense quintile of the rec-
ommended products in our sample is 4.10 (3.98 for male and 4.25 for female clients), i.e., more
expensive products are generally recommended more often; about 70% of the observed fund rec-
ommendations are ranked in the highest quintile. Figure 3 shows the respective distributions of
fund recommendations by fee quintile for male and female clients. For women there is substantially
more mass in the most expensive quintile. This implies that female clients on average receive more
expensive recommendations within a given risk category. To rule out that this is driven by other
observable factors, we examine the relationship between gender and the fund’s fees more closely in
a multivariate framework.
Empirical specification. We use OLS regression models of the form:
yij = β0 + β1 f emalei + β2 characteristicsi + β3 meetingij + µt time + µa advisorj + ij (2)
The two dependent variables y are the annual expense ratio and the fee quintile of the fund
recommended to client i during the meeting j. Our main independent variable, f emale, and the
other control variables are the same as in the previous regressions. We again include month-times-
year and advisor fixed effects.
Results. Column (1) of Table 3 reports results of a regression on annual expense ratios controlling
for client characteristics, advisor, and time fixed effects, but not the product risk categories. The
gender effect is insignificant, which corresponds to the introductory descriptive cost comparison.
On average, if we ignore the risk characteristics of products, recommendations to men and women
are associated with similar costs. This changes fundamentally, when we explicitly control for the
risk categories of recommended products in column (2). Taking the risk of the product into account,
recommendations to women are associated with a fee that is significantly higher. This finding also
holds for the approach using fee quintiles (column 4). Recommendations to women involve a fee
rank that is 0.14 higher (more expensive) than those to men (compared to an average fee rank of
4.10). On average advisors recommend significantly more expensive funds (funds in a higher fee
quintile) to women within given risk categories.
This opens up the question whether we are able to explain these differences in management fees for
given risk levels across genders. The results from the previous section offer a potential explanation;
there we have shown that women are more likely to receive recommendations for balanced funds,
in particular those managed by the advisor’s bank. These bank owned funds have a high degree
of active management, and tend to charge higher fees compared to other funds in the same risk
category. In Panel B of Figure 3 we show the average annual expense ratio by fund risk category
14and differentiate between external funds on the left and funds under the bank’s own management
on the right. In each risk category the bank managed funds are more expensive than comparable
funds.
Are the higher management fees for women associated with the higher prevalence of bank own
funds being recommended to them? In Column (3) and (5) of Table 3, we control for whether the
recommendation involves one of the bank’s own balanced funds. We find that bank own funds shift
fund fees substantially upwards by more than one percentage point (column 3) or two fee quintiles
(column 5), on average. When we control for bank own balanced funds, the gender dummies no
longer indicate that women pay more for products. In fact, for the annual expense ratios, the female
indicator switches its sign and turns significantly negative (column 3), while it becomes insignificant
(and very close to 0) in the fee rank specification (column 5). While women on average receive more
expensive product recommendations than men for given product risk levels (Columns 2 and 4), this
difference can therefore be explained by the fact that they more often receive recommendations for
the bank’s own managed funds that are associated with particularly high product fees.
So far, the differences we have observed are driven by the fact that different (types of) products
are recommended to men and women. In the next step, we focus on a cost dimension that allows for
differences in cost for a given product. In addition to management fees, funds carry sales fees – the
so called upfront load. These are one-time costs to the investor, charged upon purchase of the fund.
While a fund’s annual management fee is fixed, the advisor has discretion to individually reduce
upfront loads. This fact is neither advertised nor typically known by clients. In the context of these
rebates, the costs for the very same financial product suggested by advisors can potentially differ
by clients. Note that we observe rebates only for recommendations that were actually implemented
by clients. We observe rebates on the upfront load for roughly one quarter of all fund purchases
in our sample. In Figure 4, we show for which share of purchases rebates were offered to male and
female clients across different risk categories. For five out of the seven risk categories, the share of
purchases with a rebate applied is higher for male clients (the exceptions are the lowest category 1,
in which rebates barely feature at all, and category 3, in which there is almost no difference in the
rates at which rebates were applied across genders). Next, we examine whether these differences
persist when controlling for client characteristics and other factors in a multivariate regression
framework.
Empirical strategy. The dependent variable of our regressions is an indicator equal to one if
the client has received a rebate on the upfront load. In order to test whether female clients face
higher costs than men for the same financial products we include fund fixed effects (ISIN fixed
effects) into the regression. Otherwise, the structure of the model is unchanged from the previous
set of regressions.
Results. The results in Table 4 reveal that female clients are significantly less likely to receive
a rebate when they purchase funds. The observed difference of 2pp translates into a 8.4% lower
probability for female clients to get a rebate on a fund load compared to men. The result is robust
to introducing a wide range of additional controls. In particular, higher value investments are
15associated with a significantly higher probability of receiving a rebate. Since rebates matter more
for short term investments, we also control for the investment horizon in Column (3) and the results
stay the same. In Column (4), we restrict the sample to funds (at the level of ISIN codes) that
are recommended at least 50 times in our sample. Again, results remain stable. As a last test,
we exclude bank own funds from the regression to show that the result is not driven by bank own
balanced funds potentially being associated with a different probability or channel of rebates. The
effect remains in the same order of magnitude and highly significant (Column 5).
Note that in all regressions including ISIN-level fixed effects (i.e., Colums 2 through 5) the
differences between men and women are only identified through differences in upfront fees paid for
the same product offered by the same advisor to different clients. This implies that female clients
are in fact significantly less likely to receive a rebate on the fund load for any given product.
To summarize, we find first that product recommendations by financial advisors in our sample
differ significantly between male and female clients who are otherwise comparable according to
a wide range of characteristics including individual risk preferences. Women receive significantly
fewer recommendations to invest in pure equity funds and are recommended lower equity shares in
their investment. Beyond this, women are significantly more likely to receive recommendations for
the bank’s own balanced funds, which has further important ramifications.
Second, we show that there are systematic differences in the costs of products that are recom-
mended to male vs. female clients. Within given fund risk categories, advisors on average suggest
funds with higher fees to women than to men. This effect can be explained by the fact that the
bank’s own balanced funds are more expensive compared to other funds with the same risk level
recommended by advisors. But not all cost differences that we observed are due to different prod-
ucts being recommended. To the contrary, women are significantly less likely to receive rebates on
the upfront load of any given product. This fact cannot be explained by a (hypothetical) higher
willingness to pay for characteristics of the (expensive) bank own funds.
4 What Explains Differences in Product Recommen-
dations and Costs?
In the previous section, we documented that women receive significantly different recommenda-
tions from financial advisors than men, both with regard to types of products and costs. We showed
that these results are not purely driven by factors such as (gender) differences in risk preferences,
differences in the wealth held at the bank or the value of recommendations. These observations
raise the question how to explain the systematic differences that we observe.
In principle, these differences could on the one hand be caused by structures on the “supply-
side” of financial advice, especially strategic behavior by or preconceptions of advisors. On the
other hand, explanations might focus on the “demand-side”, in particular female clients demanding
different products (at higher costs) compared to male clients, for example due to differences in
16You can also read