The European venture capital landscape: an EIF perspective - Volume VI: The impact of VC on the exit and innovation outcomes of EIF-backed start-ups
←
→
Page content transcription
If your browser does not render page correctly, please read the page content below

EIF Research & Market Analysis

                                 Working Paper 2021/70

        The European venture
           capital landscape:
            an EIF perspective
                                Volume VI:
          The impact of VC on the exit and
innovation outcomes of EIF-backed start-ups

                                         Elitsa Pavlova
Simone Signore 
Elitsa Pavlova is Research Assistant in EIF’s Research & Market Analysis
                      division.

                      Contact: e.pavlova@eif.org
                      Tel.: +352 2485 81 945

                      Simone Signore is Senior Research Officer in EIF’s Research & Market Analysis
                      division.

                      Contact: s.signore@eif.org
                      Tel.: +352 2485 81 636

Editor
Helmut Kraemer-Eis,
Head of EIF’s Research & Market Analysis, Chief Economist

Contact:
European Investment Fund
37B, avenue J.F. Kennedy, L-2968 Luxembourg
Tel.: +352 248581 394
http://www.eif.org/news_centre/research/index.htm

                                                                                       Scan above to
                                                                                       obtain a PDF

Luxembourg, February 2021                                                              version of this
                                                                                       working paper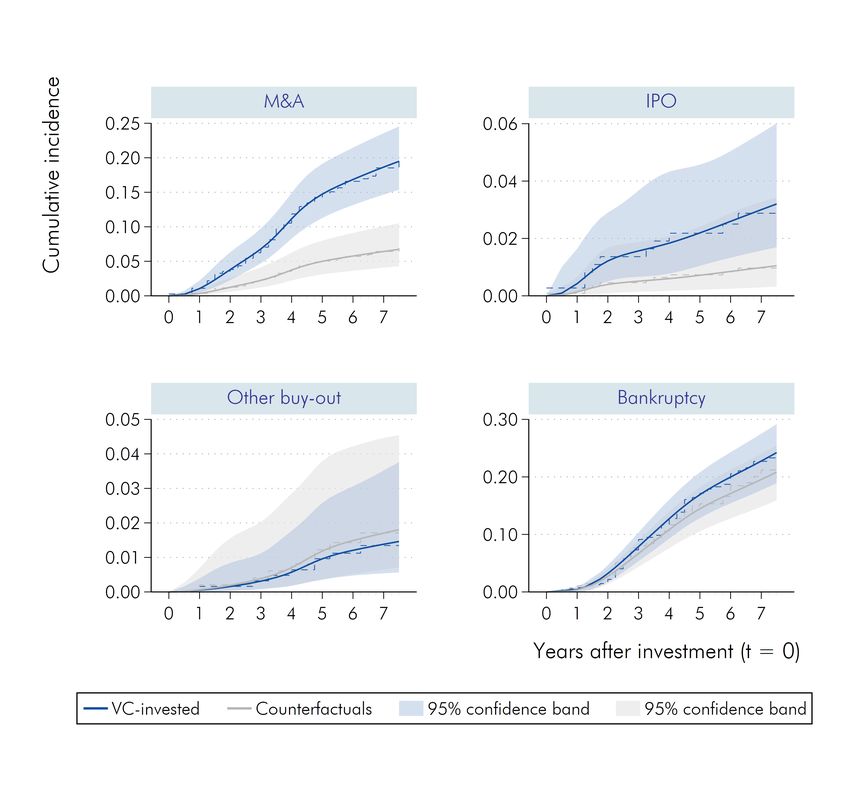
Disclaimer:

This Working Paper should not be referred to as representing the views of the European Investment Fund (EIF)
or of the European Investment Bank Group (EIB Group). Any views expressed herein, including interpretation(s)
of regulations, reflect the current views of the author(s), which do not necessarily correspond to the views of the
EIF or of the EIB Group. Views expressed herein may differ from views set out in other documents, including
similar research papers, published by the EIF or by the EIB Group. Contents of this Working Paper, including
views expressed, are current at the date of publication set out above, and may change without notice. No
representation or warranty, express or implied, is or will be made and no liability or responsibility is or will be
accepted by the EIF or by the EIB Group in respect of the accuracy or completeness of the information contained
herein and any such liability is expressly disclaimed. Nothing in this Working Paper constitutes investment, legal,
or tax advice, nor shall be relied upon as such advice. Specific professional advice should always be sought
separately before taking any action based on this Working Paper. Reproduction, publication and reprint are
subject to prior written authorisation.
This page intentionally left blank
Abstract†

    We use competing risks methods to investigate the causal link between venture capital (VC) invest-
    ments supported by the EIF and the exit prospects and patenting activity of young and innovative firms.
    Using a novel dataset covering European start-ups receiving VC financing in the years 2007 to 2014,
    we generate a counterfactual group of non-VC-backed young and innovative firms via a combina-
    tion of exact and propensity score matching. To offset the limited set of observables allowed by our
    data, we introduce novel measures based on machine learning, network theory, and satellite imagery
    analysis to estimate treatment propensity. Our estimates indicate that start-ups receiving EIF VC ex-
    perienced a significant threefold increase in their likelihood to exit via M&A. We find a similarly large
    effect in the case of IPO, albeit only weakly significant. Moreover, we find that EIF VC contributed to a
    13 percentage points higher incidence in patenting activity during the five years following the invest-
    ment date. Overall, our work provides meaningful evidence towards the positive effects of EIF’s VC
    activity on the exit prospects and innovative capacity of young and innovative businesses in Europe.

    Keywords: EIF; venture capital; public intervention; exit strategy; innovation; start-ups; machine learn-
    ing; geospatial analysis; network theory

    JEL codes: G24, G34, M13, O32, O38

†
    This paper benefited from the comments and input of many EIF colleagues, for which we are very grateful.
    In primis, we would like to acknowledge the invaluable help of our Research & Market Analysis colleagues
    and in particular, Antonia Botsari and Andrea Crisanti. We are also thankful to Gabriele Todesca and Paolo
    Magnani for the useful comments. Moreover, we would like to express our gratitude to Julien Krantz, Invest
    Europe’s Research Director, for the fruitful collaboration and advice. Last but not least, we are grateful
    to prof. Anita Quas, from the University of Milan, to Giuseppina Testa, from the European Commission’s
    Joint Research Centre as well as to Alexander Montag, from Oxford Saïd Business School, for their helpful
    feedback. All errors are attributable to the authors.

                                                       V
Non-technical Summary

This study constitutes the sixth volume of the working paper series entitled ”The European venture
capital landscape: an EIF perspective”. The series aims at assessing how the EIF’s VC activity affected
beneficiary start-up companies and contributes to the broader theme of government intervention in
the field of venture capital (VC). This volume estimates the causal effects of VC investments supported
by the EIF on the exit prospects and innovative capacity of start-ups. Accordingly, this work compares
the exit outcomes and patenting activity of 782 early stage companies supported by the EIF in the
years 2007 to 2014 — the treatment group — against a control group of non-VC-backed start-ups.
Control start-ups are intended to mimic the trajectory of treated firms had they not received VC. This
paper’s empirical approach is based on a previous work in the series (Pavlova and Signore, 2019).

Constructing an appropriate control group for VC-backed firms entails several challenges. Our pre-
vious work addressed these by mapping the entire set of European VC-invested start-ups in the years
2007 to 2014. The exercise was enabled by our partnership with Invest Europe, the association rep-
resenting Europe’s Venture Capital and Private Equity industry. Invest Europe’s data, sourced directly
from affiliated VC firms, provide an unrivalled coverage of the European VC ecosystem. We further
rely on Bureau Van Dijk’s Zephyr and Orbis databases to retrieve exit outcomes and patenting data
respectively. By combining Invest Europe’s and Bureau Van Dijk’s data, we create a novel dataset
tracking all European start-ups backed by VC in 2007–2014 (see Crisanti et al., 2019 for details).

We estimate the causal effects of VC investments supported by the EIF using Rubin’s Causal Model
(Rubin, 1974), a standard tool in the econometric literature. A central assumption of Rubin’s frame-
work is the correct identification of the assignment mechanism, i.e. the process that determines VC
financing. To this end, in Pavlova and Signore (2019), we carried out an extensive review of the liter-
ature to build a comprehensive model of VC contracting. However, given that our data sources do
not cater for the specific needs of the VC industry, we are constrained in the choice of drivers of VC
financing that we can actually observe. Against this backdrop, in our previous work we brought our
model to the data by introducing measures based on machine learning, network theory and satellite
imagery analysis, some of which were original to the VC literature.

In this work, we combine the above-mentioned metrics with multiple other predictors of VC financing
to construct our estimator, based on exact and propensity score matching. Given that a successful
exit outcome depends both on the type of exit route and the timing of the exit decision, we resort
to survival/duration models to appropriately describe the characteristics of our data. Specifically, we
use competing risks analysis, which provides a model for time until a certain exit event. Competing
risks analysis measures the occurrence over time of exit events that are mutually exclusive.

Our results confirm the positive effects of EIF-supported VC investments on the probability that start-
ups experience a favourable exit outcome. We find that EIF VC-invested start-ups were about three
times more likely to participate in an M&A deal than their non-VC invested counterfactuals. In absolute
terms, this entails a 10.3 percentage points (pp henceforth) higher probability of M&A for VC-backed
start-ups, five and a half years after the investment date. EIF VC-invested start-ups were also about

                                                  VI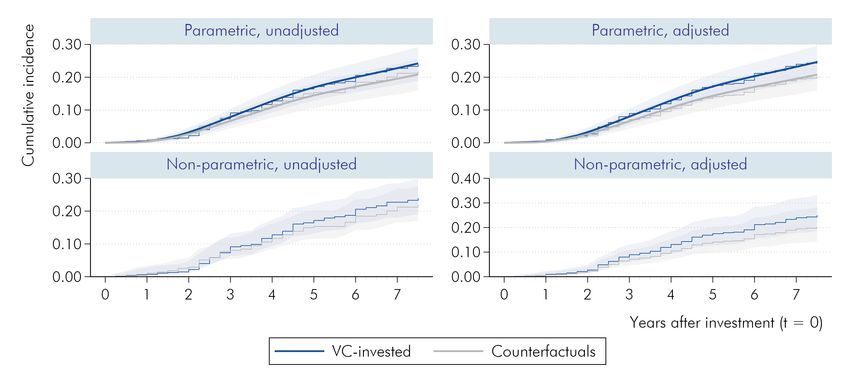
three times more likely to experience an IPO compared to their counterfactuals — entailing a 1.7 pp
higher IPO rate by the fifth post-investment year. However, due to the relatively infrequent occurrence
of IPOs in our sample, this result is only weakly significant. We do not observe significant effects of
EIF VC on bankruptcy, nor on other forms of buy-outs, though this might be due in part to the low
statistical power of some of our tests.

Exploiting M&A as the predominant exit outcome for EIF VC-invested start-ups, we set-up additional
regressions that distinguish between different types of M&A deals, i.e. horizontal/vertical integrations
or diversifications, or national/international M&A deals (based on the headquarters’ location of start-
ups and buyers). We find that EIF VC had a strong and significant effect on the likelihood to experience
both a horizontal and vertical integration, with a threefold and sixfold increase in the probability of
each M&A outcome respectively. By contrast, the effect on diversifications was not apparent. We
also find that EIF VC brought an almost sixfold increase in the chance to experience international
acquisitions, while it had a much more muted effect on the incidence of national M&A.

The findings are consistent with the theory that the presence of VC investors opens up additional exit
channels that would not otherwise be available to the entrepreneur. In our sample, this translated
into a disproportionally positive impact on horizontal and vertical integrations. Moreover, as shown
in the literature (Bertoni and Groh, 2014), this effect might be further amplified by the presence
of numerous cross-border investments in our sample. In turn, the significant share of cross-border
investments might explain the disproportionally positive impact on the likelihood to experience M&As
with at least one foreign buyer. Phillips and Zhdanov (2017) show that an active M&A market provides
an incentive for VC firms to engage in more VC deals, supporting the hypothesis that the EIF fostered
a virtuous cycle between VC activity and the exit environment.

As mentioned above, this paper also looks at the effects on the innovation capacity of start-ups. We
find that EIF VC contributed to a doubling of the likelihood to patent, compared to counterfactuals.
In absolute terms, we find a 10 pp higher probability to patent for EIF VC-backed start-ups, already
by the second post-investment year — further up to 13 pp six years after investment. Our findings are
consistent with the theory that VC alleviates the financial constraints of young innovative businesses
and allows them to maintain high R&D expenditures and cover the direct and indirect costs of patent-
ing (Bertoni et al., 2010). In addition, monitoring by VC firms might prove a direct incentive towards
patenting or, by promoting financial discipline, indirectly foster the start-up’s innovative capacity.

In summary, we observe higher IPO and M&A rates for start-ups supported by the EIF compared to
similar, non-VC-backed firms. This is likely due to VC firms opening up additional exit channels that
would not otherwise be available to the entrepreneurs. EIF VC also contributed to higher patenting
rates for beneficiary start-ups. This might be due to the mitigation of financial constraints as well
as the tighter financial discipline induced by VC firms. These findings, in line with current economic
research, point to the effectiveness of EIF’s policy instruments fostering SMEs’ access to VC financing.

Overall, our work supports the development of an “impact culture” by discussing the causal effects of
VC financing supported by the EIF. Our study provides meaningful evidence towards the positive role
of EIF VC on the exit prospects and innovation capacity of young innovative businesses in Europe.

                                                  VII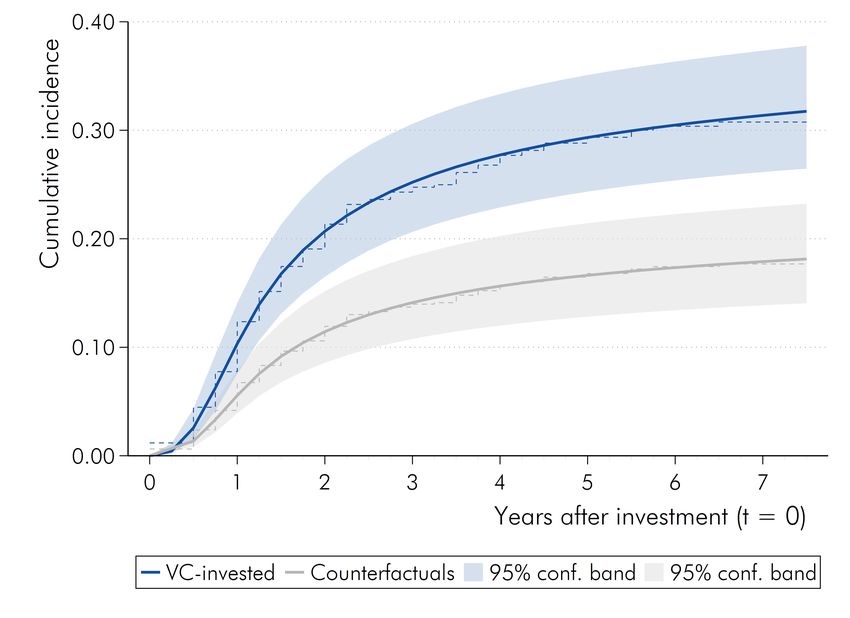
Table of Contents

Abstract                                                                                                V

Non-technical Summary                                                                                  VI

Table of Contents                                                                                     VIII

List of Figures                                                                                         X

List of Tables                                                                                         XI

1 Introduction                                                                                          1

2 Literature review                                                                                     2

    2.1 Venture capital and exit outcomes . . . . . . . . . . . . . . . . . . . . . . . . . . .         2

    2.2 Venture capital and innovation . . . . . . . . . . . . . . . . . . . . . . . . . . . . .        3

3 Data and Methods                                                                                      5

4 Empirical Approach                                                                                    7

    4.1 Identification strategy . . . . . . . . . . . . . . . . . . . . . . . . . . . . . . . . . .     7

    4.2 Competing risks methods . . . . . . . . . . . . . . . . . . . . . . . . . . . . . . . 10

5 Descriptive statistics                                                                              12

    5.1 Primary exit outcomes . . . . . . . . . . . . . . . . . . . . . . . . . . . . . . . . . 12

    5.2 Secondary M&A outcomes . . . . . . . . . . . . . . . . . . . . . . . . . . . . . . . 13

    5.3 Patenting activity . . . . . . . . . . . . . . . . . . . . . . . . . . . . . . . . . . . . 14

6 Competing risks analysis                                                                            14

    6.1 Primary exit outcomes . . . . . . . . . . . . . . . . . . . . . . . . . . . . . . . . . 15

    6.2 Secondary M&A outcomes . . . . . . . . . . . . . . . . . . . . . . . . . . . . . . . 18

    6.3 Patenting activity . . . . . . . . . . . . . . . . . . . . . . . . . . . . . . . . . . . . 20

    6.4 Moderating effects . . . . . . . . . . . . . . . . . . . . . . . . . . . . . . . . . . . 21

    6.5 Robustness checks . . . . . . . . . . . . . . . . . . . . . . . . . . . . . . . . . . . 22

                                                  VIII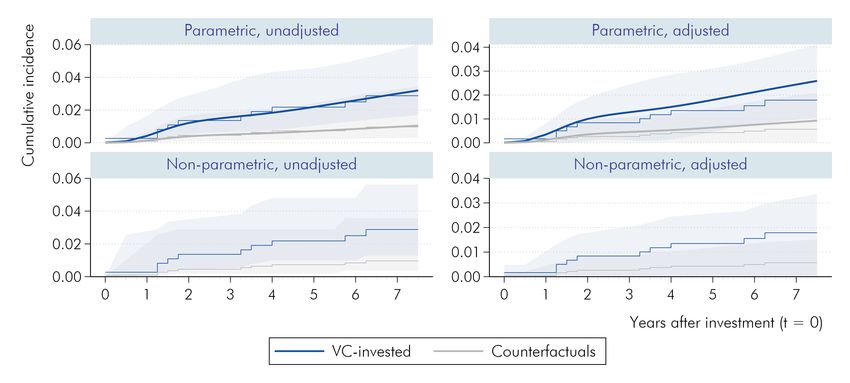
7 Concluding remarks                                                                           24

References                                                                                     26

Appendices                                                                                     31

   Appendix A    Identification and compilation of exit outcomes data . . . . . . . . . . . . 31

   Appendix B    Competing risks methods . . . . . . . . . . . . . . . . . . . . . . . . . . 33

   Appendix C    Alternative matching strategies . . . . . . . . . . . . . . . . . . . . . . . 35

   Appendix D    Alternative model specifications . . . . . . . . . . . . . . . . . . . . . . . 37

   Appendix E    Robustness to model misspecification . . . . . . . . . . . . . . . . . . . . 40

About                                                                                          43

EIF Working Papers                                                                             44

                                              IX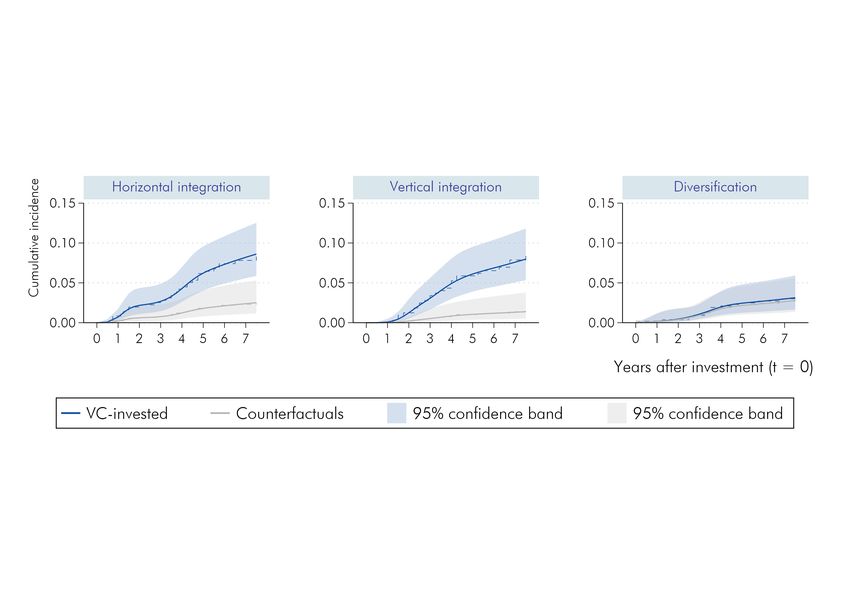
List of Figures

   1     Identification of treatment and control populations . . . . . . . . . . . . . . . . . .   5

   2     Aggregate patenting activity, by treatment status . . . . . . . . . . . . . . . . . . . . 14

   3     Changes in the cumulative incidence function (CIF) due to treatment, by exit route . . 17

   4     M&A outcomes: changes in the CIF due to treatment, by M&A route . . . . . . . . . 19

   5     Changes in the CIF for patenting due to treatment . . . . . . . . . . . . . . . . . . 21

                                                 X
List of Tables
1 VC-invested firms breakdown . . . . . . . . . . . . . . . . . . . . . . . . . . . . . 6
2 Propensity score matching (PSM) multi-level model . . . . . . . . . . . . . . . . . . 9
3 Descriptive statistics of PSM model and balancing checks . . . . . . . . . . . . . . . 10
4 Distribution of primary exit outcomes, by treatment status . . . . . . . . . . . . . . . 13
5 Distribution of merger and/or acquisition (M&A) outcomes, by treatment status . . . 13
6 Primary outcomes: estimated odds ratios for the Cox duration model . . . . . . . . . 16
7 M&A integration types: estimated odds ratios for the Cox duration model . . . . . . 18
8 M&A buyer(s) types: estimated odds ratios for the Cox duration model . . . . . . . . 19
9 Patenting activity: estimated odds ratios for the Cox duration model . . . . . . . . . 21
10 Observed vs expected events ratio and log-rank test for treated firms, by moderator. . 23
XIThis page intentionally left blank
1         Introduction

Venture capital can be an essential source of financing for wealth-constrained entrepreneurs that
pursue an innovative business idea. In a typical scenario, VC firms invest in start-ups via the acquisition
of equity shares in the company. These shares are characterised by very low liquidity, in particular
during the business’s initial development phase. In addition, these shares rarely yield dividends,
notably if the firm’s business model has not yet delivered a positive cash flow. Therefore, the future
re-sale of the company shares may well be the only recourse VC firms have to profit from their
investments. Most often, this profit stems from the start-up’s creation of value through innovation.

Two elements stand out from our stylised description of VC investing. First, the exit decision is a critical
step in the VC investment life cycle, equally important to the entry decision itself (Schwienbacher,
2012). Exit performance serves as a signal of the VC firm’s quality. Moreover, exit conditions can
have a lasting effect on key business decisions (e.g. R&D investments) and the overall growth of VC-
backed start-ups (Meles et al., 2014). Second, the VC investment decision is based on the start-up’s
pledge to create value through high-risk/high-reward innovative entrepreneurial ideas.

A key question is whether and how VC investing affects the prospects of innovative start-ups. In Pavlova
and Signore (2019), we addressed this topic from the standpoint of the economic and financial
growth of VC-backed start-ups. This paper further contributes to this discussion by investigating the
causal link between VC investing and the exit patterns of start-ups supported by the EIF in the years
2007-2014. In addition, we examine the causal role of VC investing on the innovation capacity of
beneficiary start-ups, as measured via their patenting activity.

The benefits of a thriving VC ecosystem are well known (see e.g., Bertoni et al., 2011; Colombo et al.,
2014). Consequently, over the last two decades the EIF has strived to pursue its policy-oriented goal to
support the formation of a resilient European VC ecosystem and the emergence of new European VC
hubs. This partly explains the EIF’s current prominent role in the European VC landscape. Kraemer-Eis
et al. (2016) argue how this calls for a thorough assessment, to verify if the initial policy targets were
met. In this respect, our work complements the series of EIF working papers ”The European venture
capital landscape: an EIF perspective”, which is centred around this topical question.

The EIF fulfils its public policy mission by investing its own funds as well as resources managed on
behalf of capital providers/mandators under a range of programmes — it also advises and manages
funds-of-funds and initiatives for third party investors. In this context, the EIF predominantly adopts
an intermediated model, which entails the acting as a limited partner (LP) in privately managed VC
funds (Alperovych et al., 2018). EIF investments in VC funds follow a detailed due diligence process,
focussing on various aspects of the investment proposal. Additional scrutiny is paid to the quality of
the VC firm’s team, to their ability to adhere to the EIF’s policy goals and to contribute to the growth
of portfolio companies while, at the same time, generating returns consistent with market conditions.

The paper is organised as follows. Section 2 provides an overview of the relevant empirical literature.
Section 3 discusses the source and characteristics of our data. Section 4 illustrates the empirical ap-
proach, which is largely based on our previous work (Pavlova and Signore, 2019). Section 5 presents
selected summary statistics, while section 6 discusses our empirical findings. Section 7 concludes.

                                                     1
2 Literature review
2.1 Venture capital and exit outcomes
The evaluation of exit options is a crucial part of VC firms’ investment appraisal process. Two key
elements contribute to a successful exit decision: the timing of the exit and the type of exit route. The
economic literature mainly focuses on three types of VC exit routes: initial public offering (IPO), trade
sale (i.e. merger and/or acquisition), or liquidation (Da Rin et al., 2013). Additional exit routes include
— but are not necessarily limited to: management buy-in/buy-out (or share buyback), institutional
buy-out (or secondary sale). Throughout this paper, we refer to these exit routes as “Other buy-outs”.
Due to challenges related to the availability of both unbiased data and an appropriate identifica-
tion strategy, the empirical literature investigating the causal relationship between VC investing and
start-up exit events is rather limited. Nevertheless, the existing body of research provides compelling
insights. We provide here a brief overview.
After controlling for companies’ asset volumes, Bottazzi and Da Rin (2002) find that venture-backed
firms raise on average 60% more than non-VC-backed firms during an IPO. Brav and Gompers
(1997) also confirm that venture-backed IPOs outperform non-venture-backed IPOs using equal-
weighted returns. However, they note that value-weighting significantly reduces performance differ-
ences. Their study suggests that IPO under-performance for non-VC-backed firms might stem from
the entrepreneurs’ lack of market information. An alternative hypothesis for this discrepancy relates
to the existence of strategic partnerships, facilitated by VC firms. Venture-backed firms exploiting such
strategic alliances tend to be associated with a higher probability of successful exit (Lindsey, 2008).
Megginson and Weiss (1991) identify the presence of VC certification for US-backed start-ups, i.e.
VC-backed companies elicit greater interest from institutional investors during the IPO phase, and
also tend to go public earlier than matched non-VC-backed firms. The VC certification hypothesis
was questioned by Jelic et al. (2005), then confirmed again by Dolvin (2005).
In their exhaustive study, Puri and Zarutskie (2012) compare a matched sample of VC and non-VC-
financed firms in the US. Descriptive statistics on the exit performance of VC-financed firms show
that 39.7% failed, 33.5% were acquired, and 16.1% went public. In contrast, non-VC-financed firms
performed considerably worse — 78.9% failed, 1.04% were acquired, and only 0.02% went public.
Chemmanur et al. (2008) also show that VC backing and the associated efficiency gains positively
affect the probability of a successful exit.
Hsu (2006) finds that relative to a control group, VC-backed companies are more likely to engage
in cooperative commercialisation strategies, such as strategic alliances or technology licensing. They
also have increased likelihood of IPO, especially if financed by more reputable VC firms (VCs).
Strategic alliances and VC financing both increase the likelihood of going public among young
biotech companies (Ozmel et al., 2013).
A strand of literature has looked at the exit performance of firms backed by either governmental VC
support or independent VC firms’ investments. Colombo et al. (2014) provide an excellent synthesis
of current research, which appears to converge to a mostly consistent set of findings discussed below.
2Cumming et al. (2017) find that mixed independent-governmental syndicated VC investments lead to
a higher likelihood of successful exit outcomes than independent1 or purely governmental VC-backed
(GVC) investments in Europe. Similar conclusions emerge from a study of Australian start-ups, where
a blend of independent and government VCs resulted in a higher share of publicly listed investments
as well as larger market capitalisation (Cumming and Johan, 2014). Brander et al.’s (2014) findings
from a large international sample confirm that GVCs are beneficial to successful exits only when they
syndicate with private VCs and when private VCs provide a large fraction of the funds.
Buzzacchi et al. (2015) note that while independent VC firms have an incentive to divest low-return
investments as soon as they can, EIF co-invested VC firms tend to delay an exit if start-ups are likely to
generate social returns or exert a positive impact on the economic system, even if their return prospects
might be sub-optimal. The authors argue that this evidence is compatible with the overarching goal
of a public investor, which is not restricted to financial returns, but also includes additional factors
related to the spillover effects of entrepreneurship. See also Kraemer-Eis et al. (2016) on this topic.
On the one hand, the above studies point to mixed private and public VC bringing about the most
positive results. On the other hand, these studies also assert that pure governmental VC tends to
yield much weaker effects. This finding is further supported by Cumming and Johan (2008), who find
that government VC-backed companies are less likely to experience an IPO and/or acquisition exit
route, but rather a secondary sale and/or a buyback.
In conclusion, we find our brief survey of the literature in line with Da Rin et al.’s (2013) extensive
review. Da Rin et al. (2013) argue that the evidence of VC-backed companies achieving better exit
outcomes than other start-up categories is significant. When VC-backed firms are further classified
based on the type of supporting VC firm — governmental, independent or mixed — data suggest
that a combination of private and government VC leads to a higher chance of successful exit events.
2.2 Venture capital and innovation
A multi-decade literature has looked at the relationship between innovation and VC, trying to establish
the direction of causality. There are currently two main schools of thought: the first argues that VC
firms nurture, encourage and stimulate start-ups to exploit their innovative potential. We call this
strand “VC first”. The “innovation first” school claims instead that VC firms merely scout for highly
innovative ideas, which in turn show an intrinsically higher chance to benefit from e.g., patenting.
Most studies lean to either of the two hypotheses. We provide here an informative, yet in no way
complete, survey of the existing literature.
Kortum and Lerner (2000) were among the first to examine the effect of venture capital on innovation.
By using both firm- and industry-level US data as well as different measures related to innovation,
such as patent renewals and intellectual property litigation, they found that VC significantly increases
the patenting rate in a given industry.
Several studies analysed the Spanish VC market. Alemany and Martí (2005) contribute to this research
by studying an alternative measure of innovation, i.e. net investment in intangibles. The authors find
1
However, the difference between mixed and independent VCs’ investments is not statistically significant.
3that the intangible assets of VC-backed companies grew at a faster rate compared to those of similar
firms that did not receive a VC investment. Additional evidence from the Spanish market can be found
in Bertoni et al. (2010), who find that VC investments positively affect subsequent patenting activity.
The authors note that before receiving the financing, VC-backed firms did not exhibit a significantly
higher propensity to patent compared to other firms.
Similarly, using a large set of controls, Arqué-Castells (2012) concludes that firms increase their
patenting activity after a VC investment. The author’s main result holds over a wide range of model
specifications, supporting the case that the sharp increase in patenting following the VC financing
is caused by a positive treatment effect, rather than a pure selection effect. Arqué-Castells (2012)
further argues that the higher patenting activity is not the mere result of start-ups’ increased capital
availability to, inter alia, patent pre-existing innovations. In fact, VC firms appeared to fund and
support the entire innovation development process.
In the US, the prominent role of VC in fostering innovation is further shown by Dushnitsky and Lenox
(2005) and Popov and Roosenboom (2009). The authors find a significant positive effect of risk
capital finance on innovative activity. VC is also found to help Dutch-based portfolio companies
develop absorptive capacity and durably increase their in-house R&D (Da Rin and Penas, 2007).
Lastly in this strand of literature, Bertoni and Tykvová (2015) analyse European biotechnology start-
ups and note that the combined effect of independent and governmental VC syndicates is more than
the sum of its parts’ individual effects. The authors estimate a positive effect of independent and
governmental VC syndicates both for the case of invention (measured through unweighted patent
stock) and innovation (measured through citation-weighted patent stock).
The “innovation first” school argues in favour of reverse-causality, whereby innovations induce VC
and not vice-versa. By comparing German VC-financed start-ups to an identical group of firms
without VC backing, Engel and Keilbach (2007) find that VC firms target the more innovative start-
ups. At the same time, the authors did not find that VC-funded firms produce more innovative output
than similar non-VC-backed start-ups. In addition, Caselli et al. (2009) conclude that innovation
plays a key role during the selection process, however VC does not foster innovation activity per se.
Although Hellmann and Puri (2000) also conclude that companies showing higher innovation activity
are more likely to receive VC, they still find that the presence of VC is positively associated with a
significant reduction of the time a company needs to introduce its products to the market. Conversely,
Stuck and Weingarten (2005) and Peneder (2010) find that VC has no causal impact on innovation
output when comparing VC-backed with similar non-VC-backed companies in North America and
Austria respectively. In fact, contrary to the result of Arqué-Castells (2012) presented above, Peneder
(2010) concludes that any difference related to innovation must be directly caused by selection effects.
The “innovation first” hypothesis is further backed up by three studies analysing the European and US
industries, which find no indication of VC’s positive influence on innovation activity (Geronikolaou
and Papachristou, 2012; Hirukawa and Ueda, 2011; Arvanitis and Stucki, 2012). In conclusion,
both theories find significant support in the literature and further research might be necessary to
identify the true direction of causality.
43 Data and Methods
This section provides a brief summary of the features as well as the main assumptions underlying
our data. In the absence of an EIF-backed VC investment, we assume that a wealth-constrained
entrepreneur would resort to alternative financing channels. As a result, a central problem of our
study is the identification of start-ups that failed to obtain VC.2 In Pavlova and Signore (2019), we
discuss a practical solution to this issue, illustrated in Figure 1 through nested conditional sets.3
Figure 1: Identification of treatment and control populations4
M4
∅* EIF-backed and/or EU-VC invested firms
M3
VC-invested firms
M2
VC-investable firms
M1
EU27 and UK firms
* The conditional empty set ∅ emphasises the data completeness assumption for M4 . Source: Pavlova and Signore (2019).
Our approach requires a representative dataset for the population of EU27 and UK firms along
with a complete listing of VC-invested start-ups in the region. We select Bureau Van Dijk’s Orbis
database as a suitable approximation for the population of firms in the EU27 and UK.5 In addition,
Orbis serves as the main source of industry, financial performance, human capital and patent data.
The source of our near-complete mapping of start-ups in the European VC ecosystem is an extensive
data collection exercise carried out by Invest Europe — the association representing Europe’s Venture
Capital and Private Equity industry.6 Whenever necessary, we integrated this collection with EIF’s own
activity data. See Crisanti et al. (2019) for a description of this dataset. We further converted this
mapping into a list of business legal entities available in Orbis, based on a rigorous identity-matching
process — controlling for e.g., company name, location, sector, date of incorporation and fiscal ID.
We do not discuss here the ability of our data to correctly identify start-ups that failed to obtain VC.
Interested readers can refer to section 3 of our previous work (Pavlova and Signore, 2019). Instead,
2
These form the basis for the counterfactual (or control) group. We discuss its construction in section 4.
3
The condition being that each element of each set of Figure 1 must be observable in the Orbis database.
4
If not stated otherwise, figures and tables are from the authors, based on EIF and Invest Europe data.
5
Orbis is an aggregator of firm-level data gathered from over 75 national and international information
providers, such as e.g., business registers, credit bureaus, national banks, statistical offices. As of December
2020, Orbis tracks 390 million companies in over 90 countries. Less than 0.01% of these are listed.
6
Given that Invest Europe’s data are sourced directly from affiliated VC firms, they provide to the best of
our knowledge an unrivalled coverage of the European VC ecosystem.
5we provide here a brief complementary discussion on the suitability of our approach, entailing a
comparison of start-ups receiving EIF VC against start-ups that failed to obtain VC. An important
caveat that stems from our empirical design is that we can only identify the cumulated effect of VC
investments and the (potential) policy-driven contribution of the EIF. By contrast, we are unable to
isolate any differential effect directly attributable to the presence of the EIF in a given VC investment.
In principle, a comparison between EIF VC and other-than-EIF VC investments could overcome this
limitation. However, the characteristics of our dataset prevented us from further pursuing this avenue.7
Given that we could only identify in Orbis a small share of the population of VC-backed start-ups
prior to 2007, the focus of our work is on those invested during 2007-2014, i.e. when our coverage
is near-complete. We further narrow down our research to firms in the seed and start-up investment
stages, grouped under the collective term ”early stage” (Jeng and Wells, 2000). Finally, we only look
at start-ups supported by EIF VC investments, which confines our initial treatment group to 782 EIF
VC-backed firms. Table 1 summarises the process leading to our final set of treated firms.
Table 1: VC-invested firms breakdown
Sample Number of firms
Full European VC-backed population 27,044
- of which invested in 2007-2014 11,577
- of which identified in Orbis 8,943
- of which early stage 4,945
- of which EIF 782
Source: Pavlova and Signore (2019).
The first outcome of interest in this paper is the exit type of VC-financed firms. We source exit infor-
mation from Bureau Van Dijk’s Zephyr database, which as of December 2020 contains information
on over 2.1 million worldwide merger and acquisition (M&A henceforth), IPO, private equity and VC
deals. While Zephyr might fail to provide the most exhaustive set of exit deals (Bollaert and Delanghe,
2015), it bears the advantage of assigning every deal to one or more participating legal entities in
the Orbis database, which greatly facilitates our data collection. Crucially, a Zephyr deal might be
directly assigned to the legal entity of the company under scrutiny and/or indirectly assigned via a
controlling entity. Therefore, when treating these data it is essential to account for the (time-varying)
structure of the start-up’s corporate group. We detail the compilation of exit data in Appendix A.
Our second outcome of interest is the start-ups’ innovation activity. We measure firms’ innovation
efforts based on the count of patent applications, sourced from Orbis and PATSTAT (see Signore and
Torfs, 2017 for details about the data). Specifically, we use patent families as units of measure —
”a patent family is a collection of related patent applications that is covering the same or similar
technical content” (European Patent Office, 2017).8 Patent families are regularly employed as unit
of analysis when the research focus is on firms’ inventions (Hall, 2014). Moreover, this approach is
consistent with previous works in the EIF working paper series.9 Nevertheless, we acknowledge that
there are multiple caveats in using patenting as a proxy for innovation (see e.g., Lerner, 2002).
7
Specifically, the lack of information concerning investment volumes and investor information for the other-
than-EIF VC sample would not allow us to control for the EIF’s non-random selection of VC funds (see
section 1), leading to a flawed empirical strategy and biased estimates of the EIF’s differential effect.
8
We sort innovations according to the date of application (as opposed to, if applicable, the date of granting).
9
Analogously to Signore and Torfs (2017), this work employs patent family ownership, as opposed to regis-
tration, as the main unit of analysis. The key difference is that the former can be transferred between entities
64 Empirical Approach
This section outlines our empirical strategy to identify the effect of a VC investment on the start-up’s
exit outcome and innovation output. The approach entails a minor extension to the methods we
presented in Pavlova and Signore (2019), for which we provide a brief summary below. Interested
readers are referred to section 4 of our previous work for a detailed discussion. Henceforth, VC-
invested start-ups supported by the EIF in the period 2007-2014 will be referred to as the treatment
group, while non-VC-backed firms will be called counterfactuals or controls.
4.1 Identification strategy
Our empirical strategy is based on Rubin’s Causal Model and the potential outcomes framework (Ru-
bin, 1974, hereafter RCM).10 Under RCM, the potential outcome experienced by VC-backed firms in
the absence of VC financing (unobservable) can be replaced by the potential outcome experienced by
appropriately selected non-VC-backed firms (observable). In other words, our counterfactual group
simulates the outcome of VC-backed firms had they not received VC, and the difference between the
two groups’ outcomes represents the effect of VC financing.
The construction of a suitable control group relies on a thorough understanding of the decision-
making process of venture capitalists. To this end, in Pavlova and Signore (2019), we undertook an
extensive literature review with the goal to enumerate factors that might affect VC contracting. We
identified two types of factors: a) discriminants and b) predictors of VC contracting. Discriminants of
VC financing are high-level features that characterise the firm’s operations. These are used to assess
the viability of a VC investment opportunity as well as its exit prospects. They include principal features
at investment date, namely the start-up’s country and sector of operations, its age, whether it had
applied for a patent and its degree of innovativeness. Predictors of VC financing represent factors
that are more likely to be “traded-off” during the investment appraisal process. These are related to
the entrepreneurial team — team size, founders’ age, previous experience, gender and nationality.
Two additional variables complete the set of predictors of VC financing in Pavlova and Signore
(2019). The first is a proxy for VC demand and constitutes a predictor of housing demand elasticity:
based on the considerations in Robb and Robinson (2014), entrepreneurs located in urban areas with
stable-valued dwellings — easily pledgeable as collateral to lenders — might show lower appetite
for external equity finance. The second measure is a proxy for the supply of venture capital: based
on the observations in Lerner (1995) and Bernstein et al. (2015), VC firms’ investment decisions
are sensitive to geographical distance. We exploit this knowledge to construct a measure of start-up
”accessibility” with respect to the population of active VC firms in a given year.
following the acquisition of firms and/or their intellectual property (IP). Thus, this work does not distinguish
between acquired and originated IP, as the two R&D strategies can be equally effective in the creation of
new innovative capacity. Using an extended version of our dataset covering pre-2007 EIF VC investments,
Signore and Torfs (2017) find that for 86% of innovations the legal entity of the original applicant and of
the owner coincide. That is, most innovations were (in all likelihood) developed internally by the start-ups.
10
RCM rests on three key assumptions: a) stable unit treatment value; b) unconfoundedness; c) overlap. See
Pavlova and Signore (2019) for a detailed discussion and implications for the case of VC-backed start-ups.
7In this paper, we add three new predictors to the treatment assignment model in our previous work.
Not only these improve our treatment assignment predictions, but are also likely to contribute to the
start-up’s exit outcome. The additional predictors concern the start-up’s corporate structure at the
time of investment. Namely, we include a count of the start-up’s controlling firms,11 an indicator of
the start-up’s independence (i.e. to autonomously set its strategic direction) and the level of ownership
concentration (i.e. no shareholders, corporate majority shareholder, corporate plurality shareholder,
non-corporate majority/plurality shareholder). Appendix A details the construction of the indices.
We follow the approach in our previous work (Pavlova and Signore, 2019) to construct and implement
our matching estimator. In essence, it corresponds to the estimator described in Abadie and Imbens
(2006), implemented via a combination of exact- and propensity score-based matching. The two-step
matching approach mirrors the stylised treatment assignment process described above. Each start-up
is first ”screened”, a process we mimic via exact matching, on the discriminants of VC financing.
The investment decision stage is further simulated by our propensity score matching model, which
includes both discriminants and predictors of VC financing. As in our previous work, we estimate the
propensity score with a multi-level mixed effects model, which appropriately accounts for the hierar-
chical nature of our data: entrepreneurs nested within start-ups, themselves clustered in urban areas.
Moreover, we follow our previous work and estimate the propensity score model using our complete
dataset of European VC-invested firms in the years 2007-2014 (i.e. including non-EIF-backed in-
vestees) and candidate controls, in order to maximise the model’s predictive ability. It is important to
note that this approach implicitly assumes that the VC assignment mechanism is independent from
the selection process of the EIF (see section 1 and 3). In other words, we assume that there are no
significant differences between the likelihood of obtaining EIF VC and other-than-EIF VC.12
Table 2 reports the Odds Ratios (ORs) and goodness of fit of our propensity score model. ORs
describe the odds that an outcome will occur given a particular exposure, compared to the odds of
the outcome occurring in the absence of said exposure (Szumilas, 2010). An OR > 1 implies that
the exposure is associated with increased odds to observe the outcome, while OR < 1 implies the
opposite. For instance, if OR = 2 for a binary covariate d, this means that the outcome is twice as
likely to occur if start-ups have d = 1 than if they have d = 0.
All covariates are either strongly significant, significant or close to the 10% significance level. We use
the model’s predicted scores to identify the counterfactual firm for every VC-invested start-up. The
counterfactuals in our baseline model are identified via a one-to-one nearest neighbour matching
with replacement and calliper. 13 Table 3 provides descriptive statistics of the pre-treatment attributes
in the final matched sample, separately for treated and controls — T and C respectively. Column 5
of Table 3 provides the p-value of mean-comparison t-tests for each included variable, confirming
the adequate balancing ability of our estimator.
11
Controlling companies are defined as entities with a 50% or higher participation share in the start-up.
12
Buzzacchi et al. (2013) argue that this might be a strong assumption. However, our data does not provide
strong evidence that EIF VC is administered differently than non-EIF VC when looking at homogeneous
groups of start-ups — e.g. as identified through cluster analysis.
13
Our baseline approach sets the calliper as the standard deviation of the treated firms’ propensity scores.
8Table 2: Propensity score matching multi-level model. Dependent variable is treatment status
Pr (treatment = 1)
MULTI-LEVEL MIXED EFFECTS LOGIT
Founding team size‡ 1.8622***
(0.086)
Age of founding team‡ 0.9531***
(0.010)
Previous founding experience‡ 3.9512***
(1.360)
Foreign-born entrepreneurs‡ 0.9081**
(0.030)
Female entrepreneurs‡ 0.1326***
(0.033)
Firm age at inv. year 0.8908***
(0.014)
Patent at inv. year 3.2436***
(0.425)
Predicted degree of innovativeness 1.8180**
(0.359)
Firm accessibility score 1.2528
(0.175)
ln (Firm’s distance from closest FUAϰ centroid) 0.8817***
(0.011)
ln (FUA’s undevelopable land) 0.3755
(0.232)
Number of shareholders 0.4899***
(0.068)
Independence Indicator:α (omitted: A)
B 1.0518
(0.114)
C 0.1708***
(0.078)
D 0.3593***
(0.038)
Unknown 1.8455***
(0.169)
Group ownership type: (omitted: No shareholders)
Corporate majority shareholder 1.7970***
(0.150)
Corporate plurality shareholders 1.3108**
(0.136)
Non-corporate majority/plurality shareholder/s 0.6000
(0.334)
Constant 0.0042***
(0.003)
Cluster means (pooled) 4.9063
(8.843)
Quadratic terms (pooled) 0.0009***
(0.001)
Cubic terms (pooled) 2.0452
(3.096)
Interactions (pooled) 0.2102**
(0.109)
Investment Year Fixed Effects Yes
Start-up macro-industry Fixed Effects Yes
Start-up macro-region Fixed Effects Yes
Log-likelihood -6167.16
Obs. 31,989
Pseudo-R2 (McKelvey and Zavoina, 1975) 0.41
Area under the ROC curve 0.872
† ‡
0.10 * 0.05 ** 0.01 *** 0.001; Founder-level characteristic; Exponentiated coefficients (std. errors in brackets);
ϰ
Functional Urban Area, i.e. a densely populated area and its neighbouring commuting zones (OECD, 2012);
α
A: No shareholder with ≥ 25% ownership; B: No shareholder with ≥ 50% ownership, but at least one with ≥ 25%; C:
A shareholder with ≥ 50% ownership and/or an ultimate owner exists, D: A shareholder with a direct ≥ 50% ownership.
9Table 3: Descriptive statistics of PSM model and balancing checks
Obs. Mean Median St. dev. P-value
(1) (2) (3) (4) (5)
T C T C T C T C T/C
Average team age at founding 274 274 40.81 41.90 40.29 42.34 8.446 8.226 0.126
Share of female team members 274 274 0.10 0.11 0.00 0.00 0.193 0.199 0.531
Share of foreign team members 274 274 0.17 0.15 0.00 0.00 0.275 0.310 0.606
Average team prev. experience 274 274 42.04 22.08 1.88 1.00 434.9 227.5 0.501
Founding team size 274 274 4.28 4.19 3.00 3.00 3 3 0.741
Firm age at inv. year 274 274 2.07 2.02 1.36 1.36 1.868 1.817 0.776
Patent at inv. year 274 274 0.20 0.20 0.00 0.00 0.404 0.404 1.000φ
Predicted degree of innovativ. 274 274 0.59 0.59 0.91 0.92 0.436 0.434 0.975
Firm accessibility score 274 274 1.24 1.15 0.45 0.38 1.644 1.654 0.536
ln (Firm distance from FUA centroid) 274 274 -0.78 -0.84 -2.30 -2.30 2.308 2.352 0.767
ln (FUA’s undevelopable land) 274 274 -2.95 -2.97 -3.43 -3.39 1.023 1.083 0.792
Number of shareholders 274 274 0.19 0.19 0.00 0.00 0.521 0.600 1.000
Investment period:
2007-08‡ 274 274 0.19 0.19 0.00 0.00 0.390 0.390 1.000φ
2009-11‡ 274 274 0.23 0.23 0.00 0.00 0.424 0.424 1.000φ
2012-14‡ 274 274 0.58 0.58 1.00 1.00 0.494 0.494 1.000φ
Macro-sector:
ICT‡ 274 274 0.50 0.50 0.50 0.50 0.501 0.501 1.000φ
Life Sciences‡ 274 274 0.20 0.20 0.00 0.00 0.399 0.399 1.000φ
Services‡ 274 274 0.17 0.17 0.00 0.00 0.374 0.374 1.000φ
Other‡ 274 274 0.14 0.14 0.00 0.00 0.342 0.342 1.000φ
Macro-region:
DACH‡ 274 274 0.28 0.28 0.00 0.00 0.452 0.452 1.000φ
Nordics‡ 274 274 0.12 0.12 0.00 0.00 0.322 0.322 1.000φ
France & Benelux‡ 274 274 0.09 0.09 0.00 0.00 0.283 0.283 1.000φ
South & CESEE‡ 274 274 0.06 0.06 0.00 0.00 0.242 0.242 1.000φ
UK & Ireland‡ 274 274 0.45 0.45 0.00 0.00 0.498 0.498 1.000φ
Independence indicator
A‡ 274 274 0.15 0.10 0.00 0.00 0.361 0.303 0.073
B‡ 274 274 0.31 0.32 0.00 0.00 0.465 0.469 0.784
C‡ 274 274 0.01 0.01 0.00 0.00 0.104 0.104 1.000
D‡ 274 274 0.34 0.42 0.00 0.00 0.473 0.495 0.035
Unknown‡ 274 274 0.19 0.14 0.00 0.00 0.390 0.346 0.133
Group ownership type
No shareholders‡ 274 274 0.22 0.20 0.00 0.00 0.414 0.399 0.529
Corp. majority shareholder‡ 274 274 0.57 0.57 1.00 1.00 0.496 0.496 0.931
Corp. plurality shareholders‡ 274 274 0.21 0.23 0.00 0.00 0.407 0.422 0.536
Non-corp. maj./plur. sh.‡ 274 274 0.00 0.00 0.00 0.00 0.060 0.000 0.318
‡ φ
dichotomic variable; exactly matched.
4.2 Competing risks methods
We motivate here our choice to use competing risks methods to estimate the impact of VC on start-
ups’ exit outcomes and patenting. In section 2.1 we noted that, in addition to the exit route, the timing
of an exit is a key element contributing to its success. For this reason, duration models — also referred
to as survival models — are particularly suitable to the analysis of our data. In addition, we mentioned
how VC firms can choose among several ways to divest their portfolio companies. Notably, these exit
routes are mutually exclusive: this implies that we are in the presence of competing risks data.
In competing risks theory, a start-up can potentially experience one of many different exit outcomes.
However, only the time-to-exit for the earliest of these is observed — or the last observed time period
if no exit event has occurred yet. Until then, each exit option carries some probability to occur. The
model set-up is similar in the medical literature: for instance, researchers studying mortality for a
10particular disease in patients may want to also account for non-disease-related deaths. In the case
of venture capital investments, Giot and Schwienbacher (2007) use a competing risks framework to
evaluate the incidence of various exit outcomes for VC-backed start-ups.14
Austin and Fine (2019) provide a useful guide to estimate treatment effects in the presence of compet-
ing risks and propensity score-matched data. The authors argue that, to estimate the relative effects of
the treatment status, researchers can use the Cox (1972) model to regress the cause-specific hazard
(i.e. the instantaneous rate of exiting via a given exit route) on the treatment status.15 The estimated
hazard ratios can be then used to make inference on the relative treatment effect.
In addition, researchers must also fit the data with a Fine and Gray (1999) model to estimate the
absolute treatment effect, i.e. the percentage points change in the incidence of a given exit outcome
due to the treatment status. In this respect, a central measure in the Fine and Gray (1999) model is the
cumulative incidence function (CIF), which represents the probability that a start-up will experience
a given exit outcome by a specific point in time, accounting for all other exit types. We discuss the
terminology and approach of the Cox (1972) and Fine and Gray (1999) models in Appendix B.
Importantly, Austin and Fine (2019) recommend that estimates account for the matched nature of the
sample by means of a cluster-robust variance estimator, where the clustering dimension is represented
by the treated start-up and associated control(s). To this end, the authors recommend using the
approach in Zhou et al. (2012), which introduces a variation of the Fine and Gray (1999) model
that provides unbiased estimation of survival models in the presence of clustered data.16
A few recent advancements in the survival literature enhance and complete our analytical framework.
Geskus (2011) proves that the Fine and Gray (1999) model can also be estimated using a weighted
version of standard survival estimators for e.g., the Cox proportional hazard model. The advantage
of this approach is that some of the methods developed for the Cox model can be directly applied
to competing risks data (as modelled by Fine and Gray). This includes e.g., the estimation of confi-
dence bounds for the survival/incidence curve and other auxiliary statistical tests (Lambert, 2017). In
addition, Lambert (2017) discusses a series of estimators based on the Royston and Parmar (2002)
flexible parametric survival model. These allow us to fit survival data and generate smooth versions
of the traditional non-parametric Kaplan–Meier survival curves, which account for competing risks.
We conclude with a brief discussion of our modelling choices with respect to the treatment effect
on patenting. In the case of patenting, we are able to employ a wider set of approaches other
than competing risks models, since competing risks are not a prominent feature of patenting data.
However, to present our results in a harmonised way, we also estimate the effect of VC on patenting
under a competing risks framework. In such framework, we track start-ups over time until they apply
for a patent, face bankruptcy, or become censored (i.e. all other exit outcomes are not considered).
Finally, we note that while bankruptcy represents a competing event to any exit or patenting outcome,
the reverse is not true: experiencing e.g., an IPO does not prevent from defaulting at a later date.
Therefore, we estimate a separate model for the probability of bankruptcy, which assumes the absence
of competing risks — i.e. start-ups are followed until they face bankruptcy, or become censored.
14
However, the approach in Giot and Schwienbacher (2007) is different from the one discussed here.
15
In this setting, exit outcomes other than the one under analysis will cause censoring in the survival data.
16
Note: this option is natively available in Stata via the vce(cluster ...) option of the stcrreg routine.
115 Descriptive statistics
We present and discuss in this section a series of descriptive statistics. As shown in section 4.1,
our final matched sample contains 274 VC-backed start-ups supported by the EIF as well as 274
counterfactuals that did not obtain VC financing in the years 2007-2014. We collect and assign exit
outcome, bankruptcy and patenting information following the approach discussed in section 3 and
Appendix A. Importantly, several data validation steps prevent us from misclassifying follow-on VC
investments as exit outcomes. We obtain a quarterly panel of start-ups whose first observed period
is the quarter of investment.17 Exit outcome and bankruptcy data are censored at the first quarter of
2020, i.e. following the date of the last observed exit deal.18 Patenting data, which tend to suffer
from a longer reporting lag, are instead censored at the second quarter of 2019.
As introduced in section 2.1, we are mainly concerned with four types of competing exit events:
merger and/or acquisition (M&A), initial public offering (IPO), other buy-out (e.g. institutional buy-out,
management buy-in/buy-out), and bankruptcy. Start-ups in the “no exit” category do not experience
any of the exit events during the observed period. Therefore, their time series become censored.
5.1 Primary exit outcomes
Table 4 provides summary statistics about the competing risks data for exit outcomes, by treatment
status. The majority of start-ups across both evaluation groups did not experience an exit event. This
was more often the case for counterfactual firms compared to EIF VC-backed start-ups (i.e. 51%
treated and 69% controls). Among the exit events, bankruptcy was the most frequent for both groups
(i.e. 24% for treated and 21% for controls). Treated firms had a slightly higher chance to experience a
bankruptcy. Accounting for the sample size, however, renders this difference not statistically significant.
M&A was the second most frequent exit outcome for both treated and control firms. The finding is
in line with Schwienbacher (2005), who documents the European venture firms’ preference to exit
via M&A. VC-backed start-ups supported by the EIF had a significantly higher chance to experience
an acquisition compared to their counterfactuals. In fact, more than two thirds of all M&As in our
sample were linked to VC-invested start-ups. Similarly, three times more IPOs were experienced by
VC investees compared to the counterfactuals. However, the relative incidence of IPOs was rather
small (i.e. 3% for treated and 1% for controls), which contributed to its weakly significant difference.19
Other buy-outs, rarely observed, showed no tangible difference across the two groups.20
Table 4 also provides averages and standard deviations of the time-to-exit, i.e. the time elapsed
from investment to exit date. Despite their higher likelihood to experience an exit outcome, start-
ups in the treatment group generally took longer to reach a non-bankruptcy exit stage compared to
counterfactuals. In particular, we observe statistically significant differences in the time-to-exit for M&A
and other buy-outs. This finding is consistent with the hypothesis that VC investors actively influence
17
The first observed period of a control firm is, in fact, the investment quarter of the matched treated firm.
18
We assume that any lag in the reporting of exit and bankruptcy data is exogenous to the treatment status.
19
Specifically, significant at 90% confidence level, but non-significant at 95% confidence level.
20
As noted in Prencipe (2017), this specific exit outcome might suffer from under-reporting bias. However,
we have no reason to believe that said bias should disproportionally affect either of the evaluation groups.
12You can also read