Semi-Annual Market Review - JULY 2019 - Healthcare Growth Partners
←
→
Page content transcription
If your browser does not render page correctly, please read the page content below

Semi-Annual
Market Review

HEALTH IT & HEALTH INFORMATION SERVICES   JULY 2019

www.hgp.com
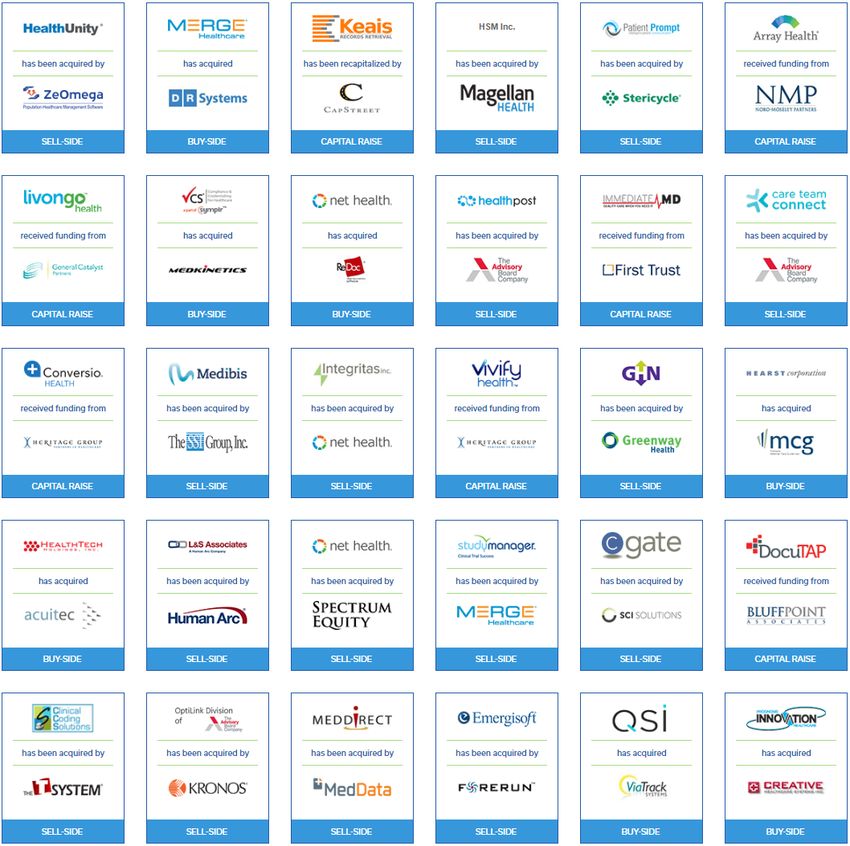
TABLE OF CONTENTS

        1        Health IT Executive Summary             3

        2        Health IT Market Trends                 6

        3        HIT M&A (Including Buyout)              9

        4        Health IT Capital Raises (Non-Buyout)   14

        5        Healthcare Capital Markets              15

        6        Macroeconomics                          19

        7        Health IT Headlines                     21

        8        About Healthcare Growth Partners        24

        9        HGP Transaction Experience              25

     10          Appendix A – M&A Highlights             28

     11          Appendix B – Buyout Highlights          31

     12          Appendix C – Investment Highlights      34

Copyright© 2019 Healthcare Growth Partners                    2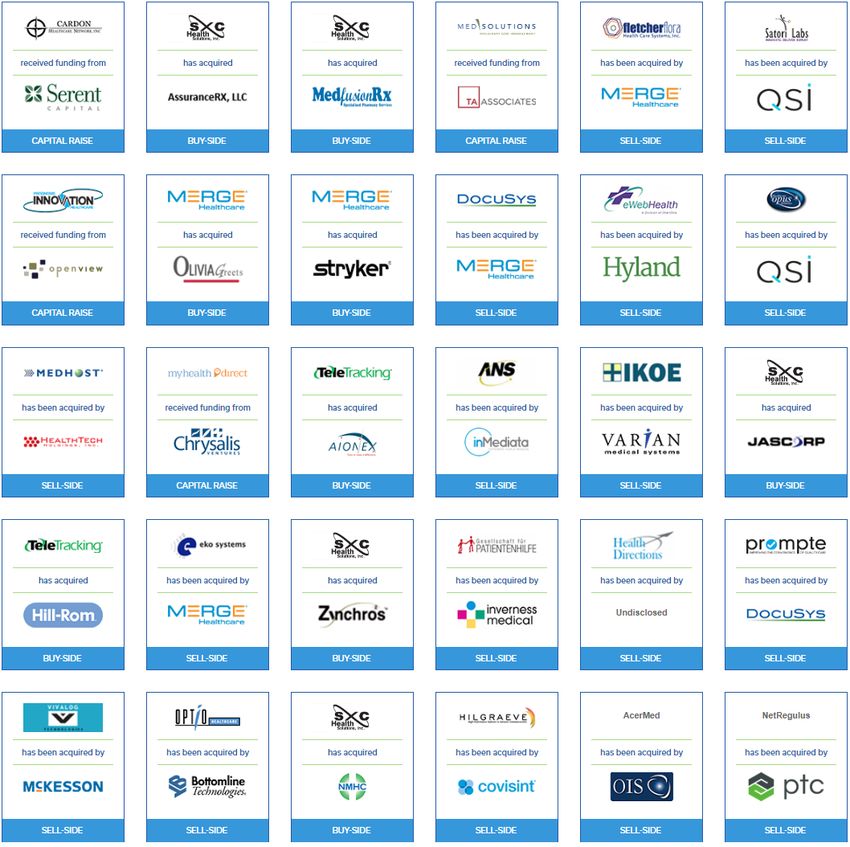
HEALTH IT EXECUTIVE SUMMARY                                                                         1
     An Accumulating Backlog of Disciplined Sellers
     Let’s chat about fireside chats. The term first used to describe a series of evening radio addresses
     given by U.S. President Franklin D. Roosevelt during the Great Depression and World War II is now
     investment banker speak for “soft launches” of sell-side and capital raise transactions. Every
     company has a price, and given a market of healthy valuations, more companies are testing the
     waters to find out whether they can achieve that price. That process now looks a little more
     informal, or how you might envision a fireside chat.
     Price (or valuation) discovery for a company can range from a single conversation with an individual
     buyer to a full-blown auction with hundreds of buyers and everything in between, including a fireside
     chat. Given the increasing share of informal conversations, the reality is that more companies are for
     sale than meets the eye.
     While the healthy valuations publicized and press-released are encouraging more and more
     companies to price shop, there is a simultaneous statistical phenomenon in perceived valuations that
     often goes unmentioned: survivorship bias. Survivorship bias is the logical error of concentrating on
     the information that made it past some selection process and overlooking the information that did
     not, typically because of a lack of visibility. What this bias does in the M&A market is lead to false
     conclusions around comparable valuations through a systemic selection bias towards high-profile,
     high-value deals. Why does survivorship bias matter in how we value companies? Simply put,
     companies are often valued based on perceptions of comparable transactions that closed and not on
     those that didn’t.

         Published
                                                                    The valuations we see are the deals
        Transaction
          Values                                                    that close, where, generally speaking, a
                                                                    higher quality seller achieves their
                                             Survivorship Bias
                                                                    asking price.

                    Transactions that Close

                         Companies that
                         “Go-to-Market”                             We don’t see and determine value
                                                                    from the deals that don’t close, where
                                                                    sellers, potentially of lower quality, do
                       “Fireside Chats” and                         not achieve their asking price.
                        Informal Processes

     As a result, survivorship bias of M&A valuation can inflate expectations for all sellers by basing value
     on higher quality companies with closable transactions, not just those who meet such a standard.

Copyright© 2019 Healthcare Growth Partners                                                                      3
HEALTH IT EXECUTIVE SUMMARY 1
Active HIT PE-Backed Investments by Most
PE-Backed Exits Recent Funding Year
60 350
52 54
50 300
38 250
40
30 31 200
31
30
150
20 13 100
10 50
0 0
2013 2014 2015 2016 2017 2018 2019 * 2014 2015 2016 2017 2018
Over the last five years, the number of US-based Health IT M&A (including buyout) transactions has
remained relatively steady at 300 deals per year. Of total Health IT M&A, less than 20% involve the
sale of a PE-backed company, and based on our 2019 data, this accounts for approximately 60 PE-
backed exit transactions per year. Going back to 2010, the accrued number of HIT PE-backed venture
and growth investments exceeds 1,200 companies that have yet to reach a liquidity event, implying a
significant backlog of companies that have yet to transact. Using a simple extrapolation and
assuming all companies exit, an accrual of 1,200 companies with 60 PE-backed companies trading
annually implies a 20-year backlog.
2019 Bootstrapped vs. PE-Backed Exits Based on 2019 data, 18% of US-based Health IT M&A
and buyout transactions involved a seller that had
PE-Backed, previously raised institutional venture capital or growth
18% equity in excess of $2mm, implying that 82% of Health
IT transactions involve bootstrapped sellers. PE-backed
companies generally have a higher valuation bar to
clear because the return requirements are based on the
Bootstrapped valuations of the prior funding rounds which are
82% generally higher since investment valuations tend to be
higher than M&A valuations.
With our unique lens into the market, HGP is witnessing an increasing volume of companies
undergoing some degree of exploration of a potential sale. Regardless of whether these companies
pursue informal conversations or hire an investment bank to run an auction, the higher volume of
M&A discussions is effectively reducing the close-rate of M&A transactions, thereby increasing the
statistical error of survivorship bias.
Fireside chats and informal sale processes are making an impact. In a report about the potential
disruption of investment banking, CB Insights wrote: “The last few years have seen a significant uptick
in the number of private M&As undertaken without the assistance of an investment bank. In 2015,
according to Dealogic, 26% of M&A deals worth $1B+ took place without outside financial advisors, a
13% increase from the year before.”
* Data annualized for 2019
Copyright© 2019 Healthcare Growth Partners 4HEALTH IT EXECUTIVE SUMMARY 1
The informal nature of many M&A discussions creates opportunities and challenges for both buyers
and sellers. In terms of opportunity, fireside chats can turn into preemptive transactions which allow
buyers and investors to transact outside of an auction, enabling both parties to get the deal done
quickly and efficiently. The challenge for buyers is that informal processes require proactive efforts
to get in front of transactions, and for sellers, the sheer volume of informal discussions means that
there are more companies competing for the attention and capital of buyers than meets the eye.
Why do companies pursue fireside chats or informal processes rather than hire an investment banker
to run an auction? Our response is that, in many cases, these companies intuitively know that the
valuation they’re seeking is a stretch and do not want to invest the resources into a full sale process
and the negative perception that may come with one that fails.
A fascinating takeaway is that valuations remain high in the face of a rising supply of transactable
companies, bucking basic economic theory. Sellers would rather not transact than accept a lower
price, and as such, the market remains in equilibrium from a valuation perspective. This balance
holds even though seller valuation expectations are often distorted based on the set of highly visible
transactions that close and not on those that aren’t publicized or don’t close at all.
To absorb the rising supply of Health IT companies, one or a combination of the following must occur:
1. Health IT sellers must perform at a level to meet the valuation expectations that are set
based on high performing transactions that close.
2. More buyers must enter the market to meet the rising supply of sellers.
3. Prices must come down.
Based on strong Health IT market fundamentals, we’re optimistic that the outcomes will be #1 and
#2, but we’re closely monitoring the data for early indicators of #3. Only time will tell.
Percent of PE Investments that Have Exited by Most
Recent Funding Date
45%
40%
35%
30%
25%
20%
15%
10%
5%
0%
2010 2011 2012 2013 2014 2015 2016 2017
Copyright© 2019 Healthcare Growth Partners 5HEALTH IT MARKET TRENDS 2
HGP keeps close tabs on M&A valuations to see how the market evolves over time. While we can
only draw data from deals we observe with disclosed multiples and therefore must be careful to
consider bias in any conclusions we draw from this data, we can still get a good sense for how the
market values companies within the different subsectors of Health IT. The following table and
accompanying box-and-whisker plot show the distributions of revenue multiples in 13 subsectors of
Health IT. The sectors were sorted according to median revenue multiple from largest to smallest.
Deals with Deals with EBITDA
Revenue Multiple
Reported Disclosed Disclosed Multiple
2014 – 1H 2019 Revenue EBITDA 25th 75th Std.
Multiples Multiples Median Mean Median
%-tile %-tile Deviation
Telemed 8 2 4.6x 7.8x 10.6x 7.7x 4.2x 18.1x
Clinical Trial Mgmt 6 4 2.6x 6.6x 7.6x 5.6x 2.9x 14.1x
Population Health 41 10 2.6x 4.3x 6.7x 6.1x 5.9x 14.2x
Analytics 18 8 3.0x 4.2x 5.0x 4.5x 2.4x 16.2x
Benefits Mgmt 16 2 2.4x 4.1x 6.0x 5.7x 5.7x 17.5x
Content 14 2 2.8x 3.8x 6.9x 5.0x 3.0x 11.2x
RCM Tech 20 15 2.8x 3.5x 6.1x 4.2x 2.1x 16.0x
PM/EMR 34 18 1.7x 3.5x 5.0x 3.6x 2.0x 14.0x
Infrastructure Tech 26 18 2.4x 3.4x 5.0x 3.7x 1.9x 10.8x
Utilization Mgmt 7 4 0.7x 2.5x 3.2x 2.7x 2.6x 10.4x
RCM Services 11 9 1.6x 2.3x 3.5x 2.4x 1.0x 9.6x
Consulting 18 9 1.2x 1.8x 2.4x 2.2x 1.4x 9.8x
Outsourced Services 17 10 1.2x 1.6x 2.7x 2.0x 1.2x 9.7x
We believe it’s important to keep dispersion in mind when assessing valuation data, which is why we
include the 25th percentile, 75th percentile, and standard deviation in our summary statistics. While
measures of central tendency like the median and mean are certainly indicative of how buyers are
valuing assets, the dispersion shows that with higher multiples, we also see higher risk. This becomes
especially apparent when we chart the data using a box-and-whisker plot. While telemedicine,
population health, and analytics see the highest median revenue multiples, these sectors also see a
large amount of variability and positive skew. For instance, while 25% of the observed population
health companies received 6.7x revenue or more in sale transactions during the period, another 25%
received less than 2.6x revenue at exit. Companies in these hot spaces cannot forget that they still
need to show strong operating metrics in order to recognize premium valuation multiples.
Of particular note this year, the median revenue multiples in the Telemedicine and Clinical Trial
Management sectors have jumped significantly from 5.6x and 4.5x to 7.8x and 6.6x respectively. We
attribute these increases partially to continued thesis-driven interest in these sectors, but also note
the relatively sparse data available on transactions in these spaces. With fewer than 10 revenue
multiples available in these two subsectors, the medians we are able to report are highly susceptible
to potential reporting bias and outlier data.
Copyright© 2019 Healthcare Growth Partners 6HEALTH IT MARKET TRENDS 2
The box-and-whisker plot graphically displays the Median, 25th Percentile, 75th Percentile,
Minimum, and Maximum; where points beyond 1.75 times the Inter-Quartile Range are shown as
outliers. The Inter-Quartile Range (blue columns) is the 75th Percentile minus the 25th Percentile and
serves to describe the variation in the range of outcomes. Note that point estimates such as the
mean or median can often be misleading on their own, as they do not convey the level of variability
which can be very high such as in the Telemedicine, Population Health, or Benefits Management
sectors.
The sectors were sorted according to decreasing median revenue multiple, and show a trend of
decreasing IQR as median revenue multiple decreases. Thus, while companies that fall within sectors
further to the right on the graph can expect a lower revenue multiple in a transaction, the transaction
is also much more predictable. A company that falls within a sector on the left, however, cannot
have as strong a confidence in their expected outcome. These observations follow a common theme
in investment theory: that with greater potential upside, there is also greater risk and volatility.
While the metrics presented here may be used as a guidepost for expected outcomes, the end result
often depends on buyer circumstances as much as on seller or market fundamentals, and buyer
circumstances tend to be extremely unpredictable. It is not uncommon for the clearing price of a
transaction to be significantly higher than the cover bids. This usually occurs when a buyer has
unique circumstances that justify a higher price than the rest of the buyer universe. Identifying those
buyers and appropriately positioning in relation to them is part of the art of running a successful
transaction process.
Copyright© 2019 Healthcare Growth Partners 7HEALTH IT MARKET TRENDS 2
The following table provides additional context on the valuation trends within each sector as well as a
sample of recent transactions within each.
Sector Description Representative Deals
Telemed (8 deals) Contains a mix of pure telemedicine PillPack (Amazon), Best Doctors
Median: 7.8x services and connected device (Teladoc), Advance Medical (Teladoc),
Std. Dev.: 4.2x transactions. Healthiest You (Teladoc)
Clinical Trial Mgmt (6 deals) Includes traditional CTMS vendors as Medidata (Dassault Systemes), Bracket
Median: 6.6x well as other vendors that deliver Global (Genstar Capital), Phlexglobal
Std. Dev.: 2.9x value in the clinical trial process. (Vitruvian Partners)
Analytics (18 deals) Primarily represents a mix of life Explorys (IBM), Truven (IBM), Strata
Median: 4.2x sciences and provider analytics, and (Roper), IMS (Quintiles),
Std. Dev.: 2.4x to a lesser extent, payer analytics. MedeAnalytics (Thoma Bravo)
Population Health Mgmt (41 deals) Comprised of patient engagement, Propeller Health (ResMed), Emmi
Median: 4.3x provider connectivity, and care (Wolters Kluwer), Press Ganey (EQT),
Std. Dev.: 6.1x management technologies. Wellcentive (Philips), Phytel (IBM)
Benefits Management (16 deals) Includes benefits management and Connecture (Francisco Partners),
Median: 4.1x admin software companies serving HealthX (JMI), Benaissance (WEX),
Std. Dev.: 5.7x payers and employers. bswift (Aetna), Matrix (Express Scripts)
Content (14 deals) Transactions are a mix of online WebMD (Internet Brands), Quantum
Median: 3.8x consumer content and provider- Health (Great Hill Partners), Everyday
Std. Dev.: 3.0x oriented clinical content. Health (j2 Global)
RCM Tech (20 deals) Includes tech-oriented RCM vendors InstaMed (JPMorgan), Cotiviti
Median: 3.5x serving hospitals and physicians, and (Verscend), ABILITY (Inovalon), Zirmed
Std. Dev.: 2.1x to a lesser extent, payers. (Navicure), Brightree (ResMed)
PM/EMR (34 deals) Includes ambulatory, acute, post- athenahealth (Veritas), Kinnser
Median: 3.5x acute, alternate site, and (Mediware), Mediware (TPG),
Std. Dev.: 2.0x departmental EMR/PM systems. Netsmart (Allscripts/GI), Merge (IBM)
Infrastructure Tech (26 deals) Compliance and resource Symplr (Clearlake), Datix (Rothschild),
Median: 3.4x management software generally Morrisey (HealthStream), CenTrak
Std. Dev.: 1.9x serving provider organizations. (Halma), VendorMate (GHX)
Utilization Mgmt (7 deals) Payer-oriented software and services New Century (Evolent), HealthHelp
Median: 2.5x vendors focused on traditional (WNS), Alere (Abbott), HSM & CDMI
Std. Dev.: 2.6x utilization management. (Magellan)
RCM Services (11 deals) Outsourced revenue cycle MedPartners (AMN), Intermedix (R1),
Median: 2.3x management services generally Anthelio (Atos), Cardon (MedData),
Std. Dev.: 1.0x serving hospitals and physicians. Equian (New Mountain)
Consulting (18 deals) Project-based IT consulting and staff Kinapse (Syneos), Advisory Board
Median: 1.8x augmentation companies generally (UnitedHealth), HCI Group (Tech
Std. Dev.: 1.4x serving provider organizations. Mahindra), CynergisTek (Auxilio)
Sedgwick & MedRisk (Carlyle Group),
Outsourced Services (17 deals) Includes non-RCM outsourced
InVentiv (INC Research) Patriot
Median: 1.6x services primarily serving payers as
National (Ebix), HealthPlan Holdings
Std. Dev.: 1.2x well as providers.
(Wipro)
Copyright© 2019 Healthcare Growth Partners 8HEALTH IT M&A (INCLUDING BUYOUT) 3
HGP has observed a number of tangible and intangible company and transaction characteristics that
typically define where a deal falls on the valuation distribution. Growth, profitability, and recurring
revenue are the most commonly identified factors used to justify valuation multiples. Not all health
IT companies capture premium valuations just because they operate in health IT. However, those
companies that offer a combination of growth, address an unmet need, and fit into the vision of
healthcare reform are seeing valuations significantly higher than historical patterns of activity.
Premium value is also created when a seller fulfills the specific needs of a buyer at a specific point in
time. Timing and serendipity are external factors that play a large and sometimes unpredictable role
in the creation of value.
HEALTH IT REVENUE MULTIPLES DISTRIBUTION
50%
40% Software
Services
30%
20%
10%
0%
0-1X 1-2X 2-3X 3-5X 5-7X 7-10X >10X
Among the many business and market characteristics that drive superior valuations, the following are
core components to healthcare IT businesses that have established themselves as outliers:
1 SaaS Architecture and Delivery 5 Reform-Centric Value Proposition
• Single database enabling robust analytics • Addresses healthcare structural flaws
• Delivery model that creates scale on the rather than take advantage of them in
cost side, and recurring revenue on the an effort to deliver sustainable change
top line in a policy-based environment
2 Pricing Alignment with ROI 6 Pricing Alignment with ROI
• Pricing methodology that aligns with • Market leadership (or opportunity to
customer ROI – the vendor wins when lead) creates favorable supply/demand
the customer wins characteristics at exit
• Large and growing market opportunity
3 Scalable Distribution Model
• Efficient distribution model (eg, customer
with strong financial characteristics
which include recurring revenue and
acquisition cost is less than total growth, inherent scalability if not
customer value) profitability, strong management, and
size
4 Data Rights
• Contract structures that contain explicit
rights to data
Copyright© 2019 Healthcare Growth Partners 9HEALTH IT M&A (INCLUDING BUYOUT) 3
The following chart summarizes annual M&A activity since 2014, according to the Healthcare Growth
Partners database.
$60,000 350
$905
$55,000 302
285 295 284 300
$50,000 274
$45,000
250
$40,000 $2,520 $1,090
Deal Value ($mm)
Deal Volume
$35,000 200
$771
$30,000 149
$25,000 150
$83
$20,000
$1,084 77 78 100
$15,000 70
47 51
$10,000 38
50
$5,000
$35,749 $14,014 $53,875 $28,978 $37,164 $19,783
$- 0
2014 2015 2016 2017 2018 1H-2019
Deal Value - US Deal Value - Non-US Deal Volume - US Deal Volume - Non-US
While deal valuation has remained healthy, the volume of Health IT M&A activity seems to have
leveled off since 2016, and 2019 is on-pace to continue that trend. After 372 transactions in 2017 and
362 transactions in 2018, we have seen a total of 187 transactions so far in 2019 which equates to
374 when annualized. Total transaction value tends to be much more volatile than deal volume since
it only takes one or two very large deals to skew the data and the majority of transactions do not
disclose value, thus HGP looks toward transaction volume as a better indicator of deal activity.
Generally, sub $100 million companies have three valuation inflection points: proof-of-concept,
Stage of Growth Chart (for Companies $20mm
20
Mature Scalability
Stage of Growth
15
Revenue $5-10mm
10
Growth Scalability
5
RevenueHEALTH IT M&A (INCLUDING BUYOUT) 3
Proof-of-concept is value created when a company shows that its product can be successfully sold
and deployed in a commercial setting. The proof-of-concept inflection point is generally of more
importance to venture investors than it is to acquirers, as companies at this stage tend to be too
immature to realize significant value through a sale. Growth scalability occurs when an earlier stage
company begins to show profitability or at least scale at high levels of growth, although the
organization is still small and lean. Mature scalability takes place after a company has matured to a
level where it takes on real infrastructure, and the company begins to show strong profitability after
building out a mature corporate organization.
Although the size of a company at each inflection point can vary significantly based on a company’s
product or services and sector, the general rule of thumb in health IT is that proof of concept occurs
at revenue of less than $1 million, growth scalability occurs in the $5 to $10 million revenue range,
and mature scalability occurs starting in the $20 million revenue range.
HIT Software Companies HIT Services Companies
Revenue EBITDA Transaction Revenue EBITDA Transaction
Multiple Multiple Value Multiple Multiple Value
# of Transactions 183 79 188 54 33 55
All
Median 3.9x 14.0x $ 137.60 1.9x 9.8x $ 170.00
Transactions
Mean 4.9x 15.3x $ 559.50 2.2x 10.8x $ 669.53
# of Transactions 47 10 45 13 8 13
$1B
Median 4.4x 15.8x $ 2,366.42 2.6x 15.5x $ 4,094.87
Transactions
Mean 5.1x 17.6x $ 3,559.46 2.7x 16.4x $ 3,871.85
Copyright© 2019 Healthcare Growth Partners 11HEALTH IT M&A (INCLUDING BUYOUT) 3
HIT Software Revenue Multiple Distribution by Target Enterprise Value
Percentile $1B
th
90 Percentile 7.3x 10.3x 8.5x 7.7x 8.5x
th
75 Percentile 4.5x 7.2x 6.1x 6.8x 7.0x
th
50 Percentile 2.4x 3.8x 4.3x 5.4x 4.4x
25th Percentile 1.6x 2.8x 2.9x 3.9x 3.4x
HIT Services Revenue Multiple Distribution by Target Enterprise Value
Percentile $1B
th
90 Percentile 2.4x 2.6x 5.7x nm nm
th
75 Percentile 2.0x 2.1x 3.6x 4.8x 3.3x
50th Percentile 1.4x 1.4x 2.1x 2.7x 2.6x
25th Percentile 1.1x 1.1x 1.6x 0.8x 2.3x
Continuing the analysis on the prior page, HGP evaluated the distribution of transaction size by target
enterprise value. HIT Software valuations experience a nice inflection above $30mm in value, which
steadily climbs until approximately the $1B valuation mark. HIT Services multiples experience a
similar inflection at $100mm, especially with higher percentile transactions. The inflection points are
in part due to a private equity universe that has expanded leverage capacity for larger transactions,
which in turn drives up valuation multiples.
In the first half of 2019, Healthcare Growth Partners monitored 187 health IT and related services
M&A transactions, compared to 362 transactions in 2018. In terms of aggregate deal dollar value,
HGP observed $19.9 billion of total transaction value so far in 2019, a value that puts the market on
track to exceed the $38.2 billion of total transaction value reported in 2018. The median revenue
multiple in 2019 so far is 4.9x for HIT Software, just below the 5.3x we saw in 2018. HIT Services
revenue multiples appear to be relatively flat compared to prior years as well, hovering just above
2.0x revenue.
Detailed annual trends can be found in the following bar chart. It should be noted that valuation
multiple trends can be very volatile given the limited availability of data. Refer to Appendices A and B
for a list of notable M&A and Buyout transactions in 1H 2019.
Copyright© 2019 Healthcare Growth Partners 12HEALTH IT M&A (INCLUDING BUYOUT) 3
MEDIAN M&A MULTIPLES 2010-2018
20.0X
15.6X 15.0X
14.0X 14.0X 14.0X 14.0X
Health IT Software
15.0X
10.0X
5.3X 4.9X
5.0X 3.7X 3.8X 3.9X 3.4X
0.0X
2014 2015 2016 2017 2018 2019
15.0X
Revenue EBITDA
Health IT Services
10.0X 10.0X 10.2X
9.6X
10.0X 9.0X
5.0X
2.0X 1.9X 2.4X 2.1X
1.8X
1.2X
0.0X
2014 2015 2016 2017 2018 2019*
Revenue EBITDA
*insufficient data to display 2019 EBITDA multiples.
It is important to note that transaction multiples are based on trailing-twelve-month financial
information, assume the achievement of all contingent consideration, such as earnouts, and most
EBITDA multiples do not include any adjustments for unusual items. It is also important to note that
less than one-third of transactions contain a disclosed multiple, therefore the multiple data
represents only a portion of the overall transaction activity.
HIT M&A DEALS BY QUARTER
120
100
103 106 101
97 99 97 95 96
80 90 93 89 91
85 86 84 81 86
77 76 79
60 71 68
40
20
0
Qtr1 Qtr2 Qtr3 Qtr4 Qtr1 Qtr2 Qtr3 Qtr4 Qtr1 Qtr2 Qtr3 Qtr4 Qtr1 Qtr2 Qtr3 Qtr4 Qtr1 Qtr2 Qtr3 Qtr4 Qtr1 Qtr2
2014 2015 2016 2017 2018 2019
Copyright© 2019 Healthcare Growth Partners 13HEALTH IT CAPITAL RAISES (NON-BUYOUT) 4
The chart below summarizes quarterly private-equity and venture capital activity in Health IT and
related services since 2014 according to the Healthcare Growth Partners database. The data below
and in this section do not include buyout private equity activity. In the first half of 2019, Healthcare
Growth Partners monitored 400 capital raise transactions amounting to nearly $9 billion in value
which is on-track to meet or exceed 2018’s $16.4 billion and 797 transactions.
HIT INVESTMENT ACTIVITY
$18,000 600
537
$16,000
$5,774 500
$14,000
411
Deal Value ($mm)
$12,000 362 361 400
Deal Volume
313
$10,000 $3,181 $2,928
254 260 300
$8,000
$2,372 271
$996
$6,000 200
$846 $6,186 133 $5,985
$4,000
$4,572 66
$10,650 129 100
$5,644 $7,464
$2,000
71
$- 0
2014 2015 2016 2017 2018 1H-2019
Deal Value - US Deal Value - Non-US Deal Volume - US Deal Volume - Non-US
HIT INVESTMENT DEALS BY QUARTER
250
239
200 226
202 196
189 189
150 174
155 154 155
100 134 128
117 122 115 107
100 92 101 97
88
50 74
0
Qtr1 Qtr2 Qtr3 Qtr4 Qtr1 Qtr2 Qtr3 Qtr4 Qtr1 Qtr2 Qtr3 Qtr4 Qtr1 Qtr2 Qtr3 Qtr4 Qtr1 Qtr2 Qtr3 Qtr4 Qtr1 Qtr2
2014 2015 2016 2017 2018 2019
Refer to Appendix C for a list of notable non-buyout capital raises in 1H 2019.
Copyright© 2019 Healthcare Growth Partners 14HEALTHCARE CAPITAL MARKETS 5
HGP tracks a basket of stock indices within health IT and closely related sectors. It is important to
consider sectors outside of pure “HIT” because the universe of health IT and related services
encompasses many companies that share similar characteristics to other healthcare sectors. What
classifies a company in the universe of health IT and related services, and ideally creates a valuation
premium, is a strong information technology and data component that creates scalability and
competitive strength. This is particularly relevant to services organizations that use technology and
data analytics to streamline their operations. With this in mind, HGP considered six sectors when
evaluating the performance of publicly traded companies – details of the components of these
sectors can be found on page 18.
Despite the increased anxiety over slowing economic growth, geopolitical tensions, and escalating
trade wars, the US market unexpectedly experienced its best first half since 1997. While the HIT,
CRO, and HIT & Payer Services Indices tracked closely to the S&P 500, both the Payers and Healthcare
Services Indices experienced low returns of 2.3% and 7.5%, respectively. Strikingly, the Payers Index
which was the leader in 2019 was outperformed by all but the PBM Index. Consistent with historical
trends, the PBM Index which has been in the crosshairs of both increased regulatory and competitive
moves, was the largest decliner, falling a record 26.9% over the period. The chart and the table on
the following page summarize the performance of the HGP Health IT and Services indices in 1H 2019.
HIT & RELATED INDEX PERFORMANCE 1H 2019
Jan 31. – Trump administration April 7 – CMS expands Medicare May 9 – Trump announces plans to allow
pitches an end to certain drug rebates Advantage coverage to telehealth US states to buy medicine abroad
March 26 – White House says it will April 22 – CMS announces plans to May 15 – White House announces plans
ask a court to throw out Obamacare launch direct-contracting pay models to increase healthcare price transparency
30%
20%
CRO
10% Health IT
0% Payers
-10% PBM
Healthcare Services
-20%
HIT & Payer Services
-30%
S&P 500
-40%
12/31/18 3/31/19 6/30/19
1H 2019 Index Performance
S&P 500 17.3% HIT 19.7% Healthcare Services 7.5%
NASDAQ 20.7% Payers 2.3% HIT & Payer Services 16.6%
CRO 24.1% PBM -26.9%
Copyright© 2019 Healthcare Growth Partners 15HEALTHCARE CAPITAL MARKETS 5
HIT INDEX PERFORMANCE DETAIL – 1H 2019
Share Price EV/ EV/ Share Price EV/ EV/
Company Company
% Change Rev EBITDA % Change Rev EBITDA
Allscripts Healthcare
20.6% 1.4X 7.8X IQVIA 38.5% 3.8X 16.1X
Solutions
Benefitfocus -40.6% 3.2X 29.9X iRhythm Technologies 13.8% 9.0X NMF
Care.com -43.1% 1.3X 9.1X Medidata Solutions 34.2% 7.6X 26.3X
Castlight Health 48.8% 2.6X NMF MINDBODY 0.2% NA NA
Cerner 39.8% 4.1X 12.5X Model N 47.4% 4.6X NMF
Change Healthcare* -2.7% 1.8X 5.9X NantHealth -3.4% 2.6X NMF
Computer Programs &
10.7% 1.9X 9.6X NextGen Healthcare 31.4% 1.9X 13.5X
Systems
ehealth 124.1% 5.7X 23.4X NRC Health 51.0% 11.0X NA
Evolent Health -60.2% 1.0X 14.3X Omnicell 40.5% 4.1X 19.9X
Fitbit -11.5% 0.3X 28.6X Premier 4.7% 2.8X 8.2X
Health Insurance
-3.0% 1.0X 4.9X Roper Technologies 37.4% 7.9X 21.5X
Innovations
HealthEquity 9.6% 15.2X 26.8X Simulations Plus 43.5% 14.7X NA
Streamline Health
HealthStream 7.1% 2.7X 18.0X 86.4% 1.0X 9.2X
Solutions
Hms Holdings 15.1% 4.6X 15.0X Tabula Rasa Healthcare -21.7% 4.5X 22.5X
Inovalon Holdings 2.3% 4.8X 13.3X Teladoc 34.0% 8.8X NMF
Invitae 112.5% 9.0X NMF
Multiples based off 2019E Revenue and EBITDA
*Multiples for Change Healthcare based off 9 months ended 12/31/2018
INDEX VALUATION MULTIPLES
Revenue Multiples EBITDA Multiples
Sector 2019E 2020E 2019E 2020E Valuation multiples across the
Health IT 4.1X 3.7X 15.4X 15.0X healthcare sector remain strong.
CRO 2.9X 2.7X 14.1X 12.5X The HIT and CRO sectors receive
the most significant valuation
Payers 0.6X 0.5X 9.9X 8.6X
premiums over the rest of the
PBM 0.5X 0.5X 10.3X 9.9X
market.
Healthcare Services 1.4X 1.4X 9.2X 8.6X
HIT & Payer Services 1.4X 1.2X 9.8X 8.8X
Copyright© 2019 Healthcare Growth Partners 16HEALTHCARE CAPITAL MARKETS 5
HEALTH IT IPOS
Change Healthcare’s shares hit the market on June 27, 2019, marking the end of the Health IT IPO
drought. Following nine IPOs in 2014 (Care.com, IMS, Castlight, Everyday Health, Medical
Transcription Billing, Imprivata, HealthEquity, Connecture, Orion), eight IPOs in 2015 (Inovalon, Press
Ganey, Teladoc, Evolent, Invitae, Fitbit, Mindbody, Adherium) and five IPOs in 2016 (Tabula Rosa,
Oneview, Cotiviti, NantHealth, iRhythm), not a single health IT IPO issued in 2017 or 2018. After two
years of inactivity, all eyes are on the four Health IT companies gearing up to hit the markets along
with Change – Health Catalyst, Peloton, Phreesia, and Livongo.
• The wave of IPOs began with Change Healthcare’s filing at the end of March. The healthcare data
analytics company debuted on the Nasdaq on June 27th and aimed to raise $1.2 billion, though fell
slightly below target with shares trading at $13.94 in the afternoon of its first day. The Company
earned $367 million on revenue of $2.45 billion for the 9-months ended December 31, 2018 and
plans on using the proceeds from the IPO to pay down a portion of its $5.8 billion in debt.
• Health Catalyst, a healthcare data warehousing and analytics company, filed for an IPO in late
April. The Company has raised approximately $391 million and is reportedly planning to raise $150
million to $200mm under the ticker symbol “HCAT” in the Nasdaq.
• Connected fitness bike maker Peloton confidentially filed for their IPO in June. Peloton has raised
almost $1 billion in funding and was most recently valued at $4.15 billion after its latest funding
round. The Company has not yet released the price and number of shares to be offered. Peloton is
reportedly facing a lawsuit over their use of music which is expected to slow their IPO.
• Phreesia, a patient check-in software company, filed its S-1 form with the SEC in late Jun. Per the
filing, the Company is planning on a $125 million public offering under the ticker “PHR” on the
New York Stock Exchange. Phreesia has raised over $100 million and has facilitated more than 54
million patient visits for approximately 50,000 individual providers.
• In late June, chronic condition management company Livongo Health officially filed for its IPO.
Livongo’s S-1 lists an impressive Q1 revenue of $32.1 million (a 157% increase from $12.5 million
from the same period last year) and early reports suggest the Company is eyeing a $1 billion+
valuation. The Company has raised over $200 million and was most recently valued at $805
million.
Copyright© 2019 Healthcare Growth Partners 17HEALTHCARE CAPITAL MARKETS 5
As discussed previously, HGP tracks six indices across the health IT and services sectors. The
components of each index are listed below. Each index is based on an equal-weighted portfolio.
Sector Components
Health IT (HIT) – Constituents HIT & Payer Services – Constituents
Allscripts – NAS:MDRX DXC Technology – NYS:DXC
Benefitfocus – NAS:BNFT Conduent – NYS:CNDT
Care.com – NYS:CRCM Huron Consulting Group – NAS:HURN
Castlight Health – NYS:CSLT CBIZ – NYS:CBZ
Cerner – NAS:CERN Kforce – NAS:KFRC
Change Healthcare – NAS:CHNG Navigant Consulting – NYS:NCI
Computer Programs & Systems – NAS:CPSI Accenture – NYS:ACN
ehealth – NAS:EHTH CACI International – NYS:CACI
Evolent Health – NYS:EVH Corvel – NAS:CRVL
Fitbit – NYS:FIT Tivity Health – NAS:TVTY
Health Insurance Innovations – NAS:HIIQ Magellan Health – NAS:MGLN
HealthEquity – NAS:HQY WageWorks – NYS:WAGE
HealthStream – NAS:HSTM
Hms Holdings – NAS:HMSY PBMs – Constituents
Inovalon Holdings – NAS:INOV BioScrip – NAS:BIOS
Invitae – NYS:NVTA CVS Health – NYS:CVS
IQVIA – NYS:IQV Rite Aid – NYS:RAD
iRhythm Technologies – NAS:IRTC Walgreens Boots Alliance – NAS:WBA
Medidata Solutions – NAS:MDSO
MINDBODY – NAS:MB [Acquired 2/15/2019] Healthcare Services – Constituents
Model N – NYS:MODN Amedisys – NAS:AMED
NantHealth – NAS:NH Brookdale Senior Living – NYS:BKD
NextGen – NAS:NXGN Civitas Solutions – NYS:CIVI [Acquired 3/8/19]
NRC Health – NAS:NRC Community Health Systems – NYS:CYH
Omnicell – NAS:OMCL Encompass Health Corp – NYS:EHC
Premier – NAS:PINC HCA Management Services – NYS:HCA
Roper Technologies – NYS:ROP Laboratory Corporation of America Holdings – NYS:LH
Simulations Plus – NAS:SLP Mednax – NYS:MD
Streamline Health Solutions – NAS:STRM Quest Diagnostics – NYS:DGX
Tabula Rasa Healthcare – NAS:TRHC Select Medical Holdings – NYS:SEM
Teladoc – NYS:TDOC Tenet Healthcare – NYS:THC
Veeva Systems – NYS:VEEV Universal Health Services – NYS:UHS
Vocera Communications – NYS:VCRA
CROs – Constituents
Payers – Constituents Charles River Laboratories International – NYS:CRL
Anthem – NYS:ANTM Icon – NAS:ICLR
Centene – NYS:CNC IQVIA – NYS:IQV
Cigna – NYS:CI PRA Health Sciences – NAS:PRAH
Humana – NYS:HUM Syneos Health – NAS:SYNH
Molina Healthcare – NYS:MOH
UnitedHealth Group – NYS:UNH
WellCare – NYS:WCG
Copyright© 2019 Healthcare Growth Partners 18MACROECONOMICS 6
So far in 2019, stock markets have experienced an incredible rally and completely reversed 2018’s end
of year sell-off to yield the best performance in the first six months of the year in more than two
decades. Much of the return in the first half was generated in Q1 which yielded 13.6% before renewed
trade tensions began to escalate between the United States and China in May. Further, as concerns
over yield curve inversion and tariffs on Chinese goods caused some to hesitate in May, the Dow Jones
Index posted its best return in June since 1955 to end the half up over 17% since the start of the year.
The technology sector led the market rally as it typically does with returns of 26% in the first-half despite
the significant impact of trade tensions with China. Many attribute credit for the rally to the Fed, who
ceased to increase rates in January and indicated that it may choose to cut rates in the second half of
the year.
What is interesting about this rally on Wall Street is the simultaneous negative forces working against it:
we’ve seen noteworthy slowing of global economic growth, rising geopolitical tensions not only between
the United States and China but also in Iran and the Middle East, and Britain repeatedly stumble in its
efforts to exit the European Union. Additionally, rising wages are expected to put pressure on profits in
the coming quarters and corporate debt levels are continuing to creep ever higher as the bull market
stretches into one of the longest in history at over 10 years since the market bottomed out on March 6,
2009.
Q2 2019 saw additional expected earnings decline compared to Q4 2018, with 87 companies issuing
negative earnings guidance out of the 113 S&P 500 companies that issued EPS guidance over the
quarter. The estimated earnings decline for the quarter was -2.6%, coming off of an actual earnings
decline in Q1 of -0.4%. Q1 marked the first year-over-year decline in earnings for the S&P 500 index
since Q2 2016 when earnings declined -3.2%.
1H-2019 US STOCK MARKET PERFORMANCE
25.0%
20.0%
15.0%
10.0%
5.0%
0.0%
DJIA S&P 500 Nasdaq
-5.0%
12/31/2018 3/31/2019 6/30/2019
Copyright© 2019 Healthcare Growth Partners 19MACROECONOMICS 6
The US IPO market on the whole was relatively flat year-over-year, however was notable for having
some big-name tech IPOs including Uber, Lyft, and Pinterest. According to Ernst and Young, the US
NASDAQ and NYSE saw a total of 88 IPOs raising $32.2 billion in proceeds. This is down approximately
20% in total number of IPOs compared to first-half 2018, and approximately even in terms of total
capital raised compared to that of 2018. Out of the $32.2 billion raised in the US market, a substantial
$19 billion went to tech companies according to the data provider Dealogic.
Worst IPO performers include Uber and Lyft who have both spent significant time trading below their
IPO prices. Best performers include Beyond Meat whose shares are up more than 500 percent as well
as PagerDuty, Zoom Video, and CrowdStrike whose prices have more than doubled from their IPO
prices. Slack notably chose to follow Spotify’s lead from last year and pursue a direct-listing rather than
a more traditional IPO. So far, Slack’s shares have been well-received by the market.
M&A deal activity has been strong thus far in 2019, with a total announced deal value of $1.1 trillion.
This represents a 20% increase from a year ago and the first time U.S. deal value crossed the $1 trillion
mark during the first six months of the year. Notably, the proposed $86 billion merger of United
Technology and Raytheon was the largest deal of the year, followed by Bristol-Myers Squibb’s
acquisition of Celgene and AbbVie’s planned purchase of Allergan.
So far in 2019, the venture industry has enjoyed some well-deserved exits with 34 venture-backed IPOs.
This has relieved liquidity pressure on the industry that had been building up over the past few years
with so many VC-backed companies electing to stay private longer. Venture funds and LPs can now
recognize their gains in these high-profile companies and reinvest the resulting liquidity in new venture
efforts.
NVCA’s Venture Monitor noted two major trends: insatiable market appetite for life sciences businesses,
and positive momentum in investment in female-founded companies. A recent survey conducted by
NVCA and Deloitte found that women comprised 14% of investment partners in the venture industry in
2018, compared with 11% in 2016. While this is still low, it is good to see a positive trend in female
participation in venture capital.
2019 venture capital investment is on pace to match 2018’s record year, with $66 billion deployed
across 4,868 US venture deals in the first half. Of note, the number of rounds with invested capital in
excess of $100 million (“mega-deals”) has exploded, with 208 such deals in 2018 compared to only 36 in
2013. 2019 is on pace to exceed 2018’s record with 123 recorded deals in excess of $100 million.
Overall, 2019 has gotten off to a great start and seems to be keeping pace from a record-setting year in
2018.
Copyright© 2019 Healthcare Growth Partners 20HEALTH IT HEADLINES 7
Notable headlines from 1H 2019 are outlined in the following pages on a quarterly basis. The
headlines in 1H 2019 illustrate the significant influence that policy and regulatory intervention has on
the incentives that dictate health IT investment and innovation trends, the increasing vertical
integration across healthcare, and the expanding presence of non-traditional companies in the health
IT market.
Q1 HEADLINES
Walgreens Boots Alliance and Microsoft form digital health link
Walgreens Boots Alliance and Microsoft have entered a seven-year agreement to form a strategic
partnership to build digital healthcare solutions. The companies say they are joining forces to develop
new healthcare delivery models, technology and retail innovations. The intent is to combine
Microsoft’s Azure cloud and AI platform—as well as its ability to make healthcare investments and
retail solutions—with Walgreens’ customer reach, retail pharmacy locations, outpatient services and
industry expertise.
Aetna, other health insurers team up with IBM on blockchain project
A group of health insurers is collaborating with IBM to develop a blockchain network to process
claims and payments, maintain directories, and improve administrative efficiency and cost
management in the industry. Anthem, Health Care Service Corp., CVS Health's Aetna and PNC Bank
are all involved in the network.
In bold new proposal, Trump administration pitches an end to certain drug rebates
The Trump administration on Thursday put forth a long-awaited proposal to eliminate certain rebates
drug makers pay insurance companies in Medicare, a move it says will ultimately lower prescription
drug prices — and one that stands to upend the complicated structure for how drugs are priced in
the U.S.
Greenway to Pay $57.25M for False EHR Certification Allegations
Greenway Health LLC has agreed to pay $57.25 million to resolve complaints that its “Prime Suite”
EHR product caused users to submit false information to the EHR Incentive Programs. The federal
government has also accused the company of falsely obtaining 2014 Edition Certified EHR Technology
(CEHRT) status. The allegations claimed that Greenway misrepresented the capabilities of its product
to customers and provided unlawful remuneration to users for positive recommendations to peers,
violating the Anti-Kickback Statute.
CVS unveils HealthHub store design
CVS Health has unveiled three redesigned health-focused concept stores in the Houston market. The
pilot stores, called HealthHubs, have space for services to help customers manage such chronic
conditions as diabetes, hypertension and asthma. Each store also has an expanded health clinic with a
lab for blood testing and health screenings. The stores will have respiratory specialists and dietitians
on staff. Beyond those services, there are also wellness rooms equipped to handle yoga classes and
seminars. The stores, part of the company's vision in acquiring health insurer Aetna, are designed to
help the pharmacy chain become more of a convenient healthcare provider.
Copyright© 2019 Healthcare Growth Partners 21HEALTH IT HEADLINES 7
HHS unwraps long-awaited new information blocking rule
The rule issued by the Office of the National Coordinator for Health Information Technology involves
the patient, not as a person being “acted upon,” said Elise Sweeney Anthony, director of Office of
Policy for the ONC, but as someone in control of his or her electronic health records. If a patient
requests their record, and it’s not given to them electronically and for free, that’s information
blocking, Sweeney said during HIMSS19. The Centers for Medicare and Medicaid Services would also
require that healthcare providers and plans implement open data sharing technologies to support
transitions of care as patients move between these plan types. For instance, the records must be
able to be transferred between providers when a patient requests that service when changing
physicians.
HHS unveils new payment model for ambulance service providers
HHS unveiled a payment model that will reimburse ambulance services for transporting patients to
facilities such as urgent care centers or physician's offices instead of emergency departments, as well
as enabling them to work with a health care provider to use telemedicine for onsite care. The model,
called Emergency Triage, Treat and Transport, or ET3, is designed to reduce unnecessary
hospitalizations and is expected to run for five years starting next year.
The end for Obamacare? Trump administration says it will ask a court to throw out entire law
The Justice Department won’t dispute a federal court’s decision that the Affordable Care Act is
unconstitutional and should therefore be eliminated in its entirety. This two-sentence announcement
represents a position shift from earlier arguments in which the Trump administration advocated
striking down only certain of ACA’s consumer protections, such as the requirement that insurers
cover pre-existing conditions. A group of Republican governors sued the federal government after
Congress eliminated the penalty for not buying health insurance, arguing that the decision renders
the entire ACA unconstitutional, a position with which the federal government now agrees.
Centene to purchase WellCare in $17.3B deal
Centene Corporation will purchase rival insurer WellCare Health Plans in a deal valued at $17.3
billion, the companies announced early Wednesday. The acquisition has been unanimously approved
by both boards, according to the announcement. Should the deal be finalized, the joint company
would include 22 million members across all 50 states and combined estimated revenue of $97 billion
in 2019. The deal will create one of the largest sponsors of government plans across the three main
markets: Medicare, Medicaid and the Affordable Care Act exchanges, the insurers said on a call with
investors Wednesday morning. Post-merger, the joint company would be the nation's biggest sponsor
of Medicaid managed care and exchange plans, and the fourth-largest payer in the private Medicare
space, including Medicare Advantage, supplemental coverage and Part D plans.
Q2 HEADLINES
CMS expands Medicare Advantage coverage of telehealth services
As part of efforts by CMS to increase technological innovation and boost competition among
Medicare Advantage plans, the agency is moving to expand the range of beneficiaries eligible for
telemedicine benefits. The new rule, which will go into effect in the 2020 plan year, will allow
Medicare Advantage to offer telehealth services as part of their basic benefits package, providing
patients more options to receive healthcare services from locations like their home.
Copyright© 2019 Healthcare Growth Partners 22HEALTH IT HEADLINES 7
Amazon adds HIPAA compliance to Alexa Skills, opening door for secure health apps
Amazon’s Alexa voice assistant has a new trick: transmitting secure patient information between
patients and caregivers. Developers can now use the Alexa Skills Kit to build HIPAA-compliant apps,
opening the door for hospitals, insurers, digital health startups and others to manage patient data
through voice.
CMS to launch new direct-contracting pay models in 2020
HHS Secretary Alex Azar announced a new initiative to transition primary care practices from fee-for-
service payments to a voluntary, value-based model. The CMS Primary Cares Initiative, which will be
piloted next year, will offer providers five payment models under two paths that focus on chronically
and seriously ill beneficiaries.
HHS to cap HIPAA fines based on 'culpability’
HHS updated the maximum it will penalize providers, health plans and their business associates in the
wake of HIPAA violations, in some cases dropping the upper limit by more than $1 million. The new
system sets annual limits for these fines based on the organization's "level of culpability" associated
with the HIPAA violation, according to the department's notice of enforcement discretion. That
means organizations that have taken measures to meet HIPAA's requirements will face a much
smaller maximum penalty than those who are found neglectful.
Trump slams drug makers, vows to let U.S. states buy cheaper medicines abroad
The Trump administration announced they are working to allow U.S. states to buy prescription drugs
from other countries if the medications cost less. "We will allow them, with certain permissions, to go
to other countries if they can buy them for 40, 50, 60 percent less," Trump said at a White House
event on hospital billing.
HHS White House Wants Patients to Know Health-Care Prices Up Front
The Trump administration has been working behind the scenes for months on a strategy to force
greater price disclosure across much of the $3.5 trillion health-care industry. The Administration
wants to require up-front disclosure of prices patients will pay for treatment as well as rates insurers
negotiate with providers.
House Hearing Outlines Competing Solutions to Surprise Medical Bills
Legislation to address surprise medical bills must center on the patient, protecting patients from
having to take part in mitigating extraordinarily high medical bills. Such was the conclusion of a House
Ways and Means Committee hearing on the matter, although little other consensus was reached.
Change Healthcare's shares debut on the NASDAQ
A new ticker symbol is now trading on the Nasdaq: CHNG. The Nashville, Tennessee health tech
company sold its shares to the public at the IPO price of $13 a share raising nearly $800 million and
celebrated its market debut by ringing the closing bell at the Nasdaq Market Site.
U.S. federal court delays adoption of healthcare rule on abortion
The U.S. Department of Health and Human Services (HHS) and its opponents in a California lawsuit
agreed on Friday to delay implementing a rule that would allow medical workers to decline
performing abortions or other treatments on moral or religious grounds, according to a federal court
filing.
Copyright© 2019 Healthcare Growth Partners 23ABOUT HEALTHCARE GROWTH PARTNERS 8
Healthcare Growth Partners (HGP) is an exceptionally experienced Investment Banking & Strategic
Advisory firm exclusively focused on the transformational Health IT market. We unlock value for our
clients through our Sell-Side Advisory, Buy-Side Advisory, Capital Advisory, and Pre-Transaction
Growth Strategy services, functioning as the exclusive investment banking advisor to over 100 health
IT transactions representing over $2 billion in value since 2007.
Our passion for healthcare inspires us to not only create value for our clients, but to also generate
broad, overarching improvements to the functionality and sustainability of health. With our focus, we
deliver knowledgeable, honest and customized guidance to select clients looking to execute high
value health IT, health information services, and digital health transactions.
CONTACT INFORMATION
Christopher McCord
Managing Director
chris@hgp.com
2001 Kirby Drive, Suite 814
Houston, TX 77019
(713) 955-7935
www.hgp.com
Securities offered through HGP Securities, LLC, member FINRA & SIPC, broker-dealer affiliate of Healthcare
Growth Partners, LLC.
Sources of Information:
CMS, CNBC, company press releases, company SEC filings, Dealogic, Ernst and Young, FactSet, FierceHealthcare,
Health Data Management, Healthcare Growth Partners database, HealthLeaders Media, HIStalk, Mercom
Capital Group, Modern Healthcare, The New York Times, Mergermarket, NVCA, Pitchbook, Rock Health, StartUp
Health, and The Wall Street Journal.
These statistics are presented for informational purposes only. While the information presented has been
obtained from sources deemed to be reliable, no representation or warranty, express or implied, is made as to
the accuracy or completeness of such information.
Copyright© 2019 Healthcare Growth Partners 24HGP TRANSACTION EXPERIENCE 9 Copyright© 2019 Healthcare Growth Partners 25
HGP TRANSACTION EXPERIENCE   9

Copyright© 2019 Healthcare Growth Partners                                    26
HGP TRANSACTION EXPERIENCE   9

Copyright© 2019 Healthcare Growth Partners                                    27
APPENDIX A                                                                                                               10
     Strategic M&A Highlights
                                                                                                                              Deal Size
 Quarter      Acquiror            Seller                                   Seller Description
                                                                                                                               ($mm)
               AMN                             Provider of a healthcare credentialing platform intended to help healthcare
   Q1        Healthcare        Silversheet        facilities and medical professionals connect and work together more            na
              Services                                                          efficiently.
   Q1        Medsphere         HealthLine
                                                Provider of Healthcare inventory and supply chain management services.           na
              Systems          Solutions
   Q1                                           A comprehensive consumer-centric patient engagement and healthcare
            Healthgrades    Influence Health                                                                                     na
                                                                            collaboration portal.
   Q1                                               Provider of background investigation services including healthcare
                  Cisive        PreCheck                                                                                         na
                                                       background screening, credentialing and program integrity.
   Q1                       Castle Connolly Provider of a medical platform designed to help patients find information
           Everyday Health                                                                                                       na
                              Top Doctors               regarding physicians, hospitals, and medical care centers.
                                                 Provider of employee benefits administration services. The company's
   Q1                                            products include health savings accounts, flexible spending accounts,
                  WEX      Discovery Benefits                                                                                   $425
                                                health reimbursement arrangements, commuter benefits, and other tax
                                                                            advantage accounts.
   Q1           NexTech                            Provider of electronic health record technology and services to the
                               SRS Health                                                                                        na
                Systems                                                      healthcare industry.
   Q1                        Geneva Health      Developer of remote monitoring platform designed to facilitate remote
             BioTelemetry                                                                                                       $65
                                Solutions                           cardiac patient care and monitoring.
                                                    Provider of remote health monitoring and response solutions. The
   Q1           Connect
                           Tunstall Americas       company's integrated care platform offers a suite of remote patient           na
                America
                                                                            monitoring software.
   Q1                       Aprima Medical Provider of electronic health record, practice management, and revenue
                  eMDs                                                                                                           na
                                Software                    cycle management solutions for medical practices.
                                              Provider of mobile and web-based behavioral health solutions for prevalent
   Q1       Livongo Health    myStrength        health conditions that include depression, anxiety, stress, substance use       $10
                                                                disorder, chronic pain, and sleep disorders.
   Q1                        Lightning Bolt    Developer of an artificial intelligence optimized physician shift scheduling
             PerfectServe                                                                                                        na
                                Solutions                                        technology.
                N. Harris
   Q1                                             Provider of electronic health record, virtual care, and interoperability
               Computer    Collain Healthcare                                                                                    na
                                                         solutions for the long-term and post-acute care industry.
              Corporation
   Q1                        API Healthcare         Developer of a labor resource management software intended for
                 symplr                                                                                                         $300
                              Corporation                                healthcare organizations.
   Q1                         Health Care
                WellSky                           Provider of clinical and financial software for long-term care settings.       na
                                Software
              Medsphere
   Q1                                            Developer and provider of information management software for the
                Systems         Wellsoft                                                                                         na
                                                                          Emergency Department.
              Corporation
   Q1         Tabula Rasa                       Developer of a cloud-based patient relationship management software
                           PrescribeWellness                                                                                    $150
              Healthcare                                          designed to collect data for pharmacies.
   Q1                                           Developer of a digital mental therapy platform intended to treat anxiety
                 AbleTo          Joyable                                                                                         na
                                                                               and depression.
   Q1                                          Developer of hospital point-of-care communications software technology
                Hill-Rom          Voalte                                                                                        $195
                                                 designed to answer any type of healthcare communication challenges.

Copyright© 2019 Healthcare Growth Partners                                                                                             28
APPENDIX A – M&A HIGHLIGHTS 10
Deal Size
Quarter Acquiror Seller Seller Description
($mm)
Developer of a collaboration platform that provides a unique privacy
Q1 architecture, enabling community and healthcare partners to collaborate,
Signify Health TAVHealth na
coordinate services, keep track of patients and create longitudinal social
records together.
Q1 Teleradiology practice comprising more than 70 radiologists and 60 support
Philips Direct Radiology na
staff working in close partnership with 300+ facilities across the country.
Developer of healthcare software which fully integrates practice
Q2 Practice management and EMR functionality and offers valuable interface and health
DocuTAP na
Velocity information exchange capabilities in order to connect patient data with
other software systems.
Provider of a practice management and medical billing software intended to
Q2 EverCommerce CollaborateMD digitize medical practices, process medical claims, manage health data, na
speed up and secure the payment cycle.
Operates as an on-demand provider of tax-advantaged programs for
Q2 HealthEquity WageWorks consumer-directed health, commuter, and other employee spending $2,010
account benefits.
Q2 Provider of patient engagement and care management solutions to
CPSI Get Real Health $11
healthcare organizations worldwide.
Provider of a mobile pharmacy and digital patient engagement platform
Q2 Cardinal Health mscripts designed to offer innovative, easy-to-use mobile and web health na
management services.
Operator of a health care-focused consulting firm. The company is focused
Q2 Netsmart McBee on providing outsourced nurse chart review, billing, cash collection, revenue
na
Technologies Associates cycle turnaround, data mining and analysis, and other ancillary outsourced
services to acute and post-acute providers.
N. Harris Offers clinical communications and collaboration, physician engagement,
Q2 Computer Uniphy Health patient engagement, high risk patient management, and health assessment na
Corporation solutions.
Q2 Provides contract management solutions for pharmaceutical and life
Datix iContracts $210
sciences industries.
Q2 Remedy Health Publisher serving patients and healthcare professionals in the diabetes,
Vertical Health na
Media mental health, back pain, and pain management areas.
Q2 Provider of a payments network designed to connect providers, payers and
JPMorgan Chase InstaMed $600
consumers on one platform.
Q2 Developer of a system to helps parents monitor asthma symptoms in
Apple Tueo Health na
sleeping children.
Q2 Critical Signal
Best Buy Provider of personal emergency response systems to healthcare industry. na
Technologies
Provider of a storage and analysis platform designed to accelerate research
Q2 Beckman
Cytobank productivity. The company's platform manages, analyzes, and enables the na
Coulter
sharing of high dimensional single cell biological data.
Q2 Waystar PARO Provider of a financial assistance predictive analytics solution. na
Operator of a prescription assistance company for individuals who need
Health help affording their medications. The company's direct-to-consumer
Q2 Insurance TogetherHealth platform connects individuals with U.S. insurance carriers using consumer $50
Innovations acquisition and engagement to primarily serve the over 65 age group
insurance market.
Q2 Dassault Medidata Provider of cloud-based solutions for the clinical development programs of
$5,800
Systemes SA Solutions life sciences companies.
Allscripts
Q2 Developer of a prescription management system that allows healthcare
Healthcare ZappRx na
providers, patients, and pharmacists to interact and communicate.
Solutions
Copyright© 2019 Healthcare Growth Partners 29You can also read