Holistic Review of the March Market Turmoil - 17 November 2020 - Financial Stability ...
←
→
Page content transcription
If your browser does not render page correctly, please read the page content below

Holistic Review of the March Market Turmoil

17 November 2020
The Financial Stability Board (FSB) coordinates at the international level the work of national
financial authorities and international standard-setting bodies in order to develop and promote
the implementation of effective regulatory, supervisory and other financial sector policies. Its
mandate is set out in the FSB Charter, which governs the policymaking and related activities of
the FSB. These activities, including any decisions reached in their context, shall not be binding
or give rise to any legal rights or obligations.

                                  Contact the Financial Stability Board
                           Sign up for e-mail alerts: www.fsb.org/emailalert
                              Follow the FSB on Twitter: @FinStbBoard
                                   E-mail the FSB at: fsb@fsb.org

             Copyright © 2020 Financial Stability Board. Please refer to the terms and conditions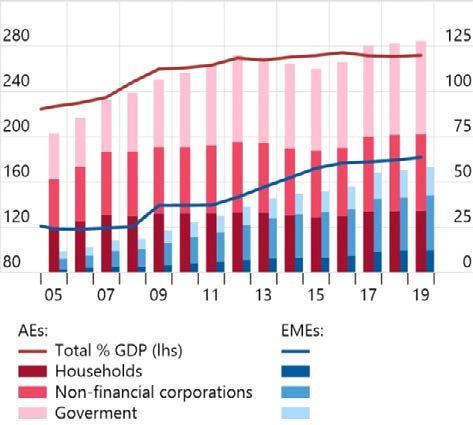
Table of Contents

Executive summary ............................................................................................................... 1
FSB work programme on NBFI .............................................................................................. 3
1.    Introduction ..................................................................................................................... 4
2.    Overview of financial market developments around March ............................................. 5
      2.1.      Prelude to the market turmoil ............................................................................... 5
      2.2.      Flight to safety...................................................................................................... 5
      2.3.      Dash for cash ....................................................................................................... 6
      2.4.      Easing of market stress........................................................................................ 9
3.    Origins and backdrop of the March market stress ......................................................... 10
      3.1.      The COVID-19 shock ......................................................................................... 10
      3.2.      Global economic and financial backdrop ............................................................ 10
      3.3.      Structural changes in the global financial system ............................................... 12
4.    The propagation of the shock ........................................................................................ 17
      4.1.      The impact of the COVID-19 shock on financial markets ................................... 17
      4.2.      Factors shifting demand and supply of liquidity .................................................. 17
      4.3.      The propagation of liquidity stress ...................................................................... 24
5.    Public sector responses ................................................................................................ 33
      5.1.      Measures taken ................................................................................................. 33
      5.2.      Outcomes .......................................................................................................... 37
6.    Conclusion .................................................................................................................... 40
      6.1.      Lessons learned and issues raised .................................................................... 40
      6.2.      Policy implications and areas of further work ..................................................... 42
Annex 1: Timeline of financial market developments ........................................................... 44
Annex 2: Classification of policy measures .......................................................................... 53
Abbreviations ....................................................................................................................... 56

                                                                     iii
iv
Executive summary
The financial market turmoil in March, brought about by the COVID-19 shock, tested the
resilience of the global financial system. In contrast to the 2008 financial crisis, the shock
originated outside the financial system. The pandemic and government containment measures
led to a sudden sharp pullback in real economic activity and placed the financial system under
strain. Some parts of the system, particularly banks and financial market infrastructures, were
able to absorb rather than amplify the macroeconomic shock, supported by the post-crisis
reforms. However, key funding markets experienced acute stress and public authorities needed
to take a wide range of measures to support the supply of credit to the real economy.

Global economic and financial developments prior to the pandemic had made the financial
system more susceptible to shocks. The outlook for growth and corporate earnings had begun
to weaken; real interest rates had been on a downward trajectory; while corporate indebtedness
was high and rising. A search for yield led a number of investors away from high quality cash-
like assets down the credit curve. Favourable external financing conditions – strong global risk
appetite and a drop in US Treasury yields – supported cross-border lending and debt portfolio
flows to emerging market economies (EMEs), and encouraged greater reliance on dollar-
denominated borrowing by firms in those countries.

Structural changes in the financial system over the past decade have also increased the reliance
on market-based intermediation to finance growing levels of debt. The G20 regulatory reforms
and market-driven adjustments in the aftermath of the 2008 financial crisis have resulted in credit
risk being increasingly intermediated and held outside the banking sector. Interconnectedness
has also increased and taken new forms in some areas. With the overall growth of non-bank
financial intermediation (NBFI), market liquidity has become more central to financial resilience.
At the same time, market-making capacity by banks may have become more constrained, while
the provision of liquidity by some new entities and in electronic markets is potentially less robust.

The breadth and dynamics of the economic shock and related liquidity stress in March were
unprecedented. As in previous cases, the shock caused a fundamental repricing of risk and a
heightened demand for safe assets. However, the stress also led to large and persistent
imbalances in the demand for, and supply of, liquidity needed to support intermediation. On the
demand side, non-financial corporates attempted to tap capital markets; demand for US dollar
liquidity increased from foreign borrowers; non-government money market funds (MMFs)
experienced significant outflows; and some open-ended funds also experienced redemptions.
On the supply side, reductions in risk appetite, regulatory constraints and operational challenges
may have reduced dealers’ capacity to intermediate larger flows in some core funding markets.

Particular activities and mechanisms in the financial system acted as mitigants or propagators
of the liquidity stress. Central counterparties remained resilient despite market turbulence,
though margin calls may have been larger than expected in some cases, challenging liquidity
risk management for some market participants and adding to the overall demand for cash. Some
investors in open-ended investment funds may have faced incentives to redeem ahead of others.
While stronger bank capital and liquidity positions, built over the past decade as a result of the
post-crisis reforms, helped to prevent a sharp rise in counterparty risks, banks may have been
unwilling or unable to deploy substantial amounts of balance sheet capacity in an uncertain and

                                                 1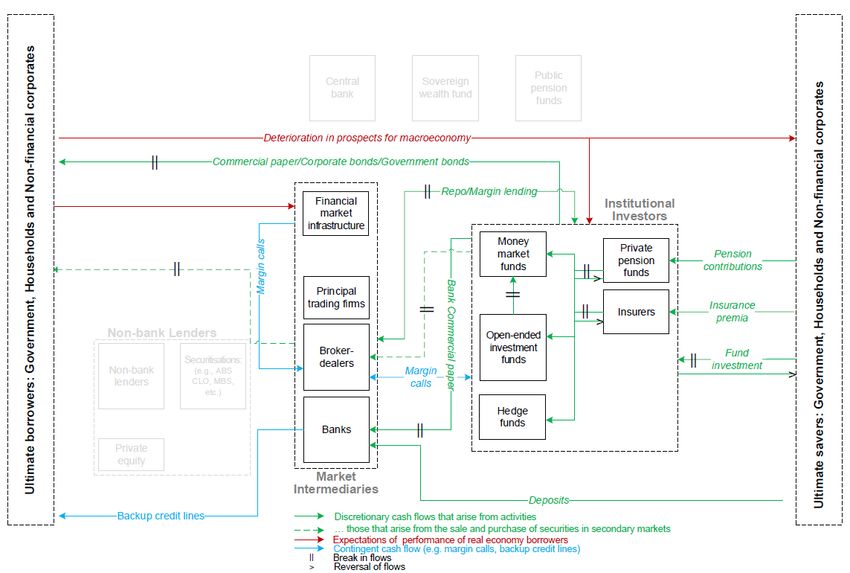
volatile environment. Dealers also faced difficulties absorbing large sales of assets, amplifying
turmoil in short-term funding markets. Market dysfunction was exacerbated by the substantial
sales of US Treasuries by some leveraged non-bank investors and foreign holders. This
combination of large asset sales, together with the limited capacity or willingness of dealers to
intermediate in some markets, became self-reinforcing.

The policy response was speedy, sizeable and sweeping. The unprecedented policy actions by
central banks alleviated market stress through different channels: asset purchases; liquidity
operations, including for US dollars; and backstop facilities designed to provide targeted liquidity
to specific financial entities (e.g. MMFs and primary dealers). Regulatory and supervisory
measures as well as fiscal policies complemented these central bank interventions. Securities
regulators also took measures to support market functioning. The policy measures succeeded
in alleviating market strains to date, with announcement effects appearing to be particularly
important in restoring confidence and shaping the expectations of market participants.

Absent central bank intervention, it is highly likely that the stress in the financial system would
have worsened significantly. This would have had a major impact on the ability of financial and
non-financial firms to raise funds. The need to intervene in such a substantial way has meant
that central banks had to take on material financial risk. This could lead to moral hazard issues
in the future, to the extent that markets do not fully internalise their own liquidity risk in
anticipation of future central bank interventions in times of stress. Moreover, the exceptional
measures taken by central banks were not aimed at addressing the underlying vulnerabilities
that amplified the stress. The financial system remains vulnerable to another liquidity strain, as
the underlying structures and mechanisms that gave rise to the turmoil are still in place.

The March turmoil has underscored the need to strengthen resilience in the NBFI sector. The
episode has highlighted issues associated with particular market activities and mechanisms that
may have caused liquidity imbalances and propagated stress. These include: significant outflows
from non-government MMFs; similar dynamics, albeit less intense and widespread, in specific
types of open-ended funds; redistribution of liquidity from margin calls; the willingness and
capacity of dealers to intermediate in core funding markets; and the drivers of dislocations in key
government bond markets, including the role of leverage in amplifying the stress. The turmoil
also highlighted the increased importance of interconnectedness – both within the NBFI sector
and with banks – and of system-wide liquidity conditions for the resilience of the financial system.

The efforts of the international regulatory community to reinforce the resilience of the financial
system, while preserving its essential functions and benefits, should focus on three main areas.
These are: (i) in the short-term, work to examine and, where appropriate, address specific risk
factors and markets that contributed to amplification of the shock; (ii) enhancing understanding
of systemic risks in NBFI and the financial system as a whole, including interactions between
banks and non-banks and cross-border spill-overs; and (iii) assessing policies to address
systemic risks in NBFI, including the adequacy of policy tools and the concept and desired level
of resilience in NBFI. Efforts to strengthen NBFI resilience should not compromise the resilience
in other parts of the system or the important role that NBFI plays in financing the real economy.

The FSB will coordinate the international regulatory community’s assessment of identified
vulnerabilities and the appropriate financial policy response, working closely with standard
setting bodies and member authorities. As part of this review, the FSB published a
comprehensive NBFI work programme covering the key issues at a high level (see below).

                                                 2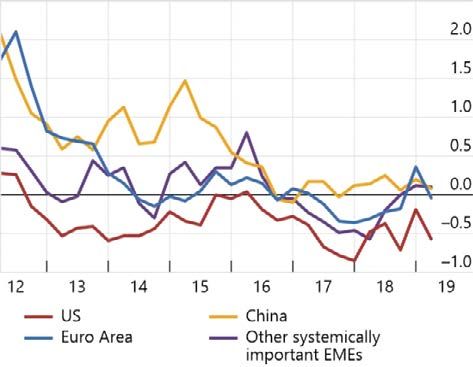
FSB work programme on NBFI
The table below summarises the work programme on NBFI coordinated and overseen by the
FSB for 2021 and beyond. The work programme builds on the lessons from the holistic review
of the March market turmoil. The overarching objective of the work programme is to enhance
the resilience of the NBFI sector while preserving its benefits.

The NBFI work programme is organised along three main areas: analytical and policy work on
specific issues, system-wide risk assessments, and policies to address systemic risks in NBFI.
It comprises new work in response to lessons from the holistic review of the March market turmoil
as well as ongoing or previously planned NBFI initiatives. This work will be carried out within the
FSB as well as by its member standard-setting bodies and international organisations, to ensure
that relevant experiences and perspectives are brought to bear.

        Topic                                    Brief description                              Timing
                              1. Analytical and policy work on specific issues
 Money market fund        To make policy proposals, in light of the March experience, to     2021, incl.
 (MMF) resilience         enhance MMF resilience including with respect to the               report to the
                          underlying short-term funding markets                              G20
 Liquidity risk and its   To examine the availability and effectiveness of liquidity risk    2021-22
 management in            management tools for OEFs, including the experience of
 open-ended funds         redemption pressures and use of tools in the March turmoil
 (OEFs)                   and their aggregate impact on the market
 Margining practices      To examine the frameworks and dynamics of margin calls in          2021
                          centrally cleared and uncleared derivatives markets and the
                          liquidity management preparedness of market participants to
                          meet margin calls
 Liquidity, structure     To examine the structure and liquidity provision in core           2021-22
 and resilience of        funding markets during stress, including the role of leveraged
 core bond markets        investors and factors that limit dealer capacity to intermediate
                                        2. Systemic risk assessments

 Strengthening the        To assess NBFI risks in light of COVID-19 developments and         Ongoing
 ongoing monitoring       lessons from the March turmoil
 of NBFI risks
 Advancing the            To deepen the analysis of structural and interconnectedness        Ongoing, incl.
 understanding of         issues in NBFI, including the interaction of USD funding           stakeholder
 systemic risks in        pressures and fund outflows in emerging market economies,          workshop in
 NBFI and the             as input into enhanced risk monitoring and discussions on          2021
 financial system         policies to address systemic risks in NBFI
                               3. Policies to address systemic risks in NBFI
 Policies to address      To examine policies to address systemic risks in NBFI,             2022
 systemic risks in        including the adequacy of current policy tools and the concept
 NBFI                     and desired level of resilience in NBFI

                                                       3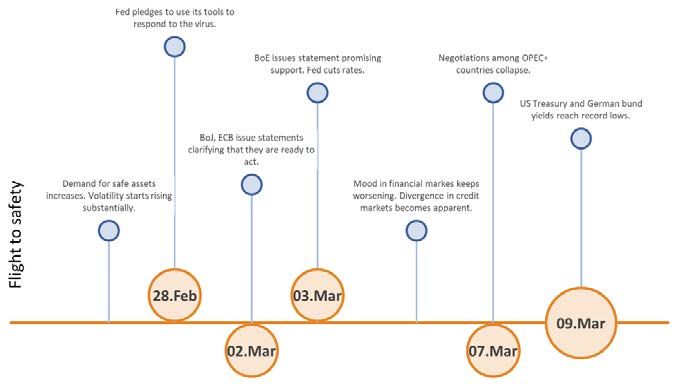
1.          Introduction
This report examines the drivers, effects and implications of the financial market turmoil in March.
The COVID-19 pandemic placed the global financial system under considerable strain. Some
parts of the system, particularly banks and financial market infrastructure, were generally able
to absorb rather than amplify the macroeconomic shock, supported by the post-crisis reforms.
However, key funding markets experienced acute stress and public authorities needed to take a
wide range of measures to support the supply of credit to the real economy by underpinning
market liquidity and functioning. 1 The March turmoil has reinforced the need to better understand
interconnections and amplification channels in the financial system and to consider the nature
of vulnerabilities in non-bank financial intermediation (NBFI) in relation to the liquidity stress and
the implications of central bank liquidity support, and draw lessons about overall resilience of the
NBFI sector.

The report draws on a broad range of information sources. These include analysis by the FSB
and standard-setting bodies; analysis and information provided by FSB members; input from
external stakeholders (industry participants, academics, think tanks and trade associations)
through a virtual outreach meeting in September; and a review of the wider literature. These
sources taken together form the basis for the analysis in the report.

The report draws lessons from the March turmoil and identifies areas for further work. The
decisive policy response helped to stabilise financial markets and contain the economic and
financial fallout of the pandemic to date. However, there is a need to address the vulnerabilities
that became apparent during the turmoil because uncertainty about the economic outlook
remains high and the risk of further market dislocations cannot be ruled out. In light of this, the
report identifies lessons that form the basis for further work to increase the resilience of NBFI.

The report is structured as follows:
      ■     Section 2 sets the scene by providing an overview of key developments in global
            financial markets around March. Annex 1 provides a detailed timeline of market events.
      ■     Section 3 puts the March market turmoil into context, by describing the nature of the
            COVID-19 shock, discussing the role of global economic and financial conditions
            prevailing in the run-up to COVID-19, and setting out key structural changes in the
            global financial system since the 2008 financial crisis and their implications for
            resilience.
      ■     Section 4 analyses how the shock was transmitted through the global financial system,
            including the role played by different types of intermediaries and mechanisms that may
            have mitigated or amplified the shock.
      ■     Section 5 reviews policy measures taken to ease the financial market strains and
            considers their effects, including the mechanisms through which they may have worked.
            Annex 2 provides additional information on those measures.
      ■     Section 6 concludes by identifying lessons from the events in March, drawing policy
            implications, and describing areas of further vulnerabilities and policy work.

1
     See the FSB’s COVID-19 pandemic: Financial stability implications and policy measures taken – Report to the G20 (July 2020).

                                                                4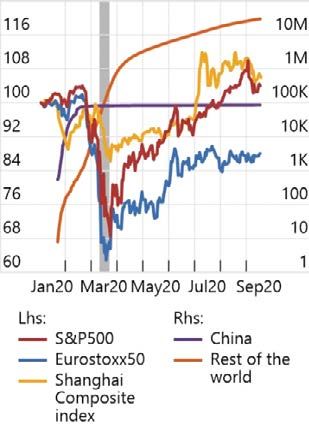
2. Overview of financial market developments around March
This section describes the key financial market developments that took place during the March
market turmoil. It starts with a summary of market conditions in January and February, before
worries about COVID-19 hit global markets (prelude to the market turmoil). It then describes the
two phases of the most severe stress period. In the first phase (flight to safety), which took place
from late February to early March, investors sold riskier assets and bought less risky ones, as
often happens in periods of stress. In the second, more acute phase (dash for cash), which took
place in mid-March, investors sold risky as well as relatively safe assets in an attempt to obtain
cash or cash-like instruments. Following the stress, the last phase (easing of market stress) started
in late March following speedy, sizeable and sweeping interventions by authorities, and saw
markets progressively return to orderly conditions. A detailed timeline of events is in Annex 1.
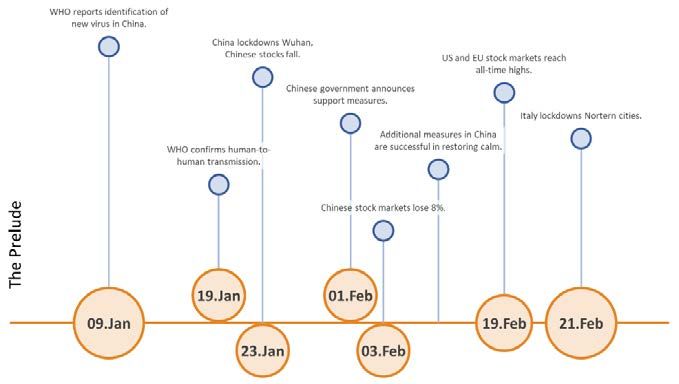
2.1. Prelude to the market turmoil
At the start of the year, financial markets were buoyed by a relative sense of optimism on the
back of supportive monetary policies, reduced trade tensions, and tentative signs of stabilisation
in the global economy. Then on 9 January, the World Health Organisation (WHO) reported that
Chinese authorities had identified a new virus causing serious respiratory issues in the city of
Wuhan. In the following days, the number of people infected with the virus continued to increase
and the WHO confirmed evidence of human-to-human transmission on 19 January.
Financial markets took little notice of these developments until late January. On 23 January,
Chinese authorities imposed a lockdown in Wuhan ahead of a week of national holidays for the
Chinese New Year. Travel restrictions were subsequently imposed in several Chinese
provinces, and a growing number of cases was reported in various countries showing that the
virus was starting to spread around the world. Global equity markets, especially in Asia, declined
on concerns about the virus, but then recovered in response to easing concerns about the
spread of the virus in China. In the US and continental Europe, stock markets reached record
highs on 19 February, while other indexes were close to all-time highs.
2.2. Flight to safety
Concerns resurfaced soon afterwards, as the number of coronavirus cases in China and
elsewhere continued to increase in late February, intensifying investors’ fears. On 21 February,
Italian authorities announced local lockdowns in the Northern Italian towns experiencing the
highest number of cases. At this point, a general “risk-off” sentiment began to spread through
markets as investors adjusted their expectations for the possibility of a significant slowdown in
economic activity. Volatility rose substantially and suddenly. Global financial markets
experienced significant corrections and even countries that had not reported cases were subject
to considerable selling pressure (Graph 2.1, left panel). Initial government measures to contain
the spread of the virus were introduced at around this time, including travel bans, lockdowns and
the closure of schools.
Global sovereign bond yields across the maturity spectrum declined substantially amid portfolio
rebalancing and surging demand for safe assets. Amidst the continuous rise in the number of
cases in Asia and Europe, perceived safe haven assets such as US Treasuries and German bunds
5
saw very large price increases. As in other major stress events, investor appetite shifted from
riskier to safer and more liquid assets. As it did so, some risky assets became difficult to sell and
liquidity conditions in these markets became impaired (Graph 2.1).
Funding stress indicators and measures of illiquidity started to increase considerably. Reflecting
the uncertainty in financial markets, corporate bond spreads increased quickly and substantially,
as did spreads on sovereign bonds of financially weaker countries. Transaction volumes
particularly in fast-moving electronic markets (equities, US Treasuries) increased substantially,
while liquidity measures began to deteriorate, including in derivatives markets. Flows in funds
investing in risky assets, first in equities and then in fixed income, started to moderate and then
turned negative by the beginning of March.
The March episode was characterised by large price movements Graph 2.1
Stock price indices and total number Investment grade and high yield 10-year government bond yields
of confirmed COVID cases bond spreads1
2 Jan 2020 =100 Total cases Basis points Per cent
Shaded area correspond to the period 11-23 March.
1 Option-adjusted spreads of ICE BofAML Global Corporate Index and ICE BofAML Global High Yield Index.
Sources: Johns Hopkins University; Bloomberg; ICE BofAML Indices.
Worries about oil prices added pressure to financial markets. In early March, the OPEC+
countries failed to reach an agreement on output cuts to maintain stable oil prices in the face of
weakening global demand resulting from the spreading of the virus. In response, crude prices
dropped significantly and the entire oil futures curve shifted down, putting additional pressure on
equity markets. The prospect of a price war among oil producing countries hit certain equity
markets particularly hard, with heavy losses in the Middle East, but the effects reverberated in
equity markets worldwide.
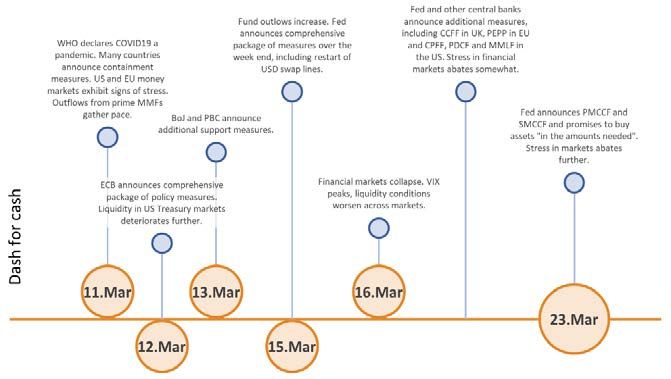
2.3. Dash for cash
On the back of continued bad news on the health and economic fronts, the flight to safety
behaviour morphed into broad-based selling in mid-March, when even the safest and most highly
liquid assets such as government bonds experienced large price declines. On 11 March, the
WHO officially declared the COVID 19 outbreak a pandemic. At approximately the same time, a
6number of countries announced strict containment measures involving lockdowns, border
closings and quarantine requirements for people returning from high-risk areas. Continued
downward revisions of growth expectations and heightened risk aversion, combined with high
uncertainty about the future development of the pandemic led to extreme investor behaviour and
sharp market movements (see section 4).
First, there was an extremely high demand for cash and near-cash assets. This ‘dash for cash’
was underpinned by precautionary demand for liquidity in the real economy. Corporates’ and
households’ concerns about the loss of a substantial part of their revenues, investor fears about
the outlook for the global economy, and cash needs by financial institutions, resulted in the
broad-based selling of financial assets - even the safest and most liquid ones. In the financial
system, redemptions from investment funds, margin calls resulting from increased volatility and
the need of some non-banks to unwind leveraged positions may all have contributed to sudden
spikes in the demand for cash (the mechanisms are discussed in detail in section 4).
The commercial paper (CP) and certificate of deposit (CD) segments of money markets started
to exhibit signs of severe stress, with outflows from non-government MMFs in the US and EU
leading to selling pressures on the assets held by these funds. Equity and bond funds in
emerging market economies (EMEs) as well as advanced ones experienced very large outflows
as investors liquidated their positions. The selling also started to affect assets that would
normally be seen as safe havens, such as US Treasuries and other advanced economy
government bonds . 2 At the same time, government MMFs experienced considerable inflows.
In corporate bond markets, the lack of liquidity also created challenges for fixed income
benchmark providers, with some of them postponing their March-end index rebalancing. This
aimed at reflecting the lack of liquidity and strained market conditions as well as concerns about
the impact of credit rating downgrades that occurred during the period on bond indices.
Second, there was a very sharp tightening of financial conditions, limiting the ability of corporates
to obtain market funding. Liquidity conditions continued to deteriorate in many markets (Graph
2.2). Electronic markets saw a substantial increase in volumes accompanied by wider spreads,
while dealer-intermediated markets, such as for corporate bonds, saw a significant deterioration
in liquidity. Despite the surge in trading activity, trading venues continued to operate in an orderly
manner, although high volatility triggered circuit breakers on equity markets multiple times. Very
high trading activity resulted in heightened settlement activity and settlement fails rose across
asset classes (equities, corporate and government bonds), as market participants faced
operational and other challenges in sourcing and delivering securities while most of their
employees were working from home. 3 Financial and non-financial corporate issuers were also
unable to issue more commercial paper due to a shortage of demand, including by MMFs. CP
and CD markets shut down for a number of days. The resulting tightening of financing conditions
pushed corporates towards selling their investments and further drawing down their existing
bank credit lines and revolving credit facilities. This large-scale draw down, taking place partly
on a precautionary basis, put pressure on the balance sheets of the providers of those facilities.
2
According to the IMF’s Global Markets Monitor, UST 10-year market depth declined 93% from the February average to its lowest
level in history and 30-year market depth dropped 76% from its February average; also the lowest in history.
3
For the EU, see the ESMA report on Trends, Risk and Vulnerabilities (September 2020), No.2 2020, p.40.
7On 16 March, the S&P 500 lost 12%, the worst one-day drop since 1987 and the VIX reached
its all-time peak of 83. Market depth in several asset classes (including US equities and
Treasuries) declined to levels seen during the worst period of the 2008 financial crisis. This was
accompanied by a large increase in transaction costs in many inter-dealer markets.
Correlations broke down, liquidity deteriorated and expectations of future
interest rates collapsed Graph 2.2
Correlation between stock and bond Bid-ask spreads in US equity and Future-based expectations of US
yields1 treasury markets Federal fund rate 3
Correlation Basis points Basis points Per cent
The shaded area in the left hand panel indicates the period 31 March -15 April, which corresponds to the calculation window of moving
correlations for the period 11-23 March. Shaded areas in the middle panel and the right hand panel correspond to the period 11-23 March.
1 Calculated as 20 trading days moving correlations using daily returns of S&P 500 and daily changes in US 10 year government bond yields.
2
Average of all bid/ask spreads taken as a percentage of the mid price. US Treasury spreads are calculated based on on the run securities
and ETF spreads are calculated a 5-day moving average. 3 Generic 2nd 30 days federal fund futures. Mid yield to maturity.
Sources: Bloomberg; FSB calculations.
Third, longstanding relationships in prices across different markets began to break down,
including in the core US Treasuries market. Usually at times of stress equity prices decline while
government bond prices increase. But during the dash for cash both types of assets experienced
large price declines (Graphs 2.2 and 2.3). Volatility was elevated even for assets (such as
government bonds and gold) that are usually stable as investors took benefit of the prior
appreciation of these assets to get the needed cash. Furthermore, either uncommon or unusually
large differences emerged between the price of assets that usually move in close sync: on-the-
run and off-the-run bonds, the net asset value (NAV) of a number of exchange traded funds
(ETFs) and their intraday price, and the prices of Treasury bonds and their futures contracts.
Finally, severe strains in offshore dollar funding markets emerged. The US dollar appreciated
considerably against other currencies as non-US corporates were unable to roll over funding
and sold their dollar-denominated assets. The strain was particularly severe in EMEs, given the
growth in dollar denominated debt issuance in recent years (see section 3). Market conditions
also forced some non-US central banks to liquidate part of their foreign exchange reserves in
order to accommodate the demand for dollars in their jurisdiction. The strains manifested in large
dislocations in the USD basis (Graph 2.3, right panel). 4
4
The basis is the difference between the dollar interest rate in the money market and the implied dollar interest rate from the FX
swap market where someone borrows dollars by pledging another currency as collateral.
8US Treasury markets experienced very large price movements and strains
in the USD offshore funding markets emerged. Graph 2.3
US government bond yield curve changes (from 9 Jan) USD currency basis1
Percentage points Basis points
Shaded area in the right hand panel corresponds to the period 11-23 March.
1 Calculated exploiting the covered interest parity condition as the spread between three-month US dollar Libor and three-month FX swap-
implied US dollar rates.
Sources: Bloomberg; FSB calculations.
2.4. Easing of market stress
The dash for cash lasted until the significant interventions and announcements by central banks.
These were part of a package of measures that included the provision of relief by some securities
regulators and substantial fiscal support by many governments. Central banks’ interventions
took the form of asset purchases, liquidity facilities, the establishment and expansion of dollar
swap lines and the temporary relaxation of regulatory restrictions (see section 5). In addition,
fiscal policy provided further stimulus and guarantees that helped ease the market fallout. Global
stock markets bottomed out between 18 March (Europe) and 23 March (US, China).
Since then, financial market strains have eased in response to decisive policy actions. By late
August, most risky assets had recovered at least three quarters of the losses experienced during
the initial stages of the pandemic. US equity indexes were at all times high, while high yield
bonds recovered 80% of the losses. European equities recovered more than two thirds of their
losses and oil prices had risen 50% above their lowest point, which in futures market entailed
negative prices for the first time in April. Financial conditions eased in domestic and foreign
currency funding markets. Credit spreads have narrowed in both investment grade and high
yield bonds, while issuance volumes have significantly increased. Investment grade bond
issuance by non-financial corporates reached record levels since March, with the largest amount
of bonds being issued by industries most exposed to the lockdown measures. The availability of
offshore USD liquidity, particularly in EMEs, has also improved following the US Federal Reserve
actions, and overall capital outflows from EMEs have receded.
However, the economic and financial outlook remains highly uncertain. Declines in economic
activity have been very large. According to the IMF, global GDP growth for 2020 is projected at
9-4.4% in 2020, 5 which is much worse that during the 2008 financial crisis and several percentage
points lower than pre-COVID estimates. While some indicators suggest some rebound in activity,
the path of recovery and the outlook for sectors most impacted by the pandemic remains highly
uncertain. Any change in market sentiment could thus trigger a sharp downward revision of risky
asset prices. Non-financial corporates and EME sovereigns experienced a wave of credit rating
downgrades in March and April. The pace of downgrades has noticeably decreased since then,
on the back of decisive policy action. However, deteriorating credit quality calls for attention to
the potential effects a deterioration in the economic outlook. This underlines the need for
authorities to take a holistic and system-wide view, consider different players and address the
specific structural vulnerabilities in the non-bank financial sector.
3. Origins and backdrop of the March market stress
3.1. The COVID-19 shock
The COVID-19 pandemic was an unprecedented external shock to the financial system. The
outbreak and government containment measures caused an adverse simultaneous shock to
supply and demand. Quarantines, lockdowns and social distancing curtailed mobility and,
combined with heightened uncertainty and job losses, led to lower aggregate demand; while
workplace closures and travel restrictions disrupted trade and global supply chains. There was
a sudden sharp pullback in real economic activity across a number of sectors – including tourism,
transportation, automotive and services – which spread more broadly in tandem with the virus,
precipitating the deepest and most broad-based global recession since the Great Depression.
The financial system reacted in anticipation of the severe economic downturn brought about by
the shock and governments’ containment measures. In contrast to what happened during the
2008 financial crisis, the shock originated outside the financial system. Core parts of the system
were able to withstand and absorb the shock, but there were severe disruptions in a number of
financial markets. The shock led to an abrupt increase in demand for safe and liquid assets in
both the financial and non-financial sectors, which propagated through the system and morphed
into a dash for cash. The sudden materialisation of extensive disruptions to economic activity
and extreme uncertainty with respect to the consequences and duration of the shock made the
pricing of assets particularly difficult and led to a sharp repricing in financial markets. In
assessing the impact of the shock, it is relevant to consider global economic and financial
developments and structural changes to the financial system in the run-up to the pandemic.
3.2. Global economic and financial backdrop
Developments in the lead-up to the pandemic may have contributed to the severity of the
reaction in financial markets in March. Following a long global recovery from the 2008 financial
crisis, the outlook for growth and corporate earnings had weakened by early 2020 and become
more uncertain. Real interest rates have fallen during the past decade, with both authorities and
5
See the IMF’s World Economic Outlook, October 2020: A Long and Difficult Ascent.
10market participants predicting a “lower for longer” environment. 6 This decline in financing costs
reduced the debt service burden for borrowers and encouraged further debt accumulation (see
Graph 3.1). High levels of corporate indebtedness, declining asset quality and lower credit
underwriting standards meant that firms became increasingly exposed to the risk of a material
economic downturn or an unexpected rise in interest rates. Investors had therefore become more
susceptible to sudden shifts in market sentiment and a tightening of financial conditions in
response to shocks. 7
Easy financial conditions encouraged debt accumulation in recent years Graph 3.1
Financial conditions1 Debt accumulation
Z-scores, 1996–2019 % GDP USD trillions
1
Global financial conditions indices. The z-score indicates an observation’s distance from the population mean in units of standard deviation.
Sources: IMF, GSFR April 2019; Institute for International Finance, Global Debt Monitor.
Certain pre-existing financial vulnerabilities may have amplified financial market reactions to the
shock. Relatively easy financial conditions, stretched valuations in some asset classes,
compressed risk premia and (more recently) a large amount of sovereign debt with negative
yields further encouraged a search for yield. This led a number of investors away from high
quality cash-like assets down the credit curve, including in leveraged loans directly and in
securitised form through collateralised loan obligations (CLOs). 8 It may also have increased the
popularity of investment strategies reliant on low market volatility, short-term funding and high
leverage. Favourable external financing conditions – strong global risk appetite and a drop in US
Treasury yields – supported cross-border lending and debt portfolio flows to EMEs, and
encouraged greater reliance on dollar-denominated borrowing by firms in those countries.
Some of the concerns about vulnerabilities related to liquidity mismatches and the build-up of
leverage in certain types of investment funds. In an environment of low interest rates, growth in
asset management was accompanied by increased holdings of higher-yielding but riskier and
less liquid assets through open-ended funds that offer daily redemptions to investors. To the
6
See the CGFS report on the Financial stability implications of a prolonged period of low interest rates (July 2018).
7
See the IMF’s Global Financial Stability Report: Lower for Longer (October 2019).
8
See the FSB’s Vulnerabilities associated with leveraged loans and collateralised loan obligations (December 2019).
11extent that such funds do not adequately manage their liquidity risk and experience
unanticipated investor redemptions, they may be susceptible to investor runs during a market
stress, which could contribute to price dislocations and fire sale spirals. Vulnerabilities may also
result from the use of leverage by certain investment vehicles (e.g. hedge funds), either by
borrowing or through derivatives. This makes these vehicles more sensitive to changes in asset
prices and the availability of short-term funding during stress, which can lead to sudden and
sharp unwinding of trades that can propagate risk through linkages with counterparties. 9
3.3. Structural changes in the global financial system
The COVID-19 shock hit a global financial system that has fundamentally changed over the past
decade. A number of factors – including regulatory reforms and market-driven adjustments in
the aftermath of the global financial crisis, technological changes, developments in US dollar
funding, and the growing role and evolution of non-bank financial intermediation – have affected
financial resilience, intermediation patterns, and market functioning.
Post-crisis reforms have contributed to major changes in financial institutions’ balance sheets
and market structures. Large banks have more capital and liquidity and are less leveraged,
thereby enhancing their ability to absorb losses. Several have reduced trading and market-
making activities as changes in regulation and risk appetite in light of the crisis have decreased
those activities’ attractiveness, 10 and curbed their involvement in certain complex activities. 11
Over-the-counter (OTC) derivatives reforms replaced much of the complex and opaque web of
ties between market participants with simpler and more transparent links between central
counterparties (CCPs) and their clearing members, supported by robust risk management
(including margining) requirements. 12 And while aspects of structured finance that contributed to
the 2008 financial crisis have significantly declined, 13 implementation of reforms in other NBFI
areas – including policies to address asset management vulnerabilities – is at an earlier stage. 14
NBFI has overall grown considerably and evolved over the past decade. Non-bank financial
entities – comprising investment funds, insurance companies, pension funds and other financial
intermediaries – have different structures and are subject to distinct regulatory frameworks within
and across jurisdictions. Their asset share has increased to almost half of global financial assets,
compared to 42% in 2008, due to both inflows and valuation increases. One factor behind this
increase has been the growth of investment funds, whose assets have expanded from roughly
US$21 trillion in 2008 to US$53 trillion in 2018 (see Graph 3.2). Underlying drivers for this growth
include long-term demographic trends leading to asset accumulation; macro-financial factors
9
See the FSB’s Policy Recommendations to Address Structural Vulnerabilities from Asset Management Activities (January 2017)
and the Bank of England’s Financial Stability Report (December 2015, November 2018 and December 2019).
10
In some markets, a reduction of liquidity in normal times from pre-crisis levels, owing to a better recognition of the costs involved
in providing liquidity services, was an expected outcome of the reforms. Prevailing lower yields and a shift in risk appetite
following the 2008 financial crisis also contributed to reduced dealer profitability from holding and providing financing for fixed
income securities. See the CGFS report on Fixed income market liquidity (January 2016).
11
See the CGFS report on Structural changes in banking after the crisis (January 2018).
12
See the FSB’s reports on Incentives to centrally clear over-the-counter (OTC) derivatives (November 2018) and Review of OTC
derivatives market reform: Effectiveness and broader effects of the reforms (June 2017).
13
These include asset-backed commercial paper programmes, structured investment vehicles and collateralised debt obligations
of subprime and other lower quality credits. See the FSB report on Assessment of shadow banking activities: risks and the
adequacy of post-crisis policy tools to address financial stability concerns (July 2017).
14
See the FSB’s Implementation and Effects of the G20 Financial Regulatory Reforms: Fifth Annual Report (October 2019).
12such as accommodative monetary policies and the search for yield; and post-crisis reforms,
which may have increased the relative cost of bank-based finance.
The structure of the NBFI sector changed considerably in recent years Graph 3.2
NBFI assets’ rising share in total Composition of Other Financial Credit assets2 held by selected OFIs
financial assets Intermediaries (OFIs) (end-2018) sub-sectors
Per cent USD trillion Per cent USD trillion
ICPFs = Insurance corporations and Pension funds; OFIs = other financial intermediaries. Data used in the charts above covers 21
jurisdictions and euro area.
1 Investment funds other than MMFs and hedge funds, including equity funds, fixed-income funds and other investment funds. 2 Increases
of aggregated data may also reflect improvements in the availability of data over time at a jurisdictional level.
Source: FSB, Global Monitoring Report on Non-Bank Financial Intermediation 2019 (January 2020).
As a result, the importance of NBFI for the real economy has increased. Business models in,
and financial services provided by, that sector have become more diverse. New types of markets
(e.g. private debt) and forms of intermediation (e.g. FinTech credit) have sprung up; while
investments in credit products (e.g. fixed income ETFs, CLOs) and participation in certain credit
segments (e.g. mortgage and consumer finance) by non-banks has grown. Non-bank institutions
provide diversified financing and investment opportunities, a broad range of risk management
and risk sharing services (e.g. through derivatives hedging and treasury management), and
efficient delivery (e.g. through payment, clearing, settlement and electronic trading
infrastructures). As a result, these entities – especially asset managers – play a greater role in
financing the real economy, as well as in managing the savings of households and corporates. 15
The past decade also saw an evolution in the international US dollar funding landscape. 16 The
US dollar dominates international finance as a funding and investment currency, and its
widespread use has given rise to a complex and geographically dispersed network of
relationships. This has meant that global economic and financial activity is highly dependent on
the ability of US dollar funding to flow smoothly and efficiently between users outside the US. In
15
See the FSB’s Global Monitoring Report on Non-Bank Financial Intermediation 2019 (January 2020).
16
See the CGFS report on US dollar funding: an international perspective (June 2020).
13contrast to bank intermediation, market-based financing in US dollars has outpaced the growth
of the global economy. Cross-border links between banks and non-bank entities have also
increased. 17 Moreover, there has been a shift of global portfolios towards US securities and
cross-border USD-denominated lending into EMEs. A consequence of these trends is that non-
bank institutions – such as insurers and pension funds – have become more dependent on US
dollar funding, while having less recourse to funding sources such as central bank facilities.
Changes in the functioning of financial markets have affected liquidity provision and the speed
of transmission of price changes. The proportion of electronic trading has increased substantially
in markets with more standardised products (such as stocks and foreign exchange) but also in
fixed income (particularly futures and some advanced economy government bonds). This
change has allowed more high frequency trading and new players, such as principal trading
firms, to enter as liquidity providers in some of these markets (e.g. inter-dealer market for on-
the-run US Treasuries). 18 At the same time, the structure of core wholesale OTC funding
markets, such as for CP and corporate credit, continues to be characterised by low levels of
automated trading and heavy reliance on dealer intermediation – even as the size of those
markets has expanded significantly.
These structural changes have affected the resilience of the global financial system:
■ Credit risk is increasingly being intermediated and held outside the banking sector. A
greater role of NBFI implies a shift from the traditional model where banks keep credit
risk on their balance sheets to a model where it is borne by investors, and intermediated
in financial markets. As a result, financial resilience tends to depend less directly on
bank buffers and more on the ability of investors to effectively manage market, credit
and liquidity risk in times of stress. This in turn implies greater reliance on market price
signals and market liquidity for managing portfolios and the associated risks.
■ Interconnectedness has increased and taken new forms in some areas. The diversity
and growing involvement of non-bank entities in credit provision has led to more
interconnections (see Graph 3.3). Intermediation chains have become longer and more
complex, including for cross-border funding in USD by non-banks and non-financial
corporates. The growth in central clearing increased the systemic importance of CCPs
and their interconnections with market participants, reducing the complex and opaque
web of bilateral ties. Increased use of collateralisation, posted as margin or borrowed
against in secured funding markets, has increased the reliance on the availability and
smooth flow of collateral. These linkages have altered the speed and breadth with which
shocks are transmitted through different parts of the financial system.
■ Intermediation in the financial system has become more dependent on liquidity. As
noted above, the shift in credit intermediation towards markets has increased the need
for liquidity to finance and price assets. Greater interconnectedness may facilitate a
redistribution of liquidity within the financial system, for example as a result of margin
calls. New players have increasingly diversified liquidity provision in some markets,
17
See Aldasoro et al, Cross-border links between banks and non-bank financial institutions, BIS Quarterly Review (September
2020).
18
See the BIS Markets Committee report on Electronic trading in fixed income markets (January 2016).
14leading to a mix of entities, activities and infrastructures providing liquidity across the
financial system. However, banks continue to play a critical role in providing liquidity in
core funding markets, even as they have become less involved in market-making and
potentially less able or willing to absorb short-term liquidity imbalances as the size of
some financial markets has grown significantly relative to dealer balance sheets.
15Interconnectedness of NBFI
Graph 3.3
164. The propagation of the shock
4.1. The impact of the COVID-19 shock on financial markets
The financial system had to cope with large shifts in the demand and supply for market and
funding liquidity (see Section 2). While defensive behaviours by various parts of the financial
system are individually rational and in keeping with good risk management in the face of
increased risks, they resulted in large mismatches between the aggregate supply of and demand
for market and funding liquidity that put critical nodes of the financial system under strain. The
main factors contributing to these imbalances are discussed in Section 4.2.
Stress was propagated by reductions in the ability and willingness of financial intermediaries to
provide liquidity where it was most needed. Recent changes in the structure of the financial
system mitigated some of the stress, while others amplified this propagation. These factors are
discussed in Section 4.3.
4.2. Factors shifting demand and supply of liquidity
Demand for liquidity
At the onset of the pandemic, faced with uncertainty and prospects of decreased revenues, non-
financial corporates attempted to obtain cash in capital markets to keep funding their activities.
Corporates tried to raise funding by:
■ Tapping short-term funding markets, including through the issuance of commercial
paper. However, in the first two weeks of March, issuance of CP fell off sharply and
yields increased significantly making funding considerably more expensive. Issuance
of CP with an overnight maturity increased in mid-March. This reflected an
unwillingness of CP investors to provide funding beyond very short maturities.
■ Increasing corporate bond issuance. However, the corporate bond market became
illiquid and the cost of issuing bonds increased. Issuance became strained, especially
for high-yield corporates. Moreover, issuance in the leveraged loan market halted with
no new deals coming on to the market in March. Investment-grade corporate bond
issuance also declined considerably.
In response, many corporates turned to borrowing from banks, including via their existing credit
lines and revolving credit facilities (Graph 4.1). For example, draws on US commercial bank
credit lines to firms increased at record weekly rates in March. 19
19
See JP Morgan, Large cap banks (13 April 2020).
17Bank lending and deposits increased in tandem Graph 4.1
Bank deposits1 Bank lending to the non-financial sector2
Jan 2019 = 100 Jan 2019 = 100
1
Series used for each jurisdiction (seasonally adjusted); for the United States, Commercial Banks, Deposits; for the Euro area, Money
Supply M3 - Deposits, Total; for Japan, Aggregate Bank Deposits and CDS; for the United Kingdom, Retail Deposits and Cash in M4. 2
For EMEs, simple average for Brazil, Indonesia, Mexico, Russia, South Africa and Turkey. Series used for each jurisdiction (seasonally
adjusted): For Brazil, loans from financial system to nonfinancial corporations and households (total credit outstanding); for European
Monetary Union, money supply, loans to other Eurozone residents except government; for Indonesia, commercial and rural banks’ claims on
private sector (loans); for Mexico, commercial banks’ credit to private sector; for Russia, bank lending, corporate and personal loans; for
Turkey, bank lending to private sector; for the United Kingdom, monetary financial institutions' sterling net lending to private non-financial
corporations and households; for the United States, commercial banks’ loans and leases in bank credit.
Sources: national sources; FSB calculations.
Demand for US dollar liquidity increased globally. Non-financial corporates with US dollar
denominated debt, which has risen sharply since the 2008 financial crisis especially in EMEs,
sought to increase their US dollar cash holdings amid increased economic uncertainty. Obtaining
credit in markets was often more challenging than for advanced economies’ (AEs) corporates,
adding to pressure on banks (through drawdowns of bank credit lines) and domestic asset
markets (through asset sales). The appreciation of the US dollar may have resulted in margin
calls on hedged positions, potentially further increasing the demand for US dollars.
Increases in volatility triggered margin calls, which contributed to increasing the demand for
cash. A discussion of the mechanisms associated with margin calls is in Box 4.2.
18Box 4.1: MMF developments during the market turmoil 20
The MMF industry is sizeable, with approximately US$6.9 trillion of assets under management at year-
end 2019. 21 The sector plays an important role in supporting the real economy, both as a liquid and
diversified cash management tool for investors, and as a key source of funding for governments and
corporates (both financial and non-financial). Post-2008, international standards on MMF regulation
were strengthened, notably through valuation, maturity and liquidity risk management requirements. 22
The MMF sector is heterogeneous, exhibiting differing characteristics depending on fund type, structure
and investor type across jurisdictions. Such differences are important in assessing the effect of COVID-
19 related market dislocations.
The March turmoil predominantly affected US- and EU-domiciled MMFs, though the effects varied by
MMF type and currency, with significant outflows from those holding non-government debt, along with
historic inflows into MMFs invested in government debt during the dash for cash period. Other
jurisdictions did not report significant impacts on their MMF sectors.
In the US, there are three types of MMFs: government, prime and tax exempt. The latter two types
comprise institutional and retail funds. Different rules apply to different funds: government and retail
funds (both prime and tax-exempt) have a stable NAV, while institutional funds have a floating NAV.
Non-government funds must be able to introduce liquidity fees and gate redemptions, while government
funds have the option, but not the obligation, to introduce these features in their prospectuses.
Government funds must invest at least 99.5% of their assets in cash, government securities and fully
collateralised repo agreements. Prime funds have both daily and weekly liquidity requirements, while
tax-exempt funds only have a weekly liquidity requirement. All funds are required to invest in securities
with minimal credit risk.
In Europe, government MMFs are called Public Debt MMFs and are allowed to have a stable, or
constant, NAV (PDCNAV). In addition to PDCNAV funds, there are two other types of short-term (i.e.
with a maximum maturity of approximately one year) funds: low volatility (LVNAV) funds are allowed to
use a rounded NAV of 1.00 if their mark-to-market NAV remains within a tolerance of 20bps, otherwise
they need to convert to mark-to-market NAV. Short-term variable NAV funds, on the other hand, always
deal on the basis of their mark-to-market NAV. Finally, there are also longer-term VNAV MMFs, which
can have a maturity of up to two years. All types of MMFs have minimum daily and weekly liquidity
requirements and can introduce liquidity fees and gates.
Government MMFs experienced record inflows during March in the US and the EU, but the picture for
non-government MMFs is different. Prime MMFs in the US and USD-denominated MMFs ($LVNAV) in
the EU experienced the most significant redemptions. Following the central bank interventions, all non-
government MMFs honoured redemptions and none of them applied fees, gates or suspensions.
In the US, prime MMFs recorded outflows of US$125 billion in March, representing 11% of their assets,
and some faced challenges to maintain their weekly liquidity buffers. However, this figure masks
considerable variation. Redemptions from prime MMFs publicly offered to institutional investors during
the dash for cash period were considerably higher at approximately 30% of assets under management
(AUM), while redemptions from retail prime funds totalled approximately 9% of AUM. Prime institutional
MMFs not offered to the public, which are often used by asset management firms to manage their cash,
saw even lower redemptions at approximately 6% of AUM. For publicly offered funds, concerns about
the potential application of gates or fees – which could result if a fund dropped below the 30% liquidity
20
See the IOSCO Thematic Note on Money Market Funds during the March-April Episode (November 2020).
21
See https://www.iifa.ca/industry_statistics/index.html.
22
Post-2008, IOSCO developed common international standards for the regulation and management of MMFs – see IOSCO Final
Report on Policy Recommendation for Money Market Funds (October 2012). These have assisted the development of a global
framework for MMF regulation, though domestic frameworks vary across jurisdictions in response to local market structures.
19You can also read