Real Estate Market Demand Study for the New Minas Growth Centre - JANUARY 2021 - Prepared for
←
→
Page content transcription
If your browser does not render page correctly, please read the page content below

Real Estate Market
                Demand Study for the
                New Minas Growth Centre
                JANUARY 2021

Prepared for:
Real Estate Market
Demand Study for
the New Minas
Growth Centre
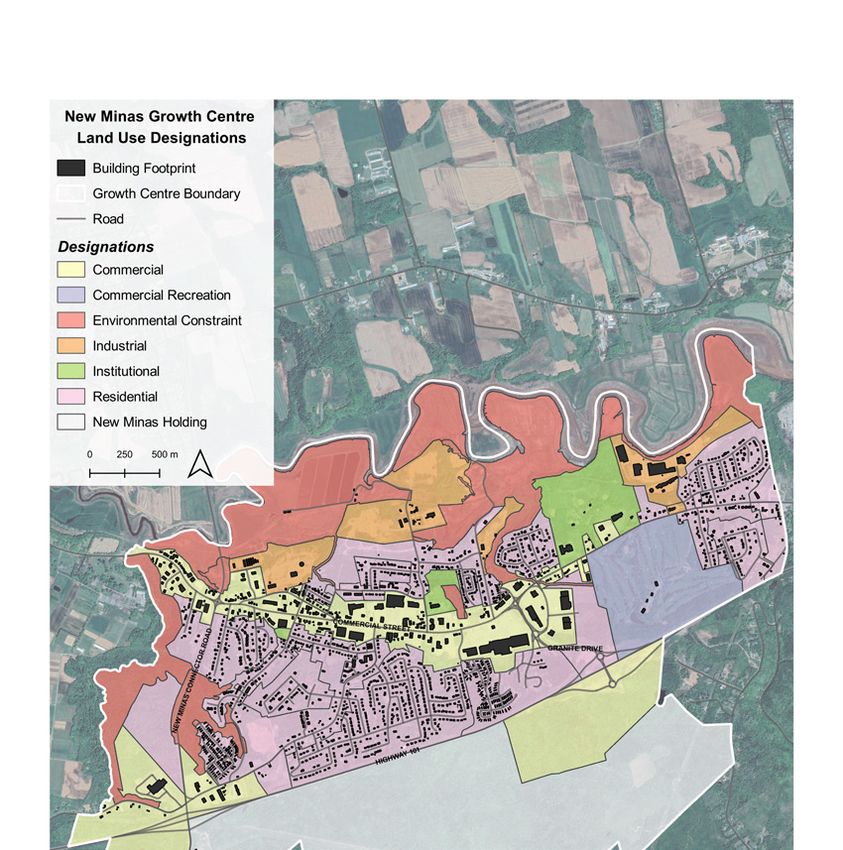
Table of Contents

Prefacei                                                    4.0     Office Market Assessment                        34
                                                             4.1     Introduction                                    34
Executive Summary                                      ii   4.2     Total Trade Area Office Demand                  34
1.0     Introduction                                    1   4.3     New Minas Office Floor Space Demand             35
1.1     Scope of Study                                  1   4.4     Demand Summary                                  38
1.2     Report Structure                                1   4.5     Policy Considerations                           40
1.3     COVID-19                                        2   5.0     Accommodations Market Assessment                41
2.0     Location and Background Information             4   5.1     Introduction                                    41
2.1     Community and Planning Context            4         5.2     Inventory & Market Overview                     42
2.2     Stakeholder and Working Group Engagement 8          5.3     Policy Considerations                           43
2.3     Recent Redevelopment and Proposals        9         6.0     Industrial Market Assessment                    46
2.4     Transportation Context                   11         6.1     Introduction                                    46
2.5     Building Permits                         11         6.2		   Employment Profile – Industrial Sector          49
3.0     Retail Market Assessment                       15   6.3     Inventory & Market Performance                  50
3.1     Location Factors, Local and Regional Context   15   6.4     Demand Summary                                  51
3.2     Trade Area                                     15   6.5     Policy Considerations                           54
3.3     Trade Area Demographics                        17   7.0     Residential Market Assessment                   55
3.4     Trade Area Retail Spending                     19   7.1     Introduction                                    55
3.5     Retail Supply                                  19   7.2     Demographics                                    56
3.6     Total Trade Area Retail Demand                 23   7.3     Residential Market Characteristics and Trends   58
3.7     New Minas Retail Floor Space Demand            25   7.4     Market Performance                              60
3.8		   Demand Summary                                 25   7.5     Demand Summary                                  61
3.9     Policy Considerations                          30   7.6     Policy Considerations                           64
Preface

Fowler Bauld & Mitchell Ltd. (“FBM”) and Turner Drake      Reference material for this report was obtained from,
Partners (“Turner Drake”) were commissioned by the         but not limited to: Statistics Canada, Municipality
Municipality of the County of Kings (“the Municipality”)   of the County of Kings, Manifold Data Mining Inc.,
to provide a technical analysis of real estate market      Environics Analytics, Commercial Real Estate/Property
supply and demand in support of the project to develop     Management Firms, International Council of Shopping
a Secondary Planning Strategy (“SPS”) for the Growth       Centers, FBM, and Turner Drake.
Centre of New Minas. The study was carried out over
the period of August 2020 to January 2021.                 FBM and Turner Drake do not warrant that any
                                                           estimates contained within the study will be achieved
The process to develop the SPS is being conducted          over the identified time horizons, but that they have
by UPLAND Planning + Design (“UPLAND”). Through            been prepared conscientiously and objectively on the
this work, a Working Group consisting of Councillors,      basis of information obtained during the course of this
Village Commissioners, and citizen representatives         study.
was established to inform the project by providing
information on the community, identifying stakeholders,    This analysis was conducted by FBM and Turner Drake
and reviewing deliverables. This SPS will include          as an objective and independent party, and is not an
the creation and refinement of policies related to         agent of the Municipality or Village, or UPLAND.
development on or adjacent to Commercial Street,
housing, active transportation, industrial lands, and      As is customary in an assignment of this type, neither
more. The SPS is also an opportunity to create a plan      our names nor the material submitted may be included
for development of lands south of Highway 101, (also       in a prospectus, or part of any printed material, or used
referred to as the Granite Interchange Lands).             in offerings or representations in connection with the
                                                           sale of securities or participation interest to the public,
The objectives of this study include forecasting           without the expressed permission of the Municipality of
opportunities for new retail, office, industrial,          the County of Kings, FBM or Turner Drake.
accommodation and residential demand in the Growth
Centre, which includes the Village of New Minas and        -FBM/Turner Drake
a small amount of land that is just outside the Village
boundaries. This document is intended to assist the
Municipality, the Village, and partners in developing
the SPS, promoting the community, working with
developers and investors, as well as attracting new
development opportunities.

Real Estate Market Demand Study for New Minas                                                                 Page i/63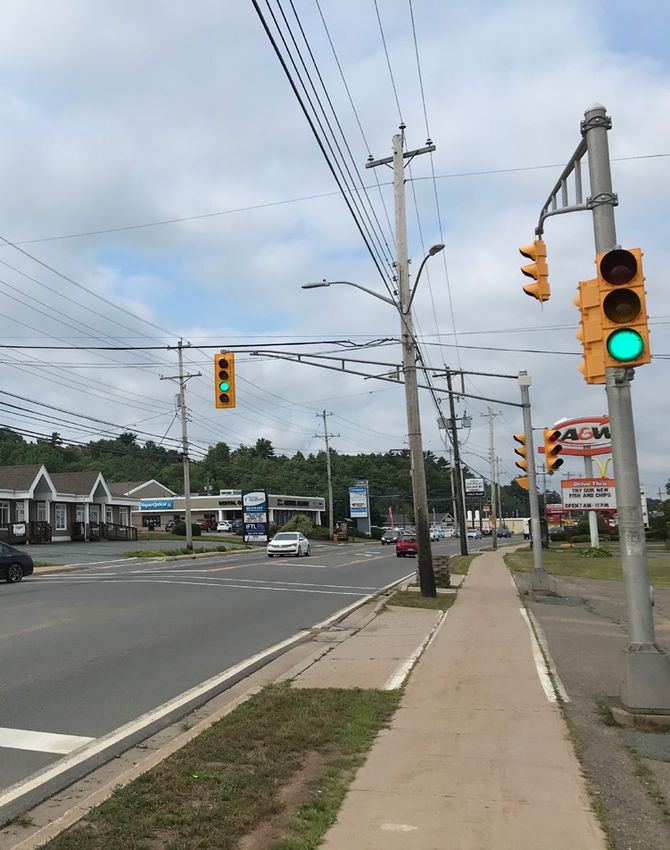
Executive Summary
RETAIL MARKET FINDINGS AND                                       Street corridor and at Exit 12 are sufficient to
                                                                 accommodate future demand prior to needing to
RECOMMENDATIONS
                                                                 develop in the Granite Interchange Lands south
                                                                 of the 101. It is however prudent and realistic to
Existing conditions
                                                                 forecast new retail lands needed in the Granite
  • New Minas is the regional retail and service hub for
                                                                 Interchange Lands being in the order of 3 to 5
    the Annapolis Valley, serving as a key centrality for a
                                                                 acres for the purposes of the SPS.
    Trade Area of over 100,000 people.
  • There is a total estimated retail floor space of 1.70     Recommendations & Considerations
    million sq. ft. with an estimated vacancy of 175,000
                                                              • Development opportunities along Commercial
    sq. ft., (10.3%). Most of this vacancy is located at
                                                                Street should be premised on infill development,
    County Fair Mall.                                           with resulting formats being freestanding pad
                                                                sites as well as smaller mixed-use nodes with
Future conditions
                                                                retail at the ground level and office, professional
  • Recognizing minimal anticipated population growth, a
                                                                services, or residential above.
    feasible forecast for new retail space is approximately
                                                              • From a retail perspective, the overall focus of
    100,000 sq. ft. to 120,000 sq. ft. over the next 10
                                                                the SPS should be to concentrate activity and
    years in New Minas. This considers New Minas
                                                                connectivity rather than diluting and disconnecting
    capturing a 60% market share of Trade Area retail
                                                                the retail fabric. Anticipating pressures at some
    demand.
                                                                point for larger commercial development in the
  • Retail is constantly changing, yet adaptable in terms       Granite Interchange lands, there should be a
    of retail and developer space and land needs, as well       consideration that large-scale retail development
    as expansion plans. It is important that demand be re-      at this location would likely to come at the
    evaluated at a minimum of every five years to ensure        expense of Commercial Street businesses.
    opportunities are being captured.                           Retailers often exhibit a herd mentality and if the
                                                                Granite Interchange lands became a new major
Future demand                                                   retail node, it could result in a gravitational shift
  • The Commercial Street corridor should continue              of retail activity resulting in numerous vacancies
    attracting a variety of retail uses and formats, with       along Commercial Street. This would disrupt
    qualities including high traffic counts, a variety          the retail vitality and also require significant
    of destinations, accessibility from the 100-series          transportation and infrastructure investment for
    highway, visibility along the corridor, as well the         connectivity across the highway.
    market of residents and workers in the nearby area.       • The SPS should consider zoning in the Granite
  • New Minas will continue to be the primary location for      Interchange Lands for neighbourhood-scale
    junior box retailers (10,000-25,000 sq. ft) and larger      retail shops and services with associated future
    format retailers (>25,000 sq. ft.) who will prefer to       residential development. This could be achieved
    locate at the centrality of the Trade Area.                 with a total development size limitation of no
  • New retailers attracted New Minas are expected to be        more than 50,000 sq. ft. for retail floor space.
    brands or strong regional franchises often with space     • In addition to this total development size
    needs of 1,000 to 1,500 sq. ft. This may require some       limitation, consideration should be given to
    landlords to modify currently available units.              implementing a specific retail store size limit in
  • Assuming all of the 10-year new retail floor space          the Granite Interchange lands to restrict large
    forecast demand were accommodated in new lands,             format retail to no greater than 25,000 sq. ft. This
    the total land area required would only be between 10       size would still allow for a grocery format retailer
    and 15 acres.                                               to locate when and as residential demand would
                                                                support such retail. The purpose of a store size
  • While a portion of the latter demand could be
                                                                limitation is to proactively prevent an exodus or
    captured in existing vacant space along Commercial
                                                                relocation of valuable large format retailers already
    Street, land assets also along the Commercial
                                                                on Commercial Street.

   Page ii/63                                                      Real Estate Market Demand Study for New Minas
                                                                                                          Preface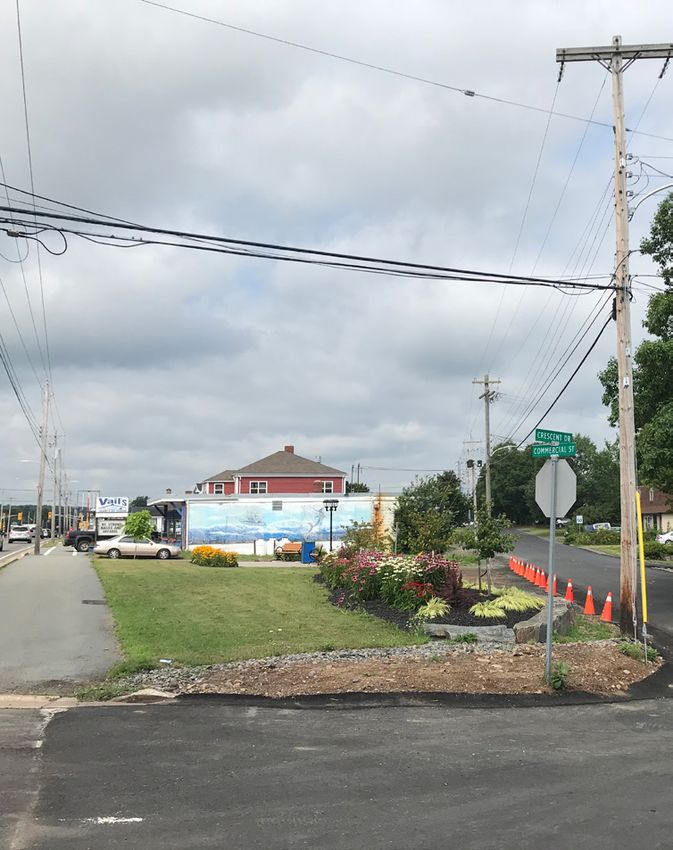
OFFICE MARKET FINDINGS AND                                     ACCOMMODATIONS MARKET
RECOMMENDATIONS                                                FINDINGS AND RECOMMENDATIONS
Existing conditions                                            Existing conditions
  • New Minas does not have an overly large nor defined          • As a regional shopping node, New Minas is a logical
    office presence. The core offering of office services          centrality for the Annapolis Valley, however it lacks
    comprise smaller professional and medical services,            tourist-friendly accommodations infrastructure and it
    with much of the office uses taking place in retail or         is therefore not as desirable, nor a promoted tourist
    industrial areas.                                              destination to which traditional accommodations
                                                                   formats are drawn.
Future conditions                                                • The prospects for growth were documented and
  • Recognizing minimal anticipated population growth, a           profiled in a 2013 Hotel Market Demand Study for
    feasible forecast for new office space is approximately        Kentville and a hotel has not been built to-date. This
    18,000 sq. ft. to 20,000 sq. ft. over the next 10 years        Study’s findings are still relevant today whereby the
    in New Minas. This considers New Minas capturing a             analysis notes that the existing hotel stock in the area
    45% market share of Trade Area office .                        is dated and low quality. The depth of the market
  • Office demand, like industrial can often fluctuate             is limited, given proximity to larger urban markets,
    depending upon external economic development-                  seasonality of demand, and small corporate base in
    driven factors that could well change the profile of the       the community, as well as the AirBNB market. The
    region and thereby introducing a larger office space           study concluded that the market opportunity was
    user. One such example is the current Workforce                marginal and those findiings are still relevant today,
    Strategy being undertaken by the Valley Regional               particularly as the tourism economy works its way
    Enterprise Network, which will seek to identify areas          back from the impact of the COVID-19 pandemic.
    of employment growth in the Annapolis Valley.
                                                               Future prospects
Future demand                                                    • The nature of the Annapolis Valley region suggests
  • Office space demand is likely to continue to be                that smaller communities are more appealing for
    accommodated as part of existing vacancies or                  smaller, boutique accommodations, while New Minas
    possibly in the form of second level space in future           may be more appropriate for a future branded format
    mixed-use projects.                                            that could have conference facilities attached.
  • There is a potential for additional medical and              • The results of the coronavirus pandemic have yet to
    professional services along the Commercial Street              be fully realized for the accommodations sector, which
    corridor.                                                      has been among the hardest hit, and any recovery will
  • Some available commercial space could be suitable              take time.
    for office users. One such trend for struggling
    enclosed Mall assets is to convert former anchor           Recommendations & Considerations
    spaces into office precincts and this could be an            • Current lands are more than sufficient for future
    option for the County Fair Mall.                               accommodations needs.
                                                                 • It is also possible and compatible that the Granite
Recommendations & Considerations                                   Interchange lands could be a strategic location for
  • Considerations in the SPS should encourage infill              a future branded accommodation format and thus
    redevelopments along Commercial Street that can                zoning should ensure this possible land use.
    include either office spaces on the ground level or
    upper levels.
  • Office space conversions should also be explored
    for older retail nodes to provide opportunities for
    employment growth or to incubate affordable local
    entrepreneurial office uses.

   Real Estate Market Demand Study for New Minas                                                               Page iii/63
   Executive Summary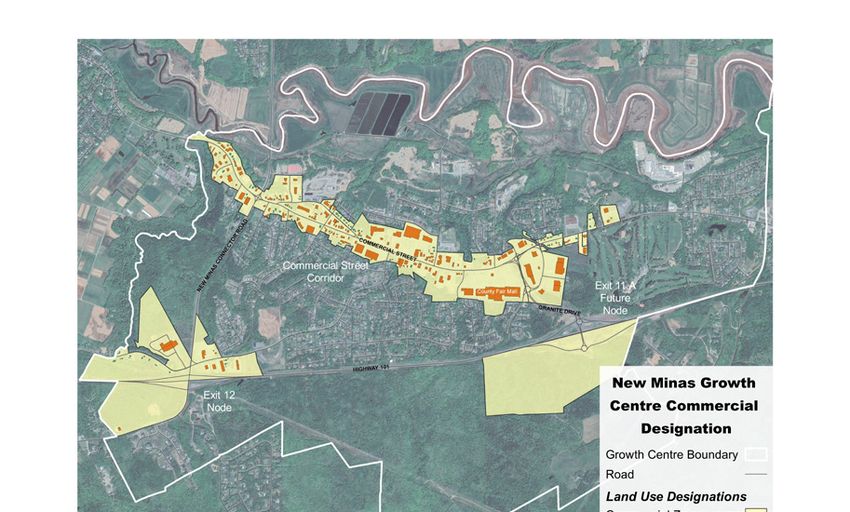
INDUSTRIAL MARKET FINDINGS AND                                  Future Demand
RECOMMENDATIONS                                                   • There is little expected change in demand for
                                                                    industrial development in New Minas without
Existing Conditions                                                 active promotion and economic development
  • There has been little to no demonstrated market                 activity that changes the current market
    demand for industrial property in New Minas in the              fundamentals. The success of such efforts, if
    past decade.                                                    undertaken, is speculative given competition in
                                                                    the surrounding communities and the lack of
  • The existing industrial land supply is poorly located. It
                                                                    specific advantage that would differentiate New
    is close to wellheads which limit its use for industrial
                                                                    Minas in this context.
    purposes, close to conflicting land uses such as
    residential neighbourhoods, and far from regional
                                                                Recommendations & Considerations
    transportation networks.
                                                                  • Industrial development is unlikely to be an
  • Current industrial users are often retail uses in               important aspect of New Minas’ future based on
    reality, and true industrial uses are often legally             current and expected trends.
    non-conforming, having pre-dated the wellhead
                                                                  • Economic promotion and development activity
    restrictions, which can limit expansion or changes in
                                                                    may generate more demand than is present in
    their operations.
                                                                    the market under “natural” conditions. However,
  • Some owners of property in the existing industrial              any attempts to do so should be undertaken after
    areas have already started to consider alternative              careful consideration of the expected costs and
    development options, recognizing the poor                       benefits.
    compatibility of those lands for industrial use.
                                                                  • If industrial development is a goal for the
  • The industrial land market is competitive in the area,          community, opportunities should be made for this
    with Kentville’s Business Park offering superior                in the expansion lands at the Granite Interchange
    opportunities at below-replacement costs.                       where more suitable development sites could be
                                                                    created.
Future Conditions
                                                                  • The existing industrial lands are a legacy issue.
  • The population is aging and future growth is likely to
                                                                    Further industrialization of these areas should be
    be weighted towards older age groups, shrinking the
                                                                    limited, and policy should seek to phase them out
    available labour force and acting as a headwind on all
                                                                    by relocating the focus of development to a better
    employment-related uses.
                                                                    location in New Minas, and transitioning current
  • New Minas’ employment base is less focussed on
                                                                    industrial lands to more suitable uses as the
    industrial sectors than the Kings County average, and
                                                                    opportunities arise.
    this is expected to continue.
  • Infrastructure extensions into the expansion areas
    of New Minas south of Highway 101 at the Granite
    Interchange Lands would likely create an opportunity
    for better industrial land supply. These areas would
    offer superior visibility and access to the highway,
    and potential for separation from more sensitive land
    uses, which would be a more attractive offering for
    industrial uses.
  • However, stiff competition for industrial development
    is expected to continue given the supply reserve held
    by other municipalities and private landowners in the
    local area.

   Page iv/63                                                          Real Estate Market Demand Study for New Minas
                                                                                                  Executive Summary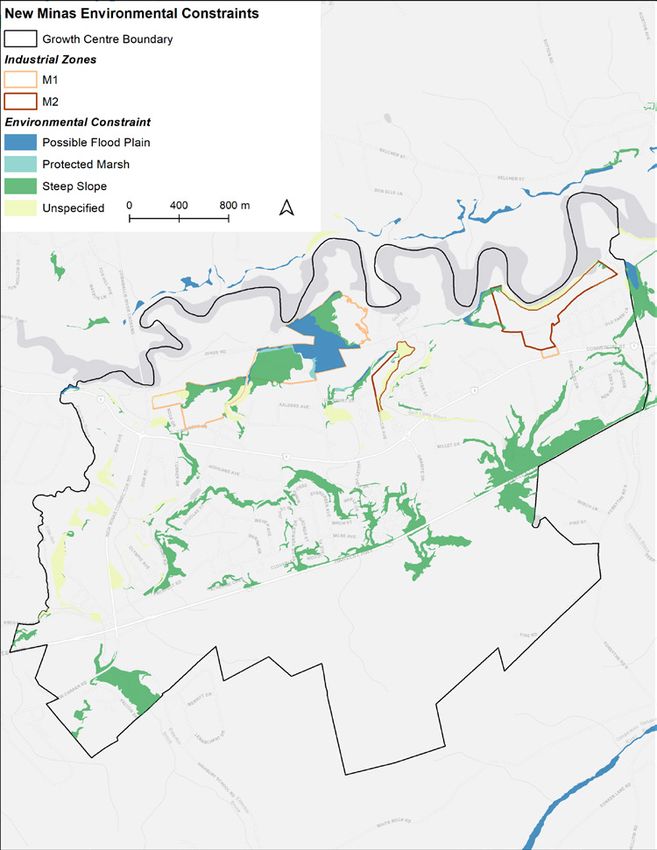
RESIDENTIAL MARKET FINDINGS                              Future Demand
AND RECOMMENDATIONS                                        • With adequate policy changes to increase residential
                                                             development options New Minas could capture between
Existing Conditions                                          15% and 22% of future growth in the broader area. This
  • Population growth in the general area of New             range is based on two potential scenarios; similar to recent
    Minas has been strong in recent years compared           years, or similar to the peak development period of New
    to longer-term trends. This is predominantly a           Minas’ history.
    result of international immigration, and migration     • Based on these two scenarios, the demand forecast
    to the area from elsewhere in Canada.                    suggests planning policy for New Minas should
  • New Minas has not achieved its proportionate             accommodate between 270 and 321 new housing units
    share of growth likely due to a dwindling supply         over the coming decade.
    of development opportunities, which is a               • These are reasonable, but optimistic estimates; in the
    function of both land availability challenges, and       context of a plan review, there is lower risk in over-
    outdated development regulations.                        estimating future growth as opposed to under-estimating it.
  • The existing housing stock in New Minas is
                                                         Recommendations and considerations
    generally 40 to 50 years old, predominantly
                                                           • Regardless of overall growth target, it can be expected that
    low density detached housing, and tenured by
                                                             housing demand will require a greater mix of housing types
    owner-occupiers.
                                                             than have been provided in New Minas historically, including
  • Some rental and higher density housing options
                                                             more ground-oriented units that are denser than typical
    are available, and these have become more
                                                             detached housing, such as semidetached, rowhouse, and
    popular with both households and developers in
                                                             small multiplex buildings.
    recent years.
                                                           • New development should be a mix of both greenfield
Future Conditions                                            expansion, and redevelopment within the existing
  • Population growth is expected to continue                community.
    at its recent pace; increased immigration is           • Commercial Street is an opportunity to allow for more
    the expected policy at the Federal level, and            mixed-use development that enhances retail and service
    conditions within Canada will likely continue            offerings and introduces more affordable and conveniently
    to support a trend of relocation to the area by          located housing options at higher densities.
    retiring and downsizing households.
  • This growth is likely to be more heavily skewed
    towards older segments of the population,
    making age-friendly housing a more important         Forecasted New Minas Residential Housing Demand
    factor than it has been historically.
                                                           New Minas Forecasted Housing Development Demand
  • As a retail and service centre, New Minas
                                                               (dwelling units required over next ten years)
    exhibits an employment base that is more
    heavily weighted towards lower-paying industries       Forecast Scenario        Market-Driven        Policy-Driven
    and occupations compared to other communities                   Detached                     135                  160
    in the area. This will likely continue, and points
                                                                    Attached                       41                     48
    toward a need for housing options which are
                                                                    Apartment                      81                     97
                                                             pe

    affordable, rental tenured, and located in areas
                                                           Ty

    which reduce other household expenses (such                     Other                          13                     16
    as locations accessible by public transit).
                                                                    TOTAL                        270                  321
                                                                    Owned                        170                  202
                                                             er
                                                            nu

                                                                    Rented                       100                  119
                                                          Te

   Real Estate Market Demand Study for New Minas                                                              Page v/63
   Executive Summary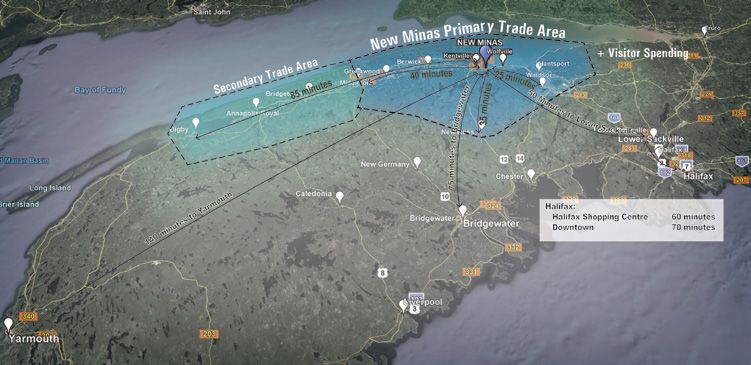
Page vi/63   Real Estate Market Demand Study for New Minas
                                        Executive Summary
1.0 Introduction
1.1 SCOPE OF STUDY 1.2 REPORT STRUCTURE
FBM and Turner Drake were commissioned by the This report is structured around the following sections:
Municipality to provide a technical analysis of real
estate market supply and demand for the New Minas 1.0 Introduction
Growth Centre in support of the project to develop Introduces the study process and structure.
the SPS for the New Minas Growth Centre. This SPS
will include the creation and refinement of policies
2.0 Location and Background Information
related to development on Commercial Street, housing,
active transportation, industrial lands, and more. The Lays out the important regional and local context of
SPS is also an opportunity to create a detailed plan New Minas, in terms of geographic location, planning,
for development of lands south of Highway 101 (also and recent development, and findings from stakeholder
referred to as the Granite Interchange Lands). This study engagement.
was carried out over the period of August 2020 to
January 2021. 3.0 Retail Market Demand Assessment
Identifies the New Minas Trade Area and demographics,
Market supply and demand is analyzed for the following including retail spending. The profile assesses the
sectors: location and characteristics of current nodes of retail
activity (“supply”) and estimates current retail market
• Retail (small retail, service, and restaurant, as well
share while quantifying future retail demand over the
as large-format retail);
next 10 years.
• Office;
• Accommodations;
4.0 Office Market Demand Assessment
• Industrial (light and heavy); and
Identifies the New Minas Office Market to determine
• Residential (low-density and multi-unit).
overall office demand that would support office growth
Within the discussion of each sector, the relevant over the next 10 years.
market area or trade area is outlined.
5.0 Accommodations Market Demand Assessment
The consultant team conducted on-the-ground research
in August 2020 to gain a firm understanding of existing Provides a high level overview of the accommodations
and future prospects in New Minas, within the context market to determine the overall demand that could be
of the Annapolis Valley region, with consideration for supportable in New Minas.
nearby communities, including the Town of Kentville,
the Town of Wolfville and the Village of Port Williams.
The Consulting Team held one-on-one stakeholder
meetings by teleconference with a range of landlords
and community stakeholders for their perspectives on
the residential, retail, office and industrial market in the
Growth Centre and the region.
Real Estate Market Demand Study for New Minas Page 1/63
Introduction6.0 Industrial Market Demand Assessment accommodations industry, but with good collaborative
Identifies and discusses the current and expected marketing, this industry may recover and rebuild. Many
balance of supply and demand for industrial federal, provincial and local organizations are stepping
development in New Minas as a function of market up to provide support and financial aid to impacted
activity, employment data, and stakeholder feedback. businesses throughout the region.
The industrial analysis also describes the conditions
Conversely, numerous forces arising out of the
under which such development occurs within the
pandemic have led to increases in demand and price for
broader study area, and how this relates to New Minas
residential property throughout Nova Scotia. The receipt
as the SPS process moves forward.
of generous government emergency benefits, sudden
broad shift towards remote work, accumulation of pent-
7.0 Residential Market Demand Assessment up demand during the spring lockdown, acceleration
Identifies and defines expected population growth of retirement and relocation plans, and differences in
and demographic profile in New Minas over the next pandemic conditions between regions of the country
10 years, and translates this into a quantity and mix of have resulted in an increase in home-buying activity
housing types and tenures that will be demanded by and interest in relocation to more affordable secondary
this population. markets such as New Minas. At the same time, the
uncertainty associated with the situation and the
reluctance to expose homes to unknown individuals
1.3 COVID-19
has resulted in a dramatic decrease in residential
This study was undertaken during the COVID-19 listings. This combination of a condensed period of
pandemic, which has presented a challenge in the elevated demand and diminished supply have resulted in
retail and tourism sectors. At the time of completing dramatic price escalation across the country and “hot”
this study, full impacts are unknown. Many retail and market conditions. Little is known or foreseeable about
accommodations businesses experienced a dramatic how these unprecedented trends may evolve, and how
decrease in revenue. This resulted in some cases, in long they may persist as the prospect of the end to
the permanent closure of retail businesses, while there the pandemic become closer to reality. The intention
have been many retailers and businesses that have of this analysis is to provide a long-term forecast for
responded in creative ways to the crisis. demand, and therefore this report takes the position that
current conditions are time-limited and a return to the
Because of the economic impact that the COVID-19 anticipated trends will materialize.
crisis has had on businesses, it is expected that
forecasts in this study will need to be tempered over the
next year, while businesses recover and slowly attract
customers. The impact will be further impacted by the
role that online shopping will have on those businesses
that don’t embrace omni-channel retailing (i.e. physical
and online). Other impacts that are sure to be felt
by the COVID-19 crisis will include the tourism and
Page 2/63 Real Estate Market Demand Study for New Minas
IntroductionReal Estate Market Demand Study for New Minas Page 3/63 Introduction
2.0 Location and Background Information
2.1 COMMUNITY AND PLANNING conditions, including expected demand for a variety of
land uses in the retail, residential, office, and industrial
CONTEXT
sectors. This study aims to respond to the need for
The Growth Centre of New Minas is located along current information and analysis to support decision-
Highway 1 between the Towns of Wolfville and Kentville making. Market demand in these sectors is quantified
and within the Municipality of the County of Kings. New and the study aims to describe where in the New Minas
Minas is the largest retail centre in the Municipality. Growth Centre is anticipated new demand is likely to
Commercial Street (Highway 1) bisects the community occur. This includes Commercial Street redevelopment
and is lined with retail shops, big box stores, and sites, greenfield sites, highway commercial areas, and
shopping centres. New Minas is the most populous lands south of Highway 101.
Growth Centre in the Municipality, while also offering
recreation facilities, a golf course, public schools, and a New Minas is part of a larger, interconnected market
number of industrial and institutional uses. The northern that includes housing, retail, industrial, employment,
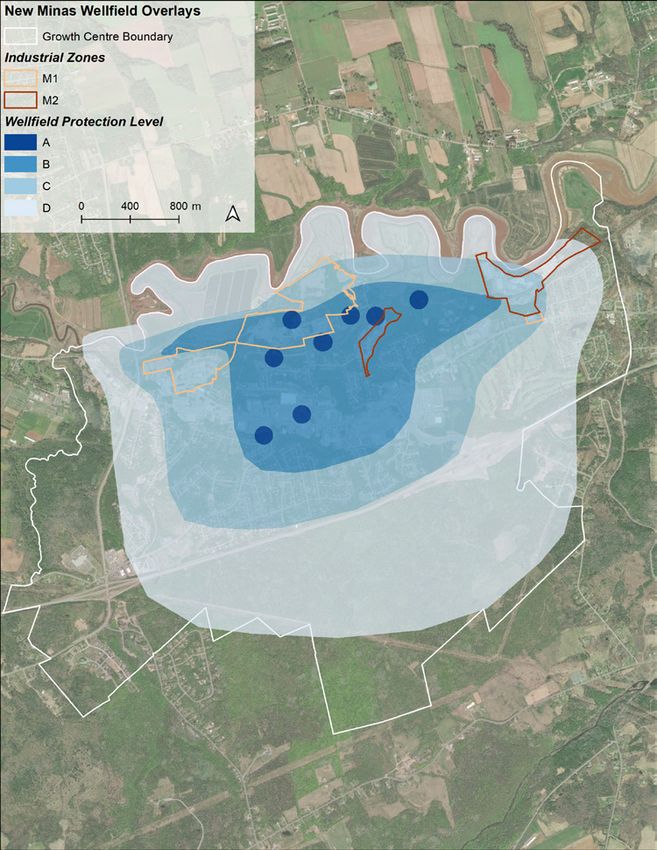
extent of the community includes industrial uses, institutional and education options in surrounding
however, intensification of industrial uses is constrained communities including Centreville, Port Williams, North
in this area by the need to protect municipal drinking Kentville, and the Towns of Kentville and Wolfville.
water wells located there. The Village of New Minas is Within the discussion of each sector, the relevant
responsible for implementing recreational programming market area or trade area and regional context is
and facilities, undertaking sidewalk maintenance, described and considered.
providing drinking water, and partnering with the
Municipality for sewer servicing. Kings County Demographics
Kings County’s most recent census data released by
In November 2019, Municipal Council adopted the Statistics Canada revealed a population of 60,600 in
new Municipal Planning Strategy (“MPS”) and Land 2016. (Kings County consists of: The Municipality of
Use Bylaw (“LUB”). These documents provide a vision the County of Kings; Towns of Berwick, Kentville and
and approach to development for the Municipality Wolfville; and Cambridge and Glooscap reserves.)
as a whole. The MPS provided direction for the This is compared to 60,589 in 2011, representing no
development of a Secondary Planning Strategy for the significant population growth over this time. Similarly,
Growth Centre of New Minas (“SPS”). The SPS will the province as a whole grew from 921,727 to 923,598,
include the creation and refinement of policies related representing a 0.2% population growth over 5 years.
to development on Commercial Street, housing, active Age distribution in the County is consistent with that for
transportation, and industrial lands. The opening of the the province, with the median age being 46.5 in Kings
Granite Drive Interchange at the end of 2018 has shifted County, and 45.5 for the province as a whole.
transportation patterns and enabled new development
opportunities; the SPS is an opportunity to create a
detailed plan for future development of these lands.
This Real Estate Market Demand Study is intended to
support decision-making around land allocation (zoning),
development standards, servicing, and transportation
needs in New Minas. The SPS process necessitates
a thorough understanding of current and potential
Page 4/63 Real Estate Market Demand Study for New Minas
Location and Background InformationMunicipal Planning Strategy (MPS) In response to these issues, the MPS aims to:
According to the MPS, the largest and most populated • Concentrate new commercial, residential, and
area in Kings County encompasses the Towns of mixed-use in Growth Centres, while encouraging
Kentville and Wolfville and Growth Centres of North a diversity of housing options;
Kentville, Centreville, New Minas, and Port Williams.
• Encourage housing that is affordable, sustainable,
This cluster accounts for approximately one third of
adequate, safe, and accessible;
the population in the County and is the key business,
• Reflect a deeper understanding of agriculture
industrial and residential area.
through access to affordable, local food;
The goal of the MPS is to provide growth management • Support a blend of traditional and non-traditional
on a regional scale, with a focus on growth within industrial and jobs sectors, including support for
vibrant, complete communities in 12 Growth Centres, new areas for economic growth; and
including the New Minas Growth Centre. The continued • Support a “buy local” movement and develop
development of Growth Centres maximizes existing comprehensive support systems for local
infrastructure investment without imposing on rural entrepreneurs, organizations, and businesses.
areas. Issues and trends noted in the MPS include:
While providing public transit is challenging for a rural
• A changing environment, and the need to mitigate settlement pattern, for the largest communities along
the impact of climate change; Highway 1, transit service is more practical. Policies
• Challenging demographics, with aging population; permit the greatest mix and density of uses near transit
routes and bus transfer areas.
• The need to attract and retain skilled workers in
a global marketplace, through strong economic Land Use policies to support Economic Development
opportunities as well as a superior quality of life seek to ensure there are sufficient development
and recreation opportunities; and redevelopment opportunities to accommodate
• Promoting the appeal of the municipality in its anticipated business growth. This includes supporting
sense of culture, community, access to agriculture new businesses not previously contemplated to locate
and industry, and proximity to Halifax as a major in appropriate locations. Policies also look to promote
economic and social hub; the Municipality as a location for new businesses, and
• Responding to a desire for communities with a encourage businesses to engage in cooperative efforts
mix of uses, active transportation opportunities, to enhance and revitalize commercial areas.
affordable housing, and services to improve public
health and safety; and Zoning in the New Minas Growth Centre
• Promoting and retaining major employers in A map of land use designations for the New Minas
manufacturing, agriculture, and academia. Growth Area is provided as Figure 2.1.
Commercial Street, between the New Minas Connector
and Granite Drive is zoned C1 (General Commercial).
The LUB permits in the C1 zone a broad range of
commercial uses, as well as business offices, and
low-impact industrial development. Limited residential
opportunities are available located in commercial
Real Estate Market Demand Study for New Minas Page 5/63
Location and Background InformationFigure 2.1: Zoning in New Minas (Data Source: Municipality of the County of Kings)
Page 6/63 Real Estate Market Demand Study for New Minas
Location and Background Informationbuildings above or behind ground floor commercial uses. These are also largely built out, and often to lower
The intention is to ensure that commercial uses continue density formats that follow the R1 and R2 standards.
to be the most prominent uses on the ground floor Some undeveloped areas also carry this higher intensity
on a given property and to ensure that a commercial residential zoning, however these tend to be oddly
presence is maintained. shaped lot assemblies and remnant lands located within
or close to environmentally constrained areas. Lack of
Small areas of C3 (Mixed Commercial Residential) higher intensity development in these areas is likely
zoning is provided on Commercial Street (east of Granite due to a number of reasons: site constraints, policy
Drive) and on Crescent Drive. This zone provides constraints, or simply an insufficient timeframe within
flexibility to permit both multi-unit residential and lower which to observe a full development process. Ultimately,
impact commercial uses, such as local retail or business these constraints can be addressed with sufficient time
offices. and investment if market conditions justify it. Therefore,
regardless of the precise combination of reasons,
C6 (Comprehensive Business Development) zoned their lack of development can be taken as a high-level
lands are also provided. This zone enables the indication of marginal economic feasibility in those sites
development of large-scale and comprehensively under current conditions.
planned business areas by development agreement.
Two categories of industrial zoning, M1 and M2, exist
C5 zoning (Highway commercial) exists near the partially to permit light and heavy industrial development in New
developed lands at Exit 12 and the undeveloped lands Minas, respectively. However, due to the presence of
south of the 101 at Exit 11A (Granite Drive Interchange). wellfield protection overlays, virtually all M2 zoned lands
The purpose of this is to complement established function as M1 due to restrictions on heavy industrial
commercial areas like Commercial Street by permitting uses within these protection areas. The existing heavy
commercial uses to serve the traveling public, uses that industrial uses are legally non-conforming; they predate
are not usually desired within main street commercial the wellfield restrictions and it is unlikely that they would
or mixed use areas, and to provide for commercial uses be permitted under current regulations. These industrial
that benefit from exposure to high traffic volumes or lands are located primarily in the northern extent of
require direct access to a major transportation route. New Minas, close to the riverfront and in proximity
to environmental constraints such as flood plains and
Drive-through facilities are permitted within any
wetlands. They abut largely residential neighborhoods
Commercial zone except C2 and C3. Parking minimums
to the south, through which traffic must flow to
are established based on square footage for a particular
reach Commercial Street and the broader arterial road
use. Business offices may be located in commercial
network.
zones, as well as in the R4 and M1 zones.
The New Minas Holding Zone (H1) is established to
Residential development is permitted under a number
accommodate rural uses that will not impact future
of zones, however most are geared towards single-unit
urban development south of Highway 101, as per policy
or low density formats, with the most prevalent zones
2.1.9 of the Municipal Planning Strategy. The intention of
being R1 (One Unit) and R2 (One and Two Unit).
this zone is that detailed planning would come as part of
Some high-density residential zoning, R3 and R4 this SPS.
specifically, exist in pockets throughout New Minas.
Real Estate Market Demand Study for New Minas Page 7/63
Location and Background Information2.2 STAKEHOLDER AND WORKING opportunities for meetings are Louis Millett
Centre, with a max 200 people, and Acadia
GROUP ENGAGEMENT
University and CFB Greenwood;
Stakeholder meetings • It would be helpful if there was staff or resources
at the Village or Municipality focused on business
Stakeholder meetings were held with the following
attraction and retention in New Minas, or closer
groups and individuals:
coordination with the Valley Regional Enterprise
• Commercial landlords (Crombie, Plaza, Pro REITs); Network (Valley REN);
• Valley Regional Enterprise Network; • While Kentville has actively beautified its
• Jeff Kelly (New Minas Business Association and downtown recently and tried to attract
Flower Cart Group); businesses, this has not as much been the
• Lindsay Young (Kentville Industrial Park); case in New Minas and there is a local interest
in improved beautification and branding along
• NSBI;
Commercial Street;
• Parson Investments;
• There is interest in positioning New Minas as a
• Safeguard Property Management; and place where people could stop and walk between
• Somerled Properties. destinations, rather than drive-in & drive-out;
The following notes below summarize themes that were • There is a lack of small-scale commercial space
discussed with consideration for various sectors. (approx. 1,000 sq. ft. or smaller);
• There are traffic issues on Commercial Street, but
Retail, Office and Accommodations: this improved with the recently built roundabout
• Retail niche for New Minas is value and essentials (traffic congestion is worst at 4-6 Thu and Fri);
(those looking for fashion comparison shopping • Walmart is a draw to Commercial Street, though
will typically travel to Halifax); speculatively they may wish to relocate near the
• High level of vacancy at County Fair Mall, with highway and this would negatively impact nearby
larger “big box” retailers, less viable in the current businesses;
market. There is an opportunity to focus on • It is unclear if Cineplex will survive the pandemic
services rather than fashion, and to re-demise the and this could be another big box vacancy;
Mall (i.e. alter entries and interior divisions and • Goal of the recently formed New Minas Business
circulation to better serve tenant needs); Association is to improve communication and
• Some retail vacancy in a soft retail market - for advocacy between the Village, Municipality
the most part, those retailers who want to be and retailers (Association has approximately 50
there are already there and change will be about members, including Canadian Tire, Burger King,
“moving of pieces” rather than new entries; and small entrepreneurs);
• Mixed-use tends not to be of interest to current • Some see food trucks as unfair competition for
commercial landlords; bricks and mortar restaurants;
• There may be an opportunity for hotel – though • There are labour challenges for retailers, which
some of the current inventory needs updating; relate also to accommodating demand as well
• Convention space is also lacking, with current as affordable and adequate housing and transit
needs; and
Page 8/63 Real Estate Market Demand Study for New Minas
Location and Background Information• Retail rental rates are stabilized and healthy, but 2.3 RECENT REDEVELOPMENT AND
can lead to smaller local retailers relocating to
PROPOSALS
Kentville for perceived better value.
This study is informed by a number of recent
Industrial:
developments, transportation changes, and proposals:
• Current industrial lands are poorly located by a
number of measures. As an example, a current Kent relocation
owner of facilities in the industrial area noted In 2017, Kent relocated from a central location on
that they have discontinued use of their facility Commercial Street to a larger store near exit 12. The
there (shifted all activity to a similar facility in building on Commercial Street is currently vacant, but
Kentville that was purchased at the same time has been purchased with intention to renovate as a
as their New Minas property) due to poor road warehouse with a frontage comprised of smaller retail
connectivity to major transportation routes (for spaces. (see Figure 2.2).
large vehicles) and conflicts arising from the
proximity to nearby residential areas through Granite Interchange and Plaza REIT build-out at
which their vehicles would have to travel; Commercial and Granite
• Windsor-Berwick corridor users seek highway Three sites owned by Plaza REIT, (Commercial Street
access, separation from residential, highway Plaza, Silver Fox Plaza, and Granite Drive Plaza) near the
visibility, and development-ready land; and corner of Commercial Street and Granite Drive, were
• There is no “organic” demand for industrial largely developed over the last 10 years, in part replacing
property in New Minas; Kentville captures a Future Shop location. These sites are now nearly
demand because subsidized land is available. completely built out and occupied. They benefit from
improved access via the new interchange and contain
Residential:
a number of major brands, including Home Depot,
• There is an increase in residential demand from Lawtons, Michaels, Winners/Home Sense Giant Tiger,
outside local region for retirement living; Pet Valu and others at this gateway into the community
(See Figure 2.3). The Granite Interchange further
• Detached housing is still big part of market, but
provides access to expansion lands south of Highway
emphasis on apartment or attached housing for
101.
future development;
• Demand for multi-unit on Commercial Street and 9406 Commercial Street (Pinehurst Apartments)
expansion lands for downsizers; and 39 units were recently completed on Commercial
• Convenient location is a big selling point for Street. (See Figure 2.4)
residential, with access to shops and services,
with less reliance on vehicles.
9209 Commercial Street Mixed Use proposal
Proposal from Kadray Holdings for 40 units of housing
Presentation to the Working Group with retail fronting the street. (See Figure 2.5)
The FBM and Turner Drake team presented preliminary
findings of this study to the Working Group on October
27, 2020.
Real Estate Market Demand Study for New Minas Page 9/63
Location and Background InformationFigure 2.2: Former Kent site Figure 2.5: 9209 Commercial Street site
Figure 2.3: Plaza REIT lands at Commercial and Granite Figure 2.6: Flower Cart Group proposal
(Source: Flower Cart Group)
Figure 2.4: Pinehurst Apartments Figure 2.7: RCMP New Minas Detachment
New Facility For:
View 1 December 2019
(Source: rentalslocator.ca)
Page 10/63 Real Estate Market Demand Study for New Minas
Location and Background InformationFlower Cart Group proposal are from Nova Scotia Transportation and Infrastructure
Flower Cart Group is a growing social enterprise, Renewal 2009-2016 and a 2007 traffic impact study,
with woodworking, co-pack, employment and bakery produced by Atlantic Road and Traffic Management for
operations, with 22 staff and 200 workers, focused on The Plaza Group. Traffic volumes are mapped on Figure
those with complex barriers to employment. A future 2.8. Volumes show consistently an Annual Average
facility and storefront is planned for a site next to the Daily Traffic (AADT) of approximately 4,000 to 9,000
Louis Millett complex. (See Figure 2.6) vehicles per direction per day on Highway 1. There is a
peak spike at the afternoon rush hour of 4 to 6 pm, and
Valley Crossroads Health & Wellness Centre approximately 10% are trucks (See Figure 2.9). It is
Recently completed as a collaboration between local anticipated that updated traffic counts and analysis will
health care providers, this new centre provides space for be produced in the near future through a traffic study as
family practices and other health-related businesses. part of the SPS development process. The New Granite
Drive Interchange (Exit 11A) was completed in 2018 to
RCMP New Minas Detachment
improve connection to New Minas. As shown in Figure
The new facility on Commercial Street brings together
2.10, a new collector roadway is proposed as part of
administrative units for RCMP Kings District and
new development south of the 101.
operational units for 73 full-time employees. (See
Figure 2.7)
Five regional bus routes are operated by Kings Transit.
Miners Landing Apartments (See Figure 2.11). Buses run every two hours, without
Located just west of New Minas Growth, the service on Sundays and Holidays. Typical ridership
development contains a recently completed apartment in June 2019 was 1,300 to 1,400 per day. During the
building of 47 units and plans for three additional pandemic, in June 2020, ridership has been 350 to 400
buildings of the same scale. With higher than expected people per day (Source: Saltwire, June 23, 2020).
demand for the first building, development of the
following phases is being accelerated, with two of the 2.5 BUILDING PERMITS
three remaining buildings already under construction.
Historical building permit activity can provide empirical
evidence of growth trends and dynamics to confirm
and support projected real estate opportunities. Table
2.4 TRANSPORTATION CONTEXT 2.1 and Figure 2.12 illustrate historic volume of building
Transportation attributes are an essential foundation to permits in the New Minas Growth Centre. This reveals
meeting demand in the Retail, Office, Accommodations, a stable pattern of development permit activity overall,
Industrial and Residential sectors. An understanding with approximately 1 new commercial construction per
of these attributes can help create the necessary year over the past 5 years. There was approximately 5
conditions for attracting and retaining businesses and to 10 new residential units constructed per year, with
residents to locate in a community. the notable exception of 2018, which saw a permit for a
39-unit residential building at 9406 Commercial Street.
Highway 1 (Commercial Street) is the heavily traveled The total permits estimated value fluctuates between
spine of New Minas, whereas Highway 101 provides approximately $2m and $10m. The high value in 2016
a bypass of the community for regional connections. includes the Kent redevelopment, with an estimated
The most recent traffic counts available for the area value of $5.75m.
Real Estate Market Demand Study for New Minas Page 11/63
Location and Background InformationFigure 2.8: Traffic Counts (Source: Nova Scotia Transportation and Infrastructure Renewal, traffic counts and analysis since 2008)
3
.
Table A-4 - Trunk 1 (August 22 to 29, 2006)
1 (1 Km East of New Minas East Line)
.
Hour Days of the Week
2 Hourly Averages
Page A-2
Mon-28 Tue-29/22 Wed-23 Thu-24 Fri-25 Sat-26 Sun-27 Week Weekday
0
1 59 75 104 82 101 103 112 91 84
2 29 40 52 42 82 48 47 49 49
3 26 24 25 35 34 47 60 36 29
4 16 25 32 27 24 18 46 27 25
5 22 22 27 26 37 19 19 25 27
6 90 84 92 84 101 48 38 77 90
7 206 196 236 211 215 111 73 178 213
8 482 497 475 525 488 279 165 416 493
9 539 606 596 647 676 421 219 Annual average
529 613 daily traffic (AADT)
10 668 675 635 684 714 652 425 Source: NS Transportation
636 675 and Infrastructure Renewal
11 802 751 710 750 740 842 568 738 751
Location Year Eastbound Westbound
12 863 844 851 899 965 1021 659 872 884
13 924 847 930 1008 1107 944 783 1
935 2015
963 10,500 (both directions)
14 936 803 942 1011 1084 1007 812 942 2016
955 4,390 4,400
15 1060 864 1006 930 1053 1123 802 977
2 983
2009 8,720 9,410
4 16 1014 871 937 1060 1061 1088 829 980 989
2012 5,090 5,740
17 1067 937 1023 1048 1103 975 867 1003 1036
18 961 864 1027 1091 1081 896 671 3
942 2009
1005 11,300 (both directions)
2012 11,660 (both directions)
19 749 768 864 945 902 756 589 796 846
2015 11,500 (both directions)
20 690 734 801 815 853 764 547 743 779
21 623 695 808 828 846 646 505 4
707 2009
760 6,440 7,730
22 409 510 569 629 633 468 352 510 2012
550 6,690 6,590
2015 7,130 7,380
23 224 257 295 307 336 273 195 270 284
24 185 168 194 177 220 179 114 177 189
TOTALS 12644 12157 13231 13861 14456 12728 9497 12653 13270
Estimated 2006 AADT is 11,400 vehicles per day [Traffic count - axle count divided by two]
Figure 2.9: Hourly Volumes on Highway 1 (Source: Atlantic Road and Traffic Management, 2007 traffic study for Plaza Group)
Figure A-2 - Trunk 1 - 1 Km East of New Minas East Line
Average Weekday Hourly Volumes - 2000, 2003 and 2006
1400 - The summer count (2006) does not have
an AM peak hour volume 'spike'
- The 2003 count is a vehicle classification
count and represents actual numbers of
1200
vehicles, including 10% trucks
1000
Appendix A - Traffic Volume Data
Hourly Volumes
800
600
400
200
0
0 2 4 6 8 10 12 14 16 18 20 22 24
Hours of the Day
2000 2003 2006
Page 12/63 Real Estate Market Demand Study for New Minas
Location and Background Information
December 2006 .Figure 2.10: Identified Road Improvements from Kings 2050
(Source: Hatch Mott MacDonald Kings 2050 Road Network Assessment (2012))
Figure 5: Village of New Minas - Identified Road Improvements
New Granite
Drive Interchange
New Collector
Roadway
LEGEND
Existing Provincial Roads
Proposed Future Roads
Identified Intersection Improvements
17
KINGS
Figure 2.11: Kings TRANSIT
Transit Route ROUTE
Map (Source: MAP
Kings Transit Rider Guide)
Real Estate Market Demand Study for New Minas Page 13/63
Location and Background InformationTable 2.1: New Minas Growth Centre Building Permit Overview, 2015-2020
(Data Source: Municipality of the County of Kings)
Commercial Industrial Park/Institutional Residential
Total New
Total Total Permits
Year Reno/Add/ New Reno/Add/ New Reno/Add/ New Reno/Add/ New residential
Permits Estimated Value
Garage/Shed Construction Garage/Shed Construction Garage/Shed Construction Garage/Shed Construction units
2015 35 8 0 0 0 1 0 22 4 5 $ 1,849,830
2016 48 15 2 2 1 2 0 18 8 11 $ 10,902,530
2017 44 16 0 1 0 4 0 20 3 9 $ 2,090,440
2018 45 16 2 1 0 3 0 19 4 47 $ 8,583,212
2019 60 25 1 2 0 1 0 30 1 5 $ 5,646,145
2020 48 21 1 1 0 0 0 20 5 11 $ 6,895,101
(YTD Sep 18, 2020)
Figure 2.12: Building Permit Overview, 2015-2020 (Data Source: Municipality of the County of Kings)
To t a l P e r m i t s Residential Permits
(Reno and New Build) (New Construction)
70 9
60 8
60 8
48 48 7
50 44 45 6 5
40 35 5 4 4
4 3
30
3
20 2 1
10 1
0
0 2015 2016 2017 2018 2019 2020 (to
2015 2016 2017 2018 2019 2020 (to Sept) Sept)
Commercial Permits New Residential Units
(New Construction) 50 47
3 45
40
2 2 35
2 30
25
1 1 20
1 15 11 11
9
10
5 5
0 0 5
0 0
2015 2016 2017 2018 2019 2020 (to Sept) 2015 2016 2017 2018* 2019 2020 (to Sept)
* 2018 includes a 39-unit residential building at 9406 Commercial Street.
Page 14/63 Real Estate Market Demand Study for New Minas
Location and Background Information3.0 Retail Market Assessment
3.1 LOCATION FACTORS, LOCAL
AND REGIONAL CONTEXT
Location factors are an essential foundation to retail
success, and an understanding of these factors can
help create the necessary conditions for attracting
and retaining businesses in a community. New Minas
is understood as the “big box” and service centre for
the Annapolis Valley Region. In contrast, the towns
of Kentville and Wolfville (refer to photos in Figure
3.1) present a comparatively more walkable, finer
grained retail experience, with a focus on smaller, local
independent retail businesses. Figure 3.2 provides
representative imagery of retail storefronts in New
Minas.
3.2 TRADE AREA
In order to create a framework for evaluating retail
demand, it is necessary to initially define and identify
the Trade Area from which retail sales in New Minas
are most frequently and likely to be sourced. A Trade
Area(s) recognize drive times, demographics, spending
attributes and competition, which collectively portray
the market to prospective tenants, developers and
investors.
Identifying the Trade Area is important for understanding
the total market potential available to current and
future retailers and developers. The local and regional
residential base has particular demographic and
spending habits that provide insight as to the type of
compatible retail tenants, the amount of retail floor
space supportable in the market, and the current inflow
or outflow of retail sales, and for which categories such
inflow or outflow exists.
Major considerations in defining Trade Areas were
applied to New Minas to determine the most realistic
Trade Areas, as well as to help sensitize potential
market share inputs of corresponding Trade Area retail
spending. Figure 3.1: Comparison retail environments
From top to bottom, New Minas, Wolfville, Kentville, Windsor
Real Estate Market Demand Study for New Minas Page 15/63
Retail Market AssessmentNew Minas represents a key centrality for Annapolis 8. Patterns of existing and future residential and
Valley residents. Trade Area determinants include: commercial development.
1. Transportation networks, including streets and For this particular study, the Trade Area is delineated
highways, which affect access, drive times, utilizing a combination of drive times with regard to
commuting and employment distribution patterns; competitive forces including Halifax’s retail draw, and
2. Major infrastructure projects both planned or that of Yarmouth and Bridgewater. The resulting Trade
under development which could affect future Area is shown in Figure 3.3. This Trade Area is reflected
travel patterns; in both the Retail and Office sectors analysis.
3. Overall community development vision, including
The Primary Trade Area has a population of
an understanding of key nodes’ characteristics;
approximately 84,000 people. A Secondary Trade Area,
4. Local and regional competitive environment,
with a population of approximately 16,000 people, is
present and future;
indicated extending further to the west. This latter
5. Proposed generative uses (retail, cultural, civic, population would likely travel to New Minas for some
etc.) and their relationship within the wider area; “bigger ticket” or less frequent discretionary purchases.
6. Significant natural and man-made barriers Retail in New Minas also benefits from purchases by
(e.g. water features, highways, industrial areas); visitors, students, and drive-through traffic.
7. De facto barriers resulting from notable
socioeconomic differentiation; and
Figure 3.3: Trade Area Determinants and drivetimes to competitive markets
Page 16/63 Real Estate Market Demand Study for New Minas
Retail Market Assessment3.3 TRADE AREA DEMOGRAPHICS Overall, individual, family and household incomes in
Trade Area are roughly aligned, though slightly lower
Demographic information for the Trade Area is provided than the provincial average. This represents overall
in Figure 3.4 and Table 3.1. Using the province as economic health, considering that the region represents
a benchmark, the population in the Total Trade Area an area with a slightly lower cost of living compared
has a slightly higher number of people aged over 65, to urban areas. Furthermore, seniors, who represent a
and fewer in the 25 to 34 year age range. Household higher proportion of the population, would typically have
incomes are among the most direct determinants of a lower income than working age adults.
spending patterns and the potential for spending on
retail, food and beverage, entertainment, and services.
Figure 3.4: Trade Area Demographics (Source: Manifold Data Mining and FBM)
Ag e D i s t r i b u t i o n :
To t a l Tr a d e Ar e a C o m p a r e d t o t h e P r o vi n c e
25.00%
20.00%
15.00%
10.00%
5.00%
0.00%
0‐14 15‐24 25‐34 35‐44 45‐54 55‐64 65+
NS 14.52% 11.21% 12.06% 11.77% 13.88% 16.78% 19.78%
Total Retail Trade Area 14.22% 11.20% 10.20% 10.69% 13.60% 17.22% 22.87%
I n c o m e D i s t r i b u t i o n ( p o p u l a t i o n a g e 1 5 a n d o ve r ) :
To t a l Tr a d e Ar e a C o m p a r e d t o t h e P r o vi n c e
25.00%
20.00%
15.00%
10.00%
5.00%
0.00%
Under $10,000 to $20,000 to $30,000 to $40,000 to $50,000 to $60,000 to $70,000 to $80,000 to $90,000 to $100,000 to $150,000
$10,000 $19,999 $29,999 $39,999 $49,999 $59,999 $69,999 $79,999 $89,999 $99,999 $149,999 and over
NS 12.28% 17.44% 15.67% 13.38% 10.87% 8.03% 5.91% 4.64% 3.62% 2.44% 3.38% 2.33%
Total Retail Trade Area 12.95% 19.97% 17.36% 13.90% 10.82% 7.60% 5.36% 3.91% 2.82% 1.79% 2.29% 1.22%
Real Estate Market Demand Study for New Minas Page 17/63
Retail Market AssessmentTable 3.1: Trade Area Demographics
(Source: Manifold Data Mining and FBM)
Benchmark: Nova New Minas New Minas New Minas
Demographic Attributes Scotia Primary Trade Area Secondary Trade Area Total Trade Area
value percent value percent index value percent index value percent index
Total population 943,650 84,238 16,364 100,603
Total population age 15 and over 806,590 71,906 14,393 86,299
Total number of private households 417,428 38,053 7,397 45,450
Average number of persons in private households 2.22 2.14 96 2.15 97 2.14 96
Total population in private households 927,383 81,549 15,891 97,440
Total number of census families in private households 278,437 25,339 5,229 30,569
Average number of persons per census family 2.72 2.62 96 2.55 94 2.61 96
Total population in families 756,609 66,391 13,326 79,718
Total number of labour force age 15 and over 502,787 40,103 8,768 48,871
POPULATION AGE
Population age 0-14 137,060 14.52% 12,333 14.64% 101 1,971 12.05% 83 14,304 14.22% 98
Population age 15-24 105,757 11.21% 9,663 11.47% 102 1,603 9.80% 87 11,266 11.20% 100
Population age 25-34 113,786 12.06% 9,029 10.72% 89 1,234 7.54% 63 10,263 10.20% 85
Population age 35-44 111,109 11.77% 9,256 10.99% 93 1,495 9.14% 78 10,752 10.69% 91
Population age 45-54 130,944 13.88% 11,479 13.63% 98 2,203 13.46% 97 13,682 13.60% 98
Population age 55-64 158,362 16.78% 14,189 16.84% 100 3,138 19.17% 114 17,327 17.22% 103
Population age 65+ 186,632 19.78% 18,289 21.71% 110 4,720 28.85% 146 23,010 22.87% 116
DWELLING
Total number of occupied private dwellings 417,428 38,053 7,397 45,450
Average dwelling value $ $277,097 $241,441 87 $197,366 71 $234,268 85
Home owners 286,393 68.61% 26,847 70.55% 103 5,627 76.08% 111 32,475 71.45% 104
Home tenants 128,606 30.81% 11,145 29.29% 95 1,718 23.22% 75 12,862 28.30% 92
Band housing 2,429 0.58% 61 0.16% 28 52 0.70% 121 113 0.25% 43
HOUSEHOLDS
One-family households 270,377 64.77% 24,790 65.15% 101 4,631 62.61% 97 29,421 64.73% 100
Multiple-family households 5,483 1.31% 438 1.15% 88 49 0.66% 50 487 1.07% 82
Non-family households 141,568 33.91% 11,429 30.03% 89 2,496 33.75% 100 13,925 30.64% 90
EDUCATION
Total population aged 15 years and over by highest certificate,
806,590 71,906 14,393 86,299
diploma, or degree
No certificate, diploma, or degree 158,993 19.71% 15,475 21.52% 109 3,714 25.80% 131 19,189 22.24% 113
High school diploma or equivalent 203,897 25.28% 18,818 26.17% 104 3,504 24.35% 96 22,323 25.87% 102
Post-secondary certificate, diploma, or degree 443,699 55.01% 37,612 52.31% 95 7,175 49.85% 91 44,787 51.90% 94
Apprenticeship or trades certificate or diploma 79,569 9.87% 7,199 10.01% 101 1,694 11.77% 119 8,894 10.31% 104
College, CEGEP or other non-university cert or diploma 174,829 21.68% 16,524 22.98% 106 3,202 22.24% 103 19,726 22.86% 105
University certificate or diploma below bachelor level 19,960 2.48% 1,535 2.14% 86 368 2.56% 103 1,903 2.21% 89
University cert, diploma, or degree at bach level or above 169,341 21.00% 12,353 17.18% 82 1,911 13.28% 63 14,264 16.53% 79
INCOME
Average family income $ $106,068 $91,311 86 $78,634 74 $89,142 84
Average household income $ $85,693 $76,258 89 $63,926 75 $74,251 87
Average income population age 15 and over ($) $46,290 $41,476 90 $36,312 78 $40,610 88
Population with income Under $10,000 (including loss) 95,134 12.28% 8,679 12.62% 103 2,021 14.58% 119 10,700 12.95% 105
Population with income $10,000 to $19,999 135,140 17.44% 13,251 19.27% 110 3,250 23.45% 134 16,501 19.97% 115
Population with income $20,000 to $29,999 121,421 15.67% 11,725 17.05% 109 2,623 18.92% 121 14,348 17.36% 111
Population with income $30,000 to $39,999 103,665 13.38% 9,445 13.73% 103 2,041 14.73% 110 11,486 13.90% 104
Population with income $40,000 to $49,999 84,226 10.87% 7,547 10.97% 101 1,394 10.05% 92 8,940 10.82% 100
Population with income $50,000 to $59,999 62,178 8.03% 5,421 7.88% 98 859 6.20% 77 6,279 7.60% 95
Population with income $60,000 to $69,999 45,776 5.91% 3,886 5.65% 96 544 3.92% 66 4,430 5.36% 91
Population with income $70,000 to $79,999 35,969 4.64% 2,879 4.19% 90 350 2.53% 55 3,230 3.91% 84
Population with income $80,000 to $89,999 28,056 3.62% 2,075 3.02% 83 252 1.82% 50 2,327 2.82% 78
Population with income $90,000 to $99,999 18,874 2.44% 1,312 1.91% 78 171 1.23% 50 1,482 1.79% 73
Population with income $100,000 to $149,999 26,215 3.38% 1,671 2.43% 72 222 1.60% 47 1,894 2.29% 68
Population with income $150,000 and over 18,055 2.33% 880 1.28% 55 132 0.96% 41 1,012 1.22% 52
Index Legend:
Color
Compared to Benchmark (%)
>=180 Extremely High
>=110 and =90 and =50 andYou can also read