A Study of China's Explosive Growth in the Plug-in Electric Vehicle Market - INFO
←
→
Page content transcription
If your browser does not render page correctly, please read the page content below
ORNL/TM-2016/750

A Study of China’s Explosive Growth in
the Plug-in Electric Vehicle Market

 Shiqi Ou
 Zhenhong Lin
 Zhixin Wu
 Jihu Zheng
 Renzhi Lyu
 Steven Przesmitzki
 Xin He
 Approved for public release.
 Distribution is unlimited.
 January 2017
DOCUMENT AVAILABILITY
Reports produced after January 1, 1996, are generally available free via US Department of Energy
(DOE) SciTech Connect.

 Website http://www.osti.gov/scitech/

Reports produced before January 1, 1996, may be purchased by members of the public from the
following source:

 National Technical Information Service
 5285 Port Royal Road
 Springfield, VA 22161
 Telephone 703-605-6000 (1-800-553-6847)
 TDD 703-487-4639
 Fax 703-605-6900
 E-mail info@ntis.gov
 Website http://www.ntis.gov/help/ordermethods.aspx

Reports are available to DOE employees, DOE contractors, Energy Technology Data Exchange
representatives, and International Nuclear Information System representatives from the following
source:

 Office of Scientific and Technical Information
 PO Box 62
 Oak Ridge, TN 37831
 Telephone 865-576-8401
 Fax 865-576-5728
 E-mail reports@osti.gov
 Website http://www.osti.gov/contact.html

 This report was prepared as an account of work sponsored by an
 agency of the United States Government. Neither the United States
 Government nor any agency thereof, nor any of their employees, makes
 any warranty, express or implied, or assumes any legal liability or
 responsibility for the accuracy, completeness, or usefulness of any
 information, apparatus, product, or process disclosed, or represents that
 its use would not infringe privately owned rights. Reference herein to
 any specific commercial product, process, or service by trade name,
 trademark, manufacturer, or otherwise, does not necessarily constitute
 or imply its endorsement, recommendation, or favoring by the United
 States Government or any agency thereof. The views and opinions of
 authors expressed herein do not necessarily state or reflect those of the
 United States Government or any agency thereof.

ORNL/TM-2016/750

 Energy and Transportation Science Division

A Study of China’s Explosive Growth in the Plug-in Electric Vehicle Market

 Shiqi Ou
 Oak Ridge National Laboratory
 National Transportation Research Center
 2360 Cherahala Boulevard
 Knoxville, TN 37932 USA

 Zhenhong Lin*
 Oak Ridge National Laboratory
 National Transportation Research Center
 2360 Cherahala Boulevard
 Knoxville, TN 37932 USA

 Zhixin Wu
 China Automotive Technology and Research Center
 Dongli District, Tianjin 300300, China

 Jihu Zheng
 China Automotive Technology and Research Center
 Dongli District, Tianjin 300300, China

 Renzhi Lyu
 China Automotive Technology and Research Center
 Dongli District, Tianjin 300300, China

 Steven Przesmitzki
 Aramco Services Company
 46535 Peary Ct, Novi, MI 48377 USA

 Xin He
 Aramco Services Company
 46535 Peary Ct, Novi, MI 48377 USA

 Date Published: January 2017

 Prepared by
 OAK RIDGE NATIONAL LABORATORY
 Oak Ridge, TN 37831-6283
 managed by
 UT-BATTELLE, LLC
 for the
 US DEPARTMENT OF ENERGY
 under contract DE-AC05-00OR22725
CONTENTS

CONTENTS................................................................................................................................................. iii
LIST OF FIGURES ...................................................................................................................................... v
LIST OF TABLES ...................................................................................................................................... vii
ACRONYMS ............................................................................................................................................... ix
ACKNOWLEDGMENTS ........................................................................................................................... xi
EXECUTIVE SUMMARY .......................................................................................................................... 1
1. INTRODUCTION ................................................................................................................................ 3
2. CHINA’S PLUG-IN ELECTRIC VEHICLE MARKET ..................................................................... 5
 2.1 PLUG-IN ELECTRIC VEHICLE CLASSIFICATIONS IN CHINA ........................................ 5
 2.2 2014-15 BOOM .......................................................................................................................... 8
 2.3 FEATURES OF PLUG-IN ELECTRIC VEHICLE SALES .................................................... 12
 2.4 MARKET COMPETITION AND INDUSTRY ORGANIZATION........................................ 14
 2.5 PLUG-IN ELECTRIC VEHICLE MARKET COMPARISON OF CHINA AND THE
 UNITED STATES .................................................................................................................... 25
 2.6 MICRO EVS: MOST WELCOMED PLUG-IN ELECTRIC VEHICLES .............................. 29
 2.7 MULTINATIONAL INVESTMENTS IN CHINA’S PLUG-IN ELECTRIC VEHICLE
 MARKET.................................................................................................................................. 31
3. POLICIES IN THE PLUG-IN ELECTRIC VEHICLE MARKET .................................................... 35
 3.1 POLICIES OF THE CENTRAL GOVERNMENT IN 2012-2015 .......................................... 35
 3.1.1 Government Subsidies in Light-Duty PEVs (passenger plug-in electric cars) ............ 37
 3.1.2 Government Subsidies in Heavy-Duty PEVs (plug-in electric buses)......................... 38
 3.2 INCENTIVES BY LOCAL GOVERNMENTS ....................................................................... 39
 3.3 EVALUATION OF NEW POLICIES IN 2016 ........................................................................ 43
4. CHINA PLUG-IN ELECTRIC VEHICLE TECHNOLOGIES ......................................................... 47
 4.1 EV BATTERIES ....................................................................................................................... 47
 4.2 BATTERY CHARGING INFRASTRUCTURE ...................................................................... 51
 4.2.1 Comparison of Public EV Charging Outlets ................................................................ 51
 4.2.2 Distribution of EV Charging Outlets ........................................................................... 52
 4.2.3 Planning ....................................................................................................................... 54
 4.3 OTHER ELECTRIFIED VEHICLE TECHNOLOGIES .......................................................... 55
 4.3.1 Fuel Cell Electric Vehicle ............................................................................................ 55
 4.3.2 Battery Swap BEVs/Stations ....................................................................................... 56
 4.3.3 Vehicular telematics..................................................................................................... 57
5. PEV CONSUMER BEHAVIORS IN CHINA ................................................................................... 59
 5.1 PEV PURCHASE INTENTIONS ............................................................................................ 59
 5.2 INVESTIGATING CHINA’S PEV MARKET ........................................................................ 59
6. CONCLUSIONS ................................................................................................................................ 63
7. REFERENCES ................................................................................................................................... 65
Appendix A. APPENDIX A. MAJOR NATIONAL POLICIES OR EVENTS IN PEV INDUSTRY,
 2001-2015 ......................................................................................................................................... A-1

 iii

iv

LIST OF FIGURES

Fig. 1. Plug-in electric vehicle productions in China, 2009-2015................................................................. 1
Fig. 2. Plug-in electric vehicle production and market share in China, 2009-2016 ...................................... 5
Fig. 3. Relations for LSEVs, micro EVs, and PEVs ..................................................................................... 7
Fig. 4. New electrified light duty vehicles sales in China, 2005 – 2015 ....................................................... 9
Fig. 5. Global light plug-in electric vehicle sales, 2011-2015 ...................................................................... 9
Fig. 6. Global light PEV accumulated sales, 2011-2015 ............................................................................ 10
Fig. 7. Distribution of vehicle types in the Chinese BEV sales market for 2014 and 2015 ........................ 11
Fig. 8. Chinese PHEV sales market by vehicle category for 2014 and 2015.............................................. 12
Fig. 9. New Plug-in Electric Vehicle Monthly Sales in China, 2013 – 2015 (2) ........................................ 13
Fig. 10. Total vehicle monthly sales in China, 2011 – 2015 (2) ................................................................. 13
Fig. 11. a) New light PEV market share by models, 2015; b) new PEV market share by models,
 2015 ............................................................................................................................................... 15
Fig. 12. Sales and prices for 10 best-selling PEVs (basic model) in China, 2015 ...................................... 16
Fig. 13. Price range distribution of private purchase PEVs in China, 2015 (2) .......................................... 17
Fig. 14. a) China new vehicle market share by manufacturer, 2015; b) China new PEV market
 share by manufacturer, 2015 (2) .................................................................................................... 19
Fig. 15. Twenty largest PEV manufacturers by sales in China’s market, 2015 (2) .................................... 20
Fig. 16. a) Model units of the domestic passenger PEVs by technology type in 2016-2020; b)
 model units of the domestic passenger PEVs by vehicle size in 2016-2020 (2)............................ 21
Fig. 17. The headquarter locations of primary automakers (top 15 by sales in 2015) ................................ 24
Fig. 18. Headquarter locations of primary PEV makers (Top 15 by sales in 2015) ................................... 24
Fig. 19. U.S. plug-in electric vehicle sales by model (7) ............................................................................ 25
Fig. 20. a) Sales & prices for ten best-selling PEV models in the U.S. market, 2015 (7); b) U.S.
 new PEV market share by model, 2015 ......................................................................................... 28
Fig. 21. a) U.S. new PEV market share by manufacturer, 2015 (7); b) U.S. new passenger car
 market share by manufacturer, 2015 (9) ........................................................................................ 28
Fig. 22. Passenger plug-in electric vehicles sales by classifications, 2014 and 2015 (2) ........................... 29
Fig. 23. LSEV production from twenty major LSEV makers in Shandong province, 2011-2014
 (10) ................................................................................................................................................. 31
Fig. 24. a) Model units of the imported passenger PEVs by technology type in 2016-2020; b)
 model units of the imported passenger PEVs by vehicle size in 2016-2020 (2)............................ 33
Fig. 25. Prices for ten best-selling PEVs (basic model) in China, 2015, (2) ............................................... 38
Fig. 26. PEV sales and government goals in major cities and provinces, 2013-2015 (2) ........................... 41
Fig. 27. City types distribution of sold out PEVs to private consumers in China (2); ................................ 42
Fig. 28. Comparison with GDP per capita and the government PEV sales goal accomplished
 percentage ...................................................................................................................................... 42
Fig. 29. CAFE targets (MPG) for passenger vehicles, 2010-2025 (2)(13) ................................................. 45
Fig. 30. Largest global EV battery manufacturers by sales and market share, 2014-2015 ......................... 48
Fig. 31. a) China’s PEV industry investment (billion CNY), Jan 2014-Jun 2015; b) China’s EV
 battery (GWh) production, 2010-2015 (2) ..................................................................................... 48
Fig. 32. a) Chinese EV battery suppliers by ranked by production (GWh) in China, 2012-2015
 (2); b) EV battery suppliers market shares by number of PEVs installed in China, 2015 ............. 49
Fig. 33. Installation of EV batteries by type (GWh) in China’s PEV market, 2010-2015.......................... 50
Fig. 34. Numbers of non-home charging outlets in China, U.S., and Japan (2)(7) ..................................... 51
Fig. 35. Non-home charging ratio in China, the U.S., and Japan ............................................................... 52
Fig. 36. Number of PEVs and charging outlets in China, 2011-2015 (2) ................................................... 52
Fig. 37. Distribution characteristics of charging outlets in China, 2015 ..................................................... 53
Fig. 38. Number of EV charging outlets in major cities in China, 2015..................................................... 53

 v
Fig. 39. Plans for constructing a) charging stations and b) charging outlets in China by 2020 (2) ............ 55
Fig. 40. Chinese consumer demands in vehicular telematics system.......................................................... 57

 vi
LIST OF TABLES

Table 1. Vehicle classifications in Chinese vehicle market .......................................................................... 6
Table 2. Ten best-selling PEV models in Chinese market, 2015 (2) .......................................................... 15
Table 3. Ten best-selling plug-in electric vehicle models in the U.S., 2015 (7) ......................................... 26
Table 4. Primary Government Guidelines in the PEV Industry.................................................................. 35
Table 5. Central government subsidies for electrified passenger cars, 2013-2015 ,.................................... 37
Table 6. Central government subsidies for electrified buses, 2013-2015 , .................................................. 39
Table 7. Central government subsidies for electrified passenger cars, 2016-2020 (Partial) ....................... 43
Table 8. Specific energy density goals of EV batteries in major countries (2) ........................................... 47

 vii
viii
ACRONYMS

AFV Alternative Fuel Vehicle
BAIC Beijing Automotive Industry Holding Co., Ltd.
BEV Battery Electric Vehicle
BSS Battery Swap Service
CAFC Cooperate Average Fuel Consumption
CAFE Cooperate Average Fuel Economy
CATARC China Automotive Technology and Research Center
CNY Chinese Yuan
DC Direct Current
EPA Environmental Protection Agency
EREV Extended Range Electric Vehicle
EV Electric Vehicle
FCEV Fuel Cell Electric Vehicle
GDP Gross Domestic Product
GHG Greenhouse Gas
GM General Motor
HEV Hybrid Electric Vehicle
HOV High Occupancy Vehicle
iCET Innovation Center for Energy and Transportation
IT Information Technology
LFP Lithium Ferro Phosphate Battery
LHV Low Heat Value
LSEV Low Speed Electric Vehicle
MA3T Modeling the Market Acceptance of Advanced Automotive Technologies
MIIT Ministry of Industry and Information Technology, P.R. China
mph Miles per hour
MPV Multi-purpose Vehicle
MPG Miles per Gallon
MSRP Manufacturer's Suggested Retail Price
NCM Lithium Nickel Cobalt Manganese Battery
NEA National Energy Administration, P.R. China
NEV New Energy Vehicle
OEM Original Equipment Manufacturer
ORNL Oak Ridge National Laboratory
PEV Plug-in Electric Vehicle
PHEV Plug-in Hybrid Electric Vehicle
Q1 First Quarter
R&D Research & Development
SAIC Shanghai Automotive Industry Holding Co., Ltd.
SGCC State Grid Corporation of China
SUV Sports Utility Vehicle
U.S. United States
USD US Dollar
VC Venture Capital
VW Volkswagen
ZEV Zero Emission Vehicle

 ix
x
ACKNOWLEDGMENTS

The authors would like to thank Aramco Service Company for the generous financial support for this
study. The authors are solely responsible for content expressed.

 xi
xii
EXECUTIVE SUMMARY The year 2015 marks a turning point in China’s plug-in electric vehicle (PEV) or new energy vehicle (NEV)* industry, with an explosive growth in both productions and sales, following the gloomy period of 2009-2012. The PEV production in 2015 reached a record level of nearly 380,000 units, a 352 % increase from 2014, making China the largest PEV market in the world. For the potential implications on energy and the environment, it is worth studying the driving forces of China’s PEV market and understanding its future trajectory and dynamics. 400,000 378,968 350,000 PEV Production Units 300,000 250,000 200,000 150,000 100,000 83,920 50,000 16,962 1,992 3,978 10,786 0 210 2009 2010 2011 2012 2013 2014 2015 Fig. 1. Plug-in electric vehicle productions in China, 2009-2015 The key findings of this report are listed in the following. Though controversial, the government monetary incentives have played a significant role to impel China to be the largest light PEV (191,100 units) market in the world. Chinese vehicle buyers appear more price sensitive on PEVs. Inexpensive low-cost micro electric vehicles are the most popular vehicle model in China’s PEV market (38.9 % of the PEV market in 2015). In contrast, the premium or luxury vehicles are more popular in the gasoline vehicle segment. In fact, China is expected to be the largest premium car market in 2016. The PEV sales growth is primarily possible because of the young domestic private-owned auto manufacturers, which are mostly located in south China. Top-tier conventional vehicle automakers in China appear to be less proactive in the PEV market, based on market shares. This is in clear contrast to the U.S. market, where major automakers are generally the primary players in the PEV market. The PEVs produced by the domestic automakers are concentrated in the low-end market segment, while the high-end vehicle segment is dominated by the foreign brands. At present, the substantial market growth and government subsidies afford the domestic entrants to quickly gain profits in the low-end segment. *NEVs in China include battery electric vehicles (BEVs/EVs), plug-in hybrid electric vehicles (PHEVs), extended range electric vehicles (EREVs), and fuel cell electric vehicles (FCEVs). Very few fuel cell electric vehicles (FCEV) are currently commercialized in China, so NEVs are regarded as plug-in electric vehicles (PEVs), a concept widely used in the United States and other countries. In this report, PEV is in terms of the new energy vehicle (NEV) unless explicitly indicated otherwise. 1
The PEV consumers in China are very sensitive to the vehicle price, thus prefer the PEVs with cheaper prices after government subsidies, and care less about the driving quality and comfort. In contrast, most PEV consumers in the United States (U.S.) have higher incomes, view the PEVs as a high-status symbol, and care less about the vehicle prices, and therefore welcome the premium PEVs more in the U.S. The PEV financial subsidies by the Chinese government are divided into three stages based on the strategic directions and policies. In 2009–2012, government incentives concentrated on the public fleet vehicles, while excluding the individual consumers from the subsidies in most cities. In 2013– 2015, comprehensive central/local government incentives were extended to all vehicle purchasers including the individual buyers in most cities, which was conducive to the phenomenal growth of the PEV sales. For years 2016 to 2020, monetary incentives are being phased out and will be substituted by other non-monetary incentives (such as the standards for Chinese Cooperate Average Fuel Consumption and New Energy Vehicle Credits) for the sustainable development of the PEV market. The PEV subsidy fraud has drawn attention by the central government, which prompts the government to be more prudent about monetary incentives. With the advantage of high acceptance in the PEV market and integrated EV charging infrastructure, the region with better economic development brings a more aggressive PEV roll-out plan to the municipalities who are more willing to solve the local urban pollution while keeping the automotive market in sustainable growth. On the one hand, the local automakers are offered abundant subsidies from the Chinese government to those who intend to help the Chinese automotive industry seize the industrial upgrading opportunity to transform its manufacturing sector, and they have taken most shares of the PEV market. On the other hand, facing the trade barriers, the foreign automakers have dominated the premium PEV sales in China, although their total market shares in the PEV market are much less than the domestic automakers. In diverse selectable alternative fuel vehicle technologies, China has put its focus on the PEV technologies for the technological modernization in the automotive industry; the research and development in fuel cell vehicle technologies in China is less competitive compared with other countries such as Japan and the U.S. With the demand of batteries from the PEV automakers, the Chinese EV battery industry is aggressively expanding. It has risks in excessive production capacity, and faces the challenges from the competitors from Japan and South Korea. 2
1. INTRODUCTION

Rapid motorization in China is believed to have contributed to many social and environmental problems
(congestion, urban pollution, energy and greenhouse gases (GHG)), to which plug-in electric vehicles
(PEVs) are viewed as a long-term solution, especially for air pollution in highly congested urban areas
(1). The China central government started to promote the PEVs in 2001 with research and development
(R&D) investments in the National High Tech R&D Program (863 major scientific and technological
projects) in the government’s Tenth Five-Year Plan (2001-2005). In 2006, the new energy vehicle (NEV)
promotion strategic plan was explicitly included into government Eleventh Five-Year Plan (2006-2010).
In 2009, the “Ten Cities - Thousand Vehicles Demonstration Program” (十城千辆工程) was launched
by the central government with local governments investments as well. Since then, the institutional
environment for the PEV industry has been increasingly favorable, evidenced by frequent high-level
official statements, major policy implementations, massive governmental and industrial investments, and
generous purchase and adoption incentives, all summarized in the Appendix A. As a result, after slow
market penetration in the first several years (2009 -2012), the PEV market in China began to have
explosive growth after year 2013. In 2015, China became the world’s largest light PEV market at an
annual sales record of 191,000 units, followed by Western Europe with 184,500 units, then by the U.S.
with 115,262 units*.

With the phenomenal growth of the PEV sales in China, several questions are of interests: what are the
features of the Chinese PEV market and technologies compared with other major vehicle markets around
the world, especially the U.S.? How to understand the Chinese consumer behavior toward PEVs? Has the
PEV sales increase been driven entirely by the Chinese government? How will the plug-in electric vehicle
policy circumstance in China evolve and how will the PEV demand in China respond? And last but not
the least, what can we learn from the China’s plug-in electric vehicle experiences to inform transportation
energy policies both in China and other countries?

This report uses probably the most up-to-date information to describe the PEV market in China and
attempts to contribute to a better understanding of the driving forces, barriers and prospects. The first
chapter covers key market information, including key sales statistics in 2015 and comparisons of the best-
selling PEV models and investment activities. This chapter depicts a full picture of the PEV industry in
China and discusses the features of China’s PEV market. The second chapter describes the Chinese
government’s major policies/incentives in recent years and the relations between economic developments
and PEV sales. The influence of new policies/incentives on the prospective of the PEV market in the next
few years is also discussed in this chapter. The third chapter focuses on the development of vehicle
technologies in China, including electric vehicle (EV) batteries, charging infrastructure and related
technologies such as the battery swapping stations and FCEVs in China, and the technological
comparisons with other major countries. The next chapter reviews the literature that described the
Chinese consumer behaviors and preferences in PEV purchasing and discussed their methodologies and
conclusions. The last chapter gives the conclusions and the future studies in the Chinese PEV market.

*Source: http://energy.gov/eere/vehicles/fact-918-march-28-2016-global-plug-light-vehicle-sales-increased-about-80-2015 Data
compiled by Argonne National Laboratory, Argonne, IL, February 2016.

 3
This report is a result of collaboration between the Oak Ridge National Laboratory (ORNL) and the China
Automotive Technology and Research Center (CATARC). Most Chinese PEV market statistics are
provided by CATARC and some are from the public information by the China Association of Automobile
Manufacturers or the National Bureau of Statistics. For comparison purposes, U.S. automotive industry
statistics from the Alternative Fuels Data Center of the U.S. Department of Energy are also analyzed in
this report. All other reference information (research/technical publications, government legislations and
announcements, news journals, industrial presentations or reports) has been listed in the footnotes and
references. The dollar values mentioned in this report use 2015 prices. The 2015 yearly average currency
exchange rate of $1.0 U.S. Dollar (USD) = ¥ 6.489 Chinese Yuan (CNY) was used in the report*.

*Source from the U.S. Internal Revenue Service “Yearly average currency exchange rates”,
https://www.irs.gov/individuals/international-taxpayers/yearly-average-currency-exchange-rates (visited in September 2016)

 4
2. CHINA’S PLUG-IN ELECTRIC VEHICLE MARKET

China’s PEV market had an explosive growth in year 2014, and even accelerated in year 2015. According
to the statistics by the Automotive Data Center of CATARC*, the PEV sales and production in 2015
reached a record high of 343,675 and 378,968 respectively, about 4.5 times of the 2014 level (Fig. 2)†.
The PEV fleets on the road have reached 496,816 units from year 2009 to 2015 (2). The PEV sales share
in the vehicle market has increased from 0.26 % in 2014 to 1.40 % in 2015, shown in Fig. 2. The
explosive growth of the China PEV market has potential implications on energy, environment and trade,
and thus calls for a better understanding of the underlying forces.

 400,000 8.00%

 343,675
 350,000 7.00%

 PEV Share in Vehicle Sales Market
 300,000 6.00%
 2013-2015: A series of
 PEV Sales in China

 new PEV incentives for
 250,000 5.00%
 all purchasers.

 200,000 4.00%
 165,242
 150,000 3.00%
 2009 -2012: "Ten Cities -
 Thousand Vehicle" Depolyment
 100,000 2.00%
 Program
 61,660
 50,000 1.00%
 17,456
 210 1,992 2,849 7,672
 0 0.00%
 2009 2010 2011 2012 2013 2014 2015 2016 (first
 eight
 months)

 Fig. 2. Plug-in electric vehicle production and market share in China, 2009-2016

2.1 PLUG-IN ELECTRIC VEHICLE CLASSIFICATIONS IN CHINA

By definition, PEVs, a widely-used concept in the U.S., include battery electric vehicles (BEVs) and
plug-in hybrid electric vehicles ([PHEVs], the extended ranged EVs are regarded as PHEVs in this
report). The more popular concept used in China is NEV, which include PEVs and fuel cell electric
vehicles (FCEVs). No FCEVs have been commercialized in China yet, making NEV currently equivalent
to PEV. For communication convenience, the concept of PEVs is used throughout the report.

The Chinese PEV market should be analyzed in the Chinese vehicle classification system, which is
complicated and very different from the United States. The official classification standard in the Chinese

* The statistics by CATARC are based on the vehicle registration of the local government Vehicle Administration Office.
† These statistical data exclude the imported PEVs.

 5
automotive industry is the Chinese national standard - GB/T3730.1-2001*, which classifies passenger
vehicles into 11 models (such as sedan, convertible saloon, hatchback etc.) based on the vehicle purpose,
doors, body style and seats, and yet, is rarely used by the industry and researchers for the positioning of a
vehicle in the market place. The Chinese automotive industry has generally accepted the terminologies in
the Europe market segmentation† for passenger cars, which defines the classes of passenger cars with
English letters: A00, A0, A, B, C, D, E, F etc. (3) Nevertheless, the Chinese automotive industry has no
concordant criteria for the passenger car classifications. The OEMs (Original Equipment Manufacturers)
in China classify their car models based on various criteria, such as wheelbases, engine sizes, vehicle
weights, car interior volumes, or vehicle market positions. Therefore, the passenger car classification in
China is ambiguous without unified standards. In this report, the vehicle model classes are supplied by
CATARC who has its own method to differentiate car segments. There are three criteria used by
CATARC: wheel bases, engine displacement, and vehicle interior volumes.

According to the classifications by the 40 CFR 600.315-82 classes of comparable automobiles by the U.S.
Environmental Protection Agency (EPA)‡, and in general terms the American passenger vehicle market,
the vehicles (especially the sedans) are segmented into Minicompact, Subcompact, Compact, Mid-size,
Large-size. In order to associate the ambiguous Chinese common classification system with the U.S. EPA
classifications, this report investigated and compared the classes of the top selling vehicle models in both
Chinese and U.S. markets. For example, one of the most popular cars, the Toyota Camry, is classified by
EPA as a mid-size car in the U.S.§, and is generally treated as Class B in the Chinese automotive
industry**, thus it is deemed that the Class B is equal to the “Mid-size car.” Although the comparison is
not totally compatible, this offers the outsiders a method to visualize the Chinese vehicle classifications.
Table 1 summarizes the major vehicle classes used in this report.

 Table 1. Vehicle classifications in Chinese vehicle market

 Class Name Example
 A00 Minicompact Smart
 A0 Subcompact Honda fit
 Sedan/Car A Compact Toyota Corolla
 Passenger Vehicle B Mid-size Toyota Camry
 C Large-size car Audi A8 L
 SUV Sports Utility Vehicle -
 MPV Multi-Purpose Vehicle -
 Bus - -
 Commercial vehicle Truck - -
 a
 Special vehicle - -
 aSpecial Vehicles are mainly comprised of freight transport, engineering emergency rescue,
 sanitation, postal services, and other similar vehicle types.

* Source by http://www.camra.org.cn/fuwu/standard/GB-T%203730.1-2001.pdf. (in Chinese)
† Source by http://ec.europa.eu/competition/mergers/cases/decisions/m1406_en.pdf. (in Chinese)
‡ Source by https://www.gpo.gov/fdsys/pkg/CFR-1996-title40-vol16/pdf/CFR-1996-title40-vol16-sec600-315.pdf. (in Chinese)
§ 2017 Camry Product Information. http://toyotanews.pressroom.toyota.com/releases/2017-toyota-camry-product-specs.htm
** Vehicle Classifications. Baidu Baike. http://baike.baidu.com/view/556684.htm (in Chinese)

 6
This report covers only the officially recognized PEVs, that is, those models listed in the Announcement
of Vehicle Manufacturing Enterprises and Vehicle Products (车辆生产企业及产品公告) (hereinafter
referred to as the Announcement) and therefore those models are included in the PEV statistics by
CATARC. Noticeably, imported vehicles are excluded by the Announcement, thus the imported PEVs are
not counted into PEV statistics by CATARC. Nevertheless, the imported PEV sales in China will be
discussed separately.

Some PEV models included in the Announcement are eligible for government subsidies if they were
approved for inclusion in the Catalogue of Recommended Models for the New Energy Automobile
Popularization and Application (新能源汽车推广应用推荐车型目录)* (hereinafter referred to as the
New Subsidy Catalogue). Some PEV models in the Subsidy Catalogue are exempted from the purchase
tax if these models are listed in the Catalogue of the Models of New Energy Vehicles Exempt from Vehicle
Purchase Tax (免征车辆购置税的新能源汽车车型目录)† (hereinafter referred to as the Purchase Tax
Catalogue). The relationship of these government policies is shown in Fig. 3.

 a Announcement;
 b Old Subsidy Catalogue (before 01/01/2016) or New Subsidy Catalogue (after 01/01/2016);
 c Purchase Tax Catalogue.
 Fig. 3. Relations for LSEVs, micro EVs, and PEVs

* This New Subsidy Catalogue replaces the old version known as the Catalogue of Recommended Models for the Energy
Conservation and New Energy Automobile Popularization and Application (节能与新能源汽车推荐车型目录) (Old Subsidy
Catalogue) on January 1, 2016. Source by http://www.gzjt.gov.cn/gzjt/web/Service/DowLoad.aspx?DowID=2678 (in Chinese)
† The Purchase Tax Catalogue also includes a few imported car models, such as the BMW i3 which was available since

September 2015.

 7
Importantly, a large volume of low speed electric vehicles (LSEVs) or micro EVs have been sold in China
in recent years. No LSEVs are in the Announcement and thus are not included in CATARC’s PEV
statistics. Although there are no national standards to define the LSEVs, the highest speed of the LSEVs
is supposed to be no higher than 80 km/h (50 mph) according to the Old Subsidy Catalogue, or higher
than100 km/h (62 mph) according to the New Subsidy Catalogue. Some micro EVs are excluded by the
Announcement or Subsidy Catalogue due to inconformity with the government NEV requirements, and
therefore deemed as the unofficial EVs. It is worth noting that most unofficial EVs and LSEVs are micro
cars and are also called unofficial micro EVs. These unofficial EVs are not included in the PEV sales data
by the CATARC, but will be discussed later in this report because of their influence to the PEV industrial
patterns.

2.2 2014-15 BOOM

The electrified vehicles (including both PEVs and hybrid electric vehicles (HEV)) have more than ten
years’ history in the Chinese sales market. As early as 2005, Toyota built its HEV, the Prius, in the joint
venture plant in Changchun, China. The light duty PEVs were sold out in 2009 when the “Ten Cities -
Thousand Vehicles Demonstration Program” (十城千辆工程) was launched by the central government.
However, the sales of PEVs did not start to break out until 2013 when the Chinese government dedicated
more fiscal support nationally in the PEV market that targeted subsidies expansion to all buyers. Before
2013, only a few cities had incentives available for the individual buyers for private use.

BEVs dominated the light duty electrified vehicle market segment after year 2013. In 2015, more than
140,000 units of the BEVs were sold and became the most popular model in the light-duty electrified
vehicle market segment, followed by the PHEVs, shown in Fig. 4. It is notable that the domestic
BEVs/PHEVs which are eligible for the government subsidies, account for the majority of the China’s
electrified vehicle market. On the other hand, the imported electrified vehicle models dominate the HEV
market segment which no longer qualifies for government subsidies as of 2013. As opposed to the other
thriving electrified vehicle technologies, the development of the FCEVs relatively lagged behind. Only
ten units of FCEVs were produced for demonstration in 2015. The PEV market segment in China leans
on the transition of emergent phase to the growth phase, which is characterized by potential widespread
adoption of the PEV technology, growth of competitor numbers, and improved established industrial
standards. The current stage of the PEV market segment in China is regarded as a nascent growth phase in
this report.

 8
250,000 Domestic BEV
 Imported BEV
 Domestic PHEV
 200,000
 Imported PHEV
 Domestic HEV
 Units

 150,000 Imported HEV

 100,000

 50,000

 0
 2005 2006 2007 2008 2009 2010 2011 2012 2013 2014 2015
 Year
 Fig. 4. New electrified light duty vehicles (BEVs, PHEVs, & HEVs) sales in China, 2005 – 2015

In the light-duty PEV market, because of the explosive growth after 2013, China became the world’s
largest market in 2015, followed by Western Europe. New light PEV sales in China are compared with
the markets in other major countries and regions from 2011 to 2015 in Fig. 5. In China, the light PEV
sales in 2015 account for 72.1 % of the total sold light PEVs during 2011 to 2015. The U.S. light PEV
sales in 2015 has a slight decrease compared with 2014.

 250,000
 China
 Western Europe
 Annual light electrified vehicle

 200,000 Japan
 Canada
 United States
 150,000
 sales

 100,000

 50,000

 0
 2011 2012 2013 2014 2015

 Fig. 5. Global light plug-in electric vehicle (BEVs & PHEVs) sales, 2011-2015*

*Source by http://energy.gov/eere/vehicles/fact-918-march-28-2016-global-plug-light-vehicle-sales-increased-about-80-2015,
while Chinese 2014-2015 data are corrected based on CATARC official database, U.S. 2011-2015 data are based on the
Alternative Fuels Data Center of U.S. Department of Energy http://www.afdc.energy.gov/data//10567.

 9
Western Europe accounts for the largest light PEV fleets accumulated from 2011 to 2015, shown in Fig.
6. Though the light PEV market in the U.S. is slightly smaller, the number of units of its light PEV fleet
are nearly one-third of the world.

 0.8%
 11.4%
 21.7%
 China
 Western Europe
 United States
 32.4% Japan
 Canada
 33.8%

 Fig. 6. Global light PEV accumulated sales, 2011-2015*

With the prosperity of the PEV market and attractiveness of government incentives, a number of PEV
models have been introduced into the market by the automakers. By the end of 2015, 3,409 PEV models
had been certificated by the Ministry of Industry and Information Technology (MIIT) of P.R. China and
included into the Old Subsidy Catalogue before it was repealed. Meanwhile, with stricter criteria, the New
Subsidy Catalogue was decreed in January 2016. The new catalogue requests all automakers to re-submit
applications for their PEV models even if these models had satisfied the requirements in the Old Subsidy
Catalogue. The PEV models whose names are not in the New Subsidy Catalogue will not be eligible to
obtain the government fiscal support, which contributes to an inferior market position of these vehicle
models in the price competition. By February 2016, 713 PEV models have been listed into the New
Subsidy Catalogue. Of those listed, 596 models (84 %) are buses and 117 models (16 %) are passenger
cars.

Fig. 7 shows the distribution of vehicle-type categories for BEV sales in 2014 and 2015, respectively. In
2015, more than 133,000 units of light-duty BEVs were sold in 2015. The vehicle types of light BEVs
have expanded from sedan cars to include Sports Utility Vehicles (SUVs), and Multi-Purpose Vehicles
(MPVs). With the increasing demands of the Chinese middle class, and abolishment of one-child policy
in China, the passenger vehicles with larger interior volumes are expected to become more attractive in
the Chinese vehicle market†. In 2015, 39.5 % of new passenger cars sales were SUV or MPV. Therefore,
the automakers started producing plug-in electric SUV or MPV models, most of which are PHEVs and a
few are BEVs.

* Source by http://energy.gov/eere/vehicles/fact-918-march-28-2016-global-plug-light-vehicle-sales-increased-about-80-2015,
while Chinese 2014-2015 data are corrected based on CATARC official database, U.S. 2011-2015 data are based on the
Alternative Fuels Data Center of U.S. Department of Energy http://www.afdc.energy.gov/data//10567.
† Kongho Chua. Bloomberg News 2016. “China Auto Sales Growth Accelerates on Rising SUV Demand”

http://www.bloomberg.com/news/articles/2016-07-08/china-auto-sales-grow-at-faster-pace-on-suv-electric-car-demand.

 10
The sales of the heavy-duty BEV (including buses, trucks, and special vehicles) sales are also impressive
with nearly 127,000 units sold in 2015. During the second stage of the national PEV incentives in 2009-
2013, more than 80 % of PEVs sold were public fleet vehicles (mostly buses) motivated by the “Ten
cities - Thousands Vehicles” Program (4). Given the fact that China has a dense population and high
utilization rate of public transportation, the government PEV incentives is favorable to the deployment of
public buses and sanitation vehicles*. Although cars dominated the BEV market in 2015, and the market
share of the heavy-duty BEVs expanded from 19.8 % in 2014 to 48.7 % in 2015., Sales of electric buses
in 2015 increased 15 times over 2014, which motivated the increased demands for EV batteries at the
same time.

 Special Vehicle
 Truck
 300,000
 Bus
 MPV 34,242
 250,000
 SUV
 200,000 Car
 92,536
 Units

 150,000

 100,000
 132,499
 1,372
 50,000 6,050
 29,072

 -
 2014 2015
 Year
 Special
 Special Vehicle
 Truck Vehicle
 3.66%
 0.01% 13.15%
 Truck
 0.02%

 MPV Bus
 2.19% 16.15% Car
 50.89%
 Bus
 Car 35.54%
 SUV
 0.39% 77.60%

 MPV SUV
 2014 0.23% 0.16% 2015
 Fig. 7. Distribution of vehicle types in the Chinese BEV sales market for 2014 and 2015

*Jie Ma. Bloomberg, 2016. “China Electric Car Boom Driven by State Buying, Bernstein Says”,
http://www.bloomberg.com/news/articles/2016-03-01/china-electric-car-boom-driven-by-state-buying-bernstein-says.

 11
Multiple PHEV categories in 2014 and 2015 are compared in Fig. 8. In 2015, the light-duty PHEV sales
are about 57,000 units, which include cars and SUVs. The heavy-duty PHEV market share dropped from
45.8 % in 2014 to 30.9 % in 2015. In the light-duty PHEV, SUVs were first sold in China in 2015 and
represent 17.2 % of the PHEV market. Although the sales of plug-in hybrid electric buses doubled in
2015 compared with 2014, the passenger vehicles are still the dominant segment in the PHEV market.
 Units

 Bus
 90,000 SUV
 80,000 Car
 25,744
 70,000
 60,000
 14,297
 50,000
 40,000
 30,000
 43,264
 11,072
 20,000
 10,000 13,116
 0
 2014 2015
 Year
 2014 2015

 Bus
 30.9%
 Bus Car Car
 45.8% 54.2% 51.9%

 SUV
 17.2%

 Fig. 8. Chinese PHEV sales market by vehicle category for 2014 and 2015

2.3 FEATURES OF PLUG-IN ELECTRIC VEHICLE SALES

The sales characteristics of the PEV market and the conventional vehicle market in China are compared in
this section. Fig. 9 gives the PEV monthly sales for January 2013 to December 2015. The PEV sales in
2015 have an obvious growth in 2015 compared to the sales in 2013 and 2014. Particularly, the sales
growth in the fourth quarter (Q4) of 2015 are impressive.

 12
120,000
 2013 2014 2015
 100,000
 Mothly PEV sales (Units)

 80,000

 60,000

 40,000

 20,000

 0
 Jan Feb Mar Apr May Jun Jul Aug Sep Oct Nov Dec

 Fig. 9. New Plug-in Electric Vehicle Monthly Sales in China, 2013 – 2015 (2)

Fig. 10 presents all new vehicle monthly sales in China since 2011 to 2015. It is normal that the vehicle
sales in the Q4 is always larger than the sales in the other three quarters yearly.

 3,000
 2011 2012 2013 2014 2015

 2,500
 Monthly vehicle sales (×1,000 Units)

 2,000

 1,500

 1,000

 500

 0
 Jan Feb Mar Apr May Jun Jul Aug Sep Oct Nov Dec

 Fig. 10. Total vehicle monthly sales in China, 2011 – 2015 (2)

 13
In general, the pattern of PEV monthly sales appears to be consistent with that of the conventional
vehicles, but the year-end sales surge is more stark for PEVs in 2015. Fig. 9 gives the PEV monthly sales
in the most recent 3 years and Fig. 10 gives all vehicle monthly sales in China for the most recent 5 years.
In the month of February, often a holiday month in China, is the sales downturn month for the market
segments of both conventional vehicles and PEVs in China. The only exception is in the year 2012 when
the lowest monthly sales volume was in January, which is because the Chinese New Year date (January
23) was much earlier than it is in other years. The summer months (June to August) is the season with the
worse vehicle sales volumes, and is more evident in the conventional vehicle market; fortunately, the
sales volumes revive in the Q3. The average monthly sales for both PEVs and all vehicles in the Q4 are
larger than the average monthly sales in the other three quarters of the same year. This is because starting
from the Q3 in every year, the dealerships in China carry out various discount promotions to stimulate
their vehicle sales, which is regarded as the Golden September & Silver October*, and the automotive
manufacturers have pressure to fulfil the fiscal year sales plan before the end of a year (5). In addition, the
vigorous market demands also impact the sales growth in the Q4 when the Chinese consumers need
vehicles to prepare for coming holidays.

At the same time, the prosperous vehicle market is inseparable from the vehicle incentives, though the
vehicle sales are affected by consumer behaviors, provider’s market strategies, and economics
development etc. In the conventional vehicle market, the incentive where the purchase tax was cut in half
for the
Table 2. Ten best-selling PEV models in Chinese market, 2015 (2)

 Electric
 Rank Model OEM Powertrain Class
 Range (km)
 1 Qin BYD PHEV A 70
 2 Zhidou Geely BEV A00 180
 3 EV 200 Beijing Auto (BAIC) BEV A0 245
 4 Yun-100 Zotye BEV A00 150
 5 Tang BYD PHEV A 60
 a
 6 K10 Kandi BEV A00 150
 7 Roewe E550 Shanghai Auto (SAIC) PHEV A 60
 8 Panda K1a Kandi BEV A00 150
 9 iEV JAC BEV A0 160
 10 Zhidou 301 Zotye BEV A00 85
 a
 In 2015, Kandi Auto did not have the qualification certificate for PEV production, thus Kandi
 K10 and Kandi Panda K11 are made by Geely who collaborates with Kandi Auto in PEV
 market.

 a) b) BYD Qin
 BYD Qin 8.6%
 Others 15.0%
 21.9%
 Geely Zhidou
 7.1%
 BAIC EV 200
 4.5%
 Geely Zhidou Zotye Yun-100
 Zotye Zhidou 301 12.7% 4.5%
 4.5%
 BYD Tang
 JAC iEV Others
 4.9% BAIC EV 200 56.5%
 Kandi K10
 8.2%
 Kandi Panda K11
 5.1% SAIC Roewe 550
 JAC iEV
 SAIC Roewe 550 Zotye Yun-100
 Kandi Panda K11
 5.8% 8.1%
 Kandi K10 BYD Tang
 6.3% 7.5% Zotye Zhidou 301

 Fig. 11. a) New light PEV market share by models, 2015; b) new PEV market share by models, 2015

The MSRPs (manufacturer's suggested retail prices) of the best-selling PEVs are higher than the average
MSRP of conventional cars in the same class. Fig. 12 shows the sales and MSRP (basic car model) for the
10 best-selling PEV models. Based on the data from the China Association of Automobile Manufacturers,
the average MSPR for an A0/A00 (Subcompact/Micro) car is ¥44,000 ~ ¥46,300 CNY ($6,781 ~
$7,135 USD)*. The average MSRP of the Class A0/A00 PEVs is 164,114 CNY ($25,291 USD) which is
still much higher than the average price of a conventional car. Fig. 13 presents the price distribution of the

*China Association of Automobile Manufacturers. 2016. “The prices of China brand cars are 45% lower than the foreign brand
cars in the same class (同级别车均价较合资低 45% 自主成本困局待解)”.
http://www.caam.org.cn/hangye/20160608/1005193405.html (in Chinese) (visited in April, 2016)

 15
PEVs sold to private consumers, which shows that the PEVs with MSRPs (before subsidies) less than
¥250,000 CNY ($38,500 USD) are more appealing to the private consumers in China. With the
subsidies from government, the actual price to the PEV buyers is much lower than the MSPR,
nevertheless the actual price to consumers can be 40 % of the original MSRPs.

 BYD Qin (PHEV, A) ¥189,800 ( $29,249 )
 28,684

 Geely Zhidou (EV, A00) ¥158,800 ( $24,472 )
 24,316

 BAIC EV200 (EV, A0) ¥246,900 ( $38,049 )
 15,596

 Zotye Yun-100 (EV, A00) ¥158,900 ( $24,488 )
 15,515

 BYD Tang (PHEV, A) ¥251,300 ( $38,727 )
 14,297

 Kandi K10 (EV, A00) ¥152,800 ( $23,548 )
 12,065

 SAIC Roewe E550 (PHEV, A) ¥248,800 ( $38,342 )
 11,159

 Kandi Panda K11 (EV, A00) ¥152,800 ( $23,548 )
 9,820

 JAC iEV (EV,A0) ¥169,800 ( $26,167 )
 9,304

 Zotye Zhidou 301 (EV, A00) ¥108,800 ( $16,767 )
 8,559
 0 10,000 20,000 30,000 40,000 50,000
 MSRP (Basic Model) Sales

 Fig. 12. Sales Volumes and prices for 10 best-selling PEVs (basic model) in China, 2015*†

* Source by D1EV Website, “Electric Vehicles Information Database (车型大全)”, http://www.d1ev.com/salecar (in Chinese)
(visited in April, 2016)
† Shi Chen. A0EV, 2016. “The Best-selling Electric Vehicles in Year 2015 (2015 年电动汽车销量前 10 排行出炉)”,

http://www.aooev.com/html/201601/59439.html (in Chinese) (visited in April, 2016)

 16
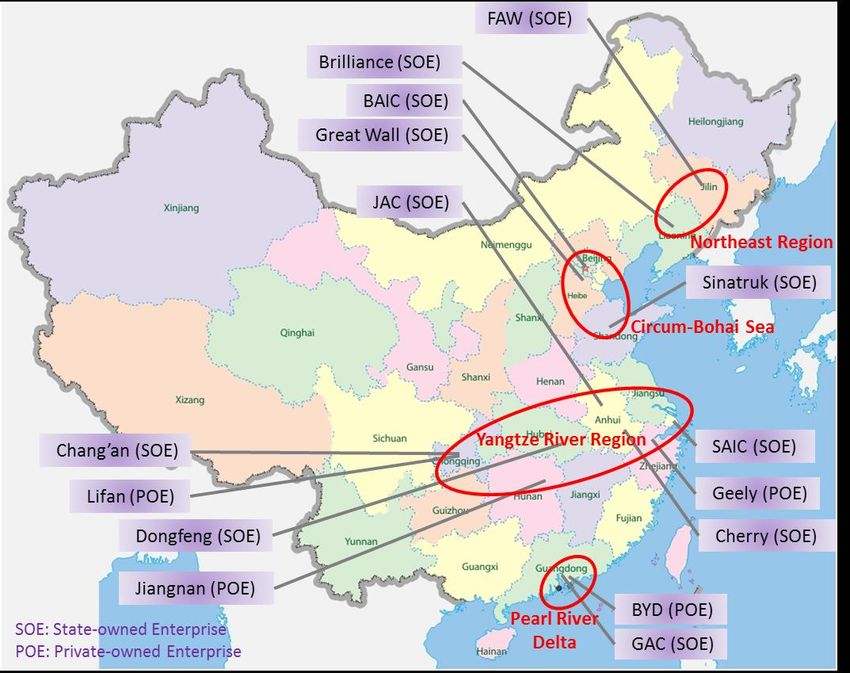
45,000 18
 PEV sales
 PEV sales to private consumers

 40,000 16
 Models
 35,000 14
 30,000 12

 PEV models
 25,000 10
 20,000 8
 15,000 6
 10,000 4
 5,000 2
 0 0
 < ¥150 ¥150~¥200 ¥200~¥250 ¥250~¥350 ¥350~¥450 >¥450
 (< $ 23.1) ($23.1 ~ $30.8) ($30.8~$38.5) ($38.5 ~$53.9) ($53.9~$69.3) (> $69.3)
 MSRP before subsidies (×1,000)

 Fig. 13. Price range distribution of private purchase PEVs in China, 2015 (2)

China’s PEV market is in a highly competitive, low concentrated, and early growth stage. The policy of
“market access in exchange for technologies” in the Chinese automotive industry has been deemed as an
unsuccessful tactic in technologically transferring (4).China’s policy makers regard for the electrified
mobility revolution as a great opportunity to leapfrog foreign competitors, and motivating the technology
upgrade of numerous domestic enterprises in the economic transition period, which then propels the
investments flow into the PEV industry. Some characteristics of the PEV market are manifested by Fig.
14 and Fig. 15.

First, the PEV market is fragmented. Fig. 14 presents the market shares by automakers for both
conventional vehicles and PEVs. Commonly, the multinational automakers or capitals operate joint
ventures with a specific Chinese domestic enterprise (mainly state-owned auto manufacturer) to produce
vehicles (6), thus the names of the multinational auto firms who have plants in China are not shown in
Fig. 15 a). In the conventional vehicle market, the five largest automakers by sales already have 72.6 % of
the market share. However, the PEV market concentration is relatively smaller—the five largest PEV
automakers based on sales only take 45.6 % share of the market. Based on the statistics from the Ministry
of Finance, 169 units of domestic manufacturers have PEV products*, however only two OEMs, BYD and
Geely, have shares over 10 % in the PEV market, respectively, shown in Fig. 14 b). At the same time,
numerous PEV models have been brought into the market by these hundreds of PEV automakers. More
than 3,409 PEV models were certified and listed into the Old Subsidy Catalogue before it was repealed at
the end of 2015. On the other hand, only 14 OEMs sold over 1,000 units of PEVs in 2015, shown in Fig.
15. Three out of 169 PEV OEMs have more than 5 % market share, respectively. Therefore, it is not
surprising that some OEMs only sold dozens of PEVs or have no PEV models sold at all. The
fragmentation of the PEV industry results and difficulties in mass production for PEVs heavily increases
the PEV manufacturing marginal cost and lack of OEM’s competitiveness.

*Yue Zhang. Ministry of Finance of PRC 2016. “Why the government should not keep subsidizing the New Energy Vehicles (财
政为何不能长久补贴新能源汽车?)”,
http://www.mof.gov.cn/zhengwuxinxi/caizhengxinwen/201603/t20160302_1828176.html (in Chinese) (visited in Sept, 2016)

 17
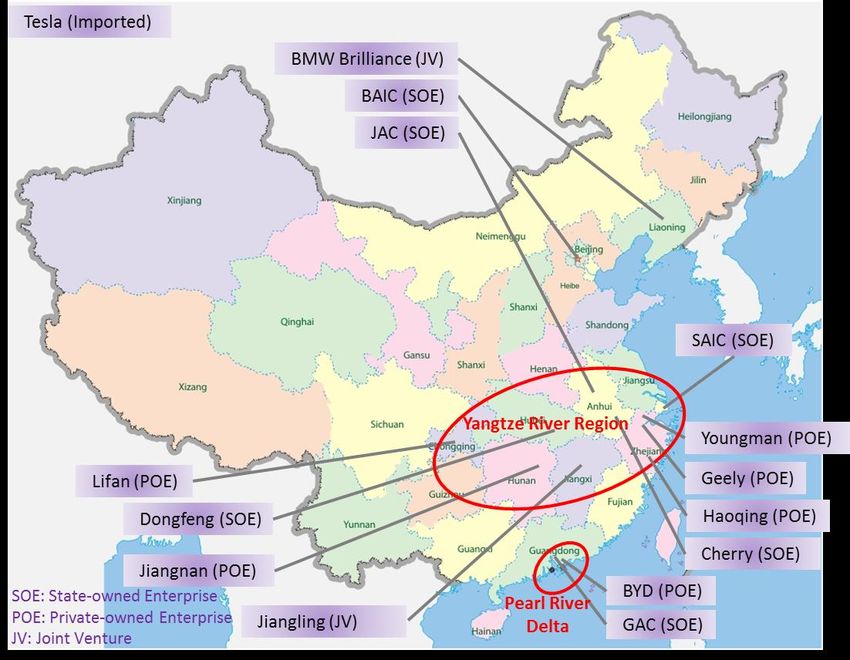
Second, many entrants in the PEV market rarely have experience in vehicle manufacturing. Generally, the
entrants are typically grouped into certain types: The entrepreneurs with abundant venture capital (VC);
and the manufacturers who used to be in the upstream product chain in automotive industries or neighbor
industries such as low-speed or neighborhood vehicles who were pressing to upgrade their products. With
the plentiful VCs, many entrepreneurs are participating in the car manufacturing PEV industry. These
entrepreneurs often have had rich management experience and networking in the conventional vehicle
industry, and left their original positions to bet on the PEV market as the right horse in their startup
business. For example, NextEV (蔚来汽车), established in 2015, is a startup firm which has obtained
$500 million USD from VCs, and promises to build a Chinese electric super car with innovative features
in 2018, just like what Tesla did*. In principle, the Chinese government will not approve any new
conventional vehicle manufacturers to be built in China†. For the entrants who transformed from the
upstream chain or low end manufacturing industries, the only window in the automotive industry opened
for them is PEV projects. For many of the entrants, because of the lack of efficient strategies (such as
viable technologies, assembly experience and quality control), their business strategy is to sale low-cost,
low-performance as many as possible PEVs to cannibalize the market share and obtain the government
subsidies.

Additionally, the facts that the technological barriers and high sunk costs stymie the entrants into the
conventional vehicle market which is an industry with monopoly rents dominated by a few state-owned
OEMs with their foreign partners in China. The conventional vehicle industry has a high minimum
efficiency scale, where the strict industrial standards, large scale distribution, and various technological
requirements entail professional labor training with completed R&D system and sustainable investments.
The incumbents who have had large economies of scale and integrated distribution channels also deter the
other investors in the conventional vehicles. It is a bet worth making for private enterprises or VCs to
penetrate the PEV supply chain which is an emerging market segment in China, especially with the
support from the government promising incentives and policies. For example, in order to seize the
opportunity to enter the market, Kandi Auto, a private-owned automaker, has started producing PEVs by
collaborating with another certificated automaker (Geely) before it got the government certificates for its
PEV products. (Kandi’s products and sales are counted into Geely’s in 2015). Two popular BEV car
models, Kandi K10 and Kandi Panda K11, gave Kandi Auto 11.4 % share in the light-duty PEV market in
2015.

Third, the traditional domestic state-owned automakers who dominate the conventional vehicle market
are less proactive in the PEV market. Shown in Fig. 14, the names of these incumbents in the
conventional vehicle market segment are replaced by the names of the domestic private-owned
enterprises or small state-owned automakers. In Fig. 15, 7 out of 20 largest OEMs by PEV sales are
domestic private-owned automakers, many of which have foreign shareholders‡.

* Huang Peng. Tencent Auto Voice. 2015 . “How is NextEV heading to the future? (蔚来汽车如何驶向未来?)”
http://auto.qq.com/original/cheshidian/autovoice081.html (in Chinese)
† The State Council Information Office. 2016. “China unveils measures to promote private investment (政府核准投资项目“再瘦

身”释放市场活力)” http://www.scio.gov.cn/32344/32345/33969/35257/35264/Document/1493927/1493927.htm (in Chinese)
‡ This study defines the companies controlled over 51% stocks with the management directly by domestic private as domestic

private-owned companies, or by state as state-owned companies; This study defines the companies with foreign capital
investment and with foreign management board members as foreign joint-ventures.

 18
You can also read


