Note 3 - The SVOD Market In The EU Developments 2014/2015 - November 2015 Christian Grece - Coe
←
→
Page content transcription
If your browser does not render page correctly, please read the page content below

Note 3 - The SVOD
         Market In The EU
            Developments
                 2014/2015

                                Christian Grece

A publication by the European Audiovisual Observatory

                            November 2015

                                                    1
The SVOD Market In The EU Developments 2014/2015

                                              2
The SVOD Market In The EU Developments 2014/2015

Report prepared by the European Audiovisual Observatory for DG Connect

Director of publication:
Susanne Nikoltchev, Executive Director European Audiovisual Observatory

Supervision:
Gilles Fontaine, Head of Department for Information on Markets and Financing,
European Audiovisual Observatory

Authors:
Christian Grece, Analyst at the European Audiovisual Observatory

This report was prepared in the framework of a contract between the European
Commission (DG Connect) and the European Audiovisual Observatory

The analyses presented in this report are the author’s opinion and cannot in any
way be considered as representing the point of view of the European Audiovisual
Observatory, its members or of the Council of Europe or the European Commis-
sion. Data compiled by external sources are quoted for the purpose of information.
The author of this report is not in a position to verify either their means of compila-
tion or their pertinence.

                                                                                         3
The SVOD Market In The EU Developments 2014/2015

Table of Contents

NOTE 3: THE SVOD MARKET IN THE EUROPEAN UNION 2014 & 2015                                      5

  1     Market figures: SVoD in the European Union                                             6
      1.2   Acceleration of SVoD consumer revenues since 2012                                  9
      1.3 SVoD: rising faster than other VoD services and taking increasingly a larger share in
      consumer revenues for on-demand services                                              11
      1.4 Consumer revenues on SVoD services are still a fraction of consumer spending for pay
      TV in the EU: still a complement rather than a substitute for pay TV in 2014         15

  2     SVoD in Europe – Generalist, Niche and Direct-to-consumers strategies                  20
      2.2   The global Juggernaut: Netflix                                                     24

  3    SVoD players and market in the United Kingdom: EU’s most developed market could give
  some leads as to the future of SVoD in Europe                                         35

  4    SVoD players and market in the Nordics: fast adoption of SVoD services, highest
  penetration in the EU                                                            40

  5     SVoD players and market in France: Netflix versus CanalPlay                            44

  6      SVoD players and market in Germany: strong national players and international competition
  will drive the SVoD market                                                                   49

  7     SVoD players and market in the Netherlands: explosive growth – the Netflix effect      52

  8     Lessons from the US market                                                             54

  9    Strategies in the SVoD market: Exclusive licences, Original content, multidevice
  convenience and user friendliness are the main competitive advantages to acquire and retain
  subscribers                                                                             62

  Table of tables                                                                              71
  Table of figures                                                                             72

                                                                                                   4
The SVOD Market In The EU Developments 2014/2015

   NOTE 3: THE SVOD MARKET IN THE EU-
       ROPEAN UNION 2014 & 2015

Author: Christian Grece

                                                                        5
The SVOD Market In The EU Developments 2014/2015
1 Market figures: SVoD in the European Union
A fast growing market with a year-to-year increase of +93% to EUR 844
million in 2014, however with high disparities in the EU 28
Almost 50% of consumer revenues generated in the United Kingdom, and
more than 90% by 8 countries in 2014
Countries ranked high in the Digital Economy and Society Index are lead-
ing the EU in SVoD consumer revenues
The addressable market for SVoD services in the EU is growing, depend-
ing on various factors such as broadband penetration, equipment in con-
nected devices, willingness to pay for online services
The entry of Netflix and the launch of SVoD services by national players
stimulated the SVoD market in several countries
The Subscription Video-on-Demand market (hereafter SVoD) experienced a fast
growth since the year 2010 in the European Union1. Total consumer revenues
grew from EUR 40.7 million in 2011 to EUR 844 million in 2014, an increase by
1 973% in 5 years (with a compound annual growth rate [CAGR] of 113% over the
5 year period) in the EU 22 according to research firm IHS2. The market for audio-
visual on-demand subscription services is in a state of fast expansion, driven by
the launch of services; either from established national players such pay TV op-
erators, commercial broadcasters or telecom companies, either from international
players who expand their services into EU countries; and the uptake by the EU
population, profiting from higher broadband speeds required for streaming of vide-
os and an increased equipment in connected devices (streaming media players,
smart TVs, smartphones, tablets, HDMI dongles).
However, these growth rates and increases in consumer revenues reflect only a
part of the market situation for SVoD services in the EU. Most of the consumer
revenues are (still) generated on the British market which solely represented 47%
of total consumer revenues generated in 2014 (down from 65% of total consumer
revenues in 2010). The top 8 markets (respectively, the United Kingdom, Sweden,
Denmark, France, the Netherlands, Germany, Finland and Belgium) out of the 22
EU countries for which data is available represent over 90% of total consumer
revenues for SVoD services in 2014. The different markets in the European Union
for SVoD services are not homogenous, and a pan-European analysis, as it is the
case for many on-demand audiovisual markets in the EU, is rendered difficult as
each market presents different market conditions favouring or not the emergence
of SVoD services and their rapid adoption by consumers.
It is possible, to a certain extent, to classify the markets by maturation levels –
total consumer revenues, growth rates, adoption rates of SVoD services by popu-
lation (a difficult exercise without subscribers numbers in most of the EU coun-
tries), number of SVoD services competing for a slice of the national market:
1
IHS measures SVoD consumer revenues in 22 EU countries: Austria, Belgium, Bulgaria, Czech
Republic, Germany, Denmark, Spain, Finland, France, the United Kingdom, Greece, Croatia, Ire-
land, Italy, Luxembourg, Netherlands, Poland, Portugal, Romania, Sweden, Slovenia, Slovakia
(hereafter EU 22). Not included in the total figure for the EU market are Estonia, Hungary, Lithua-
nia, Latvia and Malta.
2
IHS defines SVOD as:” Subscription Video on demand is a business model traditionally associated
with streaming video. Users pay a standard monthly rate for access to content which is streamed
on request; this is to say no long term store of the content is made on the user’s device.”
6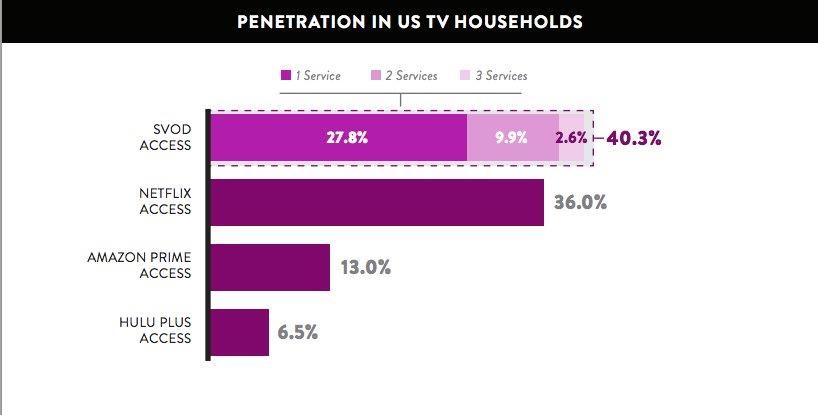
The SVOD Market In The EU Developments 2014/2015

   -   SVoD market developed: UK, SE, DK, FI, NL quick adoption rate, early en-
       try of Netflix and local reaction of national players

   -   SVoD market in development: FR, DE, BE, LU, IE, AT

   -   SVoD market underdeveloped: ES, CZ, IT, RO, SI, PL, SK, HR, PT, BG,
       GR

This overrepresentation of Western European countries, often higher ranked on
the Digital Economy and Society Index tends to demonstrate that the addressable
market for SVoD in the EU is growing each year. As broadband penetration is
growing, letting users benefit from higher broadband speeds required for video
streaming services and as EU consumers are getting more equipped with
smartphones, tablets and connected devices (media players, Smart TVs, HDMI
dongles), the addressable market for SVoD services is also growing.
The following sections analyse the development of the EU SVoD market from dif-
ferent angles such as the share of SVoD consumer revenues in total on-demand
consumer revenues, the situation of pay TV in regard to SVoD (competition or
coexistence) and the main players in the EU. As only data for 22 EU markets re-
garding SVoD consumer revenues are available, the different figures used in the
first part of this note take into account this fact by giving the relevant data for the
22 markets, when available.

                                                                                         7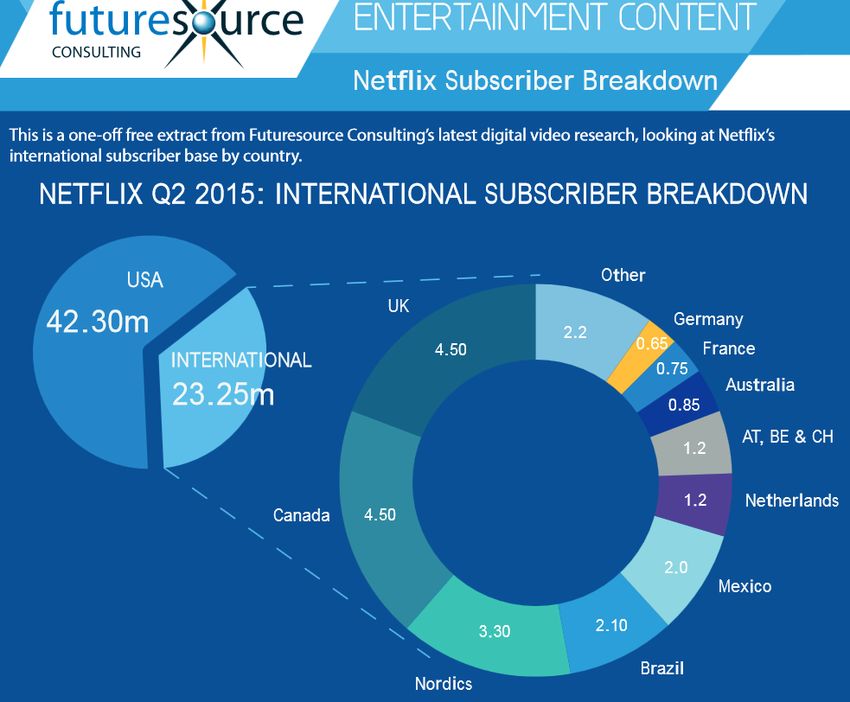
The SVOD Market In The EU Developments 2014/2015

Table 1       SVoD Consumer revenues and growth rates per country, in EUR million and %,
              2010 - 2014

For copyright reasons the data cannot be reproduced in the public version of this report

Source: IHS

Figure 1 EU 22 SVoD consumer revenues and yearly growth rate, in EUR million and %, 2010-
         2014

For copyright reasons the data cannot be reproduced in the public version of this report

Source: IHS

Table 2       Share of SVoD consumer expenses per country in 2014 EU 22, in %

For copyright reasons the data cannot be reproduced in the public version of this report

Source: IHS

                                                                                                 8
The SVOD Market In The EU Developments 2014/2015

1.2        Acceleration of SVoD consumer revenues since 2012
The EU market for SVoD has been stimulated by the entry of Netflix in 14 EU3
countries since 2012, and in the most cases, the reaction to its entry on national
markets: the launch of SVoD services by established audiovisual players from the
pay TV industry, commercial broadcasters and telecom operators which either
launched new SVoD services or promoted more heavily their own SVoD service.
The level of awareness for SVoD services among the EU population was raised by
the accompanying marketing undertaken by Netflix4 and other players to promote
their services. The rapid uptake of SVoD services since 2011/2012 in several EU
countries (the United Kingdom, the Netherlands, the Nordics, Luxembourg, Bel-
gium and Ireland) which are also among the most digitally advanced countries in
the EU, according to the Digital Economy and Society Index (DESI)5, tends to
demonstrate that consumer demand existed previously but was not met by equiva-
lent commercial offers. The entry of the global juggernaut of SVoD services, Net-
flix, and the services launched by national players in each territory, stimulated this
demand for subscription video-on-demand services. This becomes even clearer
when looking at the increase in consumer revenues the year of the launch of Net-
flix and the following year. The increase reflects quick adoption by EU consumers
in the concerned countries. Belgium and Germany are maybe the only countries
where Netflix launched where the increase in consumer revenues was more in-
cremental, growing however by respectively 52% and 41% the year after the
launch.
Without according to much credit to Netflix for this increase, it seems however that
the combined entry of the global SVoD player and the reaction by national or in-
ternational players (enhancing their previous offer, launching new SVoD services,
investing more in licences, revamping their user interface and enhancing the over-
all user experience) already on the given national markets had a stimulating effect
on the SVoD markets in the European Union. The impressive growth rates indicate
that SVoD services will in the foreseeable future convince more EU citizens, and
therefore further increase consumer revenues on these markets. Smaller SVoD
markets (but important markets when it comes to pay TV) which have not yet seen
the entry of global players (in 2014) such as Spain, Italy or Poland could experi-
ence a comparable boost in consumer revenues once compelling SVoD services
are launched, such as Yomvi (Canal+/Telefonica) combined to a market entry by
one global player, as it was the case in October 2015 for Netflix in Spain, Italy and
Portugal.
With the (surprise) launch of Netflix in all countries of the EU as of the 6th January
2016 and its global availability (190 countries), the EU SVoD market is set to fur-
ther expand and attract new subscribers. (This information was not available at the
time the note was written, in October 2015)

3
  Netflix currently operates its SVoD services in Austria, Belgium, Denmark, Finland, France, Germa-
   ny, Ireland, Italy, Luxembourg, the Netherlands, Portugal, Spain, Sweden and the United Kingdom
   as of October 2015. (This has changed as of January 2016 as Netflix is now available throughout
   the EU)
4
  As Netflix does not break-down marketing expenses by region it is not possible to give the market-
   ing expenses for EU countries. Netflix spent USD 313.7 million in 2014 for its international market-
   ing (EU included), adding 7.347 million subscribers or USD 42.70 of marketing expenses per each
   new subscriber on the international segment. Source: Netflix Annual report (10-K) 2014
5
  Available at : http://ec.europa.eu/digital-agenda/en/desi

                                                                                                     9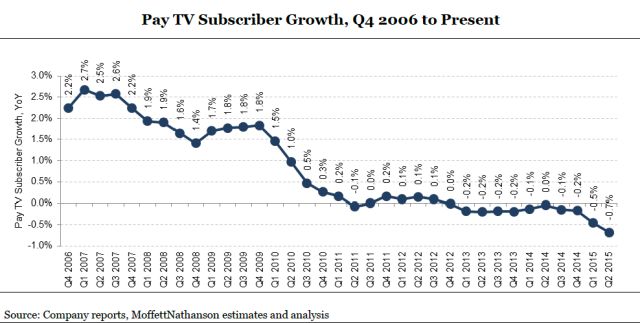
The SVOD Market In The EU Developments 2014/2015

Figure 2 SVoD consumer revenues 2010-2014 (in EUR million) and dateline – Entry of Netflix
         and launch of other SVoD services in selected EU countries

Source: OBS on IHS data

                                                                                          10
The SVOD Market In The EU Developments 2014/2015
1.3 SVoD: rising faster than other VoD services and taking
increasingly a larger share in consumer revenues for on-
demand services
SVoD services increased their share in total consumer revenues for on-
demand audiovisual services from 4% in 2010 to 34% in 2014
Consumer spending on SVoD rises faster than for other VoD services, with
respectively CAGRs of 113% and 28% per year between 2010 and 2014
To put the ascent of SVoD into context, a comparison with overall revenues gen-
erated from paid on-demand audiovisual services in the EU shows the ascent of
SVoD. IHS measures audiovisual on-demand consumer revenues for 4 different
categories:
- Online Film consumer revenues (mostly transactional VoD - all 28 EU
countries covered)
- Online TV consumer revenues (mostly transactional VoD - only 7 EU coun-
tries covered: France, Germany, Italy, the Netherlands, Sweden, Spain, the
United Kingdom)
- Television VoD consumer revenues (24 countries covered – no data for
Bulgaria, Croatia, Czech Republic and Romania)
- SVoD consumer revenues (22 EU countries covered – see above)
In order to compare the evolution of consumer revenues for SVoD in regard to
total consumer spend for audiovisual on-demand services, the 4 countries for
which no TV VoD data are available have been eliminated from the calculation.
For the 18 EU countries6 for which comparable data exists, overall con-
sumer revenues for on-demand audiovisual services (Online Film and TV,
Television VoD and SVoD) amounted to EUR 915.7 million in 2010 and in-
creased to EUR 2 461.5 million in 2014 (an increase by 169% over the 5
year period or a CAGR of 28% per year).
SVoD on the other hand increased from EUR 40.3 million in 2010 to EUR
828.9 million in 2014 for the 18 countries, an increase by +1 959% for the
same period, with a CAGR of 113% per year. The rise of SVoD services
was, judging by the increase in consumer revenues, more rapid than other
paid business models for on-demand audiovisual services.
The share of SVoD in consumer revenues for the 18 EU countries shows
that the share of SVoD passed from only 4% of total consumer revenues
for on-demand audiovisual services in 2010 to 34% in 2014, a steep in-
crease demonstrating the appeal of the “all-you-can-eat” business model
compared to transactional services. SVoD services, which propose in ex-
change for a flat monthly subscription all audiovisual content of their cata-
logues (mostly TV shows and films), are finding increasingly more custom-
6
Austria, Belgium, Germany, Demark, Spain, Finland, France, United Kingdom, Greece, Ireland,
Italy, Luxembourg, Netherlands, Poland, Portugal, Sweden, Slovenia, Slovakia
11The SVOD Market In The EU Developments 2014/2015
ers in the EU population who add them to their “audiovisual diet”, comple-
menting existing services.
As most of EU countries are only 3 to 4 years (since 2011/2012) into the
beginning of having a developing market for SVoD services, the uptake is-
still limited to a small percentage of the EU population as a whole but first
signs are encouraging for this business model when judging by growth
rates and consumer revenues levels as the addressable market for SVoD
expands.
Table 3 Total consumer revenues for on-demand audiovisual services in 18 EU countries, in
EUR million and %, 2010-2014
For copyright reasons the data cannot be reproduced in the public version of this report
Source: IHS
12The SVOD Market In The EU Developments 2014/2015
Table 4 Share of SVoD consumer revenues in overall consumer revenues for on-demand
audiovisual services EU 18, in %, 2010-2014
For copyright reasons the data cannot be reproduced in the public version of this report
Source: IHS
Figure 3 Share of SVoD consumer revenues of total consumer spend for on-demand audio-
visual services in EU 18 and SVoD consumer revenues, in % and EUR million, 2010-
2014
For copyright reasons the data cannot be reproduced in the public version of this report
Source: IHS
13The SVOD Market In The EU Developments 2014/2015
Figure 4 Growth rates of OTT SVoD, Film, TV and Managed networks in the EU 2010-2014, in
%
For copyright reasons the data cannot be reproduced in the public version of this report
Source: IHS
14The SVOD Market In The EU Developments 2014/2015
1.4 Consumer revenues on SVoD services are still a fraction
of consumer spending for pay TV in the EU: still a com-
plement rather than a substitute for pay TV in 2014
Pay TV consumer spending amounted to EUR 36 942 million in 2014 in the
22 EU countries compared to EUR 844 million for SVoD services or 2.3%
However, SVoD (CAGR +113%) is growing much faster than pay TV
(CAGR +5%) between 2010 and 2014
SVoD is also outpacing pay TV in net additions of subscribers in Europe
since the fourth quarter in 2013 according to data released by Ampere
Analysis
Cord-cutting as in the US is at the moment not taking place in the EU over-
all but several EU countries start to experience a downward trend in pay
TV subscriptions and revenues
SVoD is more a complement (for now) to pay TV than a real competitor as
more homes are taking a combination of pay TV and SVoD subscriptions
than a standalone SVoD service
One of the “big” questions in the audiovisual industry is the place SVoD services
will take with regard to pay TV services (in addition to the question of how much
viewing time spent on SVoD services will erode live viewing of linear channels). In
the US, the fear of “cord cutting” by pay TV operators (cancelling a pay TV sub-
scription in order to subscribe to a less expensive over-the-top service for audio-
visual content, such as SVoD) manifested itself in the second quarter of 2015 in
which the pay TV sector in the US lost 566 000 subscribers, accelerating the
trend compared to losses of 321 000 subscribers in the second quarter of 2014,
continuing the downward trend of pay TV subscriber growth which started to
be negative in the second quarter of 2013 according to analysis by MoffetNa-
thanson.
In Europe, the situation is not comparable as pay TV players in the US and in Eu-
rope have different operations and business models (in particular, pay-TV services
are less expensive in Europe than in the US). However, SVoD services operating
in the EU are proposing increasingly content (films and TV shows, documentaries)
which compete with the offers of traditional pay TV players. Therefore, the ques-
tion if SVoD services are in competition with traditional pay TV players or a rather
a complement to pay TV is still a valid one.
SVoD consumer revenues represented only a tiny share of 0.1% of consumer
spending on pay TV in 2010; however the share evolved rapidly to 0.6% in 2012,
1.2% in 2013 and already 2.3% in 2014 in EU 22. As SVoD consumer revenues
increase strongly year-to-year and are outpacing consumer spending on pay TV,
this rising proportion is no surprise. But is a trend of cord-cutting taking place in
Europe? Are subscribers replacing their subscription to pay TV services with sub-
scriptions to video-on-demand services?
In 2014, pay TV generated EUR 36.94 billion in consumer spending in the 22 EU
15The SVOD Market In The EU Developments 2014/2015
countries7, up by 5.4% compared to 2013 and with a CAGR of 4.7% between 2010
and 2014. The only countries experiencing a fall in consumer revenues for pay TV
during the period were the Czech Republic (CAGR -2%) and Italy (-1%). The in-
teresting fact to single out is that Sweden and the Netherlands, countries with
higher consumer revenues for SVoD services and, as it seems, a higher adoption
rate for SVoD services among the population, experienced a decrease in pay TV
consumer spending in 2014 compared to 2013, respectively -3% and -6%. Accord-
ing to Ampere Analysis, SVoD subscribers are outpacing pay TV subscribers
in Europe since the fourth quarter 2013, adding between 2 to 3.5 million subscrib-
ers (net additions) each quarter where pay TV adds between 1 to 3 million each
quarter.
A Telecompaper consumer panel stated in September 2015 that 8% of Dutch
consumers expect to “cut the cord”, mainly as a result of more content being avail-
able over the Internet. For Nordic countries, the Arkana Nordic Video 2015 found
through a survey of 4 000 people that around 10% were planning to terminate their
cable or satellite subscription in favor of OTT services. IHS found out that in 2014,
cord cutting was a reality in 10 EU markets (Belgium, Denmark, Italy, Malta, the
Netherlands, Sweden, Czech Republic, Latvia, Lithuania and Poland), and attrib-
utes this trend to be a “combination of actors including an over-hang from the re-
cent economic downturn and the wider impact of new technology in the home
broadening the consumption choices of the average consumer8”.
“Cord-cutting” is not yet a market reality in the overall EU market for pay TV but
could manifest itself in several countries in the medium term as consumers and
younger generations will increasingly find appealing content on the Internet to
complement and substitute their actual television diet. Countries with high penetra-
tion rates for SVoD services are among the most exposed to the trend of consum-
ers reducing/cutting a more expensive pay TV subscription in favor of a subscrip-
tion to a Video-on-Demand service.
However, pay TV subscribers are expected to grow by 8.38 million until 2020 in
Western Europe while revenues will remain flat during the period as the average
revenues per user decreases due to increased competition from OTT video ser-
vices, and especially SVoD, on one hand, and by the launch of IPTV pay TV plat-
forms on the other hand, challenging established pay TV players in the cable and
satellite markets, according to research firm DigitalTV Research in its “Digital TV
Western Europe Forecasts”.
Another interesting finding provided by Ampere Analysis is that for countries in
their survey (France, Germany, Italy, Spain and the United Kingdom), more
homes have a combination of traditional pay TV with a third-party OTT SVoD
service than homes which have only a standalone OTT SVoD subscription. The
percentage of homes which have a combination of pay TV and an OTT SVoD are
the following; France 8%, Spain 12%, Italy 14%, Germany 18% and the United
Kingdom 26%. The percentage of homes which have a standalone SVoD services
are much lower; France below 1%, Spain 1.2%, Italy 1.6%, Germany 4.9% and the
United Kingdom 8.1%).
SVoD services will for the short term rather be a complement to pay TV in the EU
and, with some exceptions, not challenge the traditional pay TV market. Also in
reaction to the threat that SVoD services might pose to their business model, pay
7
For EU 28, consumer spending on pay TV pegged at EUR 37.6 billion in 2014, up by 5.3% on a
yearly basis according to IHS
8
See, ”Cord-cutting takes hold in Europe”, DigitalTVEurope 1st August 2014, available at:
http://www.digitaltveurope.net/219052/cord-cutting-takes-hold-in-europe/
16The SVOD Market In The EU Developments 2014/2015
TV operators in the most important pay TV markets across Europe are launching
their own standalone, over-the-top SVoD services such as Sky Now (Sky), Canal-
Play (Groupe Canal+), Sky Snap (Sky Deutschland) Maxdome (ProSiebenSat.1),
Viaplay (Modern Times Group), Infinity (Mediaset), Yomvi/Movistar (Telefonica).
As Netflix’s CEO Reed Hastings says, the number of pay TV subscribers “will be
relatively stable for a fairly long time9” because pay TV operators are reacting and
acting to meet consumer expectations: “When forced to act, they will improve”.
This is true in the USA and also in the EU as the recent initiatives by pay TV oper-
ators tend to demonstrate.
Therefore, in the short term, SVoD will be a complement to traditional pay TV but
in digitally more developed economies, where younger generations might not want
to pay for an expensive pay TV subscription when having the option to subscribe
to a cheaper SVoD service (so called “cord-nevers”, consumers having never
subscribed to pay TV), the threat by SVoD to the traditional pay TV business mod-
el can soon become reality.
9
See, ”Netflix CEO `Most Scared' of Hollywood's TV Everywhere Effort”, Bloomberg 3rd November
2015, available at: http://www.bloomberg.com/news/articles/2015-11-03/netflix-ceo-most-scared-
of-hollywood-s-tv-everywhere-effort
17The SVOD Market In The EU Developments 2014/2015
Table 5 Consumer spending on pay TV per country EU 22, in EUR million, 2010-2014
For copyright reasons the data cannot be reproduced in the public version of this report
Source: IHS
Table 6 SVoD consumer revenues in % of consumer spending on pay TV, 2010-2014
For copyright reasons the data cannot be reproduced in the public version of this report
Source: OBS on IHS data
Figure 5 Net additions pay TV and SVoD subscribers Europe, in millions, 2009-2015
Source: AmpereAnalysis
18The SVOD Market In The EU Developments 2014/2015
Figure 6 Homes having a subscription to Pay TV and SVoD in the UK, DE, FR, IT, ES, USA in
2015, in %
Source: AmpereAnalysis
Figure 7 Homes subscribing to a standalone OTT SVoD service in the UK, DE, FR, IT, ES,
USA in 2015, in %
Source: AmpereAnalysis
19The SVOD Market In The EU Developments 2014/2015
2 SVoD in Europe – Generalist, Niche and Di-
rect-to-consumers strategies
2 broad categories of SVoD services: Generalist (catalogue of TV shows
and films targeting larger audiences), either managed by new entrants or
by established media groups and broadcasters, and Niche services (spe-
cialized content targeted at smaller audiences).
Few generalist SVoD players such as Netflix, Amazon, Sky, Vivendi, HBO
Nordics, and Viaplay have a presence in several EU countries due to li-
censing issues for premium content, need of scale and high set-up costs
for infrastructure and content acquisition.
National SVoD services provided by established audiovisual players are
most of the time generalist and in competition with pan-European SVoD
services
Niche players tend to have a broader pan-European coverage as their tar-
get groups are smaller and they need scale to be profitable; content in their
catalogues is less restricted than for generalist services in terms of licens-
es
The “Direct-to-consumer strategy” (D2C) is an option for media companies
with the required financial resources and content offer to bypass intermedi-
aries (such as network operators) and extend their reach in the online
space. This strategy is already applied in the US by media companies and
comes to Europe with Disney’s DisneyLife and Discovery’s Dplay SVoD
services. The D2C strategy is set to be applied by other significant players
in the near future in order to capture a share of the growing SVoD market.
Increased mobile and multi-screen viewing will require media companies to
rethink the user experience in an “App” world and to strengthen their tech-
nical know-how in order to compete with tech players such as Netflix and
Amazon
In Europe, Sky, Vivendi, the Modern Times Group are part of a small group
of audiovisual players which could increase their pan-European presence
on the SVoD market
SVoD players in Europe can be broadly divided into two categories, on one end
Generalist services and on the other end Niche players, with several layers of dif-
ferentiation between them. In order to present a simple overview we have chosen
this presentation.
Generalist SVoD services have the aim to cater to large audiences and therefore
have a large selection of films, TV shows and documentaries in their catalogues
(Netflix is the global juggernaut in this category, also in Europe although its ser-
vices are not yet present through the EU). These services are in competition for
subscribers and content with each other on their respective territories. Generalist
SVoD services are for the larger part provided by OTT players (such as Netflix,
Amazon or wuaki.tv), traditional pay TV operators (such as Sky, Canal+ or The
Modern Times Group), commercial broadcaster (such as ProSiebenSat.1) or tele-
20The SVOD Market In The EU Developments 2014/2015
com players (such as Telefonica) as content acquisition, exclusive licensing and,
since recently, original content production require a meaningful investment and, to
put it briefly, deep pockets.
Niche players are specializing themselves into content that caters to special tastes
and topics (Sports with the Eurosport Player by Discovery, art house movies with
MUBI, educational content for children with Hopster, documentaries with Sun-
dance’s Doc Club, Horror films with AMC’s and DramaFever’s Shudder SVoD ser-
vice) or content from specific regions or/and in specific languages (LebaraPlay
targeting Tamil, Hindi or Turkish population in Europe in conjunction with its mobile
telecom offer, Afrostream specializing in content from Africa, Eros Now for Indian
and Bollywood content, iROKOTV for content from Nigera – “Nollywood”). Rather
than competing with generalist SVoD services, they try to target specific groups
with curated content. Niche services are by definition limited to niches, small target
groups and here it is not exclusive content or original productions which will attire
subscribers but their curation of specific, for the targeted audience’s relevant con-
tent.
As niche players tend to cater to specific interests and are therefore not disrupting
the traditional audiovisual market, the description of main players will focus on
generalist SVoD services in selected EU countries: France, Germany, the United
Kingdom, the Netherlands and the Nordics. In order to be in line with last year’s
report, a short presentation of the latest developments concerning Netflix and its
expansion in the EU is also part of this section.
It should also be noted that in the US the trend of audiovisual players (traditional
and new) extending their linear offerings through subscription-based models such
as CBS’ All Access, Fullscreen’s planned SVoD services (Fullscreen is one of the
biggest MCNs on YouTube), NBC’s planned Comedy SVoD service Seeso, CBS’
Showtime SVoD service or Viacom-owned Nickelodeon’s Noggin SVoD service, in
order to reach younger generations and consumer who have cut-the-cord, is not
yet a main trend in the EU.
However, this strategy of going “direct-to-consumer” without intermediaries, as it
has been the case with HBO Now in the US, is poised to come also to Europe with
the launches of DisneyLife by The Walt Disney Company in the UK at the end of
2015 and in several EU countries in 2016 and the multi territory launches of DPlay
by Discovery Communications in Denmark, Sweden and Italy and other EU coun-
tries in the near future in complement to the Eurosport Player, the D2C platform of
its Eurosport sports channels (with the stated goal of reaching 1 million subscrib-
ers which could generate additional USD 100 million revenues per year, having
already reached 200 000 international subscribers as of end 2015).
The Walt Disney Company announced in October 2015 that it will launch Disney-
Life, a SVoD service which will offer Disney films, TV series, books and music di-
rectly to the consumer through a dedicated platform, bypassing thus aggregators
and other SVoD services. First launched in the United Kingdom, it aims to expand
its presence in Europe through launches in France, Spain, Italy and Germany in
2016. As CEO Bob Iger says: ”This is the future, in many respects. We’re seeing
more and more opportunities to reach consumers directly and not through mid-
dlemen, and we’re seeing consumers wanting product in different ways.10” Once
the investment of setting up the direct-to-consumer platform is made, it is scalable
to other countries and world regions, making it an attractive option for important
10
See, ”Disney to Launch Subscription Streaming Service in U.K”, Variety 21 st October 2015, availa-
ble at: http://variety.com/2015/digital/global/disney-to-launch-subscription-streaming-service-in-u-
k-1201623079/
21The SVOD Market In The EU Developments 2014/2015
media companies and broadcasters.
The direct-to-consumer approach could also be taken by Europe’s big media play-
ers in content production (for which it would also present the advantage of bypass-
ing intermediaries). However, the costs associated with this strategy, the shift in
operations and daily functioning (a strong change from what has been the stand-
ard in the linear audiovisual world) and finally the technical know-how required to
optimise user interfaces, user experiences and building recommendation algo-
rithms makes this option viable only for financially stronger media groups, capable
of setting-up and operating such an infrastructure.
The following sections on SVoD markets in selected EU countries are based on
data gathered from different research firms such as IHS, Statista, Futuresource
Consulting, AmpereAnalysis, GfK, DigitalTV Research, eMarketer and Mintel. As
the figures released by these firms are based on data collected, samples, models
and estimations, differences appear. In order not to rely on a sole source for mar-
ket data, the sections give an overview of data available. We are not in a position
to verify data and to assess which firm’s estimates are the closest to the real mar-
ket situations in these countries as no official data is released by most of the play-
ers, therefore data should be interpreted with care.
However, all sources indicate a clear increase of SVoD service and predicate that
this business model will encounter success in EU countries. For now, Western
Europe is leading in consumer revenues and adoption rates mainly by more fa-
vourable market conditions for SVoD services, which in turn encouraged market
entries of global players such as Netflix, Amazon and HBO and EU players such
as Sky, Vivendi and the Modern Times Group. As the digital uptake (broadband
penetration, equipment in connected devices, use of streaming services) will con-
tinue further in the EU, it is expected that populations will continue to adopt these
new services and that established audiovisual players and new entrants will con-
tinue to invest the EU market for SVoD services.
The competition between generalist SVoD services for exclusive licences and in-
creased production of original content will increase, as these are clear competitive
advantages and allows players to differentiate themselves from competitors. Ac-
quisition and production of premium content (valued by the audiences) is a costly
matter, therefore global players and important groups in the audiovisual sector will
solely have the financial resources to commit these investments. Smaller players
will increasingly turn to niche audiences and try to federate audiences on a pan-
European level (or in several countries) as they need size in order to be profitable.
Established broadcasters will try to extend their reach by enriching their linear of-
ferings through an strengthened online presence, either relying on advertising as it
was the case in the linear space (mainly YouTube channels or own platforms with
advertising), either by opting for a paid option in which the subscription-based
model is preferred (as opposed to a transactional unit-by-unit based business
model), the direct-to-consumers approach.
The pace of change will depend on audience behaviour and as audiences are get-
ting younger and new consumption patterns emerge and, at the same time, new
services enter markets in the EU, predicting market situations is difficult, if not im-
possible tasks. One fact is however clear, the audiovisual marker in the EU and
globally is set for years of evolutions and changes in which established players are
challenged by a new, mostly technology-based competition and SVoD services,
generalist, niche and direct-to-consumer will play an important role in this evolution
with revenues in Western Europe forecasted to pass the USD 4 billion mark in
2019 by IHS.
22The SVOD Market In The EU Developments 2014/2015
Figure 8 SVoD online video revenues in Western Europe and North America, in USD billion
Source: IHS
23The SVOD Market In The EU Developments 2014/2015
2.2 The global Juggernaut: Netflix
In this section, the focus is uniquely on Netflix’s presence in the EU. Describing
Netflix’s operation and business developments requires a report on its own with
regard to the several developments the company has made the past couple of
years.
Without the aim of being exhaustive, some of the main developments of the years
2014 and 2015 are:
The expansion into more countries, reinforcing its global presence (with the
announced aim of operating in 200 countries by the end 201611). The share
of international paid memberships passed from 18% in Q1 2013 to 36% in
Q3 2015, reflecting the rising importance of international markets for Netflix
The increased reliance on international markets, which are still losing mon-
ey, as Netflix encounters more competition in its domestic market the US.
The losses are justified by having a “first mover advantage” in most inter-
national markets.
The distribution of its application by main Internet Service Providers in the
EU such as Vodafone, Orange, Telecom Italia, Deutsche Telekom (non-
exhaustive) has enabled Netflix to enlarge its reach in the EU.
The announcement of its entry into original movies and the multiplication of
original productions in 2015 with a slate of 320 hours is further changing
the SVoD market
The aim of having global licences in order to propose the most of content in
all markets the company operates in
The importance of data: for commissioning and acquiring of content, to
recommend relevant content to each subscriber in order to keep them as
customers
Netflix is the dominant player of SVoD services worldwide, having a global pres-
ence (over 90 terrritories as of November 2015) and operating in 14 EU countries.
The entry into Italy, Spain and Portugal in October 2015 further strengthen its pan-
European position. Netflix is operating in Austria, Belgium, Denmark, Finland,
France, Germany, Ireland, Italy, Luxembourg, the Netherlands, Portugal, Spain,
Sweden and the United Kingdom in the EU as of November 2015. The estimates
of its EU subscribers vary strongly: IHS estimated that Netflix had 7.88 million
subscribers as of December 2014, Futuresource Consulting already estimated that
the number of subscribers had risen to 11.6 million in the EU as of the second
quarter 2015 and DigitalTV Research expects Netflix to finish 2015 with 13 million
subscribers in the EU. The biggest markets for Netflix in the EU are the United
Kingdom, the Netherlands, the Nordics, France and Germany. Revenues or prof-
its/losses for individual countries are not published by the company, which classi-
fies all its international operations under one segment.
The entry into these “new” EU markets came after an expansion in Australia, New
11
As of the 6th January 2016, Netflix is already available in 190 countries after the announced launch
at CES. With this surprise launch, Netflix is now available in all countries of the EU.
https://help.netflix.com/en/node/14164 http://www.wsj.com/articles/netflix-expands-to-190-
countries-1452106429
24The SVOD Market In The EU Developments 2014/2015
Zealand Japan and Cuba in 2015 and the announced entry into the several Asian
markets with the programmed launches in Hong Kong, Singapore, South Korea
and Tawain in early 2016. A possible launch in India in 2016 could also happen,
as reported by the Times of India. However, a launch in China, one of the world
biggest markets and where with Alibaba Netflix would have already a strong com-
petitor, is uncertain. A possible launch in Poland and the Czech Republic could
also happen in 2016 but Netflix has made no clear announcement, so this remains
pure speculation. However, it would fit into Netflix’s plans of having a global pres-
ence as CEE countries are still missing from its countries of operations.
Netflix furthermore managed to strike several distribution deals in order to have its
application on set-top boxes by Internet Service Providers (telecom, cable), an
important step to enlargen its reach in EU markets. As an example, Vodafone
agreed to add Netflix on its boxes in the United Kingdom, Portugal and Spain.
Other ISPs all over Europe are adding Netflix as the SVoD service becomes also a
marketing argument for these players: Orange, Bouygues Telecom in France,
Deutsche Telekom in Germany, ComHem in Sweden, Telecom Italia in Italy only
to list sever al deals the company has managed to made the past
couple of years. This shows what Liberty Global’s Chairman Malone thinks about
Netflix, considering them “Frenemies”when asked if Netflix is a competitor or a
partner: “"Frenemies" is the term of art. Almost all the communication companies
compete with each other and supply each other and drive each other. It is sort of
the nature of the beast.12”
On one hand Netflix is enabling the broadband business of these ISPs, while on
the other hand Netflix is competing with them (or those which have audiovisual
services) for the audience’s attention. In addition, Netflix has brought a change in
consumer behaviour and forced other players to adapt to the new market given.
Liberty Global’s CEO Mike Fries expressed this view at the ANGA COM in June
2015 when asked about Netflix: “A few years ago we were scared about the
changes it might bring about to our video [business],” “It’s not really the content
that’s driving people to Netflix, it’s the experience. Today we are providing that
kind of experience ourselves” “Why pay Netflix for a very narrow range of pro-
gramming when you can get all the broadcast channels, all the great movies and
series, and Netflix-like content from cable? It’s really about providing viewers with
the experience. We really have Netflix to thank for [stimulating] that. Almost by
definition, where an OTT provider exists, consumers who use it are also better
consumers of cable services and broadcast channels.13” Therefore, the recent
distribution deals are benficail to both parties concerned; Netflix is increasing its
reach, ISPs are offering more value and have been forced to adapt their services
in order to remain relevant in the competition with Netflix and other OTT players.
At this date, the relationship seems to be a win-win situation for most ISP and dis-
tributors of audiovisual services.
International markets are important for Netflix, increasingly as it faces competition
on the US market from players such as Amazon, Hulu, HBO Now which slows its
US growth (see tables on Netflix’s financial results). Netflix is therefore searching
growth in previously untapped markets. Netflix finished the third quarter of 20145
with 66 million paid memberships, of which 23.9 million international subscribers.
The share of international subscribers passed from 18% in the first quarter 2013 to
12
See,”For Liberty Global, the Next Step Is the Content”, The Wall Street Journal 29th July 2014,
available at: http://www.wsj.com/articles/next-step-for-liberty-global-content-1406667563
13
See,”Netflix no threat, but makes cable better, say Liberty Global, Vodafone”, DigitalTVEurope 9th
June 2015, available at: http://www.digitaltveurope.net/380221/netflix-no-threat-but-makes-cable-
better-say-liberty-global-vodafone/
25The SVOD Market In The EU Developments 2014/2015
already 36% in quarter 3 of 2015, showing the increased importance of interna-
tional markets for the company’s business model. International revenues are grow-
ing faster than US streaming revenues and so do international paid memberships
but for now the international business is not yet profitable to Netflix.
However, this international growth came at costs. Netflix is still losing money on its
international markets: USD -274.3 million in 2013, USD -159 million in 2014 and
already USD -224 million in 2015. International revenues are growing; USD 712
million in 2013, USD 1.3 billion in 2014 and already 1.38 billion in the third quarter
of 2015 but so do costs. Operating and content acquisition costs grew heavily dur-
ing this expansion: USD 782 million in 2013, USD 1.15 billion in 2014 and USD
1.25 billion in the 3rd quarter 2015. Netflix is also investing in marketing when en-
tering new markets in order to raise awareness for its service, so it is no wonder
that marketing costs followed the increased costs: USD 204 million in 2013, USD
313 million in 2014 and USD 362 million in the 3rd quarter of 2015.
Netflix’s international expansion is therefore costing more than it brings in. Gaining
new subscribers, raising awareness for its service through marketing and acquir-
ing content for the new markets is a costly matter. The company, trying to be the
first international entrant on most of its new markets takes this into account as the
aim is to establish a strong presence in several international SVoD markets in re-
gard to the forecasted growth of SVoD markets in Europe and worldwide with the
aim of becoming the global player in SVoD.
Netflix is placing a bet on being able to be the dominant player on the worldwide
SVoD market and for now it is on the winning side. However, this aggressive ex-
pansion has cost the company a reduction in its net income (returing in Q3 2015 to
its level of Q2 2013 of USD 29.4 million after having peaked in Q4 2014 at USD 83
million), as the profitable US streaming and DVD rental business are financing the
international expansion, which is still losing money.
Expanding into new markets requires heavily investments but as Netflix is growing
in can rely on economies of scale for its expenses and, increasingly, content ac-
quisition as the company is now looking to acquire content globally. Netflix Chief
Content Officier Ted Sarandos, quoted by Variety, expressed this shift from acquir-
ing licences for individual countries towards acquiring global licences: “We don’t
have regional buying teams anymore,” he said. In negotiations with studios, Netflix
is asking for global rights “or we’re not interested at all.14” It has also strenghtend
its original production with 320 hours in 2015 and debuted 48 originals such as
Marvel’s Daredevil, comedy specials and movies (Crouching Tiger, Hidden Dragon
and Beast of No Nation) to only list some. The companies increased reliance on
original productions (read exclusive and global content) instead of programming
bought at third parties (of which Sarandos says that for TV programming Netflix is
not interested in rights that are non-exclusive) and global exclusive rights shows
the shift that is happening on the audiovisual market. As on-demand audiovosiual
services are increasingly used by the audience and new SVoD services are
launched, it is essential to provide your subscribers with exclusive content in order
to keep them subscribing. Netflix is atop this shift in paradigm on the audiovisual
market and will continue to invest heavily in content, more and more in exclusive
and global licences or in original productions as content is a competitive and dis-
tinctive advantage on the SVoD market (see section on content).
Finally, another important point is the collection and use of data Netflix makes on
its audiences. Sarandos stated: “Big data is a very important resource to allow us
14
See,”Ted Sarandos: Netflix Appetite for Originals Growing Stronger”, Variety 13th May 2015, avail-
able at: http://variety.com/2015/digital/news/netflix-ted-sarandos-original-series-1201494618/
26The SVOD Market In The EU Developments 2014/2015
to see how much to invest in a project but we don’t try to reverse-engineer,” and
added that for commissioning, decisions are “70% science and 30% art15” (there-
fore relying on data gathered). Netflix gathers many data, not only on what sub-
scribers are watching but on also when a user clicked on a show, when he
stopped watching it in order to be able to recommend to subscribers content that
they will watch until completition and then show them what to watch next until
completition. Netflix’s aim is to make subscribers coming back and this can be
achieved by displaying in front of them relevant content (for the individual sub-
scriber) to watch. Netflix released a sample of the use they can make with data in
2015 by showing the number of episodes it takes for 70% of viewers to get
“hooked” on a TV show. This new innovative use of data, for commissioning and
acquisition of content, gives Netflix an edge over competitors, which do not dis-
pose of this data as Netflix does not release any viewing data. (However, Nielsen
tracks since 2015 nearly 1 000 shows on Netflix to give right holders an idea of
how there content is performing on Netflix).
Netflix’s strong position on the international SVoD market and in the EU seems
dominant. The company is profiting from economies of scale (amortization of R&D,
content acquisition, infrastructure) and from the first mover advantage in several
markets. With its EU expansion, Netflix is now operating in 14 out of the 28 EU
countries, with Poland and the Czech Republic being candidates for an expansion
in 201616. As the company is striking increased global deals for exclusive content
and raising its orginal production output, it will benefit from competitive ad-
vantages. EU players on the SVoD market, often operating in one to three coun-
tries (such as Sky, The Modern Times Group, Vivendi and maybe soon Altice) do
not benefit from the same scale in this specific SVoD segment. As the company
plans its further worldwide expansion, it is set to continue the main competitor for
national players on their home turf. The situations in the United Kingdom, the Nor-
dics, the Netherlands and France show the effect Netflix had on the SVoD market
(leading often to oligopolies or duopolies), a market that requires high investments,
raising therefore the barriers to entry for generalist SVoD services. The aggressive
international expansion and the first mover advantage it procures Netflix demon-
strate the need for the company to strengthen its position in national SVoD mar-
kets before competitors are able to replicate its strategy. In the future, only media
companies having the financial resources necessary to commit the necessary con-
tent, infrastructure, R&D and marketing investments will be able to compete with
the international giant of SVoD services.
15
See, ”Netflix’s Ted Sarandos: ‘We like giving great storytellers big canvases’ “, The Guardian 15th
March 2015, available at: http://www.theguardian.com/media/2015/mar/15/netflix-ted-sarandos-
house-of-cards
16
After the launch in January 2016 of Netflix’s operations in 130 countries worldwide this is already
the case. Netflix is now available in the EU on a pan-European level.
27The SVOD Market In The EU Developments 2014/2015
Table 7 Netflix - EU subscribers in million as estimated by main source
IHS/The New York Times as of Decem-
7,88
ber 2014
Futuresource Consulting as of Q2 2015 11,6
DigitalTV Research as of December
13
2015
Source: Company estimates, press releases, press articles
Table 8 Subscribers to Netflix in Europe and North America, IHS
Source: The New York Times
28The SVOD Market In The EU Developments 2014/2015
Figure 9 Netflix Subscriber Breakdown Q2 2015, in millions – Futuresource Consulting
Source: Futuresource Consulting
Table 9 Netflix paying SVoD subscribers by country at December 2015, in thousands – Digi-
talTV Research
USA 43 541
International total 23 360
of which EU 13 008
Austria 236
Belgium 300
Denmark 713
Finland 668
France 1 150
Germany 1 208
Ireland 330
Italy 150
Luxembourg 38
Netherlands 1 600
Portugal 60
Spain 150
Sweden 1 463
United Kingdom 4 942
Source: DigitalTV Research
29The SVOD Market In The EU Developments 2014/2015
Figure 10 Netflix US and International Paid memberships Q1 2013 –Q3 2015, in thousands
70 000
60 000
50 000
40 000
30 000
20 000
10 000
0
Q1 2013 Q2 2013 Q3 2013 Q4 2013 Q1 2014 Q2 2014 Q3 2014 Q4 2014 Q1 2015 Q2 2015 Q3 2015
US Paid memberships End of period International Paid memberships End of period
Source: Netflix Quarterly Earnings Q3 2015
Figure 11 Netflix US and International Paid memberships quarterly growth Q1 2013 –Q3 2015,
in %
25%
20% 21%
20%
17%
15% 15%
15% 12%
11% 11%
11%
10%
10% 8%
7%
6%
5% 4%
5% 3% 3%
2% 2% 2%
0%
Q2 2013 Q3 2013 Q4 2013 Q1 2014 Q2 2014 Q3 2014 Q4 2014 Q1 2015 Q2 2015 Q3 2015
US paid membership growth quarterly growth
International paid membership growth quarterly growth
Source: Netflix Quarterly Earnings Q3 2015
30The SVOD Market In The EU Developments 2014/2015
Figure 12 Netflix US and International revenues Q1 2013 – Q3 2015, in USD thousands
1 800 000
1 600 000
1 400 000
1 200 000
1 000 000
800 000
600 000
400 000
200 000
0
Q1 2013Q2 2013Q3 2013Q4 2013Q1 2014Q2 2014Q3 2014Q4 2014Q1 2015Q2 2015Q3 2015
US Streaming revenues End of period International Streaming Revenues End of period
Source: Netflix Quarterly Earnings Q3 2015
Figure 13 Netflix US and International revenues quarterly growth Q1 2013 – Q3 2015, in %
25%
21% 21%
20%
17%
15%
15% 14%
12% 12%
10%
9%
10% 8% 7%
5% 6% 5%
4% 5% 5% 4%
5% 4%
0%
Q2 2013 Q3 2013 Q4 2013 Q1 2014 Q2 2014 Q3 2014 Q4 2014 Q1 2015 Q2 2015 Q3 2015
US revenues quarterly growth International revenues quarterly growty
Source: Netflix Quarterly Earnings Q3 2015
31The SVOD Market In The EU Developments 2014/2015
Figure 14 Netflix US streaming profits and International loss Q1 2013 – Q3 2015, in USD thou-
sands
400 000
350 000
300 000
250 000
200 000
150 000
100 000
50 000
0
Q1 2013 Q2 2013 Q3 2013 Q4 2013 Q1 2014 Q2 2014 Q3 2014 Q4 2014 Q1 2015 Q2 2015 Q3 2015
-50 000
-100 000
-150 000
US Streaming Profit International Streaming Loss
Source: Netflix Quarterly Earnings Q3 2015
Figure 15 Netflix International Streaming revenues and cost of revenues Q1 2013 – Q3 2015, in
USD thousands
700 000
600 000
500 000
400 000
300 000
200 000
100 000
0
Q1 2013 Q2 2013 Q3 2013 Q4 2013 Q1 2014 Q2 2014 Q3 2014 Q4 2014 Q1 2015 Q2 2015 Q3 2015
International Streaming Revenues End of period International Cost of revenues + Marketing
Source: Netflix Quarterly Earnings Q3 2015
32The SVOD Market In The EU Developments 2014/2015
Figure 16 Netflix International Streaming revenues and cost of revenues Q1 2013 – Q3 2015, in
%
30%
24%
25%
21% 21%
20% 17% 17%
15%
14% 14%
15% 12% 12%
10% 9%
10% 8% 8%
7% 7% 7%
6% 11%
5%
0%
Q2 2013 Q3 2013 Q4 2013 Q1 2014 Q2 2014 Q3 2014 Q4 2014 Q1 2015 Q2 2015 Q3 2015
International Streaming Revenues quarterly growth
International Cost of revenues + Marketing quarterly growth
Source: Netflix Quarterly Earnings Q3 2015
Figure 17 Netflix US and International cost of marketing Q1 2013 – Q3 2015, in USD thou-
sands
250 000
200 000
150 000
100 000
50 000
0
Q1 2013 Q2 2013 Q3 2013 Q4 2013 Q1 2014 Q2 2014 Q3 2014 Q4 2014 Q1 2015 Q2 2015 Q3 2015
US Streaming Cost of Marketing International Streaming Cost of Marketing
Source: Netflix Quarterly Earnings Q3 2015
33The SVOD Market In The EU Developments 2014/2015
Figure 18 Netflix Consolidated net income (US streaming and DVD rental, International
streaming) Q1 2013 – Q3 2015, in USD thousands
90 000
80 000
70 000
60 000
50 000
40 000
30 000
20 000
10 000
0
Q1 2013 Q2 2013 Q3 2013 Q4 2013 Q1 2014 Q2 2014 Q3 2014 Q4 2014 Q1 2015 Q2 2015 Q3 2015
Consolidated Net income (US & International Streaming, US DVD rental)
Source: Netflix Quarterly Earnings Q3 2015
Figure 19 Netflix Consolidated net income (US streaming and DVD rental, International
streaming) quarterly growth Q3 2013 – Q3 2015, in %
60%
52%
40% 41%
34%
20% 11%
10% 12%
8%
0%
Q3 2013 Q4 2013 Q1 2014 Q2 2014 Q3 2014 Q4 2014 Q1 2015 Q2 2015 Q3 2015
-20% -17%
-40%
-60%
-72%
-80%
Source: Netflix Quarterly Earnings Q3 2015
34The SVOD Market In The EU Developments 2014/2015
3 SVoD players and market in the United King-
dom: EU’s most developed market could give
some leads as to the future of SVoD in Europe
3 Main players: Netflix, Amazon’s Prime Instant Video and Sky’s Now TV
Most important SVoD market in the EU, by size and subscribers
UK market for digital services outstanding in Europe, setting the UK SVoD
market apart from the rest of EU28
Domination of Netflix with 71.1% of market shares in volume and 4.3 mil-
lion subscribers as of 1st quarter 2015
Increased challenge of the traditional TV ecosystem by SVoD players
According to IHS, SVoD consumer revenues in the United Kingdom amounted to
EUR 393.3 million in 2014, up by 62% from revenues generated in 2013. The UK
SVoD market is the most dynamic in the EU, by consumer revenues or subscrib-
ers, estimated at 7 million at the end of 2014 by research firm Futuresource con-
sulting (which expects the number of subscribers to SVoD services to reach 13.6
million by 2019 and estimates the market value of SVoD services to cross GBP 1
billion). OFCOM in its “The Communications Market Report 2015” estimates that in
the first quarter 2015, 4.37 million households subscribed to Netflix (representing
16% of all households, up from 2.7 million in the 1st quarter of 2014), 1.15 million
subscribed to Amazon’s Prime (representing 4% of all households, up down from
1.21 million in 1st quarter 2014) and 0.52 million subscribed to Sky’s Now TV (2%
of households and up from 0.239 million in the first quarter 2014), placing the
number of SVoD subscribers at 6.2 million in the first quarter 2015.
BARB estimates in its “BARB Viewing Report May 2015” that around 14.1% of UK
homes subscribe to Netflix in 2014, 3.7% to Amazon Prime Instant Video and
1.7% to Sky’s Now TV at the end of the 4th quarter 2014. Statista in its “The Euro-
pean video streaming challenge” furthermore estimates that 80% of the UK SVoD
subscribers subscribe to Netflix, which amounts to 6.1 million subscribers. In light
of these figures, Netflix emerges as the leading player on the UK market, while the
two main competitors are kept at distance.
The rising importance of SVoD services can also be noted in the share of con-
sumer revenues for SVoD services on total consumer expenses for on-demand
audiovisual services. The share of SVoD was only 8.9% in 2010 of the EUR 298.8
UK’s population spent on on-demand audiovisual services; this share jumped to
42.2% in 2014, underlying the quick adoption by consumers and the importance
for the subscription-based business model when it comes to on-demand audiovis-
ual services. The access to audiovisual content and back catalogue of films these
services provide to subscribers is valued and the access to back catalogues of
films is even the most popular reason according to OFCOM/BARB for using SVoD
services for UK consumers.
Digital media streaming services, such as Netflix, Sky Now TV or for music Spotify
and Deezer, which provide access to content (as opposed to ownership of content
as for physical media) are valued by their subscribers who are in search of instant
35You can also read