ENERGY SERVICES 2020 MARKET INTELLIGENCE REPORT - GREENCAPE

 
CONTINUE READING
ENERGY SERVICES 2020 MARKET INTELLIGENCE REPORT - GREENCAPE
Energy Services

  2020
  Market Intelligence Report

Energy Services: Market Intelligence Report 2020   i
ENERGY SERVICES 2020 MARKET INTELLIGENCE REPORT - GREENCAPE
GreenCape
                                                        GreenCape is a non-profit organisation that works at the interface of business,
                                                        government, and academia to identify and remove barriers to economically
                                                        viable green economy infrastructure solutions. Working in developing countries,
                                                        GreenCape catalyses the replication and large-scale uptake of these solutions
                                                        to enable each country and its citizens to prosper.

                                                        Acknowledgements
                                                        We thank Reshmi Muringathuparambil (lead author), Jack Radmore, Bruce Raw,
                                                        Mandisa Mkhize, Yaseen Salie, and Seraj Chilwan for the time and effort that
                                                        they have put into compiling this market intelligence report.

                                                        Disclaimer
                                                        While every attempt has been made to ensure that the information published in
                                                        this report is accurate, no responsibility is accepted for any loss or damage to
                                                        any person or entity relying on any of the information contained in this report.

                                                        Copyright © GreenCape 2020

                                                        This document may be downloaded at no charge from www.greencape.co.za.
                                                        All rights reserved.

                                                        Subscribe to receive e-mail alerts or GreenCape news, events, and publications
                                                        by registering as a member on our website: www.greencape.co.za

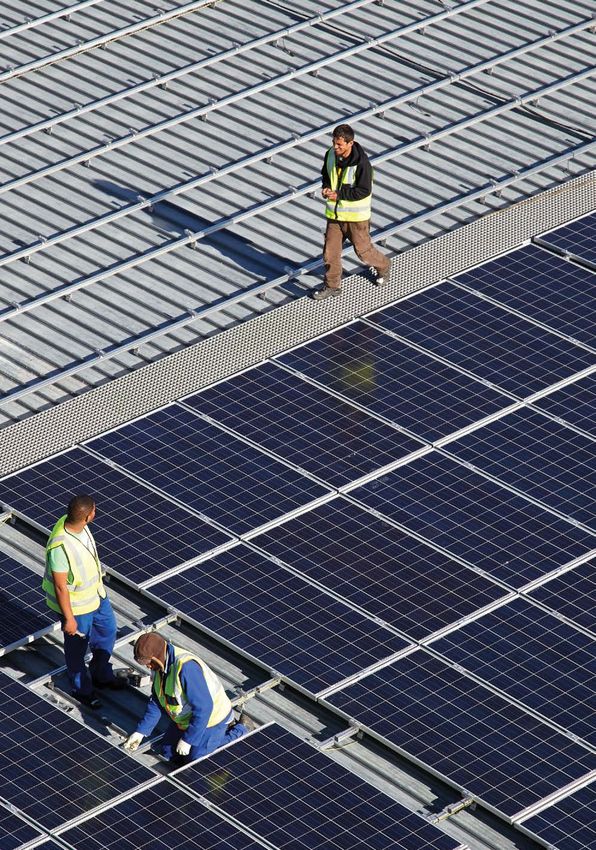
                                                        Cover image courtesy of G3 Energy

                                                        18 Roeland Street, Cape Town, 8001, South Africa

                                                        Editorial and review:   Cilnette Pienaar, Jack Radmore. Lauren Basson
                                                        		                      and Nicholas Fordyce
                                                        Images: 		              City of Cape Town, GreenCape, G3 Energy, New Southern
                                                        		                      Energy and Nicholas Fordyce
                                                        Layout and design: Tamlin Lockhart Art Direction

ii   Energy Services: Market Intelligence Report 2020   Energy Services: Market Intelligence Report 2020                                   iii
ENERGY SERVICES 2020 MARKET INTELLIGENCE REPORT - GREENCAPE
Contents                                                                                                 List of figures
Executive summary                                                                                         1    Figure 1:
What’s new?		                                                                                             3    Energy Services interlinked market segments                                           7
1. Introduction and purpose                                                                               5    Figure 2:
2. Sector overview                                                                                        7    Energy Services sector overview                                                       8
   2.1. Market context                                                                                    7    Figure 3:
   2.2. Energy Services market drivers                                                                    8    Average Eskom tariff versus inflation (CPI) projected to 2022                         9
		      2.2.1. Rising electricity costs                                                                   8    Figure 4:
		      2.2.2. Falling costs of renewable energy technologies                                             9    International levelised cost of electricity (LCOE) per renewable energy technology
		      2.2.3. Supportive energy policies and regulations by local and national government               11    and Eskom average tariff trajectory 2010 – 2018 (Rand/kWh)                           10
		      2.2.4. Innovative finance facilitating the right type of finance into the sector                 21    Figure 5:
   2.3. Key players                                                                                     26     Uptake of SSEG processes in municipalities                                           14
   2.4. Energy Services market size                                                                     28     Figure 6:
		      2.4.1. Small-scale embedded generation – rooftop solar photovoltaic (PV) market size            28     PACE financing mechanism                                                             22
		      2.4.2. Energy storage market size                                                               29     Figure 7:
		      2.4.3. Energy efficiency market size                                                            30     ES market value chain                                                                26
3. Policy, legislation and governance                                                                   33     Figure 8:
   3.1. Governance                                                                                      33     Distribution of solar PV installations across end-user segments in South Africa      29
		      3.1.1. National government                                                                      33     Figure 9:
		      3.1.2. Local government                                                                         33     ESCos market for energy efficiency in South Africa                                   30
		      3.1.3. Industry bodies                                                                          33     Figure 10:
   3.2. Legislation and regulation                                                                      33     2017 energy consumption in South Africa (TWh)                                        31
   3.3. Policy and white papers                                                                         35     Figure 11:
4. Emerging opportunities, drivers and barriers                                                         39     Policy-adjusted IRP 2019 allocations                                                 37
   4.1. Small-scale embedded generation                                                                  41    Figure 12:
		      4.1.1. Rooftop PV system bundling with standardised contracting models                           41    Eight services are applicable in the South African energy storage context            44
		      4.1.2. Solar PV for energy resellers                                                            42     Figure 13:
		      4.1.3. Operations and maintenance only contracts                                                43     Behind-the-meter energy storage cost trajectory per technology 2014-24               46
   4.2. Energy storage                                                                                  44     Figure 14:
		      4.2.1. Customer services                                                                        46     Number of energy efficiency projects by sector in South Africa                       48
		      4.2.2. Distribution/ancillary services                                                          47     Figure 15:
		      4.2.3. Utility services                                                                         47     Average capital cost of energy efficiency projects in South Africa                   48
   4.3. Energy efficiency                                                                               48     Figure 16:
		      4.3.1. ESCO Specialisation – modernisation of buildings for energy efficiency                   49     GreenCape’s focus areas                                                              58
5. Funding and incentives                                                                                51
   5.1. General funding opportunities                                                                    51
		      5.1.1. Green Finance Database                                                                    51
		      5.1.2. Government funding and incentives database                                                51
		      5.1.3. FinFind database                                                                          51
		      5.1.4. AlliedCrowds database                                                                     51
6. The Western Cape: Africa’s growing greentech hub                                                     53
7. GreenCape’s support to businesses and investors                                                      57
8. References                                                                                           61

iv                                                          Energy Services: Market Intelligence Report 2020   Energy Services: Market Intelligence Report 2020                                      v
ENERGY SERVICES 2020 MARKET INTELLIGENCE REPORT - GREENCAPE
List of tables                                                                                   List of abbreviations
                                                                                                                             and acronyms
Table 1:                                                                                                       AEEE		        Alliance for an Energy Efficient Economy
South African solar PV price                                                                             10    BEE		         Bureau of Energy Efficiency
Table 2:                                                                                                       BTM		         Behind the meter
Increasing off-take agreement options – electricity wheeling and trading                                 12    Capex		       Capital expenditure
Table 3:                                                                                                       CO2e		        Carbon Dioxide equivalent
Provincial breakdown of SSEG uptake                                                                      15    CCT		         City of Cape Town
Table 4:                                                                                                       COTS		        Commercial Off-the-shelf
List of municipalities allowing SSEG to connect to the grid                                              16    C&I		         Commercial and industrial
Table 5:                                                                                                       CMVP		        Certified measurement and verification personnel
Key objectives of the Eskom unbundling                                                                   17    CPI		         Consumer price index
Table 6:                                                                                                       CSP		         Concentrated solar power
Key responsibilities of the new Transmissions Entity (Eskom Holdings)                                    18    DFI		         Development Finance Institution
Table 7:                                                                                                       DoE		         Department of Energy (National)
Key responsibilities of the new Generation Entity (Eskom Holdings)                                       18    DMRE		        Department of Mineral Resources and Energy (National)
Table 8:                                                                                                       DPE		         Department of Public Enterprises
The impact of the Eskom unbundling decision on the renewable energy industry                             21    dti			        Department of Trade and Industry
Table 9:                                                                                                       EE			         Energy efficiency
South African commercial banks on solar PV for C&I                                                       24    EEMS		        Energy Efficient Monitoring System
Table 10:                                                                                                      EG			         Embedded generation
Roles of key players in the ES value chain                                                               27    EPC		         Engineering Procurement Construction
Table 11:                                                                                                      EPCM		        Engineering Procurement Construction Management
Total energy savings opportunities and capital leveraged for small and large businesses                        ERA		         Electricity Regulation Act
identified by the PSEE programme                                                                        30     ES			         Energy services
Table 12:                                                                                                      ESC		         Energy supply contracting
Emerging energy services opportunities                                                                  39     ESt		         Energy storage
Table 13:                                                                                                      ESCo		        Energy services company
Barriers and drivers of the rooftop PV system bundling opportunity                                       41    GW		          Gigawatt
Table 14:                                                                                                      GWh		         Gigawatt-hours
Barriers and drivers of the solar PV for energy resellers opportunity                                   43     HVAC		        Heating Ventilation and Cooling
Table 15:                                                                                                      IEA		         International Energy Agency
Barriers and drivers of the operations and maintenance-only opportunity                                 44     IEP		         Integrated Energy Plan
Table 16:                                                                                                      IFC		         International Finance Corporation
Barriers and drivers of the energy storage opportunity                                                  48     IPP		         Independent Power Producer
Table 17:                                                                                                      IRENA		       International Renewable Energy Agency
Barriers and drivers of the ESCO Specialisation opportunity                                             49     IRP		         Integrated Resource Plan
                                                                                                               kW		          kilowatt
                                                                                                               kWh		         kilowatt-hours
                                                                                                               kWp		         kilowatt-peak
                                                                                                               LCOE		        Levelised cost of electricity
                                                                                                               MIR		         Market Intelligence Report
                                                                                                               Mt			         Megatonnes
                                                                                                               MW		          Megawatt
                                                                                                               MWh		         Megawatt hours
                                                                                                               MWp		         Megawatt peak
                                                                                                               MYPD		        Multi-year price determination
                                                                                                               NBI		         National Business Initiative
                                                                                                               NCPC-SA       National Cleaner Production Centre South Africa
                                                                                                               NEES		        National Energy Efficiency Strategy
                                                                                                               NERSA		       National Energy Regulator of South Africa

vi                                                          Energy Services: Market Intelligence Report 2020   Energy Services: Market Intelligence Report 2020                      vii
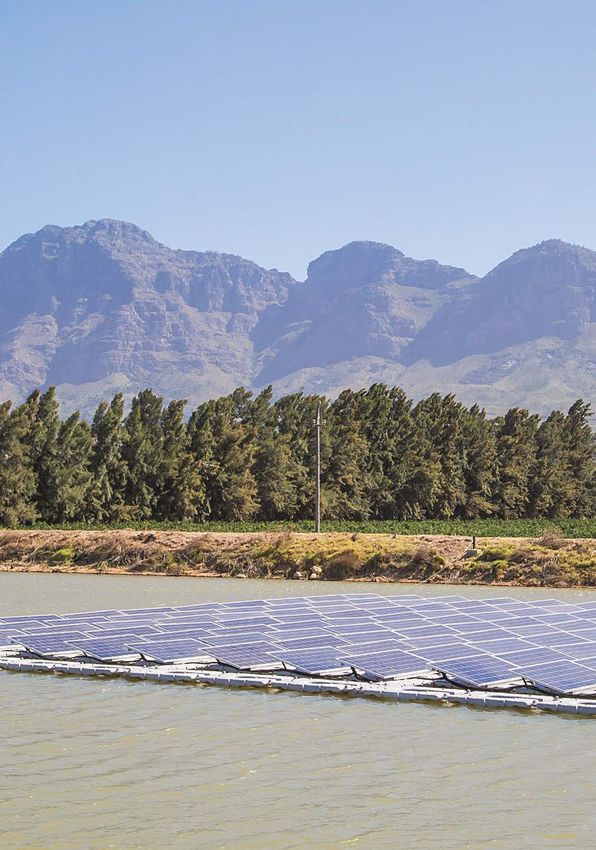
ENERGY SERVICES 2020 MARKET INTELLIGENCE REPORT - GREENCAPE
Executive summary
                                                                                                               The term ‘energy services’ is used to describe three interrelated energy
                                                                                                             market segments in the South African energy space, namely (1) small-scale
OEM		        Original equipment manufacturer                                                              embedded generation; (2) energy storage; and (3) energy efficiency. These market
PACE		       Property Assessed Clean Energy                                                                 segments are increasingly bolstered by offerings in the energy finance sector,
PAYS®		      Pay As You Save®                                                                                            which present opportunities to financial investors.
PPA		        Power purchase agreement
PQRS		       Power quality and renewable services
PSEE		       Private sector energy efficiency
PV			        Photovoltaic                                                                                 There are four main factors driving growth in the      ■   Solar PV for energy resellers. Property
RE			        Renewable energy                                                                             energy services market:                                    development owners (residential estates or
REIPPPP      Renewable Energy Independent Power Producers Procurement Programme                           The above-inflation electricity price rises;               shopping malls, for example) can install solar
SALGA		      South African Local Government Association                                                   decreasing technology costs; supportive policies,          PV on their premises. They can benefit from
SANEDI       South African National Energy Development Institute                                          regulations and tariffs; and innovative finance            bulk electricity discounted from municipalities,
SAPVIA       South African Photovoltaic Industry Association                                              options have all played an important role in               and sell it to their tenants at the retail rate
SAWEA        South African Wind Energy Association                                                        driving the growth of the energy services market.          instead of the potentially less preferential
SME		        Small- and medium-sized enterprise                                                                                                                      individual unit tariffs.
SSEG		       Small-scale embedded generation                                                              The South African Energy Services market is well       ■   Operations and maintenance-only contracts.
StatsSA      Statistics South Africa                                                                      established and growing:                                   This opportunity is two-fold. It serves to
TWh		        TerraWatt-hour                                                                               The national embedded generation market for                create entrance to market for foreign
                                                                                                          installations, operation and maintenance of                engineering, procurement and construction
                                                                                                          rooftop solar PV has grown in the last two years.          companies (EPCs) or investors; and invites
                                                                                                          It is expected that the total annual available             smaller EPCs and energy services companies
                                                                                                          market could grow to a saturation point of ~500            (ESCos) to specialise and take over contracts

Exchange rate used                                                                                        MWp installed per year on an ongoing basis. This
                                                                                                          market could reach a total of 7.5 GW of installed
                                                                                                          capacity by 2035 – a total available market of
                                                                                                                                                                     at renewal periods.

                                                                                                                                                                 Within the energy storage market, there is an
1 US Dollar = R14.38 (December 2018)                                                                      R75 billion. The installation of an additional 500     emerging opportunity for investors:
                                                                                                          MWp in one year translates to the potential            ■ Behind-the-meter battery storage. There are

                                                                                                          creation of ~1 250 jobs. With increasing demand in       eight storage applications most likely to gain
                                                                                                          embedded generation, the SA energy storage               traction in South Africa before 2035.
                                                                                                          market is also expected to grow, and to be valued        Applications for solar PV self-consumption
                                                                                                          at ~R5 billion by 2035. It is important to note that     and backup power represent the behind-the-
                                                                                                          in the early stages of this market, the best             meter opportunities for high-end customers.
                                                                                                          business case is in larger scale applications such       Increased resource adequacy, grid
                                                                                                          as grid management and resource adequacy                 management (voltage and frequency), and
                                                                                                          applications. It is estimated that this market will      capital expense deferral are some of the
                                                                                                          reach R15 to 30 billion by 2030. The energy              opportunities for distribution utilities.
                                                                                                          storage market is expected to become the
                                                                                                          keystone of the future energy services market.         Within the energy efficiency market, there is an
                                                                                                          Energy efficiency presents an opportunity to           emerging opportunity for investors:
                                                                                                          investors and businesses. The estimated market         ■ Energy efficiency as a service. Growth and

                                                                                                          by 2035 is R21 billion.                                  development of the ESCO market.
                                                                                                                                                                 ■ Modernisation. The retrofitting of South

                                                                                                          Within embedded generation, there are three              Africa’s large stock of existing buildings is
                                                                                                          emerging opportunities for investors:                    expected to become the largest sector within
                                                                                                          ■ Rooftop PV system bundling with                        the green building industry by 2020. This
                                                                                                            standardised contracting models. This                  opportunity is for ESCos specialising in
                                                                                                            opportunity involves aggregating smaller               energy-efficiency measures like lighting,
                                                                                                            rooftop solar PV projects to reach a scale             HVAC, and smart metering.
                                                                                                            where they become attractive to larger
                                                                                                            investors by reducing transaction costs and
                                                                                                            spreading the risk across the new portfolio.

viii                                                   Energy Services: Market Intelligence Report 2020   Energy Services: Market Intelligence Report 2020                                                          1
ENERGY SERVICES 2020 MARKET INTELLIGENCE REPORT - GREENCAPE
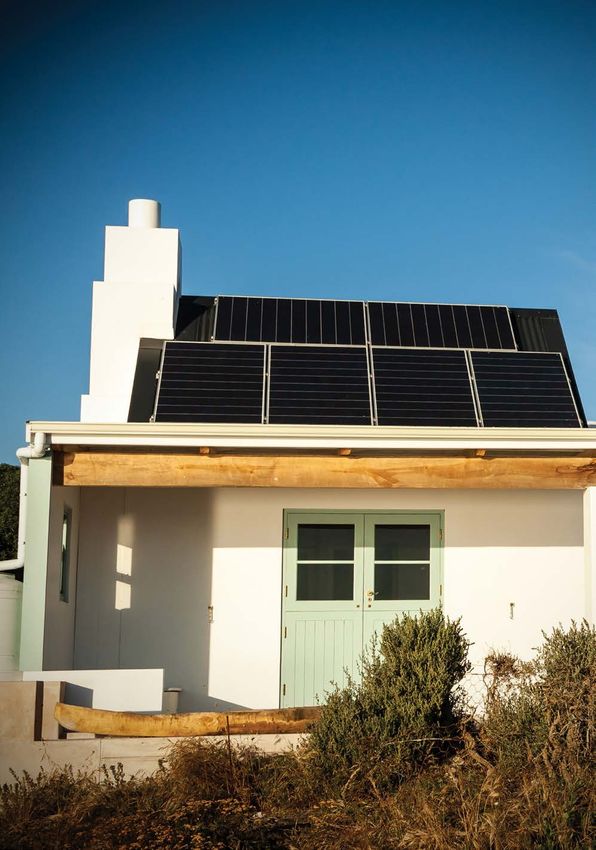
Summary of market opportunities

                                                          Requirement             Expected
    Opportunity              Key drivers                                                                Macro environment
                                                            & barrier            timeframe

    Rooftop PV        ■   Economies of scale        ■   Standardised PPAs        10 years      ■   The lack of available, affordable
    system                helps                     ■   Differential between                       finance for smaller projects
    bundling with     ■   Shift in average and          feed-in and                            ■   Smaller clients are not attractive
    standardised          minimum size of               self-consumed energy                       to larger EPCs, so they sometimes
    PPAs                  projects tendered for     ■   Regulatory certainty                       ask them to wait until they have a
                          across market                 (small-scale                               few similarly sized clients
                      ■   ESCos can attract             embedded                               ■   Smaller rooftop PV projects are

                                                                                                                                                                              What’s new?
                          investors                     generation)                                bundled together to reach a scale
                      ■   Property assessed                                                        where they become attractive to
                          clean energy (PACE) /                                                    larger investors who, up until now,
                          power purchase                                                           have only been interested in
                          agreements (PPAs):                                                       utility-scale RE projects
                          better pricing

    PV for energy     ■   Electricity tariffs       ■   Regulatory certainty     5-10 years    ■   1-2 property tenders per month                 This MIR provides an update on the opportunities, barriers, and regulations
    resellers         ■   Energy security           ■   Standardised PPAs                          nationally in the last year – green         discussed in the 2019 Energy Services MIR. It also outlines emerging opportunities
                      ■   PACE/PPA                  ■   Home-owners                                building industry is on the rise
                      ■   Wheeling                      association approval                   ■   Eskom and municipal electricity                 and barriers in small-scale embedded generation and energy efficiency.
                      ■   Carbon footprint                                                         tariffs on the rise
                      ■   Continuous revenue
                          stream

    Operations            Renewal of O&M                Option in contracts to   1-5 years         Shoddy workmanship due to
                      ■                             ■                                          ■
                                                                                                                                           What happened in 2019                                                  ■   Gwede Mantashe was appointed as the
    and                   contracts after 2-5           change O&M provider                        cut-throat competition resulted in      ■ The Integrated Resource Plan (IRP) 20191 was                             Minister for Mineral Resources and Energy in
    maintenance           years (project            ■   Only for cash or                           poorly installed systems
    (O&M): taking         dependent)                    bank-financed                          ■   As these clients start exploring
                                                                                                                                             gazetted in October 2019. The updated                                    May 2019.
    over contracts    ■   Specialisation of EPCs        projects (not PPA)                         better EPCs for new projects, they        document allocates 500 MW per annum for
    or O&M only       ■   Enables foreign project                                                  sometimes request takeovers of            distributed generation for own use of between                        ■   In October 2019, the Department of Public
                          developers and                                                           older projects for O&M component          1 MW and 10 MW, starting in 2020.                                        Enterprises (DPE) announced the official plan
                          investors to have a                                                  ■   ESCos/EPCs are starting to
                                                                                                                                                                                                                      for the unbundling of Eskom into three
                          footprint in South                                                       specialise, focusing on niche
                          Africa without a                                                         services as part of the wider
                                                                                                                                           ■    In February 2019, Parliament passed the                               separate entities – generation, transmission,
                          dedicated labour force                                                   value chain                                  long-awaited Carbon Tax Bill, with the first                          and distribution – by 2021.
                                                                                               ■   Entrance to market: foreign EPCs             phase of the programme to be implemented
                                                                                                   trying to get footprint in SA but
                                                                                                                                                from 2019 to 2022. The tax rate will be set at                    ■   Rolling blackouts (load shedding) continue as
                                                                                                   without a local office can partner
                                                                                                   post installation with local EPCs
                                                                                                                                                R120 per tonne of carbon dioxide equivalent                           Eskom is unable to match current demand
                                                                                                   to continue doing O&M in the                 (CO2e) produced, and the total tax free                               with available supply.
                                                                                                   foreign EPC’s name, and carry                allowances can be up to 95%.
                                                                                                   their brand; at the same time                                                                                  This MIR updates the 2019 report and highlights
                                                                                                   creating local employment
                                                                                                                                           ■    Schedule 2 of the Electricity Regulation Act 4                    the following:
    Battery           ■   Load-shedding             ■   Battery pricing still    15 years      ■   Load-shedding and security                   of 2006 was amended on 10 November 2017.                          ■ updates on the state of the small-scale
    storage (BTM)     ■   Backup power demand           high for the need                          of supply are major concerns.                It exempts certain power generation facilities                       embedded generation in South Africa;
    – 1.5 GWh             Battery pricing               Battery specific PPA /                     Battery storage prices are
                      ■                             ■                                          ■
                                                                                                                                                of less than 1 MW in size from having a                           ■ updates on the state of energy efficiency in
                      ■   Increase in renewable         financing / lease                          dropping fast.
                                                                                                                                                generation licence. If an installation meets                         South Africa;
                          energy (RE)                                                          ■   Electric mobility is gaining
                      ■   Electric mobility                                                        momentum                                     the criteria as stipulated in the amended                         ■ the opportunities for players within the Energy
                                                                                                                                                schedule, the installation can be registered                         Services market;
    Energy                                                                       1-5 years
                      ■   Legislative and           ■   Smaller project sizes                  ■   New buildings only make up ~5%               with NERSA, instead of requiring a licence.                       ■ Energy Services market drivers and barriers;
    efficiency as a       regulatory changes        ■   Economic downturn                          of total buildings in South Africa
    service &
                                                                                                                                                It is expected that the distribution operators,                   ■ the Eskom utility unbundling plan and its
                      ■   Rising energy prices                                                     Retrofitting of existing buildings is
    modernisation     ■   Falling cost of                                                          expected to become the largest
                                                                                                                                                i.e. municipalities or Eskom, would be in                            impact on the energy services market; and
                          energy-efficient                                                         sector within the green building             charge of registering the installations and                       ■ the influence of the 2019 IRP on future
                          technologies                                                             industry by 2020                             report to NERSA.                                                     opportunities.

                                                                                                                                           1
                                                                                                                                            The Integrated Resource Plan is a national government document that aims to provide a clear indication of South Africa’s electricity
                                                                                                                                           demand, how this demand will be supplied, and at what cost.

2                                                                                Energy Services: Market Intelligence Report 2020          Energy Services: Market Intelligence Report 2020                                                                                        3
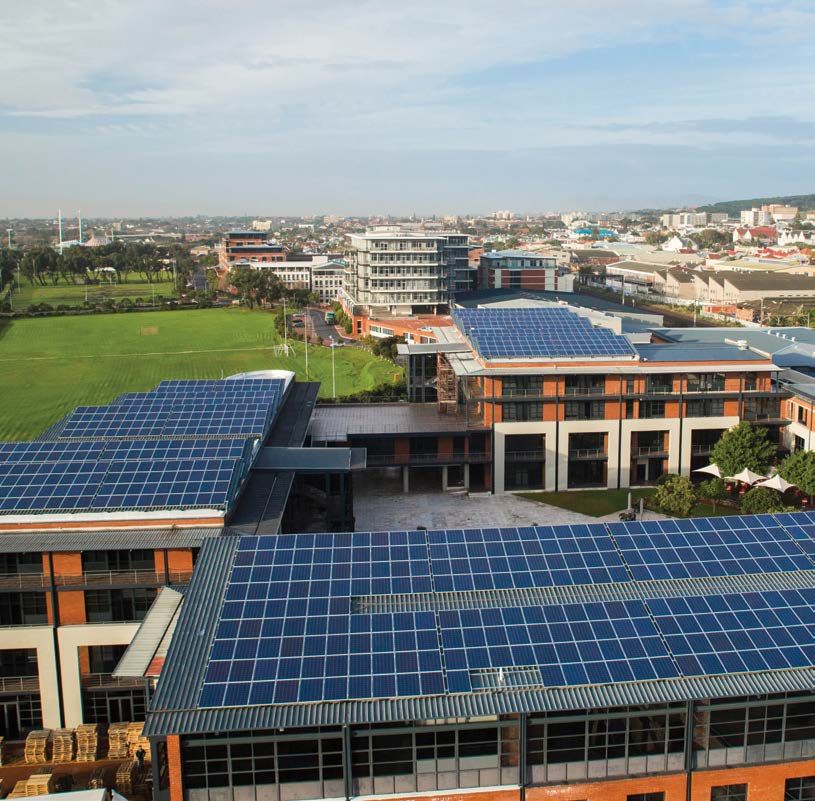
ENERGY SERVICES 2020 MARKET INTELLIGENCE REPORT - GREENCAPE
1
                                                       Introduction and purpose
                                                                  In response to changing demands, energy service providers are
                                                               broadening their market offerings. The South African energy services
                                                              market holds opportunities for equipment suppliers, project developers,
                                                                            technical advisors, and financial investors.

                                                       The need to improve energy efficiency in
                                                       buildings due to carbon and energy security
                                                       goals, and to reduce energy costs, has created a           The value of the global Energy
                                                       demand for energy efficiency and energy service            Services market grew by 8% to USD
                                                       providers. Over the years the concept of energy            33.17 billion in 2019, up from USD 28.6
                                                       services and energy services companies (ESCos)             billion in 2017. Despite differences
                                                       has evolved and matured in several markets
                                                                                                                  across countries and regions,
                                                       around the world, including South Africa.
                                                                                                                  projects are generating energy and
                                                       This market intelligence report provides potential         financial savings upwards of 25%. The
                                                       investors in the embedded generation, energy               global energy services market has
                                                       storage, and energy efficiency markets with a              shown the ability to impact projects
                                                       greater understanding of market opportunities in
                                                                                                                  in buildings, industry, and transport
                                                       South Africa, taking into account the size of the
                                                       opportunities, the level of risk involved, and
                                                                                                                  in both the private and public sectors
                                                       current barriers.                                          around the world (AEEE & BEE 2019).

                                                       The report is compiled for foreign direct and local
                                                       investors (persons or organisations) that are
                                                       looking to invest directly in the South African       ■   This is followed by an overview and update
                                                       green economy through project development,                of policies, legislation, and governance
                                                       asset management, equity, debt, equipment                 (Section 3) that guide and affect the energy
                                                       manufacture, or support services.                         services (ES) market.
                                                                                                             ■   In Section 4, emerging opportunities and their
                                                       In what follows:                                          related drivers and barriers are highlighted,
                                                                                                                 followed by sections that outline various
                                                       ■The sector overview (Section 2) provides a               finance and investment incentives (Section 5),
                                                        national and provincial economic overview of             present the case for the Western Cape as a
                                                        the energy services market, including:                   potential greentech hub for Africa (Section 6),
                                                       		■ the market context (small-scale                       and explain GreenCape’s work within the
                                                        		 embedded generation, energy storage,                  green economy (Section 7).
                                                        		 and energy efficiency);
                                                       		■ four major market drivers in the South            For questions, queries, or to access GreenCape’s
                                                        		 African energy services market;                   services, contact the energy services team at:
                                                       		■ market sizing (small-scale embedded               energy@greencape.co.za.
                                                        		 generation, energy storage, and
                                                        		 energy efficiency); and
                                                       		■ key players in the South African energy

                                                        		 services market.

                         © New Southern Energy

4   Energy Services: Market Intelligence Report 2020   Energy Services: Market Intelligence Report 2020                                                         5
ENERGY SERVICES 2020 MARKET INTELLIGENCE REPORT - GREENCAPE
2
                                                                                                          Sector overview
                                                                                                 Rising electricity prices, dropping technology costs, supportive
                                                                                              energy policies and incentives are prompting consumers to explore
                                                                                              alternative energy options, driving the growth of the energy services
                                                                                                 (ES) market in South Africa and creating a thriving value chain.

                                                       This section provides an overview of the national                                         African energy space, namely small-scale
                                                       and provincial (Western Cape) energy services                                             embedded generation, which is currently
                                                       (ES) context, covering market developments, key                                           dominated by rooftop solar photovoltaic (PV)
                                                       industry players, and the size of the market. The                                         systems, energy storage, and energy efficiency.
                                                       term ‘energy services’ is used to describe three                                          Figure 1 below breaks down the three interlinked
                                                       interlinked energy market segments in the South                                           energy market segments.

                                                                                          ■   Generation                              ■   Energy storage                                  ■   Implementation of
                                                                                              facilities of less                          systems are                                         behaviour change

                                                        Small-scale embedded generation
                                                                                              than 1MW.                                   technologies in                                     or technology to
                                                                                          ■   Located at 		                               which electric                                      reduce energy
                                                                                              residential,                                energy is loaded                                    consumption,

                                                                                                                                                                      Energy efficiency
                                                                                              commercial or                               and, when                                           while producing

                                                                                                                     Energy storage
                                                                                              industrial sites,                           needed, discharged                                  the same or
                                                                                              where electricity is                        into the network.                                   greater outputs.
                                                                                              generally also
                                                                                              consumed.
                                                                                          ■   Installed on the
                                                                                              customer’s side
                                                                                              of the electricity
                                                                                              meter.

                                                       Figure 1: Energy Services interlinked market segments

                                                       2.1. Market context
                                                       The South African electricity mix is primarily                                            The South African electricity market is currently
                                                       made up of coal assets, because of limited                                                managed on a single operator model by the
                                                       technology options in the past, and South Africa’s                                        state-owned entity, Eskom, which is responsible
                                                       abundant supply of coal. According to the                                                 for generation and transmission, and which also
                                                       national electricity utility, Eskom, South Africa                                         controls a minority share of the distribution
                                                       produces approximately 224 million tonnes of                                              market. This single operator model is designed to
                                                       coal annually, making it the fifth largest country-                                       support developing electricity markets in need of
                                                       level producer of coal in the world. In 2020 South                                        structured long-term infrastructure investments
                                                       Africa’s nominal generation capacity is                                                   (with 10 – 15-year construction timelines), and
                                                       dominated by coal-fired generation stations with                                          diverse demand balancing of centralised
                                                       a net output of 38.2 GW. This represents more                                             generation facilities.
                                                       than 90% of the country’s total installed capacity
                         © New Southern Energy         of over 45 GW (Department of Energy 2018).

6   Energy Services: Market Intelligence Report 2020   Energy Services: Market Intelligence Report 2020                                                                                                           7
ENERGY SERVICES 2020 MARKET INTELLIGENCE REPORT - GREENCAPE
South Africa’s dependence on this single                electricity supply has also led to increased                                    800
operator model has decreased over the past 10           demand efficiencies (energy efficiency).
years with the introduction of new technologies,
                                                                                                                                        700
which are cheaper, capable of being                     The sections that follow detail the market context
decentralised, and more low-carbon. The growth          (small-scale embedded generation, energy
of this decentralised market is evidenced by            storage, and energy efficiency), four major market                              600

the evolution of the small-scale embedded               drivers in the South African energy services

                                                                                                                     Normalised index
generation and energy storage markets.                  market, and key players in the South African

                                                                                                                       (2003 = 100)
                                                                                                                                        500
Continual increases in the cost of traditional          energy services market, as shown in Figure 2 below.

                                                                                                                                        400

                                                                Energy
                                                               services                                                                 300

                                                                                                                                        200

                                 Small-scale embedded                                          Energy                                   100
                                   generation (SSEG)                                          efficiency

                                                                                                                                          03

                                                                                                                                                 04

                                                                                                                                                        05

                                                                                                                                                               06

                                                                                                                                                                      07

                                                                                                                                                                             08

                                                                                                                                                                                    09

                                                                                                                                                                                           10

                                                                                                                                                                                                  11

                                                                                                                                                                                                         12

                                                                                                                                                                                                                13

                                                                                                                                                                                                                       14

                                                                                                                                                                                                                              15

                                                                                                                                                                                                                                     16

                                                                                                                                                                                                                                            17

                                                                                                                                                                                                                                                   18

                                                                                                                                                                                                                                                          19

                                                                                                                                                                                                                                                                 20

                                                                                                                                                                                                                                                                        21

                                                                                                                                                                                                                                                                               22
                                                                                                                                                                                                20

                                                                                                                                                                                                                                          20
                                                                                                                                                                                                       20

                                                                                                                                                                                                                                                                      20
                                                                                                                                                                                                                            20

                                                                                                                                                                                                                                                 20
                                                                                                                                                                                                              20

                                                                                                                                                                                                                                   20

                                                                                                                                                                                                                                                        20
                                                                                                                                                                                                                     20
                                                                                                                                                                                         20

                                                                                                                                                                                                                                                                             20
                                                                                                                                                                    20

                                                                                                                                                                                                                                                               20
                                                                                                                                                      20

                                                                                                                                                                           20
                                                                                                                                        20

                                                                                                                                                             20

                                                                                                                                                                                  20
                                                                                                                                               20
                                                                                                                                                                                                              Year

                         Rooftop solar PV           Energy storage                                                                                    Inflation (CPI)                      Eskom tarriff

                                                                                             Section 4.3.1.       Figure 3: Average Eskom tariff versus inflation (CPI) projected to 2022
        Section 4.1.1.                                              Section 4.2.            Modernisation                                                                                                        Sources: Statistics South Africa (StatsSA) and Eskom (2019)
        Rooftop PV                                               Behind-the-meter            of buildings
                                      Section 4.1.2.
      system bundling                                             battery storage
                                       Solar PV for
                                     energy resellers
                                                                                                                  The National Energy Regulator of South Africa                                            2.2.2. Falling costs of renewable energy
                                                                                                                  (NERSA) approved Eskom tariff increases of:                                              technologies
                           Section 2.2. and Section 4.1.3.                                                        ■ 9.41% in 2020                                                                          Renewable energy technology prices have been
                Drivers: Electricity price, renewable energy price,                                               ■ 8.1% in 2021                                                                           dropping steadily since 2010. Figure 4 shows the
               supportive regulations (wheeling; SSEG) and tariffs                                                ■ 5.2% in 2022                                                                           average international levelised cost of electricity
                              and innovative finance.                                                                                                                                                      (LCOE) per renewable energy technology, and the
                                                                                                                  This is in addition to the 4.41% tariff increase                                         average Eskom tariff in 2010 and 2018. For
                                                                                                                  which was approved by NERSA in 2018 through                                              example, the global average price for solar PV in
                                               Section 2.2.4.                                                     Eskom’s Regulatory Clearing Account (RCA)                                                2018 was R1.22 kWh, down from R5.33 kWh in 2010
                                    Driver: Innovative energy finance                                             recovery for the 2015 to 2017 financial years. The                                       (IRENA 2019), a ~77% drop in eight years. The most
                                                                                                                  purpose of an RCA approval is to allow Eskom                                             significant decreases in average cost have been
                                                                                                                  to retrieve justifiable costs retrospectively by                                         in solar PV and wind technologies.
Figure 2: Energy Services sector overview                                                                         adding them to future years’ tariffs. The approved
                                                                                                                  increases are significantly less than the
                                                                                                                  applications by Eskom for yearly tariff increases
2.2. Energy Services                                    In turn, these developments, discussed in more            of 17.1%; 15.4% and 15.5% for the next three years.
market drivers                                          detail below, create significant opportunities for
Four major developments are transforming South          energy services investors and businesses, in              The average standard Eskom tariffs have risen
Africa’s energy market from a monopoly model to         particular equipment suppliers, project                   by almost 300% since 2007. Historical data from
a distributed generation model made up of               developers, technical advisors, installers, and           both Eskom (2019) and StatsSA (2019), shown in
multiple smaller generators, buyers, and sellers:       financial investors.                                      Figure 3, reveal that while inflation has almost
■ rising energy prices;                                                                                           doubled since 2009, Eskom prices have tripled
■ falling costs of renewable energy technologies        2.2.1. Rising electricity costs                           over the same period.
   such as rooftop solar PV;                            Rapidly rising Eskom electricity prices have
■ supportive energy policies and regulations by         created a sizeable demand for viable alternative
   local and national government; e.g.                  energy sources. Figure 3 compares Eskom price
		 ■ Integrated Resource Plan 2019                      increases to the more conservative increase in
		 ■ Eskom unbundling plan 2019-2021                    South Africa’s inflation rate (as reflected by the
■ innovative energy financing programmes                Consumer Price Index).
   and incentives.

8                                                              Energy Services: Market Intelligence Report 2020   Energy Services: Market Intelligence Report 2020                                                                                                                  9
ENERGY SERVICES 2020 MARKET INTELLIGENCE REPORT - GREENCAPE
2.2.3. Supportive energy policies and                                      Three major changes are taking place on the
                                                                                                                                                  regulations by local and national                                          local government level:
            5.5                                                                                                                                   government
                                                                       5.33
                                                                                                                                                  The regulatory environment has a direct impact                             1. Metropolitan municipalities around the
             5
                                                                                                                                                  on investment opportunities, market growth, and                               country, specifically City of Cape Town,
                                                                                                                                                  job creation. To lower demand on the national                                 Tshwane, City Power (Johannesburg) and
            4.5
                                                                                                                                                  grid, and to reduce carbon emissions, national                                Nelson Mandela Bay Municipality, are
             4
                                                                                                                                                  government has put in place several energy                                    challenging the ‘single-buyer’ model, which
                                                                                                                                                  policies and incentives to encourage energy                                   restricts the purchase and sale of electricity to
            3.5                                                                                                                                   efficiency interventions and alternative energy                               Eskom. These municipalities intend to
                                                                                                                                                  generation. Section 3 (legislation, regulation, and                           purchase electricity directly from independent
Rands/kWh

             3                                                                                                                                    policy) and Section 5 (funding opportunities and                              power producers (IPPs) and on-sell this
                                                                                                                                                  incentives) discuss these in more detail.                                     electricity to their customers3.
            2.5
                                                                                               2.29                                               Local government commitment to providing                                   2. Increasing off-take agreement options for
             2
                                                                                                                                                  policy certainty                                                              local embedded electricity generators.
                                                                                                      1.83
                                                                                                                                                  Regulatory developments as described in Section 3                             Electricity wheeling, as allowed by the DMRE
            1.5
                                                                                                                                                  facilitate the growing uptake of renewable energy                             and implemented by local municipalities, will
                                                                               1.22
              1                                                                                                                                   options, particularly in the  500 kWp                                    R 9 500 – R 13 000                         R 0.80 – R 1.10

 As these costs drop across a variety of energy services (ES) technologies, the financial case for
 investment into ES interventions improves.

                                                                                                                                                                                                                                                                             © GreenCape

                                                                                                                                                  3
                                                                                                                                                    There is currently a court case to determine if it is within a municipality’s mandate to undertake this role. Further analysis will be
                                                                                                                                                  included once a ruling has been made.
 2                                                                                                                                                4
       Exchange rate: 1 US Dollar = R14.38 (December 2018)                                                                                            One licence has been allocated to PowerX, but the process by which more licences can be allocated is yet to be finalised.

 10                                                                                   Energy Services: Market Intelligence Report 2020            Energy Services: Market Intelligence Report 2020                                                                                           11
5

Table 2: Increasing off-take agreement options – electricity wheeling and trading                                     3. Country-wide rollout of national small-scale                             installations on their electricity grids, having an
                                                                                                                         embedded generation rules, regulations, and                              application process for customers, and having a
                Electricity wheeling                                      Electricity trading                            tariffs to promote the safe and legal uptake of                          NERSA-approved tariff). By October 2018, ~41
                                                                                                                         SSEG for own use6.                                                       municipalities in South Africa have published
 The wheeling of energy is an exciting driver for the      The release of a licence allowing private sector
                                                                                                                                                                                                  SSEG regulations7, including all eight
 uptake of energy services, specifically SSEG, in          energy trading has opened the market to private
                                                                                                                      Table 3 represents the best level of information                            metropolitan municipalities. Twenty-five of these
 South Africa. Wheeling is the transportation of           sector power purchase agreements, and on-sales
                                                                                                                      obtained by the South African Local Government                              municipalities also have NERSA-approved SSEG
 electrical energy from a generator to a separate          to private consumers using the national and local
                                                                                                                      Association (SALGA) on the uptake of SSEG                                   tariffs for one or more customer groups. They
 electrical load, by making use of municipal or            distribution networks. There is currently only one
                                                                                                                      processes in municipalities by October 2018.                                represent approximately 15% of all the
 Eskom grid infrastructure and power purchase              company (PowerX) that has a confirmed national
                                                                                                                      Figure 7 shows the upward trend of municipalities                           municipalities that have electricity
 agreements (PPAs). The municipality/Eskom                 energy trading licence. The process by which
                                                                                                                      adopting SSEG processes (i.e. allowing                                      distribution licences8.
 operates in an administrative role to facilitate the      further licences will be granted is unclear at
 transaction between the generators of clean power,        this stage.
 and electricity users interested in buying electricity
 from renewable energy sources. Wheeling has               Much the same as wheeling, electricity trading is
 gained traction in City of Tshwane, Nelson Mandela        the transportation of electrical energy from a
 Bay Metropolitan Municipality and the City of Cape        generator to a separate electrical load, by making
 Town over the past year. It is expected that similar      use of municipal or Eskom grid infrastructure and
 frameworks will be adopted across the country             power purchase agreements (PPAs). The difference
 by 2025.                                                  is that a private sector electricity trader or third
                                                           party will purchase the electricity, pay the local
 The adoption of wheeling frameworks around the            municipality/Eskom to wheel it over their network,
 country provides SSEG investors with alternative          and sell it to a willing customer. The municipality/
 offtake agreements and improved potential                 Eskom operates in an administrative role to
 returns. It creates new business cases as the             facilitate the transactions, and takes a fee for
 opportunity sizing is determined by the                   this service.
 consumption profile of the off-take, and not the
 generation technology, as it is not limited to the        This represents both an opportunity for investors in
 user’s site, or roof space in the case of PV.             the SSEG market to increase their off-take
                                                           agreements and reduce their risk profile, and an
 It will present an opportunity for the following          opportunity for investors interested in investing in
 cases:                                                    other electricity trading entities.
 ■ medium-voltage C&I sector companies with large

    energy bills that warrant it;
 ■ buildings that currently are not able to install

    PV on their rooftop, such as:
    ■   new buildings lacking adequate structural/
        wind buffer;
    ■   buildings with asbestos roofs that cannot be
        tampered with, which currently make up a
        significant portion of older building stock; and
    ■   tenants who do not own the buildings and
        will struggle to have any structural
        changes approved.

 In addition to enabling renewable energy
 technologies, this business model would provide a
 platform for municipalities to engage and retain
 customers. Through offering an additional avenue
 to prosumers5, municipalities would propose a new                                                                                                                                                                                     © City of Cape Town
 service to electricity generators as well as
 consumers interested in procuring clean energy.
                                                                                                                      5
                                                                                                                          A prosumer is an entity or person who produces and consumes a product, in this case electricity.
 This represents both an opportunity for investors in                                                                 6
                                                                                                                          The generation of electricity on the load site where it will also be consumed.
 the SSEG market to increase their off-take                                                                           7
                                                                                                                       Municipalities publish these regulations on their individual websites to detail the application process for safe and legal installation of
 agreements and reduce their risk profile.                                                                            SSEG systems within the municipal electricity grid.
                                                                                                                      8
                                                                                                                        To see a list of municipalities that allow SSEG, please visit the SALGA website – Status of SSEG in SA: https://www.sseg.org.za/sta-
                                                                                                                      tus-of-small-scale-embedded-generation-sseg-in-south-african-municipalities/

12                                                                 Energy Services: Market Intelligence Report 2020   Energy Services: Market Intelligence Report 2020                                                                                              13
45
                                                                                                                                         41              Table 3 gives a provincial breakdown of municipalities that have SSEG processes.
                                40
                                                                                                                                                         Table 3: Provincial breakdown of SSEG uptake
                                                                                                       34
                                35
                                                                                                                                                                                                                                                 Number of
                                                                                                                                                                                          Number of
     Number of Municipalities

                                30                                                                                                                                                                                   Number of                 municipalities               Number of
                                                                                                                                         29                                               municipal
                                                                                                                                                                                                                   municipalities              with an official            municipalities
                                                                      25                                                                                        Province                  electricity
                                25                                                                                                                                                                                 allowing SSEG                    SSEG                    with SSEG
                                                                                                                                         25                                             distributors in
                                                                                                       21                                                                                                           installations               application                   tariffs
                                                                                                                                                                                         the province
                                20                                                                                                                                                                                                                 system
                                                                       17
                                                                                                       18                                                     Eastern Cape                       22                          4                           3                           2
                                15

                                           10
                                                                                                                                                                Free State                       17                           1                           1                          2
                                10                                     12
                                                                                                                                                                 Gauteng                          9                          4                           3                           2
                                           5
                                 5
                                                                                                                                                             KwaZulu-Natal                       25                           1                           1                           1
                                           3
                                0                                                                                                                                Limpopo                         16                          3                            1                           1
                                         Feb – 2016                Nov – 2016                      Oct – 2017                        Oct – 2018
                                                                                                                                                              Mpumalanga                         14                           2                           1                          0
                                     Allowing SSEG installations     With offcial application system            With SSEG tariffs
                                                                                                                                                             Northern Cape                       24                          3                            1                          0

Figure 5: Uptake of SSEG processes in municipalities                                                                                                           North West                        13                           1                           1                          0
                                                                                                                                    Source: SALGA 2018
                                                                                                                                                              Western Cape                       25                          22                          17                          17

                                                                                                                                                                  TOTAL                         165                          41                          29                          25

                                                                                                                                                             Percentages of
                                                                                                                                                                                                  –                         25%                         18%                         15%
                                                                                                                                                                licensees

                                                                                                                                                                 Under                            –                          –                           9                           6
                                                                                                                                                              development
                                                                                                                                                                                                                                                                                Source: SALGA 2018
                                                                                                                                                         9

                                                                                                                                                         Table 4, overleaf, gives a more detailed overview of the municipalities that allow SSEG installations
                                                                                                                                                         within their municipalities, either on a case-by-case basis or through an application process.
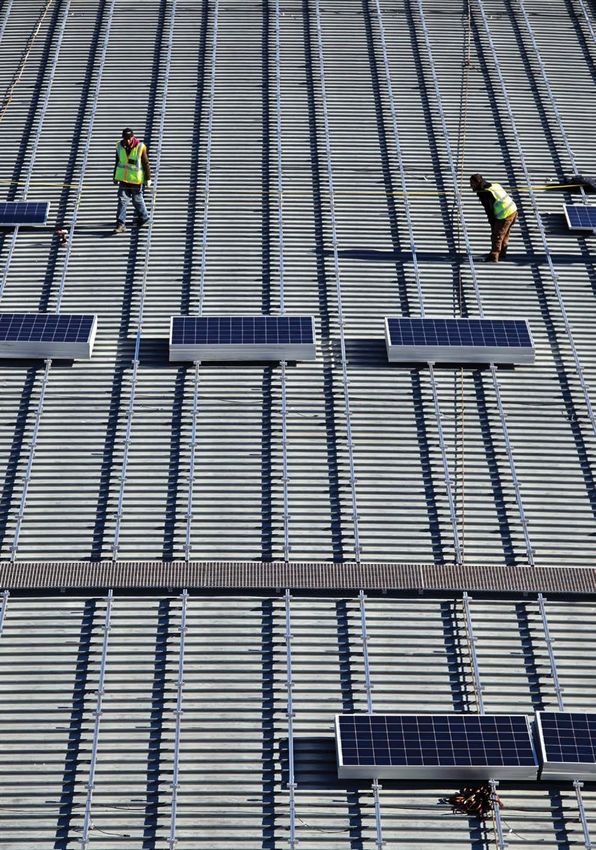
                                                                                                                                     © G3 Energy         9
                                                                                                                                                           The number of municipal electricity distributors in each province is an estimate by SALGA, based on the 165 distribution licences issued
                                                                                                                                                         to municipalities by NERSA and the municipal mergers that have occurred over time.

14                                                                                           Energy Services: Market Intelligence Report 2020            Energy Services: Market Intelligence Report 2020                                                                                         15
Table 4: List of municipalities allowing SSEG to connect to the grid                                                These changes at municipal level complement               Since 2010/11, there have been several draft
                                                                                                                    legislative updates on a national level, e.g. the         revisions of the IRP that have been distributed
 Province             Municipality                      Province                    Municipality                    gazetted Integrated Resource Plan 2019 and                for public comment. In 2018, the latest IRP was
                      Buffalo City Metropolitan                                     Beaufort West Local             future changes such as the unbundling of the              released for public comment. In October 2019
                      Municipality                                                  Municipality                    national utility, Eskom. Together these changes           the final IRP 2019 was gazetted with the aim to
                                                                                                                    herald a freer, more ‘liberalised’ electricity            provide policy certainty to the market. The
                                                                                    Bergrivier Municipality         market, in which all stakeholders are empowered           2019 IRP is detailed in Section 3.3.
                                                                                                                    in their energy choices.
                      Kouga Local Municipality                                      Breede Valley Local
 Eastern Cape                                                                                                                                                                 Unbundling the national electricity utility (Eskom)
                                                                                    Municipality
                                                                                                                    National Government - 2019 Integrated Resource            The South African government has decided to
                      Nelson Mandela Bay                                            Cape Agulhas Local              Plan (IRP 2019)                                           unbundle the national electricity utility (Eskom)
                      Municipality                                                  Municipality                    The Integrated Resource Plan is a national                into three subsidiaries, namely Eskom Generation
                                                                                                                    government document that aims to provide a                (generation entity), Eskom Transmission
                      Makana Local Municipality                                     City of Cape Town
                                                                                                                    clear indication of South Africa’s electricity            (transmission entity) and Eskom Distribution
                      Mangaung Metropolitan                                         Cederberg Municipality          demand and how this demand will be supplied,              (distribution entity). The aim of this new business
                      Municipality                                                                                  and at what cost.                                         model is to improve the power utility through
 Free State                                                                         Drakenstein                                                                               greater transparency and accountability, and to
                                                                                    Municipality                    In May 2011 the then Department of Energy (now            allow stakeholders a more efficient approach to
                      City of Johannesburg                                          George Local                    Department of Mineral Resources and Energy)               address generation, transmission and
                                                                                    Municipality                    released the Integrated Resource Plan 2010-2030           distribution challenges separately. The process of
                                                                                                                    (IRP 2010) in respect of South Africa’s forecast          unbundling will take place over several years
                      City of Tshwane                                               Hessequa Local                  energy demand for the 20-year period from 2010            (2019 – 2022). It will ensure that the generation
                                                                                    Municipality                    to 2030. The IRP 2010 was intended to be a ‘living        capacity runs uninterrupted, and that South
 Gauteng
                                                                                                                    plan’ that would be reviewed by key stakeholders          Africans will receive un-interrupted electricity.
                      Ekurhuleni Metropolitan                                       Kannaland Municipality
                                                                                                                    at least every two years. However, this was never         The Department of Public Enterprises office
                      Municipality
                                                                                    Knysna Municipality             done and resulted in an energy mix that failed to         outlines the plan through a myriad of objectives,
                                                        Western Cape                                                adequately meet the constantly changing supply            with key objectives listed below in Table 5.
                      Midvaal Local Municipality                                    Laingsburg Municipality
                                                                                                                    and demand scenarios in South Africa.
 KwaZulu-Natal        Ethekwini Municipality                                        Langeberg Municipality

                      Ephraim Mogale Local                                          Mossel Bay Municipality         Table 5: Key objectives of the Eskom unbundling
                      Municipality
                                                                                    Oudtshoorn
                                                                                                                                              Reduce reliance on coal to other cleaner and cheaper energy sources indicated in
                                                                                    Municipality                                         1
                                                                                                                                              the IRP 2019
 Limpopo
                      Polokwane Municipality                                        Overstrand Municipality
                                                                                                                                              Create three separately managed and operated subsidiaries: Generation,
                                                                                                                                         2
                      Mogalakwena Local                                             Prince Albert Local                                       Transmission and Distribution
                      Municipality                                                  Municipality                           Key
                                                                                                                                              Optimisation of the operations and governance competency (including climate
                                                                                                                        Objectives       3
                      Govan Mbeki Municipality                                      Saldanha Bay                                              change impact)
                                                                                    Municipality
                                                                                                                                         4    Implementation of cost-effective business practices for each entity
 Mpumalanga
                      Steve Tshwete Local                                           Stellenbosch
                                                                                                                                              Maintain the livelihood of the workers, and communities located and economically
                      Municipality                                                  Municipality                                         5
                                                                                                                                              dependent on coal mines
                      Dawid Kruiper Municipality                                    Swartland Municipality

                      Gamagara Local Municipality                                   Theewaterskloof Local           Transmission Entity (TE): systems and market              Entity (TE) will become the buyer for purposes
 Northern Cape
                                                                                    Municipality                    operator. In the immediate future, the creation of        of the power purchase agreements (PPAs)
                      Sol Plaatje Municipality                                      Witzenburg                      the transmission entity is a priority as it is the        entered into with generators. All existing PPAs
                                                                                    Municipality                    keystone in Eskom's reform. This entity will be           between Eskom and various IPPs will have to
 North West           City of Matlosana                                                                             wholly owned by Eskom Holdings and its core               be transferred to the TE. The TE will continue
                                                                                               Source: SALGA 2018   functions will be to act as an unbiased electricity       to own and develop key infrastructure such as
                                                                                                                    market broker, to promote capital investment              substations, transformers, and ~33 000
There is a large range of SSEG tariffs across the municipalities listed in Table 4. While the average tariff        within the industry, and to catalyse energy               kilometres of transmission lines. The key
remains low, there is still a string of business cases to be made, built on the value of self-consumed              efficiency and cost sustainability. Once                  responsibilities of the TE are detailed in
electricity. There is currently no guarantee on the structure and cost of municipal consumption and                 restructuring is complete, the Transmission               Table 6 overleaf.
feed in tariffs from year to year. Municipalities are moving tariffs to be more cost reflective, with the bulk
of their costs coming in the form of energy time of use purchases from Eskom.

16                                                              Energy Services: Market Intelligence Report 2020    Energy Services: Market Intelligence Report 2020                                                             17
Table 6: Key responsibilities of the new Transmissions Entity (Eskom Holdings)

                        1   System and market operator

                        2   Manage the electricity selling function across all stakeholders
          Key
                        3   Facilitate electricity selling function through open market model
     responsibilities
                        4   Dispatch the generators according to least-cost merit order

                        5   Balance electricity supply and demand in real time

Generation Entity. The Generation Entity (GE) is responsible solely for generation. The current power
plant base will be separated into a number of feasible smaller generation units with the intention that,
over time, the generation market will become more competitive and decentralised (including renewable
energy generators).

All Eskom-owned power plants will be housed in this entity. The entity will contract with the
Transmission Entity for the right to sell electricity and use the grid in the same way as IPPs currently
do. This would create a level of competition in the industry between private generators and the new
generation entity. The key responsibilities of the GE are detailed in Table 7 below.

Table 7: Key responsibilities of the new Generation Entity (Eskom Holdings)

                        1   Maintain and improve current generation assets

                        2   Develop new price-competitive generation assets
          Key
     responsibilities
                        3   Reduction of the price and cost of coal while maintaining the quality of coal

                        4   Reduce emissions through discovery and use of cleaner coal processes

Distribution Entity. The Distribution Entity (DE) will      contributes directly to South Africa’s
be authorised to buy from the Transmission Entity,          deteriorating investment grade. Eskom has
licensed municipal generators, and embedded                 failed to finance its own borrowings, even with a
generation. The roadmap states that further                 more than 500% tariff increase, over the recent
consideration will be given to the structure of the         years. In order to pave the way out of this debt
distribution sector as a whole, and that the                crisis, the Minister of Finance tabled a Special
appropriate policy structures need to be                    Appropriation Bill that will allocate a further R26
developed. This is a fundamental shift towards an           billion in 2019/20 and R30 billion more in 2020/21,
open and competitive market, and should be                  on top of the R350 billion guarantee.
welcomed by the private sector. The wheeling
framework, such as the one co-designed by                   The implications of Eskom’s reform plan
GreenCape for the City of Cape Town, can be a               to the RE sector in South Africa
viable tool that ensures these local municipalities         While Eskom undergoes this massive
are adequately supported to generate revenue                transformation, the energy services industry,
and provide electricity to their communities.               particularly SSEG, is expected to gradually gain
                                                            more access to the market through enabling
Eskom’s financial sustainability                            regulatory determinations from NERSA, DMRE
Eskom’s unsustainable debt status, including its            and all other regulatory bodies. Table 8 details
failure to service even the interest payments on            the impact of the Eskom unbundling decision
this debt, is the single biggest risk to Eskom and          on the renewable energy industry.

                                                                                                                                                                          © GreenCape

18                                                                  Energy Services: Market Intelligence Report 2020   Energy Services: Market Intelligence Report 2020            19
Table 8: The impact of the Eskom unbundling decision on the renewable energy industry

                                                             Eskom unbundling                   Industry impact
                                                             decision
                                                                                                The renewable energy (RE) industry requires consistent and sufficient
                                                                                                procurement rounds to achieve sizeable growth that has the potential to boost
                                                                                                the local manufacturing industry, local content, create jobs, etc. A separately
                                                                                                managed “transmission” unit and intra-company competition will drive the
                                                                                                market, increase the willingness of lenders to explore favourable financing
                                                             The Transmission Entity            rates (locally and internationally), and drive insurance premiums down due to
                                                             will be the buyer                  the reduced risk factor currently linked to Eskom. The transmission entity (TE)
                                                                                                will play a major role in enabling competition in the market, as this will allow
                                                                                                the RE industry to attain and maintain a sustainable growth rate that has
                                                                                                previously been hindered by the politically influenced delays. This may also
                                                                                                support the growth of the small-scale embedded generation and distributed
                                                                                                generation markets, as the TE seeks cheaper generation sources.

                                                             Open market model and              The TE should stimulate the market through an open-market model that allows
                                                             intra-company                      open access to the national and local electricity grids.
                                                             electricity trading

                                                                                                It remains unclear how the Eskom debt issue will be resolved. Most likely it will
                                                                                                be transferred to National Treasury. Uncertainty will continue to affect
                                                             Eskom finance crisis               international investors' perception of South Africa’s REI4P programme.
                                                                                                However, the TE establishment will hopefully stimulate the industry over a
                                                                                                short-term period and offer risk-adjusted returns for the investors.

                                                        2.2.4. Innovative finance facilitating the                                   ■   It provides long financing terms of up to 20
                                                        right type of finance into the sector                                            years, which makes it especially viable for the
                                                        The growth of the South African energy services                                  commercial sector.
                                                        market is aided by ‘green’ energy finance                                    ■   It can be combined with municipal and
                                                        offerings that facilitate the tailored finance                                   government incentive programmes.
                                                        solutions for the energy sector. A number of                                 ■   The installed system is permanently affixed
                                                        exciting finance mechanisms are being tested in                                  to a property.
                                                        the market. Three of these are outlined below.                               ■   It can be repaid through the “special
                                                                                                                                         assessment” on the rates account and
                                                        Property assessed clean energy (PACE)                                            collected by the municipality of the PACE entity.
                                                        According to PACENation10, PACE is a financing
                                                        mechanism that enables low-cost, long-term                                   As explained in Figure 6, the PACE entity provides
                                                        funding for energy efficiency, renewable energy,                             financing to the energy services company or
                                                        and water conservation (resource efficiency)                                 installers who want to install resource-efficient
                                                        projects installed by ESCos on properties where                              technology on a property. Once the project's
                                                        rates are collected by the municipalities instead                            feasibility has been assessed by the PACE entity,
                                                        of by Eskom.                                                                 the project is then financed by the PACE entity.

                                                        There are a few key elements of a successful                                 Municipalities perform rate collection services for
                                                        PACE programme:                                                              a small administration fee, which includes a
                                                                                                                                     ‘special rate/tax’ on the property’s rates bill. This
                                                        ■     It is voluntary for all parties involved.                              is used to re-pay the PACE entity for financing
                                                        ■     It can cover 100% of a project’s hard                                  the installation. This ‘special assessment’ is linked
                                                              and soft costs.11                                                      to the property (irrespective of its owner).

                                                        10
                                                             https://pacenation.us/ – A movement of people and organisations who are joined in their support for PACE financing
                                                        11
                                                             Hard costs are infrastructure construction costs. Soft costs are all other costs that are not directly related to infrastructure and
                                        © Solar MD      construction costs, such as services, legal, and administration costs.

20   Energy Services: Market Intelligence Report 2020   Energy Services: Market Intelligence Report 2020                                                                                            21
If there is a default on payments, the municipality           Future potential owners must agree to the ‘special        Property owners have reacted favourably to                              However, in 2017, the big five banks in South
responds in much the same way as when other                   rate' on the rates bill and agree to continue to pay      PACE internationally because external investors                         Africa started to focus on rooftop solar PV’s
rates are overdue. The current or future owner will           this before they may own the building.                    can fund projects so that there are no out-of-                          unique financing needs, providing more targeted,
be liable to pay the overdue amount. The building                                                                       pocket costs for the property owners. Since PACE                        patient, and affordable finance packages for
owners are only liable to pay the special rates for           PACE is an international initiative; however, local       financing terms extend to 20 years, it is possible                      commercial and residential solar PV. The
as long as they are the owners. However, they                 programmes are being explored and tailored to             to undertake deep, comprehensive retrofits that                         inclusion of the commercial banking sector may
must meet the criteria set out by the PACE entity             meet regional market needs. Regardless of the             have meaningful energy savings and a significant                        reduce some opportunities for less traditional
when they first approach or are approached by                 model, there are several items that hold true for         impact on the bottom line. The annual energy                            investors such as equity funds; however, it could
the ESCo that installs the service.                           every PACE programme.                                     savings for a PACE project usually exceeds the                          unlock the SSEG opportunity for end-users and
                                                                                                                        annual assessment payment, so property owners                           installers, engineering, procurement and
                                                                                                                        are immediately cash-flow positive. It would be                         construction contractors (EPCs), and ESCos by
                                                                                                                        premature to calculate a potential market size                          providing accessible and affordable financing13.
                              PACE Entity                                                                               as the exploration of this model has only just
             ■   Provides financing to ESCos or installers.                                                             started in South Africa.                                                Banks’ offerings include mechanisms that
             ■   Has list of criteria which need to be met                                                                                                                                      cover 70% to 100% of capital costs with a five-
                 by property and the property owner                         Energy services company (ESCo)              Commercial bank offering12                                              to ten-year loan repayment. However, by making
                 before a ‘special assessment’ is made                ■   Installs resource efficient technology        Financing for SSEG, specifically rooftop solar                          use of pre-selected EPCs and meticulous energy
                 on the property.                                         on properties that meet the list of           PV, is underpinned by thousands of small                                audits, banks ensure that financed projects
             ■   Collects funds via the municipality                      criteria set out by the PACE entity.          contracts with consumers. Traditionally,                                are designed so that the customer’s savings
                 which fulfils its role as the rates                  ■   Is financed by PACE entity.                   commercial banks have favoured big solar/wind                           generated from the solar installation are
                 collection facility via the ‘special                                                                   farms because they are generally based on                               greater than the loan repayments. This
                 assessment’ which is included on the                                                                   contracts with investment-grade utilities and                           results in a positive cash flow.
                 property’s rates bill.                                                                                 international companies. Only in the past two
                                                                                                                        years have the majority of the commercial banks                         Commercial banks are understandably risk averse,
                                                                                                                        started to provide tailored mechanisms for                              seeking high returns on their investments. The
                                                                                          Property                      rooftop solar PV investments.                                           fact that they see this market as a meaningful
                                                                      ■   The property must meet a list of                                                                                      opportunity, and have designed specific funding
                       Municipality                                       criteria set out by the PACE entity in        Commercial and residential debt largely remains                         mechanisms for SSEG systems, is indicative of the
     ■   Usually serves as rates collection facility.                     order for the ESCo to be financed to          closely tied to strong individual credit scores and                     reduced risk in the market as well as the potential
     ■   Can be financing mechanism                                       install the technology.                       existing bank-customer relations.                                       financial returns available in the market.
         “PACE Entity”.                                               ■   A ‘special assessment’ of the property
     ■   More than likely earn an                                         is done, and is paid to the municipality,
         administration fee.                                              similar to a rates payment.
                                                                      ■   The ‘special assessment’ is included
                                                                          on the rates account as a separate
                                                                          line item.
                              Property owner                          ■   If there is a default on the payments,
             ■   Is liable to pay the specially assessed                  the next owner will be liable to pay the
                 rate for the installed technology on                     overdue amount.
                 the property.
             ■   When first approaching or
                 approached by the ESCo, the building
                 owner needs to meet certain criteria
                 set out by the PACE entity.
             ■   Potential property owners must
                 agree to the ‘special assessment’
                 on the rates account and agree to
                 continue paying this before they can
                 own the property.

                                                                                                                                                                                                                                     © Nicholas Fordyce
Figure 6: PACE financing mechanism

                                                                                                                        12
                                                                                                                             More information on commercial banks’ offerings and other innovative green finance mechanisms is available in GreenCape’s Energy
                                                                                                                        Finance industry brief. Access it here: https://www.greencape.co.za/content/financing-solar-pv/
                                                                                                                        13
                                                                                                                           Most commercial banks do not offer standalone services. e.g. for solar PV finance, customers would need to make use of other bank
                                                                                                                        products as well (a business account etc.).

22                                                                   Energy Services: Market Intelligence Report 2020   Energy Services: Market Intelligence Report 2020                                                                                        23
Table 9: South African commercial banks on solar PV for C&I

 Solar PV in                                                                                                                     Solar PV in
 the C&I                                                                                                                         the C&I
 Sector                                                                                                                          Sector

 Main             ■   Depends on customer profile and         ■   Nedbank secures              Debt solutions are tailored       Typical          Amortising debt at up to 100%                 IPP with Special Purpose         Depending on the financial
 investment           their needs.                                term-loan financing over     to suit client needs and          payment          loan-to-cost.                                 Vehicle: 60% Debt/40%            position of the borrower,
 instrument                                                       the underlying assets        could include:                    structures in                                                  Equity. Asset Based              Standard Bank can consider
                  ■   The main funding opportunities
 for PV                                                           of the project.              ■   Instalment sale loans.        C&I sector                                                     Finance and Term Loans up        funding of up to 100% of the
                      to date have been for customers
                                                                                                                                                                                                to 100% of project cost.         installation costs.
                      installing solar PV and integrating     ■   There is an installment      ■   Medium term loans.                                                                                                            The loan is normally
                      energy production into their existing       sale/ asset-based
                                                                                                                                                                                                                                 amortized but stepped
                      business. Therefore lending is              finance option, and
                                                                                                                                                                                                                                 repayments, aligned to cash
                      against existing balance sheets             structured finance
                                                                                                                                                                                                                                 flow can also be considered.
                      (with a view of the cash flows from         options for power
                      the installation). This changing            purchase agreements.
                      with growth in Absa’s lending to                                                                           Are you          Absa have seen growth in commercial           Yes, 10% of deals are PP-        The PPA market is growing
                      commercial and industrial power                                                                            seeing more      and industrial PPAs in recent years, and      funded; however, as the          rapidly with many new
                      purchase agreements.                                                                                       power            we expect significantly higher growth in      concept of PPA’s grows, the      entrants in the market.
                                                                                                                                 purchase         2019. We will continue to support the         number of deals will follow.     Currently, ~60% of our basket
                  ■   Asset finance, unsecured finance
                                                                                                                                 agreements       growth of this market segment as a                                             is funded under a PPA
                      and property finance products
                                                                                                                                 being            funding partner.                                                               structure. Where repayment is
                      are all potential financing
                                                                                                                                 funded?                                                                                         dependent on a PPA, it is
                      solutions.
                                                                                                                                                                                                                                 important to ensure:
 Investment       Absa currently focuses on individual        ■   No minimum size.             There is no real limit                                                                                                            ■   Tier 1 equipment is
 size             projects of up to 1 MW, due to greater                                       for loans for solar PV                                                                                                                installed.
                                                              ■   Nedbank must be the
 requirements     clarity around embedded generation                                           installations; however,                                                                                                           ■   Contracted revenue is
                                                                  sole primary banker
                  and no licensing requirements, and have                                      Standard Bank typically                                                                                                               sufficient for repayment.
                                                                  to the obligor.
                  financed commercial and industrial                                           finance individual projects
                                                                                                                                                                                                                                 ■  Sustainability of the
                  installations as small as 30 kWp.                                            up to 999 kWp in size.
                                                                                                                                                                                                                                    offtaker.
                                                                                                                                                                                                                                 The viability of a PPA is
                                                                                               Larger portfolios and
                                                                                                                                                                                                                                 strongly impacted by the
                                                                                               investments are evaluated
                                                                                                                                                                                                                                 contracted tariff structure.
                                                                                               on a case by case basis.
                                                                                                                                 Other things     ■   Have had a team dedicated to              ■   No preferred supplier list   Standard Bank has a focused
 Investment       5 to 10 years                               Tenure up to 10 years per        Debt tenures can go up to 10
                                                                                                                                 to note?             Renewable Energy (with strong focus           for suppliers of             strategy for renewable energy
 period                                                       project.                         years currently, negotiated
                                                                                                                                                      on C & I market for solar PV) for a           equipment but each           which enables them to provide
                                                                                               -but this is case-specific
                                                                                                                                                      couple years and this remains a key           supplier/installer will be   tailored financial support to
                                                                                               and not the norm.
                                                                                                                                                      focus sector.                                 vetted individually.         companies operating within
                                                                                                                                                                                                                                 the energy services value
 Security/        ■   Project specific and additional         Security can be taken            Collateral-based                                   ■   Focus on the sector is not only related   ■   Nedbank’s clients
                                                                                                                                                                                                                                 chain. These include, but are
 collateral           security might not be required.         against the asset but often is   contractual agreement;                                 to funding.                                   typically have turnovers
                                                                                                                                                                                                                                 not limited to EPCs, developers,
 requirement                                                  taken against the underlying     however, the lending                                                                                 of R7m or more and have
                  ■   Absa takes the cash flows of the                                                                                                                                                                           solar asset owners, or
 for debt                                                     balance sheet of the client.     principles have been aligned                       Please email to attend any of our                 been in business for a
                      installation into account.                                                                                                                                                                                 distibutors. Solutions go
                                                              In the case of IPP’s security    to the solar PV sector.                            customer events or receive any of                 number of years.
                                                                                                                                                                                                                                 beyond loans and include
                  ■   The installation seen as part of        is based on the underlying                                                          our industry research and quarterly               Nedbank prefers to deal
                                                                                                                                                                                                                                 solutions such as:
                      the collateral.                         off-take agreements and                                                             newsletters.                                      with the client when a
                                                              balance sheet.                                                                                                                        renewable energy             ■   transactional support.
                                                                                                                                                                                                    installation is being        ■   trade finance.
 Risk reduction   ■   Guarantees on debt.                     At present,                      ■   Healthy cash flow,                                                                               considered. Nedbank’s
                                                                                                   including savings from                                                                           relationship is with the     Standard Bank tailors
                  ■   Insurance.                              ■   The quality of the
                                                                                                   installation.                                                                                    client and is guided by      solutions specifically for each
                                                                  product (certified
                  ■   Second-hand market for solar assets.                                                                                                                                          confidentiality              project rather than relying on
                                                                  installer).                  ■   Quality of the product.                                                                          requirements. When a         a one-size-fits-all approach.
                                                              ■   The workmanship.             ■   Backed by adequate                                                                               client has decided on a
                                                              ■   O&M history.                     insurance.                                                                                       supplier and is ready to
                                                                                               ■   Financial positions of                                                                           discuss financing,
                                                              In the near future:                  principal borrower and                                                                           Nedbank will engage.
                                                              ■   Wheeling.                        offtaker.                                                                                    ■   Rental discounting
                                                                                               ■   Second-hand market for                                                                           agreements are
                                                              ■   Second-hand market for
                                                                                                   solar assets.                                                                                    available for suppliers
                                                                  solar assets.
                                                                                                                                                                                                    (subject to being
                                                                                                                                                                                                    approved by the Rental
 Average          Risk dependent                              The interest rate is based       Offer a competitive interest                                                                         Discounting team and an
 interest rate                                                on riskadjusted pricing          rate. The actual rate is                                                                             agreement is in place).
                                                              principles and varies            impacted by many variables
                                                              depending on the project         like the size of the deal, the
                                                                                                                                 Contact          Justin Schmidt, Head: Renewable Energy        Mark Boshoff, Head               Deerosh Maharaj, Manager
                                                              and client, while striving to    amount, the debt tenure,
                                                                                                                                 details          (Retail and Business Bank):                   (Sustainable Development         (Medical and natural
                                                              be competitive and               the risk assessment etc.
                                                                                                                                 for more         justin.schmidt@absa.co.za                     Goals):                          resources): Deerosh.
                                                              market related.                  It therefore varies from
                                                                                                                                 information                                                    MarkBo@Nedbank.co.za             Maharaj@standardbank.co.za
                                                                                               transaction to transaction.

24                                                                       Energy Services: Market Intelligence Report 2020       Energy Services: Market Intelligence Report 2020                                                                                 25
You can also read