Good heating practices from Denmark and Germany - Conclusions for Poland www.forum-energii.eu - Agora ...
←
→
Page content transcription
If your browser does not render page correctly, please read the page content below

Good heating practices
from Denmark and Germany
Conclusions for Poland

www.forum-energii.eu
Good heating practices from Denmark and Germany

    Forum Energii is a think tank operating in the energy sector area. Our mission is to create the
    foundations for effective, safe, clean and innovative energy sector based on data and analyses.

    All analyses and publications of Forum Energii are made available free of charge and may be
    reproduced provided that the source and authors are identified.

    AUTHOR                                                   COOPERATION

    Andrzej Rubczyński, Forum Energii                        Dr Jan Rączka, Forum Energii
                                                             Rafał Macuk, Forum Energii
    MANY THANKS

    We would like to express our thanks for the content-related support, helpful comments and no-
    tes which we received from international experts. The following persons significantly helped in
    the creation of this report:

    · Dr Alexandra Langenheld, Matthias Deutsch and dr Fabian Joas - Agora Energiewende,
    · Pia Zimmermann, Lars Gullev - Danish Board of District Heating,

2
    · Bogusław Regulski – Chamber of Commerce Polish District Heating,
    · Matthias Rehm - the Embassy of the Federal Republic of Germany,
    · Izabela Iwona Jakobsen – the Embassy of the Kingdom of Denmark,
    · Wiktor Kozłowski - Ramboll Polska.

    The report “Good heating practises from Denmark and Germany” has been developed on the ba-
    sis of the “Modern technologies and good practices related to the heat sector: International case
    studies” report by Jakob Nymann Rud et al., 2018, COWI, made on the order of Forum Energii.
    Both analyses were conducted as part of the Forum Energii project “Clean Heat – International
    Cooperation Forum” supported by the European Climate Initiative EUKI.

    PARTNERS
TABLE OF CONTENTS

04 Foreword
05 Introduction
06 Comparison
07 Conclusions for Poland                        3

11   Danish heating sector
40 German heating sector
63 Key technologies

                                 DECEMBER 2018
Good heating practices from Denmark and Germany

    1. Foreword
    Changes in the heating sector are fundamental for the improvement of air quality in Poland. However, our
    heating supply sector has been drifting for years. On the one hand, the decision-makers are afraid to talk
    about cost increases and the need to support the poorest people. On the other hand, Polish heating sector
    is an exceptionally difficult puzzle – it is heterogeneous, it has diversified ownership and production struc-
    tures and a different level of technical advancement. We should not exclusively concentrate on heating
    systems, because these are mainly individual heating sources, which contribute to the emergence of smog.

    The entire discussion on energy sector and heating sector in our country is unfortunately still subordina-
    te to mining affairs. Mining is important, but the energy sector cannot be developed through one sector,
    especially when it has an influence on the entire economy. We have reached the point in which we have
    the worst air quality in the European Union. As many as 36 out of 50 of the most polluted cities in Europe
    are located in Poland. This has to change in the future.

    Discussions with people who have a direct influence on the future of the national heating sector have been
    the inspiration to create this report. Many of them are convinced that the discussion on Polish heating
    should be started anew. A review of the best technologies available in the 21st century is necessary. It is
4
    vital to analyse both the good as well as the bad experiences of other countries.

    We have decided to learn from the experiences of Denmark and Germany. We have checked their achie-
    vements in the improvement of air quality and modernization of the heating sector. We have chosen these
    two countries due to their similarities to Poland. They are located in a similar climate zone, take advantage
    of expanded heating networks and for years their heating sector has relied primarily on coal.

    In the present study, we try to bring our readers closer to the outline of the history of changes in the sector
    in Denmark and Germany. We show the importance of long-term vision, specific aims and mechanisms
    motivating engagement and appropriate evaluation of environmental costs in this process.

    We hope that this report will become an inspiration in the important discussion on solving the problem of
    smog and the modernization of the Polish heating sector and will allow Polish decision-makers to believe
    that changes are not only necessary, but also feasible.

                                                                                                  Yours faithfully,
                                                                                   Joanna Maćkowiak-Pandera
                                                                                      President of Forum Energii
2. Introduction
The aim of this report is to present the experiences of the heating sector in Denmark and Germany over
the last 30 years. This may provide impetus to a national discussion on the most modern technologies
available and regulatory solutions. The report is part of the “Clean Heat” project implemented by Forum
Energii, the main task of which is to support the actions connected with the improvement of air quality in
Poland through changes in the heating sector.

We decided to mention the examples of Denmark and Germany due to the following reasons:

        • In the past their heating systems were strongly dependant on coal.
        • O
           ver the last few years they have significantly changed their heating sectors, which has con-
           tributed to the improvement in air quality.
        • T
           hey are located in a similar climate zone and have well-developed heating networks.

The area of heating supply is understood as both system heat and individual heating installations in buil-
dings that are not connected to urban networks. An integral part of the discussion on the heating sector
is the improvement of energy efficiency. The modernization of heat sources cannot begin without radical
                                                                                                             5
improvement in the energy standards of buildings. Heating networks are treated as a source that should
be particularly taken care of. System heat will help to solve the problem of smog, but at the same time
Polish heating systems have to be effective and offer heat at a reasonable price.

In this report we describe how Denmark and Germany managed to eliminate coal from households. How
was the problem of energy poverty solved? Which incentives were used for the development of clean heat
sources? We also show how the heating sector helps to balance the power system through cogeneration.
Good heating practices from Denmark and Germany

    3.       Comparison
    Poland, Germany and Denmark demonstrate a number of similarities with regard to the use of coal in the past
    and to the development of heating systems. However, their experiences have been different in the recent
    years. This is due to the fact that their energy systems differ with regard to size, emissivity and attitude to
    fossil fuels. A synthetic comparison of key macroeconomic indicators is displayed below.

    Tab. 1. Three countries at a glance (2016).

                                                                          Denmark        Germany        Poland

     Energy sector

     Generation of electricity                                             30.5 TWh      649.1 TWh    166.6 TWh

     Electricity share from RES in the electricity production               60.5%          29.9%        14.0%

     Electricity share from cogeneration in the electricity production      39.4%          13.5%        16.6%

     System heat generation                                                38.0 TWh      130.4 TWh     81.3 TWh

6
     Heat share from RES in the system heat generation                      50.0%          14.2%         7.6%

     Heat share from RES in the system heat generation                       67%            83%          60%

     Economy

     Energy consumption GDP (toe /Mil EUR’10)                                66.4          111.1         231.2

     Emissivity GDP (tCO2/Mil EUR’10)                                       153.3          290.0         747.6

     Goals and strategies 2030

     National reduction of CO2 vs 1990                                    Discussion     55% - 56%

     Energy share from RES in the stream of primary energy                   35%                           ?

     Energy share from RES in the stream of primary energy               50% from wind     65%

     Goals and strategies 2050

     National reduction of CO2 vs 1990                                     80%- 95%      80%- 95%

     Energy share from RES in the stream of primary energy (Pe)/
                                                                           100% (Pe)      60% (Fe)
     final energy (Fe)
                                                                                                           ?
     Energy share from RES in the stream of primary energy (E)              100%         60% (E+H)

     Energy share from RES in the stream of heating energy (H)              100%         60% (E+H)

     Reduction of primary energy vs. 2008                                                  50%
The examples of Denmark and Germany very clearly illustrate to what extent Poland differs from Europe-
an leaders who are our base for comparison. The areas of strategic planning, setting long-term aims and
consistency in their achievement are considered as a particular handicap in Poland. Unfortunately, there is
still no defined national power or heating policy in a time horizon of two or three decades. As a result, we
risk wasting time, the slowing down of investments in the area of heating supply as well as the ineffective
spending of money.

4. Conclusions for Poland
Both countries analysed have different experiences, resources and technologies. They differ in attitude
towards the transformation of the heating sector. It is not possible to copy their solutions, but it is worth
getting to know them and getting inspired. Below, we present the most important conclusions to be drawn
for Poland following an analysis of the transformation models of the heating sector in Denmark and Germany.

Planning
                                                                                                                 7
Long-term strategy and goals
It is crucial to set long-term goals for the Polish heating sector until 2030 and 2050. These should include
social consultations and, due to a long-term perspective, agreements between the main political parties.
This strategy should refer to European regulations and reflect mega trends and phenomena at macro-level.
The lack of a national heating policy means the increase of legislative risk, higher cost of capital and the
slowing down of investments in power generation assets.

Planning of heating supply
Local Spatial Management Plans should separate the areas with types of heating supply sources defined
by local authorities. This will allow for the optimization of financial expenditures for the development of
infrastructure and more social benefits.

Environmental education and communication
The state should educate the society not only with regard to the level of air pollution, but also inform them
about necessary actions. Modern communication is needed in order to pass the knowledge about the pre-
vention of threats and protection of health as well as to provide opportunities to reduce air pollution. It is
also essential to inform the citizens about the need for investment and technological actions and about
the government’s plans and implemented regulations.
Good heating practices from Denmark and Germany

    External costs
    It is vital to develop the methodology for calculating external costs (health and environmental costs) for
    heating projects. In Denmark, the methodology for calculating external costs has been made uniform, and
    input data for calculations (unit costs of pollution groups for different categories) is subject to periodic
    updates and is published by the government agenda. It is necessary to include the impact of technology on
    health and environment, i.e. social and economic cost, when making a decision about the choice of heating
    and power projects.

    Industrial strategy
    A well-prepared strategy for the modernization of the heating supply sector may be beneficial not only from
    the environmental, but also from the macroeconomic point of view of the state. The allocation of funds for
    efficiency understood as reduction of heat energy consumption and an increase of heat share from RES
    should be connected with the concept of the development of national industry producing devices for the
    heating sector and small power energy.

    Resources
8
    Energy efficiency and standards of buildings
    If there is a failure to improve energy efficiency, the costs of transforming the heating sector will be too high,
    and environmental effects will be delayed. Buildings use about 30% of final energy, and national fuel import,
    mostly from Russia, is growing. The promotion of energy efficiency in the existing buildings is fundamental
    as are mandatory reinforced standards for new buildings. As a comparison, Germany has implemented
    zero-energy standard for new buildings since 2021. A strategy to reduce primary energy demand by 80%
    is implemented in the existing buildings up to 2050. The “Flat+” program implemented in Poland, which is
    to help the citizens to solve housing problems, should promote ambitious standards of energy efficiency. It
    may drive Polish innovations and become a part of the new industrial policy.

    A shift from solid fuels to heating of individual buildings
    Both Denmark and Germany abandoned coal combustion in households, because individual stoves are the
    main reason for smog. In both countries, biomass and gas are gradually being abandoned as well.
    Heating networks, heat pumps, renewable sources and partially gas are alternatives to coal. Poland needs
    to develop a strategy to abandon the use of coal in households by 2030 or 2035, otherwise the air quality
    will not improve.

    The future of biomass
    The change in attitude towards the use of biomass is becoming gradually more visible both in
    Germany and Denmark. It is not a neutral fuel for the environment - in terms of emissivity, ori-
    gin and availability. The production of biomass for energy purposes is a competition for agricultu-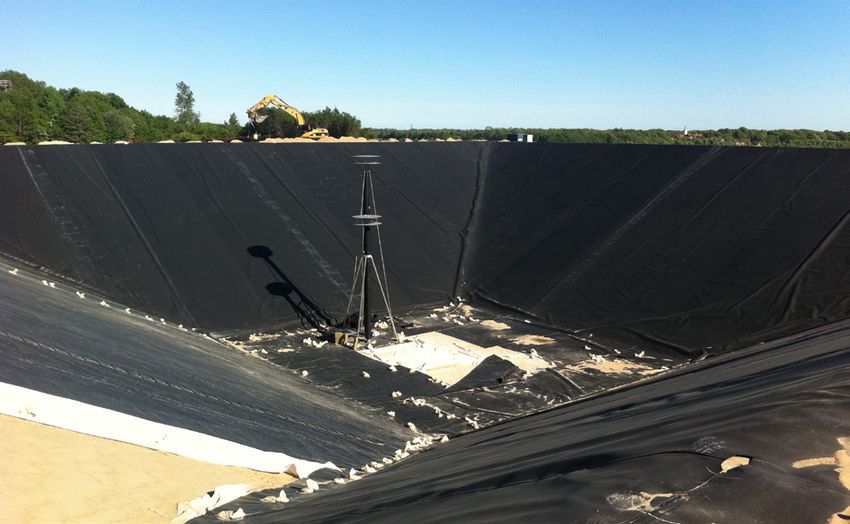
ral crops, which should be given priority. This is why biomass has a perspective in small and local
CHP plants and heating stations. The combustion of biomass in large power stations has no future.
A discussion on the combustion of biomass in stoves (as a substitute for coal) should be held. It is certainly a
better alternative to coal waste, but its combustion in small stoves causes emissions of many harmful substances.
This is due to the low efficiency of equipment and lack of possibility to maintain appropriate emission standards.
Denmark faced just such a problem.

Funding
Effective use of public measures
Polish governments support thermo-modernisation, coal, RES, 5th generation coal stoves, development of
heating networks, diversification of gas sources and many other projects connected with the heating sector
and energy sector. In the meantime, some of these actions are mutually exclusive. Funding should support
a uniform national strategy or a wide range of regional strategies and commonly-accepted long-term goals.

Circulation of funds in a closed circulation system
Modernization of the heating sector is connected to large expenditures. This is why it will be important to source
                                                                                                                      9
new funding in the future. The first possible step is to use revenues from the sales of CO2 emission rights - their
price increased up to about 25 Euro per tonne in 2018 (after correction, it decreased up to 18 Euro per tonne)
and further increases should be expected. With current annual emissivity of power and heating sectors at
the level of 153.7 million tonnes of CO2 , PLN 12 billion is needed - those funds should be wholly spent on
the heating sector and low-emission energy sector. Similar solutions are applied in Germany and Denmark.
Funds from the sales of emission rights are used to eliminate its sources. In Germany, 100% of revenues from
CO2 auctions are spent on power and pro-climate projects. In Denmark, the revenues generated by coal tax
that charges different types of primary energy to different extents (fuels, electricity, heat) are almost totally
allocated to support modernization of the energy sector and the heating sector.

Energy poverty
Sensitive social groups which are prone to energy poverty should continue to be protected. The support
programmes developed in Poland should be coherent with directions of planned transformation of heating
supply area. They cannot only be a reaction to current pressing problems.

Technology
Connecting heating sectors with power engineering
Heating sector may help to balance the energy system. Both Denmark and Germany are working on relevant
solutions. It is also worth tapping this potential in Poland. Modern heating stations equipped with flexible
Good heating practices from Denmark and Germany

     cogeneration units, heat pumps, electric boilers and heat accumulators may stabilize (balance) the work of
     the National Power System.

     Electrification of the heating sector
     Electrification of the heating sector, may be an alternative for Polish households. The energy system of the
     future will be characterized by a huge amount of cheap electricity from RES. Where the tariff is flexible
     and prices of electricity reflect the demand, the wide use of heat pumps will be possible. This is already a
     real perspective in the near future.

     Use of surplus energy
     Surplus energy originating from industrial processes, discharges from waste water treatment plants, from
     air conditioning and cooling devices should be treated as national power resources. Its role in the heating
     sector should grow steadily. System mechanisms and regulatory frameworks promoting this type of energy
     should be formed. It is connected with the change in the philosophy of heating companies (decentralization
     and diffusion of energy sources, bi-directional thermal energy flows) and change of network performance
     parameters and transition to low-temperature levels.

     Support of development of 4th and 5th generation heating networks (4G and 5G)
     Low-temperature networks: 4G and 5G allow for an easier and more effective absorption of energy from RES
10
     and surplus energy. Decrease of temperature of working medium in heating systems should be a constant
     process andshould be an integral part of projects for development of heating companies. Mechanisms and
     regulatory framework, which will facilitate and stimulate this process, should be formed.
5. Denmark
5.1. History of changes in the energy sector
The Danish energy sector started to change in the mid-seventies after the very first oil crisis. Western Europe
was shocked by the crisis which gave rise to the reflection that fossil fuels resources wre not limitless, and
that the prices are shaped by the international market pushing up energy costs in unexpected situations.
Those who learned the lesson, decided to solve the problem by adapting the future power policy. Within
just a quarter of the century, Danish energy sector and heating sector have been entirely altered. Energy
efficiency, cogeneration in the energy sector and renewable energy were of primary importance. Figure 1
shows the decisive steps of this process.
Figure 1 Key stages of development of the energy sector in Denmark.
1973 – Oil crisis
• Starting discussions on fuel independence
1979 – The First Energy Plan and the First Heating Act
• Start reducing oil consumption and petroleum in energy sector and heating sector
• Introduction of the obligation to connect buildings to heating networks 11
1981 – D
evelopment of National Heating Plans
• Dividing into areas with defined energy sourcesfor heating purposes
1986 – P
arliament’s decision on energy planning
• Withdrawal from considerations about the construction of a nuclear power plant
• Excluding coal from energy plans
• Strengthening the role of small CHP plants as a base for the power system
•Further taxation of liquid fuels and electricity for heating purposes
1990 – Amendment to the Heating Act
• Strengthening the role of biomass and gas cogeneration
• I ntroduction of guidelines for self-government authorities regarding the use of cogeneration
in local heating companies
1992 – I ntroduction of environmental taxes as instruments for shaping the energy mix.
• Introduction of support systems for the developmentof cogeneration, heating networks and RES
1993 – P
olitical agreement on the strategy of using biomass for energy purposes
• Further support for the development of CHP plants and heating networks
2008 – Agreement on energy policy 2008-2011
• Strong support for the development of wind energy and other RES
2012 – Agreement on the Energy Plan 2012-2020
• Road map and action plan for the development of RES, wind energy and energy systems
2018 – Agreement on the Energy Plan 2018-2030
• Update of goals and action plans
• Adoption of national goals for 2030 and maintenance of goals for 2050
Source: Own analysis on the basis of State of Green, White papers for a green transformation, 2016.Good heating practices from Denmark and Germany
5.2. Opening balance
From the beginning of the 1990s until now, Denmark has been self-sufficient with regard to its natural gas
supply and petroleum. The country became the exporter of net energy for many years to come thanks to
the increase of resources extraction in the 1990s. However, again Denmark became an importer of net
energy due to a further drop in extraction. In2016, dependence on energy import was 13.9%, which is a good
result when it is taken into account that the EU average exceeded 53%. Denmark compensated the drop
in petroleum and gas extraction by increasing the generation of electricity from local renewable sources
(mainly from wind, biomass and sun).
Figure 2 Net import of coal, petroleum and natural gas per habitant and the level of net import
dependence.
25 100%
import
20 80%
15 60%
Dependancy on import
10 40%
MWh per capita
5 20%
0 0%
5 -20%
12
10 -40%
15 -60%
export
20 -80%
-25 -100%
1990
1992
1994
1996
1998
2000
2002
2004
2006
2008
2010
2012
2014
2016
1990
1992
1994
1996
1998
2000
2002
2004
2006
2008
2010
2012
2014
2016
OIL NATURAL GAS COAL
Source: Own analysis on the basis of DG ENER of the European Commission
After the oil crisis, a wide range of regulations were implemented aimed at the increase in the the energy
efficiency and making the country independent of fossil fuels import, starting with petroleum and coal.
The dynamic development of renewable energy sources, dispersed cogeneration sources of heating systems
brought a revolutionary transformation of the energy landscape in the country within a quarter century.Figure 3 Transition from strongly centralized to decentralized energy system in Denmark.
1985 2015
!
(!
(
!
(
!
(
!
( !
( !
(
(
! !
(
(
!
!
(
! !
( Y
X
Y
!!
((
(
! !
(
(Y !
(
! !
(
! Y(
Y !Y(
(
Y Y
!
( !
( Y
!
(
!
( YY!( !(
!!
( YY Y !
(
!
(
( Y Y
(Y
!
!
( !
(! !
(
!!
(( !
( ( !
(
!
( !
(
!
(
Y !( !(
Y Y YY
!
( Y Y !( !
(
Y YYYY (
!
(
!
( Y
X
Y Y!( ! Y Y
!
(
( !
! (
!
(
!
(
!
( !
(
Y
YY Y
X
Y !( Y!( Y (( !( !( !
!
(
! !
( YYY Y !(
Y Y!( ! (
Y !
(
YYY
!
(
!
(
Y
Y (
!
!
(
Y ! !
( (
( !
( !
! (!
( !
(
!
!
(
(
!
(
Y Y
(
!
!
( !
( !
(!
(
!
( !
(
(
!
(
! Y!( !!(Y !(Y Y !( !( !( ! ( !
(
Y!(!(YY (Y (Y
(
! !
(!
!( !( !
(
Y !
( !
( !
( (
!
Y!( !
( YYYY
(Y
! Y
!
(
!
( !( !
(
( !
! (
Y
X !!
((!
(
!
(
(
! !
(
Y
(
! !
(
YY !(
!
( YY!(!( Y
!
( !
(
!
(
(
!
YY
Y
!
( (
! (!
! (
!
!
(
!
( !
( !
(
(!
! (
!
( (
!
( !
(
Y
X
!
(
X
Y ! (
!
( ( Y
!
( (Y
!
(
!
( Y
Y!( Y !( !(
!
( ( !
( Y
!
(
! !
( !
! Y ! (
!
Y
X
!
(
Y
X !
(
Y (
( !
(
! !
( !
( Y Y
!
(
!
(
!
(
!
( !
( Y
X !
(YY
!
( !
(
!
(
!
(
!
(
!
( !
(
!
(
!
( (!
! (
(
! Y
!
(
!
(
!
( !
( !
(
Y !(
!
( !
(
!
(
!
(!
!
(
(!
( (
!
!
(
!
(
!
(
!
(
!
( !
(
!
!
(
(!
!(
!
(!
( !
(
(
! Y
X !
( YY
!
( !
(
!
(
!
( !
( (( (
! !
!
( !
(
!
(
!
( !
(!
( !
(
!
(
!
(
!
( !
(
!
(Y!(
!
( !
( !
(
!
(
!
(
!
( !
( !
( !
(!(
Y
Y
YY
X
(
!
!
(
!
( !
( ! !(Y
( !
(
YY !
(
Y Y!( Y Y !( !
(
!
(
Y !
(
YX
XY
Windfarms Central plants Decentral and commercial plants
Y
X Offshore, 5 - 40 MW ! 50,0 - 100,0 !
2,0 - 20,0
Y
X Offshore, 40 - 400 MW ! 100,1 - 500,0 ! 20,1 - 100,0
Y Onshore, 2 - 40 MW ! 500,1 - 1000,0 ! 100,1 - 110,0
Y Onshore, 40 - 75 MW ! 1000, 1 - 1500,0
13
Source: Energinet
Figure 4 illustrates the change of structure of electricity generation sources in Denmark and the structure of
generation in electricity sector. Since the 1990’s the energy sector has seen a transition from coal to energy
from wind in the energy sector. The drop in the generation of electricity visible in the whole period results
from the decrease of its export and drop in the generation in gas-fired CHP plants replaced by cheap energy
from wind farms.
Figure 4 Generation of electricity divided into sources and production structure in 2016
50
40
TWh
30 100%
80%
20 60%
40%
10
20%
0 0%
2016
-10
-20
1990
1991
1992
1993
1994
1995
1996
1997
1998
1999
2000
2001
2002
2003
2004
2005
2006
2007
2008
2009
2010
2011
2012
2013
2014
2015
2016
SOLID FUELS PETROLEUM AND PRODUCTS GAS WIND BIOMASS
PV WASTE (NON-RES) OTHER HYDRO NET IMPORT*
*negative value means excess of export
Source: Own analysis on the basis of DG ENER of the European CommissionGood heating practices from Denmark and Germany
The share of energy from renewable sources in the generation of electricity is high - it reaches about 60%. The
share of coal keeps falling even though it still covers about 30% of annual demand. Currently, no coal-fired
units are being built. Since 2016 two large cogeneration units for biomass have appeared. By 2020 one more
unit should be built, which will allow for a reduction in coal consumption.
In addition to increasing the use of energy with RES, the second pillar of the energy and heating sector
transformation is the improvement of energy efficiency. The economic growth has been accompanied by a
decrease in demand for primary energy for over a decade. This is the effect of modernization of generation
industry programmes and increase in productivity without growth in energy demand.
Figure 5 Basic energy efficiency indicators in Denmark.
2
Index (1990 values)
1,5
1
0,5
14
0
1990
1991
1992
1993
1994
1995
1996
1997
1998
1999
2000
2001
2002
2003
2004
2005
2006
2007
2008
2009
2010
2011
2012
2013
2014
2015
2016
GDP TOTAL FINAL CONSUMPTION (TFC) TOTAL PRIMARY ENERGY SUPPLY (TPES)
TOTAL PRIMARY ENERGY SUPPLY (TPES)/GDP
Source: Own analysis on the basis of DG ENER of the European Commission and data of Eurostat.
Reduction of greenhouse gases emissions
CO2 emissions and climate changes are the key issues in state policy. Figure 6 demonstrates that CO2 from
the energy sector (energy, district heating and individual heating) in Denmark decreased by 34% by 2015
(in comparison to 1990) despite the increase in population and constant economic growth. This decrease
is a consequence of the development of wind energy and continuous modernization and development of the
heating sector, which uses more and more energy from RES, from municipal surplus and waste energy. The
drop in emissions is also a derivative of the reduction in electricity exports.Figure 6. Change in CO2 emissions from energy sector and change in CO21 emissions per habi-
tant.
50 15
per capita tonnes CO2
million tonnes CO2
40 12
30 9
20 6
10 3
0 0
1990
1992
1994
1996
1998
2000
2002
2004
2006
2008
2010
2012
2014
2016
1990
1992
1994
1996
1998
2000
2002
2004
2006
2008
2010
2012
2014
2016
PUBLIC ELECTRICITY AND HEAT PRODUCTION DENMARK
COMMERCIAL AND PUBLIC SECTOR GERMANY
HOUSEHOLDS POLAND
Source: Own analysis on the basis of DG ENER of the European Commission
One of the strongest incentives enforcing the reduction of CO2 emissions is the so-called coal tax. In Denmark,
fossil fuels (used both for the needs of CHP plants, as well as individual heating) are subject to a CO2 tax
(an average of about EUR 23 per tonne of CO2 emitted).
15
According to COWI, in terms of fuel energy, the CO2 tax is respectively:
• Natural gas: 4.7 EUR/MWh (5.5 PLN/GJ)
• Petroleum: 6 EUR/MWh (7 PLN/GJ)
• Coal: 16 EUR/MWh (18.6 PLN/GJ)
• Biomass: 0 EUR/MWh (0 PLN/GJ)
This tax is sometimes adjusted, along with a change in the level of ambition of climate policy.
In Denmark, biomass plays a key role as a fuel in the energy sector. Of the nine large CHP plants in Denmark,
four plants have already passed from coal or natural gas to co-production with the use of biomass. Two
plants are currently undergoing reconstruction, and the next one is to be transformed by 2023. The main
goal that accompanies the modernization of the heating sector is the total abandonment of coal fuel by
2030. Combustion of a large amount of biomass is being highly criticised. Not only is the impact on the
climate important, but the method of obtaining biomass and the impact on nature. The view that biomass
is a transitional fuel is becoming more and more established. Works on the completely zero-emission
and environmentally neutral target model are under way.
1 The emission concerns the generation of electricity and heat as well as commercial and housing sectors.Good heating practices from Denmark and Germany
Reduction of nitrogen oxides and sulphur oxides
The main source of nitrogen oxides (NOX) is combustion of fossil fuels, biomass and emissions from vehicles.
Figure 7 Emissions of NOX and SOX per habitant in Denmark.
80
70
60
kg per capita
50
40
30
20
10
0
1990
1992
1994
1996
1998
2000
2002
2004
2006
2008
2010
2012
2014
2016
1990
1992
1994
1996
1998
2000
2002
2004
2006
2008
2010
2012
2014
2016
NOX DENMARK GERMANY POLAND SOX DENMARK GERMANY POLAND
Source: Own analysis on the basis of DG ENER of the European Commission
Despite the high efficiency of the energy system, NOX emissions remain at a high level. One of the main
reasons is the combustion of biomass in the energy sector and individual households. The combustion of
16
biomass, even in professional heating stations, emits three times more NOX than the combustion of coal and
gas (unless installations for reduction of emissions are applied). It should be highlighted that all biomass units
should meet the standards resulting from MCP (Medium Combustion Plants) and IED (Industrial Emissions
Directive) Directives. Therefore, centralized heat plants are definitely more environmentally friendly than
individual pellet boilers or even gas boilers. A considerable drop in NOX emission was observed in1989 after
the implementation of new standards for plants with thermal power above 25 MW.
The decrease in sulphur oxide emissions (SOX) is the
Figure 8. Emission of particulate matter in effect of a wider gas introduction and actions under-
Denmark. taken as part of EU policy (Implementation of LCP/
7
IED and MCP Directives) requiring the construction
6 of more and more effective flue gas desulphurisation
5 systems. The Directive on sulphur content in liquid
kg per capita
4
fuels has additionally contributed to the reduction
3
2
of contamination level.
1
0 Reduction of fine particulate matter (PM) emission
1990
1992
1994
1996
1998
2000
2002
2004
2006
2008
2010
2012
2014
2016
Particulate matter (PM 2.5) are very small particles
PM2,5 DENMARK GERMANY POLAND present in the atmosphere which easily penetrate
Source: Own analysis on the basis of DG ENER of the the bloodstream of human beings. They are extre-
European Commission mely harmful to human health. Fine particulate mat-ter is released into the air by the combustion of fossil fuels, but it can also be released by natural sources.
The chart indicates that PM 2.5 emission has slightly decreased since 1990, but it is still too high.
Emissions of particulate matter are strongly dependent on the type of fuel and the fuel-combusting de-
vice. In the case of natural gas, emission almost does not occur. A certain emission level is generated by
the combustion of coal, oil, straw and wood in heating units. The highest emissions come from stoves and
boilers in individual buildings. Biomass is often considered to be an environmentally friendly fuel, but in
fact its combustion in domestic boilers can cause much larger environmental pollution with PM 2.5 than
combustion of oil or high-grade coal (Figure 9).
Figure 9. Emission indicators (kg / TJ in fuel) for different production technologies.
District heating Individual heating
500
400
300
kg/TJ
200
17
100
0
(steam turbine)
(gas turbine)
NG CHP (engine)
NG boiler
Coal CHP
Oil CHP
Wood CHP
Wood boiler
Straw CHP
Straw boiler
Wood furnace
NG CHP
NG CHP
Natural gas boiler
Oil boiler
Wood pellet boiler
Coal stove
SO2 NOX PM2,5
Source: COWI
Wood stoves in Denmark
More than 10% of Denmark’s heat demand in 2016 was met by home wood stoves.
The Environment Agency carried out a number of campaigns aimed at withdrawing obsolete
stoves installed before 1980 and increasing the social awareness regarding the impact of stove
operation on the quality of emitted fumes.
As a result of an educational campaign and financial incentives in the form of subsidies for the
purchase of new stoves (approximately EUR 300) about 20,000 stoves were scrapped,
out of 800,000 in total.Good heating practices from Denmark and Germany
In addition, a number of legislative actions have been taken over the past 10 years,
e.g. permission to sell only stoves with an acceptable (maximum) level of particulate,
carbon monoxide and hydrocarbon emissions.
5.3. Heating supply sector
The most important source of heating in Denmark is district heating. As many as 64% of households are
connected to heating networks, and in cities up to 98%. If it is not possible to connect to the heating network,
gas is the option, and in rural areas - biomass boilers, heat pumps and oil- or gas- fired boilers.
Figure 10. The usable area is heated by means of the main heat sources at individual
consumers.
150 000
125 000
100 000
m2
75 000
18
50 000
25 000
0
Detached Semi Multi Other Industrial Offices Hospitals Other
houses -detached -dwelling residential buildings and public and school commercial
administration and public
DISTRICT HEATING ELECTRICITY SOLID FUELS * NATURAL GAS
PETROLEUM AND PRODUCTS OTHER *mainly biomass
Source: Own analysis on the basis of Energistyrelsen and IEA
The total households’ demand for heat and its supply, with division into types of fuels, is shown in Figure 11.
The extent to which oil crises affected the level of energy consumption and the decline in the use of heating
oil for gas and district heating is evident. The chart shows both district network and individual installations
in households (excluding services and industry).Figure11. Heat demand in Danish households according to heat source
50
40
30
TWh
20
10
0
1975
1976
1977
1978
1979
1980
1981
1982
1983
1984
1985
1986
1987
1988
1989
1990
1991
1992
1993
1994
1995
1996
1997
1998
1999
2000
2001
2002
2003
2004
2005
2006
2007
2008
2009
2010
2011
2012
2013
2014
2015
2016
OIL NATURAL GAS DISTRICT HEATING ELECTRICITY HEAT PUMPS
WOOD PELLETS WOOD (STOVE AND FURNACE) SOLAR OTHER
Source: Own analysis on the basis of Energistyrelsen
In urban heating systems (Figure12), there has also been a decrease in oil consumption in favour of biomass
and municipal waste, used primarily in units operating at the basis of the load. Natural gas still plays an
important role in the heating sector in Denmark, but due to high taxes, it is losing its importance.
Figure 12. Generation of district heating and fuel structure of district heating. 19
50
40 100%
30 80%
TWh
60%
20
40%
10
20%
0 0%
1994
1995
1996
1997
1998
1999
2000
2001
2002
2003
2004
2005
2006
2007
2008
2009
2010
2011
2012
2013
2014
2015
2016
2016
OIL NATURAL GAS COAL WASTE BIOMASS SOLAR
SURPLUS HEAT OTHER
Source: Danish Energy Agency
In Denmark there are over 400 heating companies owned by heat consumers (cooperatives), municipalities
or in some cases private enterprises.Good heating practices from Denmark and Germany
Basic information on the heating sector in Denmark (2015):
- 30 780 km - length of network
- 64% - share of district heating in total heat demand
- 57% - share of cogeneration in the national generation of electricity
- 69% - share of heat from cogeneration in the stream of district heating
- 50% - share of RES in district heating
- about 8.3 kWh - average heat consumption per person per year
- about EUR 2.5 billion/year - revenues from sales of heat
Waste management companies
In Denmark, there are about 25 plants generating energy from waste. The vast majority of these plants
are co-owned by many municipalities. All plants supply heating companies with district heating. Heat from
waste incineration plants covers about 20% of the total Danish heat consumption. Some plants generate
energy in cogeneration units.
20
The high share of heat supplied from plants generating energy from waste results from significant regulatory
support and broad public acceptance for this technology. Since the beginning of the development of Danish
heating systems, municipal waste has been perceived as resources (fuel), and national waste management
plans favoured the recovery of energy instead of its storage. Even the latest waste management plan is
actually called a resource plan.
Figure 13. Waste incineration plants in
Cogeneration from gas Denmark
In Danish heating sector, gas units (2,800 MWe) work
mainly during the periods of high energy prices on the
stock exchange, guaranteeing coverage of operating
costs.
It can be said that the era of gas (and coal) CHP plants is
slowly disappearing in Denmark. The once very strong
support mechanisms for gas units, will cease to apply as
of 2019, which may reduce the available capacities due
to the lack of coverage of fuel costs, taxes and fees for
CO2 emissions through revenues from the sales of elec-
tricity. The policy of withdrawing from the combustion of
fossil fuels inthe heating sector prevents investors from Rys. 16. Spalarnie odpadów w Danii.
building new capacities. Due to the growing energy gene- Source: Own analysis on the basis of COWIration in wind farms and the drop in wholesale energy prices, the operating time of gas units is significantly
reduced. They only operate during peak power demand in the energy system. In 2016, the average time of
using all (10 GWe) cogeneration units was 2,500 h/year, and for biomass units it amounted to 4,400 h/year.
Figure 14. Installed capacity of gas cogeneration units and decreasing time of capacity
utilization.
5 000 2 000
Installed capacity, MW
4 000 1 600
Capacity utilisation, hr/yr
3 000 1 200
2 000 800
1 000 400
0 0
2000
2005
2010
2011
2012
2013
2014
2007
2008
2009
INSTALLED CAPACITY CAPACITY UTILISATION* *dotted line indicates estimated value
Source: own analysis on the basis of data presented by Per Kristensen during a conference in Warsaw on 17 January
2018.
21
The uncertain future of small heating systems in Denmark
At the beginning of the 1990s, many small towns established their own heating systems.
With no access to a gas distribution network and due to the high individual costs of
oil boilers, the heating network with the use of natural gas cogeneration was considered to be
a cheaper solution. An incentive for consumers to connect to the network was a low heat price
guaranteeing an annual saving in heating costs of 20% in relation to
alternative sources. Often, 150 to 400 apartments were connected to such a network.
The increase in the costs of purchase of natural gas and decrease in revenues from electricity sales
from cogeneration units have caused these systems to start generating losses.
Temporary subsidy programmes allowed for further activity, but payment of these benefits
will end in 2018, so heat prices will be increasing.
The Danish government is considering the implementation of financial programmes in order to
cover the costs of closing the most deficit heating systems.Good heating practices from Denmark and Germany
5.4. National strategies and goals for 2020-2050
Denmark’s power strategy is always the subject of multilateral arrangements between stakeholder groups
and the political consensus of the ruling party and opposition parties. It guarantees legislative stability
and high efficiency in achieving the assumed goals. In 2012, after agreement negotiations were concluded
between all political parties, the Energy Agreement document was signed, with specific goals and actions
until 2020 and in the perspective of 2050. The table below presents the goals set in the Agreement of 2012
and updates of 2018.
Tab. 2. Main goals of the Energy Agreement
Goal/year 2013-2016 2020 2030 2035 2050
General goal Total
34% independence of
Reduction of CO2 Denmark from
(vs 1990) fossil fuels
35% of share
100% RES for all
Energy from RES In entire primary
sectors
22 energy
50% of energy
Total withdrawal 100% 100%
Electricity from wind in total
from coal RES RES
consumption
District heating Total withdrawal 100% 100%
sector from coal and oil RES RES
The use of gas
stoves
and oil stoves has
been prohibited
since 2013
Individual heating In new buildings
sector and since 2016
In the existing
buildings,
located in the
area of heating
network
Reduction of
primary energy
Energy efficiency consumption by
4% and net energy
By 12% (vs 2006)
10% RES
Transport
from biofuels
Source: IEA and analyses of Forum EnergiiThe Energy Agreement is based on two pillars:
I. Increased share of RES in the energy sector, heating sector and transport
II. Increased energy efficiency
The share of individual pillars in achieving final goals is subject to on-going amendments to energy policy, in
the event of appearance of new fundamental phenomena in macroenvironment that require such changes.
Figure 15 symbolically illustrates the mechanism of achieving the final goal, which is the achievement of
climate neutrality by affecting both pillars of energy policy.
Figure 15. The two pillars of the energy transformation in Denmark.
800
EFFICIENCY
700 IMPROVEMENTS
HOUSEHOLDS
600
500
TRADE AND SERVICES
PJ/year
400
300 PRODUCTION
RES (POSSIBLY ALSO CCS) 23
200
WASTE
OTHER RES
100 TRANSPORT BIOGAS
BIOMASS (WOOD)
0 BIOMASS (STRAW)
Energy consumption 2009 WIND
Renewable energy consumption 2009
Source: Government of Denmark 2011, Energy Strategy
Major operational goals of the Agreement of 2012:
• Construction of the next 1500 MW onshore farms and 1800 MW offshore farms
• Development of strategies for buildings to increase energy efficiency
• Conversion of all combined CHP plants from coal to biomass
• Support of the development of local heat sources in RES (biomass and geothermal energy)
• I ntroduction of tax mechanisms and subsidies in order to increase the use of RES in the industry
• Development of intelligent networks
• Development of a financing mechanism for activities related to low-emission transformation (e.g.
transfer of CAPEX expenditures to DNO tariffs, redirection of part of revenues from “carbon taxes”
and excise tax for modernization activities).
In July 2018, the new Danish government signed another Energy Agreement introducing amendments to
the previous one, resulting from changes in the market situation and the growing costs of the RES support
system transferred to final consumers (Figure 16).Good heating practices from Denmark and Germany
Figure 16. The cost of the RES support system in Denmark.
10
9
8
7
6
billion DKK
5
4
3
2
1
0
2002
2003
2006
2007
2008
2010
2011
2012
2013
2009
2014
2015
2001
2004
2005
ENVIRONMENT-FRIENDLY POWER WIND BIOFUELS* DECENTRALISED CHP
SECURITY OF ENERGY SUPPLY COMPENSATION FOR CO2 TAX R&D
*including biomass and biogas
Source: Own analysis on the basis IEA
24
Basic directions of changes to the new Agreement:
• Marketing of RES technologies through the introduction of auction mechanisms as a substitute for
guaranteed subsidies.
• Bringing in the market for heating by eliminating the obligation to connect to district heating ne-
tworks and wider application of the TPA principle, especially for renewable energy sources
• Reduction of the tax imposed on electricity for heating purposes in order to create incentives for
installing (individual and collective) heat pumps.
• Reduction of the taxes imposed on waste energy in order to enable its use inthe heating sector.
• Further development of onshore farms (+2.4 GW by 2030).
It should be emphasized that the goals set out in the Agreement of 2012, such as the withdrawal from coal
in the heating sector until 2030, or total independence from fossil fuels in 2050, remain in force. Analysing
the provisions of the current Agreement, it is expected that the district heating in 2050 will come from
solar sources, from recovered energy (waste), from electricity (heat pumps and electric boilers) and from
biomass cogeneration units (Figure 17).Figure 17. The structure of district heating generation in Denmark (2013-2050).
150
120
90
PJ
60
30
0
2013
2025
2035
2050
2020
CHP HP/ELECTRIC BOILER SURPLUS HEAT
BOILERS SOLAR
Source: Ole Odgaard, DEA, Conference Warsaw 2018
Energy efficiency
Energy efficiency in Denmark has been increasing for many years thanks to the consistent policy of the
authorities and the application of tax incentives and support mechanisms. There has been a permanent
separation of economic growth from final energy consumption for over a decade. In the period from 2005
to 2015, there was a decrease in final energy consumption by 11% despite constant GDP growth. Denmark,
25
under the arrangements with the EU, declared the objective of a reduction (2006-2020) of primary energy
consumption by 14.5%. The energy consumption of Denmark’s GDP is among the lowest in the EU and amo-
unts to 66 toe/million (to compare: Germany 111, Poland 231 toe/million EUR’2010).
The industry, which increased energy efficiency by 25% (2005-2015), has a large share in improving this
indicator. This is the effect of modernization and increase in energy consumption from RES. Among house-
holds and in services, energy efficiency improved by about 5.6% in the last 10 years.
Figure 18. Final energy consumption in the household and service sector.
10
9
8
7
6
Mtoe
5
4
3
2
1
0
1973
1974
1975
1976
1977
1978
1979
1980
1981
1982
1983
1984
1985
1986
1987
1988
1989
1990
1991
1992
1993
1994
1995
1996
1997
1998
1999
2000
2001
2002
2003
2004
2005
2006
2007
2008
2009
2010
2011
2012
2013
2014
2015
HEAT ELECTRICITY BIOFUELS AND WASTE NATURAL GAS
COAL PETROLEUM AND PRODUCTS SOLAR* *negligable
Source: IEA Denmark 2017Good heating practices from Denmark and Germany
The policy of Denmark is oriented towards achieving the goals set by the EU. The ministries and local admi-
nistration implement appropriate action plans for this purpose. In 2017 Denmark forwarded the National
Action Plan on energy efficiency to the European Commission.
National Action Plan on energy efficiency
Denmark will reduce primary energy consumption by 14.5% by 2020 compared to 2006.
and DNO distribution companies (heating, gas, electricity) have to annually reduce the level
of energy sold by1.5% as a result of actions increasing the efficiency.
In addition, DNOs are subject to Compulsory Energy Efficiency Systems.
According to the Energy Agreement of 2012, all DNOs must annually reduce
the final energy consumption from 2.6% to 3%. The goal is set for each year. For example,
in 2016, 43% of reduction target was for industry, 29% for households, and 19% for the service sector.
Obligatory national efficiency goals have generated a number of new types of services and business models.
Recognizing activities in the area of efficiency as a priority, staff in competent offices was strengthened
26
and the Energy Efficiency Centre was established in order to better monitor and support the activities.
High taxes on energy from non-renewable sources also stimulate the modernization of buildings to reduce
operating costs. In addition, in 2014, the Building Renewal Strategy was developed, which will consequently
reduce energy consumption by 35%.
Building Renewal Strategy
Activities regarding all buildings:
· Tightening energy standards, excluding windows
· Tightening energy standards for windows
· Improving energy standards for installations in buildings
· Ensuring compliance with provisions regarding buildings
· Introducing voluntary energy classes for the existing buildings
· Tightening high energy standards for new buildings
· Improving the flow of information and communication with regard to energy efficiency
· Commitments for energy companies to improve energy efficiency
· Ensuring an effective energy labelling system for buildings
· Providing analytical support in the process of preparing thermal modernization of buildings
· Providing effective financing mechanisms for thermo-renovation
· Development of a comprehensive policy for constructionActivities aimed at single-family buildings:
· Strengthening thermal renovation operations through the “Better House” program
· Increased use of heat from RES instead of heat from oil and gas
Activities aimed at multi-family, service and administrative buildings:
· Development and implementation of a public tender model for a guaranteed
level of energy reduction
· Thermal modernization of municipal buildings
· Thermal modernization of private buildings for rent, housing co-operatives
and associations of house owners
· Thermal modernization of buildings for commercial rent
· Actions undertaken in order to improve the energy efficiency of public buildings,
as a model for owners of other buildings
Actions aimed at strengthening competence and innovations in order to accelerate
the growth of energy efficiency:
· Strengthening education and developing competences in the field of energy efficiency
· Strengthening research and development programmes and launching
27
demonstration projects in the area of energy efficiency
Source: IEA Denmark 2017
“Better House” program
The programme was introduced on 1 January 2014 in order to promote the energy efficiency
of individual residential buildings. As part of this programme, the points of complex
service offering expert advises to the house owners were created. The programme concentrates
on all forms of energy consumption, i.e. heating, cooling, heating of water and lighting.
As part of this programme, training for architects, engineers, contractors, energy consultants
and designers is provided. Additionally, the programme focuses on financing mechanisms
for property owners.
Source: IEA Denmark 2017Good heating practices from Denmark and Germany
5.5. Main stakeholders of the energy sector and their competences
Stakeholder Competences
Ministry of Energy, Enterprises This is, among other things, responsible for climate strategies and policies of the broadly
and Climate understood energy sector.
Monitors the energy market and the energy resources market. Publishes price forecasts
Danish Energy Agency of resources and energy, CAPEX and OPEX values for various types of technologies
(Energistyrelsen, DEA) as well as external energy costs. This information is used to perform analyses of socio-
economic costs and profitability analyses of new projects in the energy sector.
The Danish Energy Regulatory
The scope of rights and responsibilities is similar to the Polish ERO.
Office
The Energy Board of Appeal A final administrative appeal body with regard to the decisions of public authorities.
An independent body of experts that advises on transformation issues towards a low-
Danish Climate Change Council
emission society.
An independent advisory body composed of representatives from science and industry.
The Energy Board
Supports the work on the Energy Agreement. Develops suggestions for energy policies.
Regional authorities play an important role in implementing national energy and
climate change policies by creating local urban and industrial development plans. Local
28 Regional and urban self-
authorities are responsible for energy projects (wind energy, biomass, biogas and
government authorities
photovoltaic) and for district heating. Many municipalities are also the owners of local
heating and power companies.
Particular attention should be paid to the high competences of regional and urban local government au-
thorities, which guarantee that energy projects are adapted to the national strategy of development and
environmental protection.
Planning of heating networks in municipalities
Each area of the municipality is divided into energy regions. On the basis of the analysis of the availability
of district heating or natural gas, an administrative decision is made as to which areas should be supplied
with district heating or gas. In rural areas, more individual solutions, such as oil heating and biomass and
heat pumps are usually permitted.
External costs of emissions
The Danish Energy Agency (DEA) publishes a report containing the socio-economic costs of energy for
different types of fuel, technology and level of energy use (large power stations, heating networks, final
users). Moreover, DEA publishes general emission factors and costs of emissions to the environment (NOX,
SOX and PM 2.5) based on current health costs as well as typical capital expenditure (CAPEX) of various
technologies. The calculation of external costs must be included in the calculation of socio-economic costs,
which are a permanent element of the feasibility studies of new energy projects. The methodology and
data published by the DEA ensure that all project calculations are subject to objective evaluation, and localauthorities select and accept projects on the basis of comparable analyses. The Table below shows example
values of external costs published by the DEA. The external costs of pollutant emissions are about three
times lower in the case of municipal heating stations than in individual households. This is due, among other
things, to the type of technology, greater dispersion of pollution, the quality of environmental protection
devices and distances from settlements.
Tab. 3. External costs of pollutant emissions depending on the source (EUR / kg)
Costs of emissions SOX NOX PM2.5
Individual households 3.9 2.4 11.1
Industrial combustion
1.8 1.3 3.6
installations
Large combustion
installations (district 1.3 0.9 3.1
heating)
Source: Assumptions for socio-economic calculations in the energy sector, Danish Energy Agency
29
Gas enterprises
The Danish TSO (transmission system operator) Energinet bears full responsibility for the supply of natural
gas to Denmark and is the owner of the natural gas transmission system and two gas storage facilities. Ener-
ginet is owned by the Ministry of Energy, Enterprises and Climate. The natural gas distributors in Denmark
were until recently divided into three gas companies: HMN, Danish Gas Distribution (DGD) and Nature
Energy. HMN is owned by 57 municipalities, and Nature Energy is owned by eight municipalities. Until
recently DGD belonged to the Danish energy company Ørsted (formerly DONG Energy), but is currently
owned by Energinet (owned by the state). Energinet plans to take over two other natural gas distribution
companies (HMN and Nature Energy).
Energy enterprises
• TSO (Energinet) is responsible for the entire electricity transmission system and it ensures security
of energy supply. It does not have its own generation units.
• E
nergy producers - the main producers are CHP plants and wind farms. Centralized CHP plants are
owned by Ørsted or local heating companies. Decentralized CHP plants are usually owned by local
multi-utility companies.Good heating practices from Denmark and Germany
5.6. Law shaping the heating sector
The Heating Supply Act
The Heating Supply Act of 1979, as amended, is the foundation for the operation and development of heating
networks. Its main unchanging principles are as follows:
• Security of energy supply
• Minimizing the impact on the environment
• Energy efficiency
• Reduction of CO2 emissions.
The stability of the provisions of the Act makes it possible to implement capital-intensive heating investments
with a long payback period. According to the document, the city council, in cooperation with public utilities
and other stakeholders, is responsible for planning heat supply for the municipality area.
General goals of heat supply planning:
• Promoting heating at the lowest socio-economic costs
• Supporting the most environmentally friendly form of heating
• Reducing dependence on supplies of petroleum and other fossil fuels.
30
Two regulations have a particularly significant impact on heating systems: the regulation on the approval
of heating projects2 and the regulation on connections. According to the first of them, the municipality
approves projects concerning the construction or extension of heating systems. One of the basic criteria
for the evaluation and acceptance of projects is the result of a socio-economic analysis. As part of the
standardized method of analysis, a comparison of costs related to the project and costs of impact on society
and the environment is carried out. As a result of the analysis, local authorities accept a project that is more
beneficial from a social and economic perspective.
Requirement to connect to the heating network
In some regions in Denmark buildings must be connected to the heating network or natural gas network. The
municipality decides on the obligatory connection. It does not oblige a tenant to use heat from heating systems,
but it means that even without using heat, tenants have to pay fixed fees related to the readiness to supply
heat. In March 2018, the government announced that it would abolish the obligation to connect in order to
allow for greater market play of alternative sources of heat supply. However, in heating areas where there is
no obligation to connect, some suppliers offer connection discounts and lower energy costs in the initial period
in order to make their offer more attractive and increase the number of heat consumers.
Support mechanisms for cogeneration
The basic support mechanism for a CHP plant is the power fee (readiness to work) paid by the TSO. The fees
are paid to hundreds of Danish cogeneration units (most of them are small plants). As of 2019, the support
2 BEK No. 825 af 24/06/2016”; in Danish “Projektbekendtgørelsen”You can also read