Fingal Spatial Energy Demand Analysis - Codema
←
→
Page content transcription
If your browser does not render page correctly, please read the page content below
Fingal Spatial Energy Demand Analysis
Fingal Spatial Energy Demand Analysis
Report prepared by Codema on behalf of Fingal County Council

Funded by the Sustainable Energy Authority of Ireland’s Research, Development and
Demonstration Programme 2016, with support from the European Union and National
Development Plan.

Authors: Alex Kelly, Energy Analyst
         Donna Gartland, Strategic Sustainable Energy Planner

October 2016
Copyright © 2016 Codema

All rights reserved

Reproduction of the contents is permissible provided the source is acknowledged.

Disclaimer
While Codema considers that the information given in this work is sound, all parties must rely upon their own skill and
judgment when making use of it. Codema does not make any representation or warranty, expressed or implied, as to
the accuracy or completeness of the information contained in this report and assumes no responsibility for the
accuracy or completeness of such information. Codema will not assume any liability to anyone for any loss or damage
arising out of the provision of this report.

Contents
Executive Summary ........................................................................... 6
Introduction ................................................................................... 7
  Context ................................................................................................................................ 7
    Climate Change Challenge ....................................................................................................... 7
    Local Level Energy Planning ...................................................................................................... 8
    The Need for Integrated Energy and Spatial Planning ........................................................................ 8
    Spatial Energy Demand Analysis as a tool for Sustainable Spatial Planning ................................................ 9
  Relating Policy ....................................................................................................................... 10
    EU Policy ........................................................................................................................... 10
    National and Regional Level Policy ............................................................................................. 10
    Analysis of District Heating Potential .......................................................................................... 11
    Local Electricity Production Potential .......................................................................................... 11
    Energy Character Areas .......................................................................................................... 12

Spatial Energy Demand Analysis............................................................ 13
  Introduction .......................................................................................................................... 13
  Energy Use in Fingal ................................................................................................................. 14
  BER and Household Analysis ....................................................................................................... 15
  Residential Sector Energy .......................................................................................................... 17
    Methodology...................................................................................................................... 17
    Results ............................................................................................................................. 18
  Commercial Sector Energy ........................................................................................................ 30
    Methodology..................................................................................................................... 30
    Results ............................................................................................................................ 30
  Municipal Sector Energy ........................................................................................................... 38
  Agricultural Sector Energy .......................................................................................................... 41
    Methodology...................................................................................................................... 41
    Results ............................................................................................................................. 41
  Total Energy in all Sectors ......................................................................................................... 46

Renewable Energy Resources in Fingal ................................................... 54
Conclusion ................................................................................... 59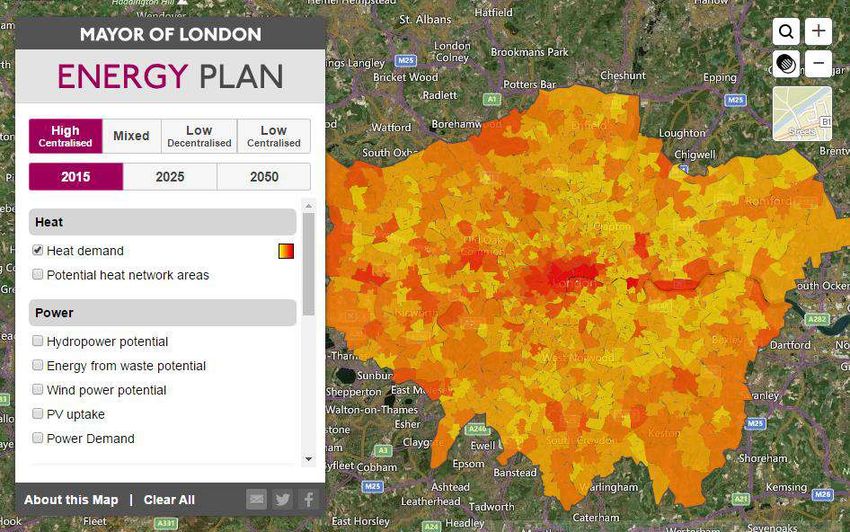
Fingal Spatial Energy Demand Analysis

Glossary of Terms

BER – Building Energy Rating
CHP – Combined Heat and Power
CSO – Central Statistics Office
DH – District Heating
FCC – Fingal County Council
                                 6
GWh – Gigawatt-hour (1kWh *10 )
HH – Household
km – Kilometre
kWh – Kilowatt-hour
                                   3
MWh – Megawatt-hour (1kWh *10 )
PV – Photovoltaic
RD&D – Research, Development and Demonstration
RE – Renewable Energy
SEAI – Sustainable Energy Authority of Ireland
SEAP – Sustainable Energy Action Plan
SECAP – Sustainable Energy Climate Action Plan
SEDA – Spatial Energy Demand Analysis
                                  9
TWh – Terawatt-hour (1kWh *10 )
TJ – Terajoule

                                                 4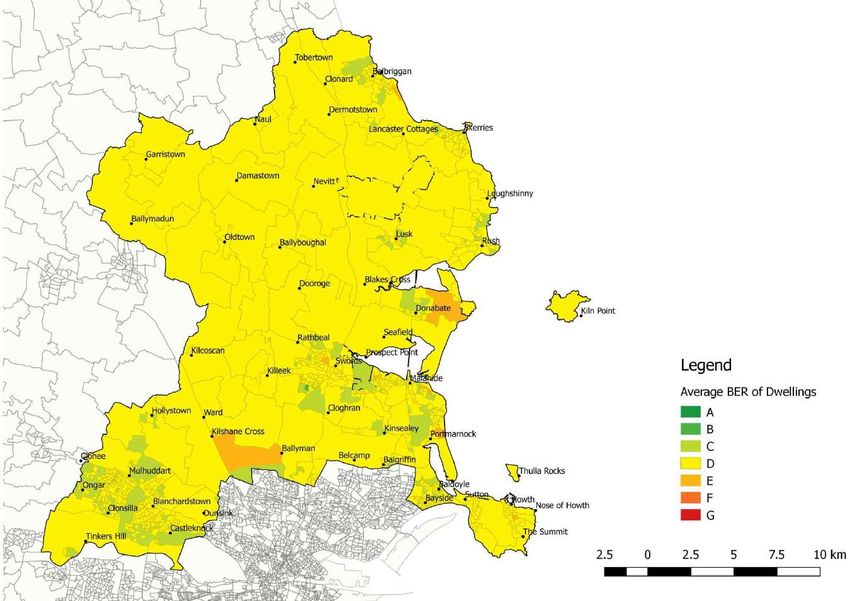
Fingal Spatial Energy Demand Analysis

Executive Summary
This is the first Spatial Energy Demand Analysis (SEDA) produced by Codema for Fingal County Council (FCC). The
analysis was carried out by Codema as part of a Sustainable Energy Authority of Ireland (SEAI) funded Sustainable
Energy Research, Development and Demonstration (RD&D) 2016 project to further develop the SEDA methodology,
which has already been applied to the South Dublin and Dublin City areas. A SEDA involves analysing the energy
demand within a given area and creates a spatial visualisation of this information, resulting in evidence-based energy
maps which can be used as a tool by planners to create effective policies and actions to influence future energy use.
The SEDA seeks to bridge the current gap between spatial and energy planning methodologies at a local level in Ireland,
and builds on the experience of other leading European countries.

The sustainable use of energy and natural resources and the negative impacts of CO 2 on our environment have led to
energy and climate change becoming a major topic in both the public and private sector discourse. The Draft Fingal
Development Plan 2017-2023 identifies the importance of climate change adaptation and mitigation, and the role of
sustainable energy in the county. In July 2016, FCC became the first Irish local authority to sign up to the new Covenant
of Mayors for Climate and Energy. As part of this initiative, FCC will create a Sustainable Energy and Climate Action Plan
(SECAP), and the results of this SEDA will support the creation of the baseline emissions calculations and energy action
areas as part of this plan.

The SEDA methodology has been further developed as part of this SEAI funded project in order to more accurately map
energy in a rural environment. The Fingal county area is the first region in Ireland to have spatially mapped energy use
in the agricultural sector. The results of the Fingal SEDA show exactly where and what type of energy is being used, and
the costs of this energy consumption throughout the county, in each of the residential, commercial, agricultural and
local authority sectors. Over 90,000 dwellings, 6,000 commercial properties and 250 local authority building-based
energy accounts have been analysed in terms of annual energy use, and the results have been mapped in this report.
The mapping is particularly important for locating areas of high heat demand density which is a crucial element in
planning for District Heating (DH) schemes.

The residential sector analysis allowed the identification of the areas in Fingal most at risk of energy poverty, based on
the three most influential factors affecting energy poverty; the energy efficiency of the home, affordability (in terms of
unemployment), and the cost of energy per household. These areas have been highlighted and can be prioritised in
terms of strategies to combat energy poverty within the county. The results of mapping the average Building Energy
Rating (BER) in each of the 938 small areas in Fingal have shown that better building regulations for new dwellings are
effectively reducing the energy demand in new developments, as 53% of homes in Fingal have a BER of C or higher.
However, there are certain areas, such as the Portrane Demesne which have an aging, less efficient housing stock, with
average BERs of E or lower.

Of all building energy demands, heat demand accounts for 75%, and there are almost no indigenous, sustainable
resources used to provide this heat. Thus, when identifying sustainability strategies, heat technologies should be of first
priority in all sectors. One solution to this issue is the development of sustainably fuelled district heating networks in
areas of high demand. In terms of DH analysis, there are a number of residential/commercial areas, such as Swords and
Blanchardstown, with heat densities high enough to be considered feasible for connection to DH systems. Additionally,
there are a number of industrial estates and commercial glasshouses situated on the outskirts of these urban hubs that
could also be connected to these networks. The SEDA has also identified locations of potential anchor loads and waste
heat resources which can be major contributors to a successful DH network.

Overall, Fingal spends over €331 million a year on energy and a large percentage of this money leaves the Irish
economy to pay for fossil fuel imports. Therefore increasing indigenous energy sources is crucial, and this report has
identified solar energy resources as one of the most accessible renewable energy resources in the dense urban areas of
Fingal. There is also high potential for the growth of energy crops in much of Fingal, in areas outside of the urban
centres.

                                                            5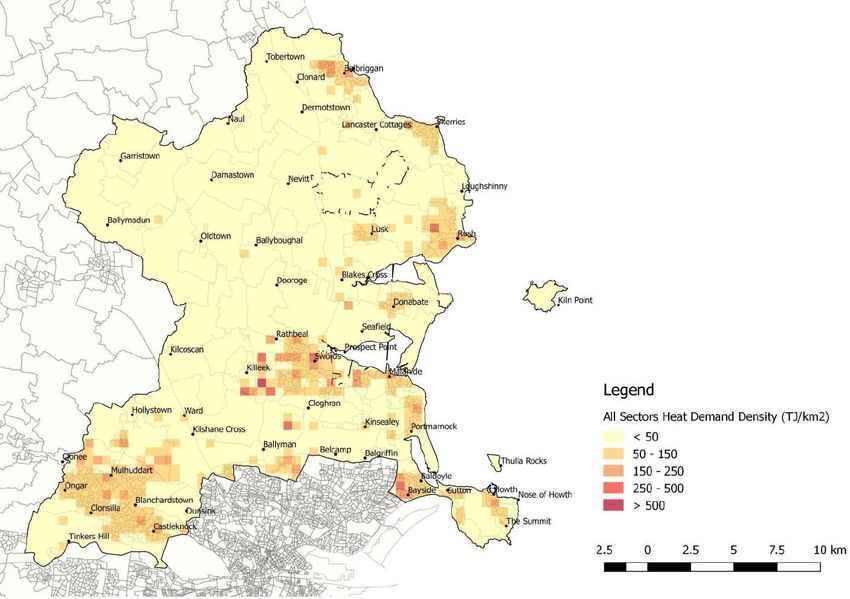
Fingal Spatial Energy Demand Analysis
SECAP for FCC. The SEDA enhances the SECAP in order
Introduction that it can be more effectively integrated with other
action plans and into the planning process. This will
The following report has been produced by Codema on bring energy planning in FCC more in line with other
behalf of FCC and outlines the process and results of European cities that are leading the way in effective
the Fingal SEDA. This analysis has been conducted by local level sustainable energy planning.
Codema as part of a project funded under the SEAI’s
RD&D 2016 call. The project aims to advance spatial Context
energy demand analysis methods in Ireland so that
they are more applicable to the semi-rural and rural
areas found in DLR and Fingal county areas. Climate Change Challenge
This SEDA aims to provide the information required for “Climate change is not an abstract phenomenon
the local authority to increase the uptake of renewable featuring in arcane science journals and measured only
energy through planning, policy and raising awareness. in laboratories. It is present everywhere and perhaps
Up to now, the local authority has lacked any evidence- most harshly and adversely in environments where
based tools for planning for sustainable energy people are least equipped to meet its force and ill
solutions. This SEDA aims to bridge the gap between effects – and least responsible for its causes.”- Michael
energy planning and traditional urban planning within D Higgins, President of Ireland
the local authority, and enables planners to build
meaningful energy policy and effectively shape the Climate change is widely recognised as the greatest
energy future of the county. environmental challenge of our time and the evidence
of such change is already being felt here in Ireland in
The analysis focuses on the current energy demand terms of rising sea levels, extreme weather events and
and the fuels that are used to provide such energy changes in ecosystems. A recent publication co-
within the Fingal area, and places this data within a authored by the UK’s Royal Society and the US National
spatial context. Creating these maps helps to identify Academy of Sciences, ‘Climate Change: Evidence &
opportunities, synergies and constraints in different Causes’, states that the speed of global warming is now
county districts. This detailed mapping process 10 times faster than it was at the end of the last ice
provides a visualisation of many aspects of energy use age, with the last 30 years being the warmest in 800
1
and its effects within each small area in Fingal, such years (The Royal Society & The US National Academy
as: of Sciences, 2014). The report also concludes that the
latest changes in our climate are “almost certainly due
Building Energy Ratings to emissions of greenhouse gases caused by human
Energy use per dwelling activities” (The Royal Society & The US National
Energy spends per dwelling Academy of Sciences, 2014, p. B9). This publication is
Fuels used for heating dwellings just one of a multitude of evidence and research-based
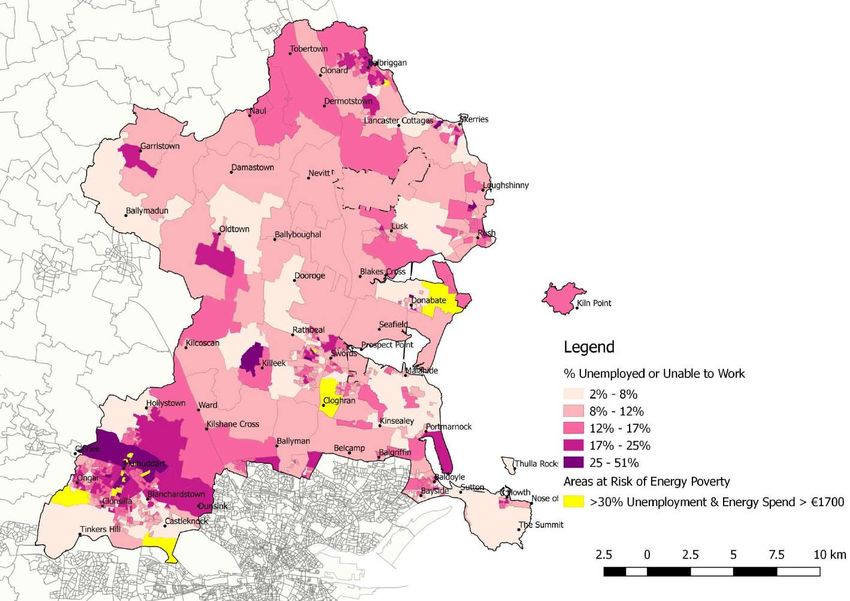
Areas of high commercial energy use papers which show irrefutable evidence that
Areas at risk of energy poverty Greenhouse Gases (GHGs) are responsible for climate
Areas of high fossil fuel usage change and it is imperative to act now in order to
Areas with high electrical usage curtail the irreversible damage caused by these
Heat demand density emissions.
Fossil fuel use is responsible for over half of all GHG
These maps provide the local authority with the emissions globally, and the majority of these emissions
information needed to target areas most in need of, come from energy supply, transport, residential and
and most suitable for, Renewable Energy (RE) commercial buildings and industry (IPCC, 2007).
solutions. In particular, the areas with high heat
demand density which are deemed most suitable for The Irish Government has already committed to
large scale DH schemes are identified. DH schemes are reducing emissions at a national level, and the
a proven way to integrate high levels of RE into dense significance of Fingal in the Irish economic landscape
urban areas such as those found in many parts of means it is imperative to plan and commit to energy
Fingal. saving and CO2 reduction at a local level in order to
help meet national level targets from a bottom-up
This SEDA is only one of four to be developed in Ireland approach. It is particularly important for urban regions
and is seen as the next coherent step to prepare the to look to integrate renewable electricity sources as
close to the demand as possible, which leads to
1 reduced losses during transport of renewable
A ‘Small Area’ is the smallest geographical breakdown used in
electricity. This also has the significant effect of
Ireland for statistical purposes.
6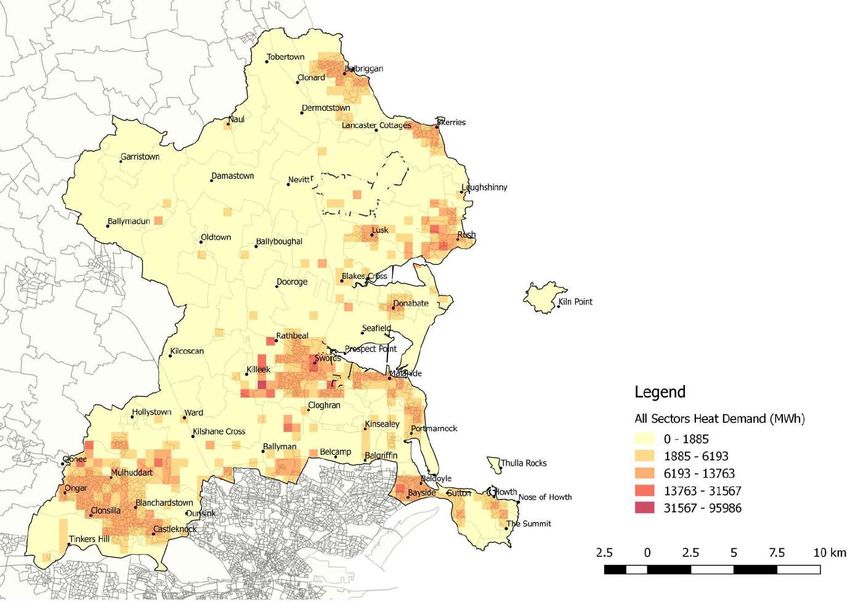
Fingal Spatial Energy Demand Analysis

decreasing the burden on rural areas to produce                 households. Studies have shown that this increased
renewable electricity, particularly in the midlands and         use of CHP and DH has reduced overall nationwide
the west, where large wind farms can in some cases              emissions by 20%, and reduced CO2 emissions in the
                                                                                                                    2
have negative impacts on these communities.                     heating sector by 60%. There is currently 386,234 m
                                                                of solar heating being used in municipal DH projects,
There are many significant additional benefits to               along with other sustainable sources such as biomass
reducing CO2 levels and implementing more renewable             and waste heat. The use of local energy planning in
energy in Fingal, including reduced health effects,             Denmark has reduced energy costs to consumers,
decreased fossil fuel dependence, higher security of            enabled higher integration of renewable energy,
supply, lower energy costs, increased energy price              reduced energy demand and reduced the overall
stability, increased economic competitiveness and a             impact on the environment.
sustainable economy.

                                                                The Need for Integrated Energy and Spatial
Local Level Energy Planning                                     Planning
Conventionally, energy planning is implemented at a             The increasing need for society to change to more
national level and not effectively addressed within local       sustainable forms of energy supply to combat climate
or regional level planning structures in Ireland.               change and meet growing demands means that space
Experience from other countries has shown that                  is now a fundamental asset for energy production. This
national policies on energy which are specifically              is due to the fact that renewable energy is an area-
designed to address energy use from a national level            dependent resource, e.g. space and suitability of land
perspective can make it hard for local authorities to           for bio-fuel crops, for wind farms, for solar energy, or
fully address energy consumption due to the structure           for hydro-power. (Stoeglehner, Niemetz, & Kettl,
of the national policy framework, and the lack of               2011). Energy production now enters the competition
autonomy and flexibility conferred upon them in the             for space with many other products and services that
energy sector (Sperling, Hvelplund, & Mathiesen,                are reliant on space, such as food production and
2011) (Chittum & Ostergaard, 2014). This leads to local         property development.
authorities not having the knowledge or experience to
make strategic decisions on how energy is or will be            Also, the feasibility of DH and CHP systems is
provided in their locality.                                     dependent on many spatial and urban planning related
                                                                factors such as heat demand density and zoning of
In contrast, local level energy planning is routine in          building uses, which reinforces the inseparable nature
many other European countries, in particular Denmark,           of spatial planning and energy planning.
Sweden and recently re-municipalised areas in
Germany. Laws were first introduced in Denmark in               In order for planners to evaluate the feasibility of
1979 requiring municipalities to carry out local level          integrating a range of renewable energy resources,
energy plans, and this regulatory framework has been            they will need to develop a SEDA type tool in order to
credited with creating the base for the sustainable             ‘read the energy landscape’ (Pasqualetti, 2013). A
growth Denmark has seen in the years since. These               SEDA allows planners to locate where the large energy
planning laws required municipalities to conduct                demands are, what type of energy is required in these
analyses of their local heating requirements and the            locations, i.e. heat, electricity, gas, etc., the areas
available heat sources, and municipalities were also            susceptible to energy poverty due to high energy costs,
made responsible for assessing future heating needs             and areas of high fossil fuel use.
and supplies and planning around these. In the 1980s,
the government introduced laws to ensure that all               Economic development in Dublin has been, so far,
energy projects had to be assessed by taking account            driven mainly by resources that have no immediate
of the full socio-economic costs and benefits, and              geographic link to the area exposed to planning. The
based on this, municipalities should only pursue                fossil fuels and electricity that will be used during the
projects which show a high level of socio-economic              lifetime of a development have, in most cases, no
benefits (Chittum & Ostergaard, 2014).                          influence on its location as it can be simply connected
                                                                by pipe or cable to some far-off location. In this way,
These laws resulted in high levels of locally produced          spatial planning is not currently linked to energy
heat and electricity in the form of Combined Heat and           resource management. The planning system now faces
Power (CHP) and DH systems with integrated                      the new challenge of taking account of, and creating
renewable energy sources. Today, around two thirds of           balance between, designing cities to reduce energy
Danish electricity is cogenerated with heat, and heat is        demand, retaining sufficient space for sustainable
supplied through DH systems to 60% of Danish                    energy production, and providing energy from local

                                                            7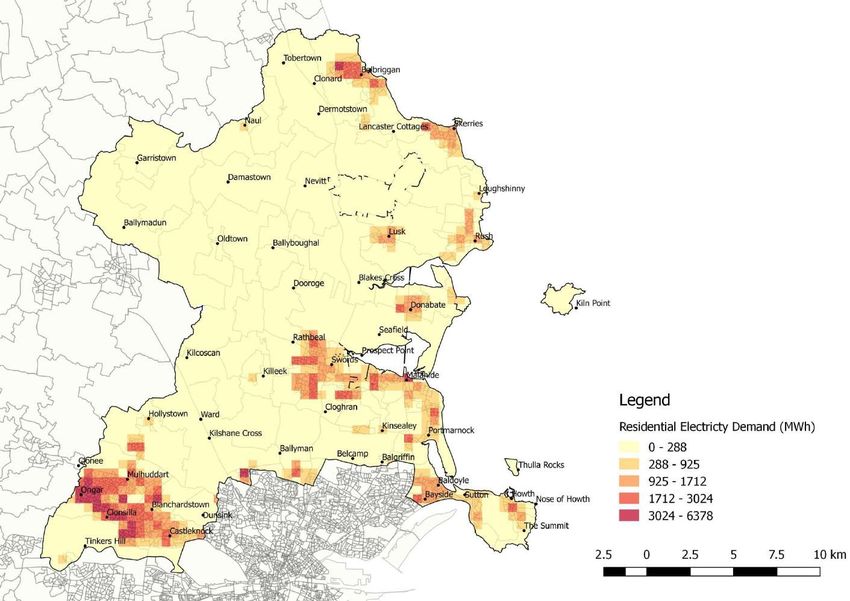
Fingal Spatial Energy Demand Analysis

resources, while also evaluating             social   and       issues for heating and transport in comprehensive
environmental considerations.                                   planning” is one of the four ‘leaps’ to effective
                                                                sustainable energy planning, and documenting the
                                                                current energy effects of heating, cooling, electricity
Spatial Energy Demand Analysis as a tool for                    and transport allows the development of future
Sustainable Spatial Planning                                    scenarios for energy and transport (Ranhagen, 2011).
Energy mapping resources are used by energy planners
in local authorities throughout Europe and are often            These maps are then used by the municipality’s energy
referred to as the first step in the energy planning            planners to decide which areas are most suitable for
process. It is the foundation for planning for current          DH or individual heating solutions such as heat pumps
and future predicted energy consumption at a local              or solar thermal, and integrate the findings into future
level. It allows the planner to define ‘energy character        scenario development. This Fingal SEDA uses similar
areas’, based on the estimated energy demand and                methodologies for mapping energy demands to those
supply characteristics, and the RE potential of that            that are typically used in Swedish and Danish energy
area.                                                           planning.

There are many examples of best-practice energy                 Once this initial step is complete, deeper techno-
mapping from European towns and cities, such as the             economic analysis and energy system modelling of an
                   2
London Energy Map , the Amsterdam Energy Atlas ,
                                                  3             identified energy character area allows the planner to
                             4
and the Scotland Heat Map . An example of the                   judge if the area is technically and economically
London Energy Map is shown in Figure 1.                         feasible to implement the recommended sustainable
                                                                energy solutions.
The Swedish Energy Agency’s guide to sustainable
spatial planning outlines how “integrating energy

                                                                                 Figure 1: Heat Demand Map of London City
2
 https://www.london.gov.uk/what-we-
do/environment/energy/scenarios-2050-london-energy-plan
3
  http://maps.amsterdam.nl/
4
  http://heatmap.scotland.gov.uk/

                                                            8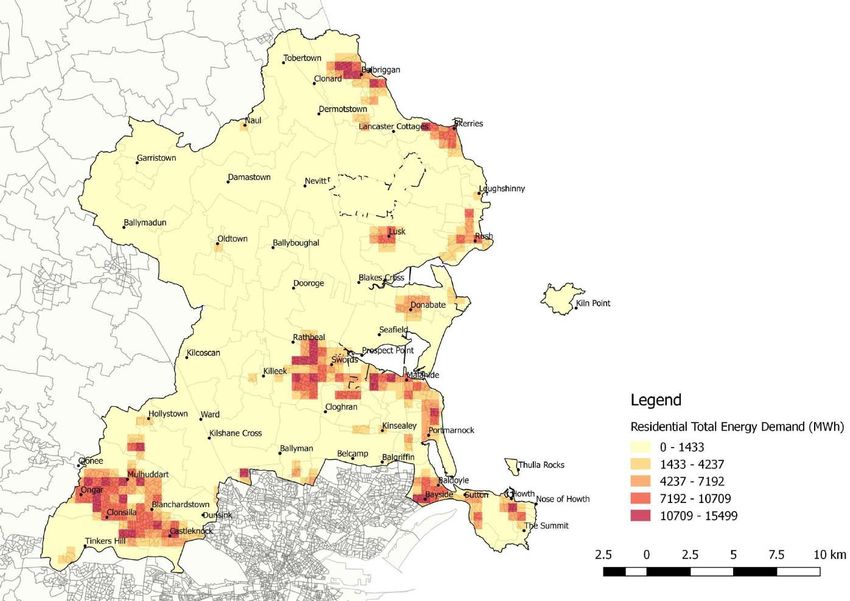
Fingal Spatial Energy Demand Analysis
Relating Policy
which has set a 40% GHG reduction on 1990 GHG
EU Policy levels, and an EU-wide target of 27% for renewable
energy and energy savings by 2030. Under this
The European Union (EU) puts in place a framework for framework, Ireland has a binding national target of
energy for all member states called the ‘2020 Climate 5
20.4% reduction compared to 2005 emission levels.
and Energy Package’. This set binding legislation for all The new GHG targets are aimed at the non-Emissions
member states so that the EU as a whole will achieve Trading Scheme (ETS) sectors, which cover transport,
20% GHG emission reductions, 20% energy produced buildings, agriculture, waste, land-use and forestry.
by renewable resources, and 20% increase in energy
efficiency by 2020. Of these sectors, transport and buildings are the
largest contributors of emissions from fossil fuel
From this overarching EU climate and energy package, consumption, and heating is the largest energy use in
there are directives which set specific targets for buildings. For example, 75% of the average
renewable energy for each member state and outline household’s final energy consumption is used for space
the measures to be put in place for energy efficiency. and water heating (SEAI, 2013). There now needs to be
a stronger focus on energy efficiency and renewable
The EU Energy Efficiency Directive 2012/27/EU, and fuel sources in the heating sector in order to reduce
Renewable Energy Directive 2009/28/EC have resulted energy related GHG emissions and contribute to
in national level energy action plans in each area meeting Ireland’s binding EU 2020 and 2030 targets.
respectively. In terms of the Renewable Energy
Directive, Ireland has been set a target of 16% of all This SEDA will also allow FCC to stay on top of energy
non-Emission Trading Scheme (ETS) energy issues and help to future-proof the county for new
consumption to come from Renewable Energy Sources energy legislation past 2020.
(RES) by 2020, the sectorial split being 40% electricity,
12% heat and 10% transport energy. Latest figures
(2014 energy figures) show Ireland’s renewable energy National and Regional Level Policy
in electricity is at 22.7% of gross electricity
The National Renewable Energy Action Plan (NREAP)
consumption, renewable heat is at 6.5%, and
and National Energy Efficiency Action Plan (NEEAP) are
renewables in transport at 5.2%. Therefore, Ireland is
a direct result of the overarching EU Directives
approximately half-way towards 2020 targets with four
previously discussed. These outline how Ireland
years left to improve. This SEDA aims to increase the
intends to implement the energy efficiency and
use of renewables at a local level in order to contribute
renewable energy targets set by the European
towards overall national level targets.
Commission. This SEDA aims to help fulfil the goals of
the NREAP and NEEAP by developing renewable energy
Although there are no binding targets for energy
and energy efficiency at a local and regional level
efficiency, there are binding obligations on each
within Fingal, and developing strategic energy action
member state. Of particular relevance to this regional
plans specifically tailored to the energy characteristics
level SEDA, Article 14 of the Energy Efficiency Directive
of the area.
on the ‘Promotion of efficiency in heating and cooling’
states:
The Department of Communications, Energy and
6
Natural Resources outlines the pathway to 2030 in the
“Member States shall adopt policies which encourage report “Ireland’s Transition to a Low Carbon Energy
the due taking into account at local and regional levels Future 2015-2030” and addresses priorities areas
of the potential of using efficient heating and cooling relating to energy policy:
systems, in particular those using high-efficiency
cogeneration. Account shall be taken of the potential Empowering Energy Citizens
for developing local and regional heat markets.” Delivering Sustainable Energy
Energy Security
The SEDA will help to identify the most appropriate Regulation, Markets and Infrastructure
sustainable energy solutions for heating the current
and future building stock in Fingal.
5
The GHG target is 30%, but there have been allowances for
In October 2014, due to there being no clear land-use and ETS flexibility which will reduce the overall target to
framework post-2020 targets, the EU put in place a approximately 20.4%.
6
new ‘2030 Framework for Climate and Energy Policies’, Now known as the Department of Communications, Climate
Action and Environment
9Fingal Spatial Energy Demand Analysis
Energy Costs There are currently no large scale DH systems in
Innovation and Enterprise Ireland, and little or no financial or policy supports for
The SEDA will help to address the priorities DH systems. Due to this lack of experience, and
surrounding planning essential energy infrastructure difference in support mechanisms between Denmark
and creating a more sustainable energy system within and Ireland, it is better to look to first-phase
Fingal. The SEDA allows FCC to take some control and development of large scale DH in areas with the
have some influence over the energy used within the highest heat demand densities available. The Danish
2
region, which can now be used as a bottom-up 150 TJ/km threshold can then be used once a large
approach to meeting the new energy policy priorities. scale DH scheme has been initiated and looking to
expand. Increasing the minimum density threshold for
The Regional Planning Guidelines for the Greater viability will also allow for potential errors in energy
Dublin Area (GDA) 2010-2022 provide planning estimations made in this study.
guidance on economic, infrastructure and settlement
policies for the GDA which includes Fingal. These With a DH system there is opportunity to use heat
guidelines specifically support the implementation of from one or many sources, which may or may not rely
local level energy action plans, and also suggest they on the location’s characteristics. Fuel can be imported
“… should be presented in a spatially geographic in most cases to fuel boilers or CHP units, but will be
manner where possible in order to provide an extended better placed if close to major road networks for oil or
7
evidence base in the decision making process”. biomass deliveries. Waste heat , mainly sourced from
industrial processes, is an ideal input into DH systems
This SEDA will fulfil these suggestions under the as it is a potentially low cost source and utilises energy
Regional Planning Guidelines, and FCC will be one of that would otherwise be considered a loss, therefore
the first local authorities to do so, and which will pave increasing efficiencies. There are likely to be many
the way for other local authorities to follow suit. industrial process waste heat resources in the county,
such as waste heat from existing power plants,
breweries and waste water treatment plants, and the
Analysis of District Heating Potential potential to use such resources in Fingal should be
DH is a key technology for urban regions to investigated further. Other low cost fuels for DH
decarbonise their heat supply. ‘A Guide to District systems can come from geothermal sources, heat
Heating in Ireland’ (Gartland & Bruton, 2016) is a good pumps or solar thermal farms which are now common-
source of information on the basics of DH and how DH practice solutions in Danish low temperature DH
can be developed in Ireland. systems. Smart grid enabled electric boilers and heat
pumps incorporated in DH supply systems which are
The heat consumption will be shown in terms of ‘heat timed to switch on/off when electricity prices are
density’, as the areas mapped vary in size and it is low/high can take advantage of low electricity costs
important to compare all on an equal parameter, such and also help to integrate more fluctuating renewable
2 energy on the grid.
as terajoules (TJ) per km . Mapping heat density is
important as it is a key metric for defining the potential
for large scale DH.
Local Electricity Production Potential
It is important to analyse DH potential as heating and The regulations in Ireland forbid the provision of what
cooling are fundamentally local and regional matters, is termed a ‘private wire network’. This means that you
and are often not dealt with effectively at a national may not supply electricity to other buildings which are
level. Danish municipalities carry out heat planning not on the same property as the building which is
studies and judge an area to be suitable for DH based producing the electricity. This means, if a building is
on the measurement of heat density, usually given in producing electricity and there is a surplus to what
2 2
TJ/km , with any areas measuring above 150TJ/km they require to cover their own demand, they must
deemed technically and economically suitable for release this surplus electricity through the national
developing conventional DH systems. The density is grid, or store in some way for their own future use.
specifically important for DH economic viability as it There are possibilities for large producers to establish
becomes cheaper to implement when buildings are contracts and sell this surplus to the grid, but there is
closer together due to shorter pipelines requiring less
investment costs, and therefore the system becomes
more cost-effective than individual solutions
(Connolly, et al., 2014). Also, shorter pipelines result in
fewer losses and less pumping requirements, which 7
Waste heat is heat which is lost to the atmosphere during
can reduce running costs significantly. industrial and manufacturing processes, rather than heat
obtained from waste.
10Fingal Spatial Energy Demand Analysis
8
currently no electricity supplier offering payments for In contrast, town centres or areas of regeneration
9
surplus energy to micro-generation units. which have a high building density made up of old and
new buildings with mixed use such as hotels, offices,
This means, when analysing electricity demand of retail and apartments, are more suited to development
buildings and possible local sustainable solutions to of large scale heating and cooling networks. Although
meet this demand, it will be in terms of individual there will be numerous building owners and facilities
systems per building rather than in terms of group managers involved, these building types are likely to be
electricity schemes. This limits the possibilities for accustomed to the processes involved in procuring
technologies such as CHP units as they will be more energy services and therefore will be more likely to
suited to industrial or large commercial consumers engage in projects offering energy savings.
who have large electrical and heating requirements,
and who can apply for grid connections, or in large Once these areas have been defined as suitable for
district heating systems where the sale of electricity to individual or group energy schemes, the energy
the grid can help to offset the costs of heat production. character areas can be defined further by overlaying
renewable energy potential mapping in order to see
In terms of individual building renewable electricity which areas are most suitable for development of RE
solutions, the main technologies used which are at an supply. For example, areas suitable for group energy
advanced stage are wind turbines, solar photovoltaic schemes which are located in peripheral semi-rural
(PV) panels and hydro-power turbines. The potential to areas may be situated close to bio-fuel supplies
use these technologies will depend on the building’s produced within the region, and can therefore agree
location in terms of space for wind turbines and wind long term supply contracts with local suppliers and
speeds, south-facing roof space and over-shading, and benefit from low transport costs.
proximity to a suitable hydro source, respectively.
Biomass-fed CHP units are another alternative to It is important to note that the resulting specific energy
producing renewable electricity, and are not characteristics of each small area will have a different
dependent on locational characteristics, as biomass best-fit energy solution, which may incorporate energy
can be imported like any other fuel. Again, biomass savings and/or a mixture of technologies. There is no
CHP units are more suited to commercial or industrial one definitive energy solution that is applicable to all
circumstances than households due to high upfront areas, and once an area is identified for further
costs and the size of demand needed to ensure investigation it is important that all available solutions
economic viability. are evaluated in terms of socio-economic cost-
benefits. The main attributes to consider when
assessing the economic feasibility of implementing
Energy Character Areas various energy solutions will be the availability and
Energy demand mapping is used as a tool in energy suitability of low cost renewable sources in the area,
planning to define energy character areas. The the cost to retrofit current energy systems, and the
individual energy characteristics of an area are used by current and predicted future costs of the fuel source
planners to define the appropriate energy solutions or being replaced.
planning policies to be considered for strategic
development zones, local area plans or county-wide All energy data used in this SEDA is based on delivered
development plans. energy and not primary energy consumption, and
therefore losses involved in delivering the energy, i.e.
For example, an area with mature residential dwellings electricity transmission grid losses, are not accounted
in low density suburbs can often have poor thermal for.
performance and therefore high heat demands per
building. In most cases, these areas have little variety The following sections in this chapter outline the
of building use and many different building owners, results and methodologies of each area of energy use,
which make it less favourable for communal energy namely residential, commercial, agricultural and
solutions and more suited to individual micro- municipal building energy, and the overall total energy
generation technologies such as solar thermal and heat use in Fingal.
pumps.
8
There was a payment available through application to the ESB
for micro-generation, but this scheme ceased in December 2014.
9
Micro-generation is termed as generators rated up to 25 Amps
on single-phase systems (most household systems are single-
phase) or 16Amps on 3-phase systems (ESB, 2015).
11Fingal Spatial Energy Demand Analysis
and the CSO, and is designed as the lowest level of
Spatial Energy Demand geography for the compilation of statistics. Within the
small and densely populated urban areas, SAs provide
Analysis a very suitable method of mapping spatial energy
demand. However, when mapping the more rural
areas in Fingal, it can be difficult to assess where the
Introduction demand is concentrated within these large, sparsely
This section outlines the methods and results of populated SAs. For this reason, the energy demand of
calculating and mapping current energy consumption Fingal will primarily be mapped on a 500m x 500m grid,
in buildings within the Fingal area. Currently there is no developed for the purpose of this report.
publicly available actual energy consumption data for
every building in Fingal, and therefore a methodology This report presents Fingal's energy consumption over
was devised in order to estimate energy use in every 2069 individual grid squares. This gives a more refined
building based on best available evidence based data, spatial breakdown than 941 individual SAs.
and attach this information to a geographic location to Additionally, the uniformity of the grid distribution
visualise it spatially. The methodology was developed means that each square is directly comparable. This is
by Codema for South Dublin and Dublin City’s SEDA, particularly important when assessing heat density for
and this analysis follows the same methodological district heating purposes. As can be seen in Figure 2,
process. A new methodology was developed this scale of grid format provides a more detailed level
specifically for the energy mapping of Fingal in order to of analysis for the large SAs and a more amalgamated
quantify and map the energy use within the breakdown for the smaller, more densely populated
agricultural sector. This is the first time this sector's SAs. As the European standard is to perform Spatial
energy consumption will be analysed at this detailed Energy Demand Analyses on a 1km x 1km grid, it is
level, and the methodology is described further in this considered that a 500m x 500m grid will provide
report. The data is accumulated and analysed through satisfactory detail in results while also relating to the
the use of MS Excel software and mapped using QGIS scale of Fingal.
open-source mapping software.
The commercial and municipal energy calculations
From analyses of spatial demand mapping practices in include location point specific information, thus making
other countries, and the availability of matching data it easy to attach and amalgamate to any grid size.
across all sectors, the main sets of energy data which However, it is necessary to attribute the aggregated
will be created and mapped are: residential energy demand of the SAs into a grid of
similar proportions. This is achieved by breaking down
Total Energy Demand all SA shapes into small grid squares. Each grid square
Total Heat Demand is then assigned a portion of the SA's residential energy
Heat Demand Density information, proportionate to the level of housing
Total Electricity Use present in this grid square. The level of housing is
Total Fossil Fuel Use determined using a digital (OSI) map, showing building
Total Annual Energy Costs footprints in Fingal. This provides a more accurate level
of spatially related energy demand for all sectors.
There will also be a breakdown of the energy use into
the four sectors of Residential, Commercial/Industrial, While the grid format is used as the primary means for
Agricultural and Municipal energy use, which will each representing energy information in this report, the
have their own relevant maps created. For the initial five maps will be presented using SA
residential sector, there will be additional maps breakdowns. The reason for this is that these maps,
created, for example, showing average BER ratings in (Figures 6, 8, 9, 10 and 11), all represent information
each area and areas at high risk of energy poverty. either solely dealing with BER data or data which is
These maps will outline areas in need of energy calculated "per household". This means that this
retrofitting and areas which may be suitable for various information is intrinsically linked to SA data and
energy technologies. presenting the information on grids would serve no
additional purpose other than pixelating the image.
The residential data acquired from the Central
Statistics Office (CSO) is aggregated by the
geographical breakdown of ‘Small Areas’ (SA). A SA is
an area of population comprising between 50 and 200
dwellings, created for Ordnance Survey Ireland (OSI)
12Fingal Spatial Energy Demand Analysis
Swords Swords
Ward River Ward River
Ridgewood Ridgewood
Figure 2 : Map Showing Example of Small Area (SA) Breakdown (left) and Grid Breakdown (right) in Fingal
Energy Use in Fingal
Using the current European best practice
methodologies in energy demand analysis, it is possible
to calculate the overall energy use for all buildings in Total Energy Total Heat Total Costs
Fingal. This is broken down for each sector in total Sector (TWh) (TWh) (€millions)
energy demand, heat demand and annual costs in Residential 1.99 1.70 170.78
Table 1.
Commercial 1.38 0.76 143.27
As is evident in Table 1, the residential sector accounts Municipal 0.03 0.01 2.46
for the largest portion of energy consumption in Fingal, Agricultural 0.62 0.53 15.29
at 50%. However, there is also a significant amount of Total 4.02 3.00 314.52
commercial activity present, primarily in industrial
facilities located in large industrial estates such as Table 1 : Representation of BERs in Each Postcode Area
Ballycoolin. This serves to spatially disperse the energy
demand away from the urban hubs of Swords and
Blanchardstown. The addition of a considerable
agricultural sector, including high energy consuming
horticultural glasshouses, further decentralises the
consumption of energy away from these built up areas.
The interaction of energy consumption between the
various sectors will be examined in the following
sections.
The latest figures estimate that less than 3% of all
building energy use in Fingal comes from locally
produced renewable energy, as shown in Figure 3, and
instead there is a large dependence on imported fossil
fuel sources such as gas and oil. The 3% ‘other’ fuel
used in buildings includes peat, biomass and other
renewable sources such as solar thermal. There is
access to the gas grid in most urban areas of Fingal,
and gas is therefore the main heating fuel, with oil
being the dominant heating source in the more rural Figure 3: Final Energy Use in Buildings by Fuel Type Fingal
areas of Fingal. The national electricity supply is also
based predominantly on gas-fuelled power plants. This
means Fingal is very susceptible to price increases and
13Fingal Spatial Energy Demand Analysis
shortage of supply of gas in the European market. analyse the housing stock by type, period built and
Ireland imports around 95% of its natural gas spatial distribution per small area. The breakdown of
10
requirements , meaning billions of euros are exported the total Fingal housing stock is shown in Figure 4.
to pay for these resources every year. If Fingal could
increase its ability to meet even a small percentage of The most common housing type in Fingal is semi-
its energy demand with local sustainable resources, it detached housing, accounting for 44% of total
could retain a substantial amount of money within the households, with 30% built in the period 1971-1990.
Irish economy and increase security of supply. Next to this, the effects of the early 2000s construction
boom can be seen, as 27% of all households in Fingal
Electricity in Ireland has high CO2 emissions per kWh were built between 2001 and 2005. In the two most
due to the supply mix on the national grid, which, in recent construction periods, apartments have been the
addition to gas (~50%), is supplied by peat (12%) and most built housing type. Apartments will have a lower
coal (25%) plants. Added to this, nearly 50% of the external wall exposure than other dwelling types, such
energy from these fuels is lost during transformation as detached or semi detached, thus requiring less
and transmission. The high cost of electricity, along space heating per square metre and resulting in a
with high carbon emissions and reliance on imported better BER rating.
fuels are only more reasons for Fingal to look to
producing its own sustainable energy locally. From the application of actual BER data further
described in the Residential Sector Methodology, it is
BER and Household Analysis possible to produce a graph of estimated BER ratings
for the entire housing stock in Fingal. The graph in
Figure 5 shows the number of dwellings in each BER
While the commercial and agricultural sector account
rating according to the type of dwelling. Of these, 47%
for substantial portions of the energy use in Fingal, the
are calculated to have a BER of C, which is by far the
largest contributor is the residential sector. The
most common rating. 18% of all households have a BER
residential sector also provides the most detailed
rating of E or lower.
results due to the comprehensive data sources
available. From the CSO 2011 Census, it is possible to
18000
16000 >1919
14000
1919 - 1970
Number of Dwellings
12000
1971 - 1990
10000
1991 - 2000
8000
2001 - 2005
6000
4000 2006 Onwards
2000
0
Detached house Semi-detached house Terraced house Apartment
Figure 4 : Fingal Housing Stock by Type and Period Built
10
This is currently lowered due to the production of gas at
Corrib, but will return to previous import capacities when this
resource runs out, predicted to be 3-4 years.
14Fingal Spatial Energy Demand Analysis
18000
16000
14000
Apartments
Number of Dwellings
12000
10000 Semi Detached
8000
Terraced
6000
Detached
4000
2000
0
A1 A2 A3 B1 B2 B3 C1 C2 C3 D1 D2 E1 E2 F G
Figure 5 : Building Energy Ratings for all Fingal Households per Building Type
The graph in Figure 6 shows the energy ratings of all Fingal housing according to period built. A direct correlation
between the construction year and energy rating can be seen as the lower F and G ratings are dominated by pre 1970
builds, while all A rated properties were built post 2006. It is the lower rated, old households that should be given first
priority in any plans for energy efficiency upgrades in order to move them from the lower ratings up to at least high D
or C ratings. This will also help to improve situations for those at risk of energy poverty.
18000
16000
14000
2006 Onwards
Number of Dwellings
12000 2001 - 2005
10000 1991 - 2000
8000 1971 - 1990
6000 1919 - 1970
PRE 1919
4000
2000
0
A1 A2 A3 B1 B2 B3 C1 C2 C3 D1 D2 E1 E2 F G
Figure 6 : Building Energy Ratings for all Fingal Households per Construction Period
These results help to visualise the current state of energy use in Fingal and inform the local authority when creating
energy strategies for the region. The following chapter outlines the background methodologies and results of the
Spatial Energy Demand Analysis, which places this energy consumption within a spatial context.
15Fingal Spatial Energy Demand Analysis
from the SEAI was used to find an average energy
Residential Sector Energy profile of each housing type and housing age in each
Methodology
Two main datasets which provide high levels of
area within Fingal. The BERs only assess the energy
accuracy and detail are used in order to estimate the
requirements of the building itself and do not take into
energy use in each dwelling in Fingal; they are the
account electricity used for various appliances,
National Census from the CSO and the National BER
therefore additional electricity use associated with
Research Tool from the SEAI. At the time of the last
appliances has been applied based on figures from the
Census in 2011, there were 102,793 permanent private
SEAI’s Energy in the Residential Sector 2013 report
households in Fingal. Of these, 9,842 were considered
(SEAI, 2013 (b)).
to be vacant and as such, do not have energy
consumption attributed. Due to an increase in housing
The BER dataset has been broken down into three
demand, it is assumed that some of these may now be
Fingal postcodes, four housing types (detached, semi-
occupied. Additionally, preliminary results for the 2016
detached, terraced and apartments), and seven
Census announced an increase in the Fingal housing
building periods, with periods chosen to match those
stock compared with 2011 figures. However, at the
grouped by the CSO. There were over 53,000 BERs
time that this report was written, the spatial
analysed and 84 subsets of data created to represent
distribution of these increases, both in new builds and
the variety of housing types, ages and locations. These
filled vacancies, was not available and so, is not
profiles where then applied to the CSO housing data
included in these calculations.
breakdown.
For the purpose of this report, the CSO compiled
The representation of BERs in each postcode area is
special tabulations presenting the number of dwellings
shown in Table 2.
by type and period built in each small area of Fingal.
These attributes have a considerable effect on the
theoretical energy demand as they can often define Number
Number
Number
%
what building standards were in place during Postcode of Represent-
of SA's of BERs
Dwellings ed
construction, level of insulation, exposed external wall
area etc.
Dublin 13 81 7,591 5,170 68%
In line with data protection, the CSO is required to Dublin 15 297 28,343 12,389 44%
‘hide’ data where the breakdown could possibly allow Co. Dublin 560 54,983 36,158 66%
identification of individual households. In these cases, Total 938 90,917 53,717 59%
the CSO gave a figure of ‘Fingal Spatial Energy Demand Analysis
River Valley
Results Shopping Centre
BER Analysis
From the comprehensive datasets available, it is
possible to draw many conclusions about the
Rathingle Road
residential energy demand in Fingal. Based on all
documented BER data, BERs have been generated for
every dwelling. This is represented in Figure 9, showing
the average BER for each Small Area. The highest
average BER is a B, which is located near Ridgewood,
Swords and includes the new apartment complexes at Boirimhe
Ridgewood
Cedar Place, as seen in Figure 7.
As previously mentioned, the most common rating
among dwellings in Fingal is C, totalling 42% of the
housing stock. However, when calculating the average Figure 7 : Average B and C ratings (dark and light green
BER for each SA, there are 595 SAs in Fingal with an respectively) in areas around the newly developed Ridgewood,
average BER of D, compared with only 332 SAs with a Swords.
BER of C. This is particularly evident in Figure 10, as the
map is heavily dominated by yellow. This occurs for
two reasons. Firstly, the B and C rated homes tend to
be located in SAs with more households in newer,
more densely developed areas, often featuring
apartment developments. This means that B and C
rated buildings are concentrated closely together
dominating certain SAs while not achieving majority in
others. Areas featuring a high average C rating are Swords Library
predominantly the newer built areas surrounding
Blanchardstown, Clonsilla, Castleknock and Swords.
Secondly, there are more E, F and G rated homes than
Rathbeale Road
A and B, which lowers the average BER rating in each
SA.
There are few SAs in Fingal averaging below a BER of D. Figure 8 : Average E rating (Orange) in suburban area near
Among these include the area depicted in Figure 8, Rathbeale Road
situated adjacent to the Swords Library and Rathbeale
Road. This consists of 140 occupied households, the
vast majority of which are semi-detached and built
between 1971 and 1990.
Rogerstown Estuary
Another similarly poorly rated area is in the Electoral
District of Donabate, including the Portrane Demesne,
illustrated in Figure 9. Of the 63 occupied households
in this SA, the vast majority were built either before
1919, or between 1919 and 1970. These areas should Portrane
Donabate
be prioritised for energy efficiency measures or
included in schemes such as the SEAI's Better Energy
Homes.
Portrane Demesne
The effect that construction year has on the BER and
energy demand of buildings is evident as the adjacent
SAs in the newer built suburbs of Donabate have an
average BER of C. These dwellings are also
predominantly semi-detached but are almost entirely Figure 9 : Average C rating (Green) at newly developed
built post 2001. Donabate suburbs and Average E rating (Orange) at Portrane
Demesne
17Fingal Spatial Energy Demand Analysis
Figure 10 : Average BER of All Dwellings in Each Small Area
18Fingal Spatial Energy Demand Analysis
The results of the BER analysis show that, while better water and space heating, and efficiencies of heating
building regulations for new builds are effectively systems. The main fuel used for household space
reducing the energy demand in new developments, heating in Fingal is natural gas, as can be seen in Figure
the rest of Fingal’s dwellings are becoming older and 11, but many apartments are electrically heated using
less efficient. To really reduce energy use in this area, storage heating units. Additionally, some households
these households should be retrofitted with have oil boilers due to distance from the gas grid.
sustainable solutions. Many households also have electric showers or electric
immersions for hot water.
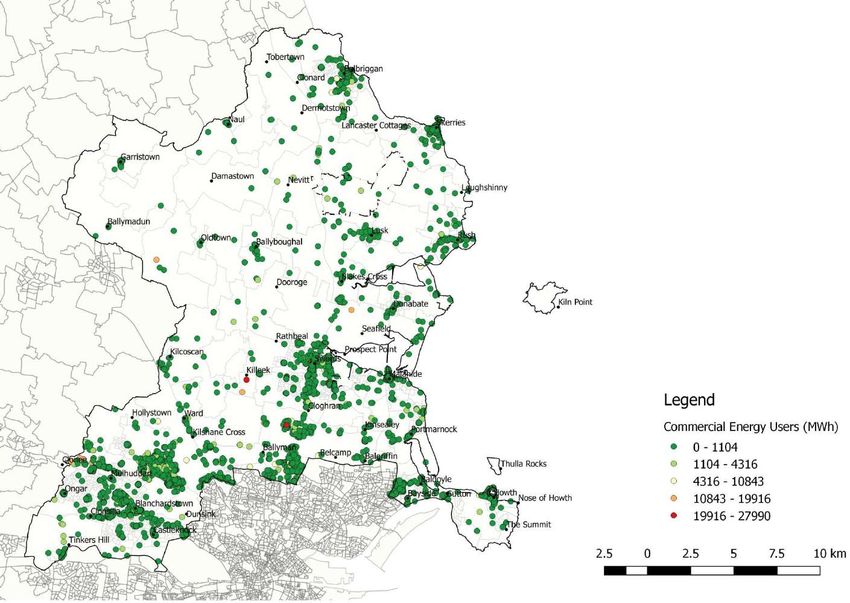
Energy Use per Household
The next map, Figure 12, shows the average energy
use per dwelling in megawatt-hours (MWh). The green
and dark green areas have low energy use per
dwelling, with the light yellow band representing the
average energy use in Fingal. This is between
approximately 22 and 28 MWh per year. In
comparison, the national average energy use per
household is around 20 MWh (SEAI, 2013 (b)), meaning
Fingal is slightly above the national average.
The areas that performed well in the average BER
calculations predictably have a lower energy use per
dwelling, as mapped in Figure 12. Dwellings in the
more densely populated areas such as
Blanchardstown, Swords and Donabate tend to have
smaller sized dwellings, often comprising of
apartments or semi detached developments, and
Figure 11 : Heating Fuel Use in Fingal
therefore require less energy to maintain thermal
comfort. This correlation between floor area and The fuel prices used in this analysis are based on SEAI’s
energy use can be seen in comparing Figure 12 and Domestic Fuel Cost Comparisons (April 2015), and
Figure 13. It can be seen that the built-up and more electricity and gas prices per kWh have been applied to
densely populated areas of Fingal tend to have smaller each household according to the usage price bands.
internal dwelling areas. However, it also highlights Domestic electricity rates in Ireland are the second
areas which may not have very large floor areas but highest in Europe, and third highest when all taxes and
still rank high in energy usage, and vice versa for areas levies are included, just behind Denmark and Germany
with large floor areas and low energy usage. (S1, 2015) (Eurostat, 2016). Oil used to be more
expensive than natural gas, but the price has dropped
In Figure 12, the areas of orange and red have above recently and now oil is close to the same cost per kWh
average use per dwelling, and in some cases, over as gas.
double the average energy use of a dwelling in the dark
green areas. While this map appears to be dominated The areas in dark green in Figure 14 have very high
by high energy dwellings, these areas are energy costs and are mainly located in more rural areas
predominantly rural and sparsely populated. The SAs with large housing units. The SA with the highest
coded in red account for 58% of the land area, yet only estimated energy costs, at €4,340 per household, is
7% of all households in Fingal. Land is not as valuable situated in Howth in Dublin 13 and consists almost
or sought after in these rural areas as it would be in the entirely of detached houses built before 1970, half of
urban areas of Blanchardstown or Swords and so, which were built before 1919.
houses are often larger and detached. These dwellings
also tend to be of an older construction period, the The lighter green areas have lower costs, but are still
housing stock accumulated over many decades rather relatively high per household, with many smaller
than being built in the early 2000's construction boom. households paying over €2,000 per year for energy.
These costs can make up a large part of a household’s
Energy Costs per Household
annual income, and can cause households to be
The estimated energy costs per household are mapped
without heat in the winter season. Again, it is not
in Figure 14. Many areas shown here with higher than
surprising that the areas coloured light yellow,
average energy costs overlap with areas shown in
indicating low energy costs, are those which also
Figure 12 with high energy use per household, but
feature the smallest floor areas and lowest energy
there are other areas which have high costs, not due to
usages per dwelling.
the size of the dwelling, but due to the fuel used for
19You can also read