Cancer immunotherapy by NC410, a LAIR- 2 Fc protein blocking human LAIR-collagen interaction - eLife
←
→
Page content transcription
If your browser does not render page correctly, please read the page content below
RESEARCH ARTICLE

                                    Cancer immunotherapy by NC410, a LAIR-
                                    2 Fc protein blocking human LAIR-
                                    collagen interaction
                                    M Ines Pascoal Ramos1,2†, Linjie Tian3†, Emma J de Ruiter4, Chang Song3,
                                    Ana Paucarmayta3, Akashdip Singh1,2, Eline Elshof1,2, Saskia V Vijver1,2,
                                    Jahangheer Shaik3, Jason Bosiacki3, Zachary Cusumano3, Christina Jensen4,
                                    Nicholas Willumsen4, Morten A Karsdal4, Linda Liu3, Sol Langermann3,
                                    Stefan Willems5§, Dallas Flies3‡*, Linde Meyaard1,2‡*
                                    1
                                      Center for Translational Immunology, University Medical Center Utrecht, Utrecht
                                    University, Utrecht, Netherlands; 2Oncode Institute, Utrecht, Netherlands;
                                    3
                                      NextCure, Beltsville, United States; 4Nordic Bioscience, Herlev, Denmark;
                                    5
                                      Department of Pathology, University Medical Center Utrecht, Utrecht University,
                                    Utrecht, Netherlands

                                    Abstract Collagens are a primary component of the extracellular matrix and are functional
*For correspondence:                ligands for the inhibitory immune receptor leukocyte-associated immunoglobulin-like receptor
fliesd@nextcure.com (DF);           (LAIR)-1. LAIR-2 is a secreted protein that can act as a decoy receptor by binding collagen with
L.Meyaard@umcutrecht.nl (LM)        higher affinity than LAIR-1. We propose that collagens promote immune evasion by interacting with
†
  These authors contributed         LAIR-1 expressed on immune cells, and that LAIR-2 releases LAIR-1-mediated immune suppression.
equally to this work                Analysis of public human datasets shows that collagens, LAIR-1 and LAIR-2 have unique and
‡
  These authors also contributed    overlapping associations with survival in certain tumors. We designed a dimeric LAIR-2 with a
equally to this work                functional IgG1 Fc tail, NC410, and showed that NC410 increases human T cell expansion and
Present address: §Department        effector function in vivo in a mouse xenogeneic-graft versus-host disease model. In humanized
of Pathology and Medical            mouse tumor models, NC410 reduces tumor growth that is dependent on T cells.
Biology, University Medical         Immunohistochemical analysis of human tumors shows that NC410 binds to collagen-rich areas
Center Groningen, Groningen,        where LAIR-1+ immune cells are localized. Our findings show that NC410 might be a novel strategy
The Netherlands                     for cancer immunotherapy for immune-excluded tumors.
Competing interest: See
page 23
Funding: See page 23                Introduction
Received: 09 September 2020         The introduction of immune checkpoint blockade therapies in the clinic has increased cancer treat-
Accepted: 11 June 2021              ment options for a wide range of tumors, leading to unprecedented and long-lasting clinical
Published: 14 June 2021             responses. However, not all patients show the same degree of response and not all tumors respond
                                    to these therapies (Gibney et al., 2016; Darvin et al., 2018). Thus, identifying novel checkpoints
Reviewing editor: Yuting Ma,
Suzhou Institute of Systems
                                    and developing ideal combinations of immunotherapies is essential to optimize and enhance the effi-
Medicine, China                     cacy of treatment for these tumors, achieving durable anti-tumor effects with reduced side effects.
                                       The extracellular matrix (ECM) is a major structural component in all tissues. It comprises a non-
   Copyright Ramos et al. This
                                    cellular meshwork of proteins, glycoproteins, proteoglycans and polysaccharides with collagens as
article is distributed under the
                                    the most abundant proteins. Ongoing ECM remodeling ensures tissue integrity and function, with
terms of the Creative Commons
Attribution License, which          specific collagens being synthesized and degraded in a highly regulated manner (Bonnans et al.,
permits unrestricted use and        2014). At least 28 different collagens comprising at least 43 genes have been identified
redistribution provided that the    (Myllyharju and Kivirikko, 2004). The ECM functions not only as a scaffold for tissue organization
original author and source are      but also provides critical biochemical and biomechanical cues that instruct cell growth, survival, dif-
credited.                           ferentiation and migration and regulate vascular development and immune function (Hynes, 2009).

Ramos, Tian, et al. eLife 2021;10:e62927. DOI: https://doi.org/10.7554/eLife.62927                                                  1 of 29
Research article                                                                                                  Cancer Biology

                                       Several epithelial tumors including breast, pancreatic, colorectal, ovarian and lung cancer are
                                    characterized by a dense ECM where high collagen content correlates with poor prognosis
                                    (Fang et al., 2014). Indeed, ECM or ‘Matrisome’ signatures associated with tumor type and stage of
                                    disease have been described (Levental et al., 2009; Lu et al., 2012; Naba et al., 2012; Naba et al.,
                                    2014a). Cancer-associated fibroblasts (CAFs) (Kalluri, 2016), macrophages and tumor cells them-
                                    selves (Naba et al., 2012; Januchowski et al., 2014; Naba et al., 2014a) all contribute to increased
                                    collagen production and remodeling during cancer progression.
                                       Most tumors overexpress a diverse set of collagens in an abnormal fashion (Nissen et al., 2019;
                                    Xu et al., 2019). Overexpression of collagens has been associated with poor overall survival in sev-
                                    eral tumor types, such as lung (Iizasa et al., 2004; Ke et al., 2014), colorectal (Naba et al., 2014b;
                                    Huang et al., 2018) and ovarian cancer (Cheon et al., 2014; Wu et al., 2014). The capacity of
                                    tumors to induce remodeling of collagens in the tumor microenvironment (TME) was primarily
                                    thought to create a suitable microenvironment for tumor cell growth. We now consider abnormal
                                    collagen production, composition and organization in the TME as a cause of immune dysfunction,
                                    conveying a chronic-active wound-healing response instead of anti-tumor immune responses neces-
                                    sary for immune surveillance and the eradication of the tumor (Antonio et al., 2015; Rosowski and
                                    Huttenlocher, 2015). The abnormal ECM also builds physical fibrotic barriers to exclude immune
                                    cells and therapeutic agents from access to tumor cells (Henke et al., 2019).
                                       TME-expressed collagen can interact directly with the inhibitory collagen receptor leukocyte-
                                    associated immunoglobulin-like receptor 1 (LAIR-1) (Rygiel et al., 2011). LAIR-1 is an immune check-
                                    point broadly expressed on the cell surface of immune cells (Meyaard et al., 1997) that binds to col-
                                    lagen (Lebbink et al., 2006) and molecules with collagen-like domains (Son et al., 2012;
                                    Olde Nordkamp et al., 2014b). LAIR-1+ cells strongly adhere to collagen (Lebbink et al., 2006).
                                    Upon triggering, LAIR-1 inhibits NK cell (Meyaard et al., 1997), T cell (Maasho et al., 2005;
                                    Zhang et al., 2014; Park et al., 2020), B cell (van der Vuurst de Vries et al., 1999; Merlo et al.,
                                    2005), monocyte (Son and Diamond, 2015) and DC function (Poggi et al., 1998; Son et al., 2012).
                                    Thus, besides formation of an ECM-rich and fibrotic tumor niche, TME-expressed collagens can func-
                                    tion to promote immune evasion through their direct interaction with LAIR-1.
                                       LAIR-2 is a natural soluble homolog of LAIR-1 that is present in humans and non-human primates,
                                    but not other animals. LAIR-2 shares 83% identity with the LAIR-1 extracellular region, binds to colla-
                                    gens with higher affinity than LAIR-1 and functions as a natural antagonist to block cell membrane
                                    LAIR-1 inhibitory signaling (Lebbink, Lebbink et al., 2008; Olde Nordkamp et al., 2011). We devel-
                                    oped a dimeric LAIR-2 Fc fusion protein, NC410, as a novel immunomedicine to both target tumor
                                    ECM and promote T cell function through blockade of LAIR-1-mediated inhibition. Hereby, we
                                    sought to restore anti-tumor immunity.

                                    Results
                                    The collagen:LAIR-1 axis is an immune regulatory pathway to target for
                                    cancer immunotherapy
                                    First, we performed a TCGA meta-analysis combining all 28 collagens as a group across 21 TCGA
                                    tumor subtypes. When we examined the mRNA expression of all 43 collagen genes combined, 10
                                    out of 21 tumors had reduced overall survival with high (quantile) overall levels of collagens
                                    (Figure 1A, Source code 1). Likewise, the LAIR-1 expression was significantly upregulated in 11 of
                                    21 tumors when evaluated by TCGA data (Figure 1—figure supplement 1, Source code 2 and
                                    3). LAIR-1 expression is observed in all tumor types and largely restricted to immune cells. By strati-
                                    fying patients for high- and low-quantile LAIR-1 mRNA expression, we observed that patients with
                                    high LAIR-1 mRNA expression had lower survival probability in four tumor types (Figure 1B,
                                    Source code 4). We further stratified the patients in the TCGA database to include high or low
                                    expression of all collagens combined with high or low LAIR-1 for overall survival analysis (Figure 1C,
                                    Source code 5). A unique set of tumor types emerged that overlapped with those with significant
                                    increased LAIR-1 expression, but only partially with the tumor types in that of the total collagen
                                    overall survival analysis. These analyses highlighted the complexity of the TME and also supported
                                    targeting the collagen:LAIR-1 axis for cancer immunotherapy.

Ramos, Tian, et al. eLife 2021;10:e62927. DOI: https://doi.org/10.7554/eLife.62927                                                  2 of 29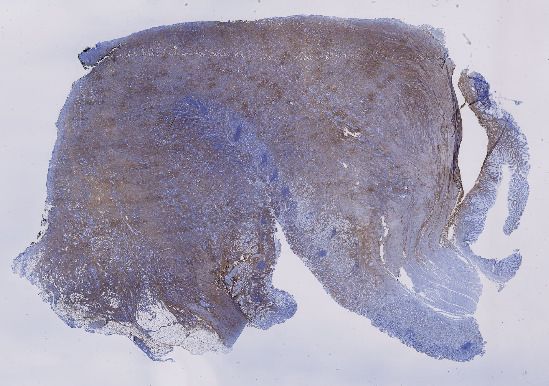
Research article                                                                                                                                                  Cancer Biology

   A
                                     UCEC                                LGG
                                                                                                                  High Total Collagens
                                                                                                                  Low Total Collagens
    survival probability

                            HR(High):3.6; p(High):0.04        HR(High):4.6; p(High):1.4x10⁻⁷
                                     GBM                                 MESO                                SARC                           KIRC

                            HR(High):1.7; p(High):0.04      HR(High):3.8; p(High):7.7x10⁻⁴       HR(High):2.8; p(High):0.04        HR(High):1.5; p(High):0.05

                                     STAD                                 ACC                                 KIRP                           BLCA

                            HR(High):1.5; p(High):0.05         HR(High):5.5; p(High):0.01        HR(High):2.8; p(High):0.01        HR(High):1.5; p(High):0.05
                                                                                     Time (months)

   B
                                    LGG                              ESCA                              UVM                             LUSC
    survival probability

                                                                                                                                                                   High LAIR-1
                                                                                                                                                                    Low LAIR-1

                           HR(High):2.8; p(High):9.9x10⁻⁵     HR(High):1.9; p(High):0.04        HR(High):4.0; p(High):0.04      HR(High):1.5; p(High):0.02
                                                                                       Time (months)
       C
                                   CollagenHigh,LAIR1High
                                   CollagenLow,LAIR1Low

                                        LGG                             PDAC                           ESCA                           LAML                            KIRC
    survival probability

                             HR(High):1.6; p(High):7.9x10⁻⁷ HR(High):1.2; p(High):3.2x10⁻³     HR(High):1.8; p(High):4.5x10⁻³ HR(High):1.0; p(High):0.003    HR(High):1.3; p(High):6.5x10⁻³

                                       GBM                               UVM                            LIHC                          BRCA                           LUSC

                            HR(High):1.45; p(High):9.9x10⁻⁵ HR(High):3.3; p(High):3.5x10⁻⁶ HR(High):1.4; p(High):8.6x10⁻⁵     HR(High):1.1; p(High):8.5x10⁻⁵ HR(High):1.3; p(High):0.006
                                                                                       Time (months)

Figure 1. High expression of total collagens and LAIR-1 is associated with reduced overall survival. The expression of 43 collagen genes, LAIR-1 and
LAIR-2 in normal (gray) and tumor tissue (red) were queried using TCGA database. (A) The expression of 43 different collagen genes was assessed
together for association with overall survival. The log2 transformed average collagen expression was divided into four quantiles individually for each
tumor type. The patients in lower quantile (black) were considered as individuals with low expression and those in the upper quantile (red) were
Figure 1 continued on next page

Ramos, Tian, et al. eLife 2021;10:e62927. DOI: https://doi.org/10.7554/eLife.62927                                                                                                                   3 of 29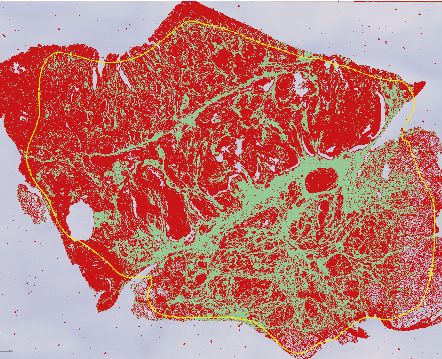
Research article                                                                                                             Cancer Biology

Figure 1 continued
considered as those with high expression, respectively. Tumor types in which poor overall survival associated with collagen overexpression are shown:
uterine corpus endometrial carcinoma (UCEC), brain lower grade glioma (LGG), glioblastoma multiforme (GBM), mesothelioma (MESO), sarcoma
(SARC), kidney renal clear cell carcinoma (KIRC), stomach adenocarcinoma (STAD), adrenocortical carcinoma (ACC), kidney renal papillary cell
carcinoma (KIRP) and bladder urothelial carcinoma (BLCA). (B) Patients were grouped into four quantiles with low 25% quantile (black) and high 25%
quantile (red) of LAIR-1 mRNA expression compared for overall survival analysis. Esophageal carcinoma (ESCA), uveal melanoma (UVM) and lung
squamous cell carcinoma (LUSC). (C) Collagen expression and LAIR-1 expression were assessed together for association with overall survival. Patients in
the lower 25% quantile for both average collagen and LAIR-1 were grouped in the collagenlowLAIR-1low (black), and as collagenhighLAIR-1high if they
were in the high 25% quantile (red) for both collagen and LAIR-1. Pancreatic adenocarcinoma (PDAC), acute myeloid leukemia (LAML), liver
hepatocellular carcinoma (LIHC) and breast invasive carcinoma (BRCA). Hazards ratio indicating if high expression is associated with poor survival (HR
(High)), and p-value (p(High)) indicating the significance of association was determined using Wald test as indicated on the x-axis.
The online version of this article includes the following figure supplement(s) for figure 1:
Figure supplement 1. Expression of total collagens, LAIR-1 and LAIR-2 in healthy and tumor tissues.

                                     Development of NC410, a dimeric LAIR-2 Fc fusion protein that blocks
                                     collagen interaction with LAIR-1
                                     Soluble LAIR-2 can block immune cell expressed LAIR-1 binding to its ligands (Lebbink et al., 2008).
                                     We posited that LAIR-2 may correlate with increased overall survival in some tumors. TCGA evalua-
                                     tion demonstrated that six tumor types had improved overall survival with high (quantile) expression
                                     of LAIR-2 (Figure 2A). This was despite relatively low expression levels of LAIR-2 in most tumors in
                                     comparison to LAIR-1 (Figure 1—figure supplement 1, Source code 3). These data supported sup-
                                     plemental LAIR-2 as a therapeutic intervention that might inhibit LAIR-1 inhibitory interaction with
                                     collagen in the TME of solid tumors. Taking advantage of LAIR-2 as a natural decoy system that
                                     would both target tumors and reverse immune inhibition, we generated a LAIR-2 human IgG1 Fc
                                     fusion protein for therapeutic use named NC410 (Figure 2B). This fusion protein exists as a dimeric
                                     protein due to the cysteine bonding in the Fc portion of the protein. NC410 bound to human colla-
                                     gen I and III with high avidity (Figure 2C). While LAIR-2 is not present in rodents, it is cross-reactive
                                     to rat and mouse collagens due to the highly conserved nature of collagens across species
                                     (Figure 2C). NC410 completely blocked human LAIR-1 binding to collagen I since LAIR-2 binds with
                                     higher affinity to collagens than human LAIR-1, as reported previously (Lebbink et al., 2008;
                                     Olde Nordkamp et al., 2011), supporting its potential role as a LAIR-1 antagonist therapeutic
                                     (Figure 2D). To determine if NC410 prevents LAIR-1-mediated signaling, we used a reporter cell
                                     line that expresses the human LAIR-1 extracellular domain (ECD) fused to CD3z, thus conferring pos-
                                     itive signaling capacity to LAIR-1 upon interaction with collagen ligands, and an NFAT-GFP reporter
                                     to visualize LAIR-1-mediated signal induction (Lebbink et al., 2006). Using flow cytometry
                                     (Figure 2E) and Incucyte microscope imaging (Figure 2F, Figure 2—figure supplement 1), we
                                     observed a dose-dependent inhibition of LAIR-1 NFAT-GFP reporter activity by NC410, indicating
                                     that NC410 inhibited collagen-mediated LAIR-1 signaling in a dose-dependent fashion.

                                     NC410 increases human effector T cell numbers in vivo and controls
                                     tumor growth
                                     To study the effect of NC410 on T cell function in a non-tumor model in vivo, we adoptively trans-
                                     ferred human peripheral blood mononuclear cells (PBMCs) into NOD scid gamma (NSG) mice. In
                                     this model, human xeno-reactive T cells against mouse antigens expand and cause xenogeneic-graft
                                     versus-host disease (xeno-GVHD). GVHD models are often used to assess if targeting T cell stimula-
                                     tory or inhibitory pathways alter T cell activity in vivo with the majority of expanding xeno-reactive T
                                     cells acquiring effector or memory phenotypes (Ehx et al., 2018). Figure 3A, B shows that the
                                     majority of human T cells in the spleen on day 6 post transfer acquired an effector memory (EM,
                                     CD45RA-CCR7-) phenotype as a percentage of total T cells irrespective of treatment (see Figure 3—
                                     figure supplement 1 for gating strategy). However, it was noted that with increasing doses of
                                     NC410, there was a trend of effector T cell (CD45RA+CCR7-) expansion as a percentage of total T
                                     cells (Figure 3B). In the spleen, it was found that NC410 significantly increased the number of human
                                     CD4+EM T cells and human CD8+ effector T cells in a dose-dependent fashion (Figure 3C–E).
                                        To evaluate if the increase in xeno-reactive human effector T cell numbers induced by NC410 was
                                     associated with increased T cell effector activity, we tested whether NC410 treatment resulted in

Ramos, Tian, et al. eLife 2021;10:e62927. DOI: https://doi.org/10.7554/eLife.62927                                                              4 of 29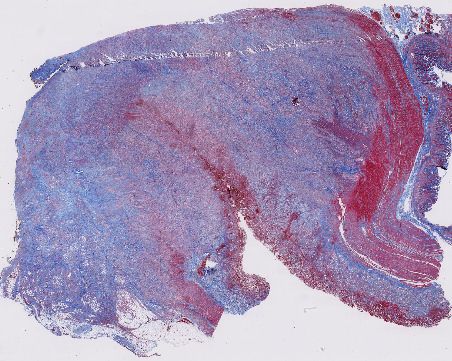
Research article                                                                                                                                                                 Cancer Biology

     A
                                 HNSC                         THCA                   THYM                                   BRCA                    STAD                           SKCM
     survival probability

                                                                                                                                                                                               High LAIR-2
                                                                                                                                                                                               Low LAIR-2

                            HR(High):0.64;             HR(High):0.09;           HR(High):0.14;                          HR(High):0.6;           HR(High):0.49;         HR(High):0.48;
                             p(High):0.01               p(High):0.02             p(High):0.05                           p(High):0.01            p(High):0.003          p(High):9.9x10⁻⁵

                                                                                          Time (months)

     B                                                                                                        C

     D                                                                                                        E

                                 1 mg/ml LAIR-1 FC Biotin + 10 mg/ml proteins
                                                                                             GFP+ cells (%)
     Eu Counts

                                                                                                                                                  10

                                                                                                                                                                                   R
                                                                                                                                                        25

                                                                                                                                                                 50

                                                                                                                                                                       0

                                                                                                                                                                                          D3
                                                                                                                              0

                                                                                                                                        1

                                                                                                                                            5
                                                                                                                     pe

                                                                                                                                                                      10

                                                                                                                                                                              AI
                                                                                                                   ty

                                                                                                                                                                                       i-C
                                                                                                                                                                               L
                                                                                                                                                                           ti-
                                                                                                                  Iso

                                                                                                                                                                                      t
                                                                                                                                                                                   an
                                                                                                                                                                       an

                                             Collagen I (mg/ml)
     F

Figure 2. Development of NC410, a LAIR-2 Fc protein that blocks LAIR-1-collagen interaction. (A) LAIR-2 overexpression is associated with improved
overall survival in some tumors: head and neck squamous cell carcinoma (HNSC), thyroid carcinoma (THCA), thymoma (THYM) and skin cutaneous
melanoma (SKCM). Patients were grouped in low 25% quantile (black) and high 25% quantile (red) of LAIR-2 mRNA expression for overall survival
analysis. Hazards ratio indicating if high expression is associated with poor survival (HR(High)), and p-value (p(High)) indicating the significance of
Figure 2 continued on next page

Ramos, Tian, et al. eLife 2021;10:e62927. DOI: https://doi.org/10.7554/eLife.62927                                                                                                                                  5 of 29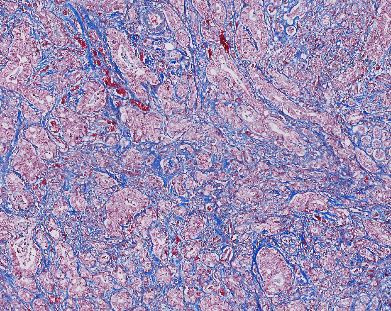
Research article                                                                                                              Cancer Biology

Figure 2 continued
association was determined using Wald test as indicated. (B) NC410 is a biologic fusing LAIR-2 with a functional IgG1 to generate a dimeric fusion
protein. (C) Avidity characterization of NC410 to human, mouse and rat collagen I and III as measured by Octet analysis. (D) Indicated amounts of
collagen I were plate coated, and the binding of soluble LAIR-1 was inhibited by NC410. Asterisks indicate statistical significance (****p
Research article                                                                                                                                     Cancer Biology

     A                                                                                                   B
                                                     % CD4+                                                                                                % CD8+
     % of CD4 T cells

                                                                                                              % of CD8 T cells
     +

                                                                                                             +
     C                                                                 D                                                                     E
                                          CD4+    EM                                                      CD8+         EM                                           CD8+ Effector

                              2.0             ****                                              15
                                              *
                                         *
                                                                           Cell number (x10 )

                                                                                                                                             Cell number (x104 )
         Cell number (x10 )

                                                                        4
     4

                              1.5
                                                                                                10

                              1.0

                                                                                                5
                              0.5

                              0.0                                                               0
                                    0 0.1 0.3 1        3   10 30                                     0 0.1 0.3 1                 3   10 30
                                         NC410 (mg/kg)                                                   NC410 (mg/kg)

Figure 3. NC410 therapy promotes human T cell expansion in a xenogeneic-graft versus-host disease model. In a non-tumor model, 1  107 total
human peripheral blood mononuclear cells were adoptively transferred intravenously to NSG mice (N = 6/group) on day 0. Mice were treated with
indicated doses of NC410 by intravenous injection on days 0 and 2. On day 6, mice were euthanized and spleens were analyzed for naı̈ve
(CD45RA+CCR7+), central memory (CM, CD45RA-CCR7+), effector memory (EM, CD45RA-CCR7-) and effector (CD45RA+CCR7-) CD4+ (A) and CD8+ (B)
T cell populations. The graph shows the percentage of T cell subpopulations as a percentage of total human T cells. (C–E) Cell counts of (C) CD4+EM,
(D) CD8+EM and (E) CD8+ effector T cells in the spleen. The graphs show the means ± SD (error bars). Asterisks indicate statistical significance:
*p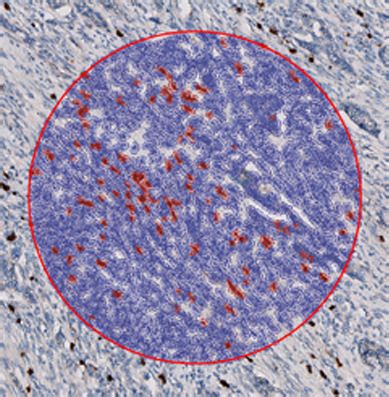
Research article Cancer Biology
A P815 B
(Normalized to control)
HT-29
P815
Relative MFI
Control Fc-Biotin
NC410-Biotin
C
P815 Tumor Model
1500 PBS
Tumor volume (mm3)
Control Fc
NC410 1mg/kg
1000 NC410 3 mg/kg
NC410 10 mg/kg
***
**
500
0
Day14 Day 16 Day 19
D Blood Day 6 E Blood Day 13
*
***
20000 *
+ counts/ml
+ counts/ml
hCD8+ Counts/ml
hCD8+ counts/ml
15000
10000
hCD8
hCD8
5000
0
kg
kg
S
kg
S
c
kg
kg
kg
c
PB
lF
PB
lF
g/
g/
g/
g/
g/
g/
ro
ro
1m
m
m
m
1m
m
nt
nt
3
10
3
10
Co
Co
0
0
0
0
41
41
0
41
0
41
41
41
NC
NC
NC
NC
NC
NC
F G
**
*
15000 *
+ counts/ml
+ counts/ml
counts/ml
Counts/ml
10000
hCD4+
hCD4+
5000
hCD4
hCD4
0
S
kg
kg
kg
c
lF
PB
S
kg
kg
kg
g/
g/
g/
c
PB
ro
F
1m
m
m
g/
g/
g/
ol
nt
1m
m
m
tr
3
10
Co
n
0
0
3
10
41
41
0
Co
0
0
41
41
41
0
NC
NC
41
NC
NC
NC
NC
Figure 4. NC410 therapy controls in vivo tumor growth of tumor cells that do not express collagen. (A) Histogram plot showing mouse P815 tumor cells
stained with NC410-biotin or control Fc-biotin. (B) Mouse P815 cells and human HT-29 cells were stained with titrated concentrations of NC410-biotin.
(C) 1.5 107 total human peripheral blood mononuclear cells were adoptively transferred by intravenous injection to NSG mouse on day 0, and 2 105
P815 tumor cells in Matrigel were injected subcutaneously on day 1. Mice were treated on days 1 and 3 with indicated dose of NC410 or control IgG1
Figure 4 continued on next page
Ramos, Tian, et al. eLife 2021;10:e62927. DOI: https://doi.org/10.7554/eLife.62927 8 of 29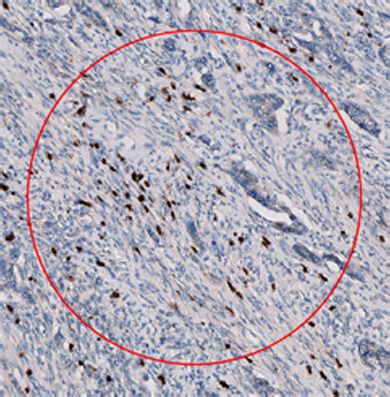
Research article                                                                                                             Cancer Biology

Figure 4 continued
(10 mg/kg) by intraperitoneal injection (N = 6/group). P815 tumor was measured every 2–3 days with a caliper, and tumor volume was calculated.
Asterisks indicate statistical significance: **p
Research article Cancer Biology
A B
(mm33))
Tumor volume (mm3)
Volume (mm
Tumor volume
C D CD4+ T cells E Ex vivo restimulation
60000 20000
Control
*
15000 * NC410
40000
*
10000
20000
5000
0 0
+ + + +
Control NC410 IFNg + TNF-a
IFN-g TNFa + TNFa
IFN-gIFNg
+TNF-a+
F IFN-g Granzyme B sCD40L
G IFN-g Granzyme B sCD40L
50 400
4000 * **
pg/gram of tumor
pg/gram of spleen
40 300
3000
30
2000 200
20
1000 100
10
0 0 0
Control NC410 Control NC410 Control NC410
H I
CXCL10 CXCL11 CXCL12 CXCL10 CXCL11 CXCL12
6000
* 150
**
4000 100
2000 50
0 0
Control NC410 Control NC410
J CXCL10 CXCL11 CXCL12
Tumor weight (mg)
Tumor weight (mg)
Tumor weight (mg)
P value 0.0213 P value 0.0004 P value 0.0075
Figure 5. NC410 promotes T cell anti-tumor immunity in an HT-29 humanized tumor model. (A) Humanized tumor model of HT-29 tumor cells injected
subcutaneously in the presence of human peripheral blood mononuclear cells (PBMCs). 2 107 total human PBMCs were adoptively transferred
intravenously to NSG mice (N = 6/group) on day 0. 1 106 HT-29 tumor cells were injected subcutaneously with Matrigel on day 1. Mice were treated
with 10 mg/kg NC410 or control by intraperitoneal injection, Q4D 4 doses followed by Q7D until endpoint. Tumor growth was monitored 1–3 times a
Figure 5 continued on next page
Ramos, Tian, et al. eLife 2021;10:e62927. DOI: https://doi.org/10.7554/eLife.62927 10 of 29Research article Cancer Biology Figure 5 continued week. Asterisks indicate statistical significance: ****p
Research article                                                                                                          Cancer Biology

     A                                                         B
                                                                                          500
                                                                                                PBS

                                                                                      )
                                                                                 3) 3
                                                                               (mm
                                                                                          400   NC410

                                                                             (mm
                                                                        Volume
                                                                                          300

                                                                 Tumorvolume
                                                                                          200

                                                                Tumor
                                                                                          100

                                                                                           0
                                                                                            0              10          20       30
                                                                                                        Days post Inoculation

     C

Figure 6. NC410 increases collagen degradation products that correlate with tumor regression. (A) Schematic representation of the humanized murine
tumor model used. HT-29 tumor was injected subcutaneously in the presence of human peripheral blood mononuclear cells. Mice were treated with
NC410 or control by intraperitoneal injection, Q4D  4 doses followed by Q7D until endpoint. Mice were bled prior to start of experiment and weekly
for 4 weeks. (B) Tumor growth kinetics with NC410. Asterisks indicate statistical significance: *p
Research article Cancer Biology Figure 6 continued granzyme B (T cell activity/infiltration); closed circles indicate NC410 treatment, and open circles indicate control treatment. The graphs show the means ± SD (error bars). Asterisks indicate statistical significance: ****p
Research article Cancer Biology
A B
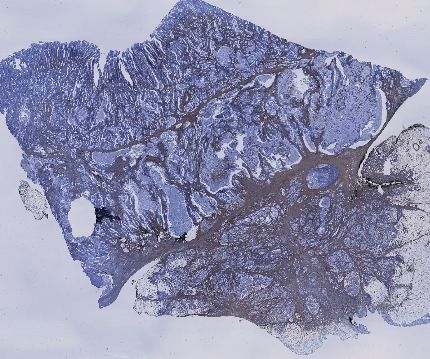
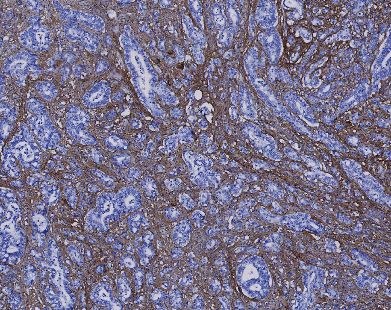
H&E
C NC410 % NC410 binding
Trichrome
NC410
L
LAIR-1
NC410 (red) LAIR-1 (red)
D NC410 LAIR-1 E
Figure 7. Immunohistochemical characterization of LAIR-1+ cells and LAIR-2 Fc binding in primary human tumors. (A) Schematic representation of the
immunohistochemical stainings performed. (B) Representative hematoxylin and eosin (H&E), Masson Trichrome, NC410 and LAIR-1 staining in a
stomach tumor specimen. (C) Representative NC410 and LAIR-1 analysis. The percentage of NC410 binding to tissue within a tumor was calculated by
dividing the NC410+ stained area by the total tumor area. The number of LAIR-1+ cells was calculated by dividing the total number of positive cells
Figure 7 continued on next page
Ramos, Tian, et al. eLife 2021;10:e62927. DOI: https://doi.org/10.7554/eLife.62927 14 of 29Research article Cancer Biology
Figure 7 continued
within five regions of interest (ROIs) by the total surface in mm2 of these ROIs. (D) Quantification of LAIR-1 and NC410 staining of 9–10 patients per
tumor type across six different tumor types (head and neck squamous cell carcinoma [HNSC], skin cutaneous melanoma [SKCM], non-small cell lung
carcinoma [NSCLC], high-grade serous ovarian carcinoma [HGSC], pancreatic adenocarcinoma [PDAC] and stomach adenocarcinoma [STAD]). (E)
Higher magnification pictures of stomach cancer specimens show LAIR-1+ cells (depicted in red, right side) co-localizing with NC410-positive areas
(depicted in red, left side).
The online version of this article includes the following figure supplement(s) for figure 7:
Figure supplement 1. Characterization of LAIR-1+ cells in primary human tumors.
Figure supplement 2. Immunohistochemical analysis of primary human tumors.
Figure supplement 3. Immunohistochemical analysis of healthy tissues.
Figure supplement 4. NC410 preferentially binds to tumors with an immune-excluded phenotype.
NC410 showed decreased tumor growth as a monotherapy, but it might even show better clinical
efficacy when used in combination with currently used checkpoint receptor inhibitors such as CTLA4
and/or PD-1. In accordance, it was recently shown that abrogating LAIR-1 immunosuppression
through LAIR-2 overexpression or SHP-1 inhibition sensitizes resistant lung tumors to anti-PD-1 ther-
apy (Peng et al., 2020).
Circulating LAIR-2 protein concentration is low or undetectable in healthy individuals
(Lebbink et al., 2008; Olde Nordkamp et al., 2011). In the presence of limited endogenous LAIR-2,
LAIR-1 can bind collagens, thereby allowing the inhibitory receptor to signal and prevent or reduce
T cell activity and/or retain LAIR-1+ cells in collagen-rich areas. In the TME, increased levels of colla-
gens will therefore promote tumor immune escape in the absence of increased LAIR-2. Our analysis
of TCGA data indeed revealed that enhanced expression of endogenous LAIR-2 in some tumors
associated with better prognosis, suggesting that further increasing LAIR-2 in vivo could have a ther-
apeutic advantage. NC410 has a higher avidity to collagen than endogenous LAIR-2 due to its
dimeric structure since in vivo LAIR-2 is expressed as a monomer, enhancing its potential to block
the inhibitory capacity of membrane-bound LAIR-1. NC410 binds both healthy and tumoral collagen
and theoretically could be sequestered before reaching the tumor site. We hypothesize that the
avidity of NC410 towards tumoral collagen is higher than to healthy collagen, therefore resulting in
a therapeutic effect, but this needs additional study. Other LAIR-1 ligands, such as C1q, have been
shown to be increased in tumors (Bulla et al., 2016) and may also provide a local inhibitory effect
that could be potentially reversed by NC410.
Understanding LAIR-1 and collagen expression in the context of tumor structure and co-localiza-
tion could help to identify indications that may best benefit from targeting this axis. Our IHC analy-
ses demonstrated that LAIR-1+ cells were present within NC410-binding collagen-rich areas. This
indicated that an abundance of collagen may trap immune cells in the tumor stroma, possibly by
binding to LAIR-1. This was most notable in immune-excluded tumors. The immune-excluded pheno-
type is characterized by the presence of immune cells that cannot penetrate the parenchyma of the
tumors but instead are located in the stroma that surrounds the tumor cells (Chen and Mellman,
2017). These are indications that currently fare poorly with PD-1/PD-L1 immunotherapy
(Jiang et al., 2018), and thus NC410 could benefit an entirely new class of cancer patients when
used as either a monotherapy or in combination with checkpoint inhibitors. Our data support NC410
as a novel immunomedicine for targeting immune-excluded collagen-rich tumors and enabling nor-
malization of the tumor-immune microenvironment.
Materials and methods
Key resources table
Reagent type (species) or
resource Designation Source or reference Identifiers Additional information
Genetic reagent NOD-SCID IL2Rgnull Jackson Labs Stock #: 005557, RRID: Female mice
(Mus musculus) IMSR_JAX:005557
Continued on next page
Ramos, Tian, et al. eLife 2021;10:e62927. DOI: https://doi.org/10.7554/eLife.62927 15 of 29Research article Cancer Biology
Continued
Reagent type (species) or
resource Designation Source or reference Identifiers Additional information
Biological sample Human PBMCs In vitro studies – healthy
(Homo sapiens) donors in agreement with
ethical committee of the
University Medical Center
Utrecht
In vivo studies –
Leukopaks (StemCell)
Cell line hLAIR-1 reporter cell line Meyaard Lab 2B4 T cell hybridoma cells
(M. musculus) transduced with a NFAT-
GFP reporter and hLAIR-1-
CD3z
Cell line WT reporter cell line Meyaard Lab 2B4 T cell hybridoma cells
(M. musculus) transduced with a NFAT-
GFP reporter
Cell line HT-29 ATCC ATCC HTB-38 (RRID:
(Homo sapiens) CVCL_0320)
Cell line P815 ATCC ATCC TIB-64 (RRID:CVCL_
(M. musculus) 2154)
Cell line CHO cells Lonza CHOK1SV, RRID:CVCL_ CHOK1-SV-GS (glutamine
(Cricetulus griseus) DR97 synthase)-KO cells
Antibody Anti-human CD45-BV421 ThermoFisher Scientific Cat number: 50-166-070 (Flow cytometry: 1:40)
(mouse monoclonal)
Antibody Anti-mouse CD45-APC ThermoFisher Scientific Cat number: 17-0451-82 (Flow cytometry: 1:200)
(rat monoclonal)
Antibody Anti-human CD3-PerCP. ThermoFisher Scientific Cat number: 45-0037-42 (Flow cytometry: 1:40)
Cy5.5
(mouse monoclonal)
Antibody Anti-human CD8-AF488 ThermoFisher Scientific Cat number: 53-0081-82 (Flow cytometry: 1:40)
(rat monoclonal)
Antibody Anti-human CD4-BV711 Biolegend Cat number: 300558 (Flow cytometry: 1:40)
(mouse monoclonal)
Antibody Anti-Human CD45RA- ThermoFisher Cat number: 48-0458-42 (Flow cytometry: 1:40)
eF450
(mouse monoclonal)
Antibody Anti-human CCR7-PE Biolegend Cat number: 353204 (Flow cytometry: 1:40)
(mouse monoclonal)
Antibody Anti-human TNF-a-PE ThermoFisher Scientific Cat number: 12-7349-41 (Flow cytometry: 1:40)
(mouse monoclonal)
Antibody Anti-human IFN-V-PECy7 ThermoFisher Scientific Cat number: 25-7311-41 (Flow cytometry: 1:40)
(rat monoclonal)
Antibody Anti-human LAIR-1 ATLAS antibodies Cat number: HPA011155 (Immunohistochemistry:
(rabbit polyclonal) 1:500)
Antibody Anti-human LAIR-1 BD Pharmingen Cat number: 550810 (Immunohistochemistry:
(mouse monoclonal) 1:100)
Antibody NC410-biotin This paper/NextCure See Materials and methods
(Immunohistochemistry:
1:500)
Antibody Anti-human CD45 DAKO Cat number: GA751 (Immunohistochemistry:
(mouse monoclonal) 1:25)
Antibody Anti-human CD3 DAKO Cat number: GA503 (Immunohistochemistry:
(rabbit polyclonal) 1:100)
Antibody Anti-human CD68 Novocastra Cat number: NCL-L-CD68 (Immunohistochemistry:
(mouse monoclonal) 1:1600)
Antibody Anti-human CD163 Novocastra Cat number: NCL-L-CD163 (Immunohistochemistry:
(mouse monoclonal) 1:800)
Continued on next page
Ramos, Tian, et al. eLife 2021;10:e62927. DOI: https://doi.org/10.7554/eLife.62927 16 of 29Research article Cancer Biology
Continued
Reagent type (species) or
resource Designation Source or reference Identifiers Additional information
Antibody Pan-collagen antibody ThermoFisher Scientific Cat number: PA1-85324 (Immunofluorescence:
(rabbit polyclonal) 1:200)
Antibody Streptavidin APC eBioscience Cat number: 17-4317-82 (Flow cytometry: 1:200)
Antibody IgG1-AlexaFluor 594 ThermoFisher Cat number: A-21125 (Immunofluorescence:
Scientific 1:200)
Antibody Streptavidin AlexaFluor ThermoFisher Cat number: S11227 (Immunofluorescence:
594 Scientific 1:2000)
Peptide, recombinant LAIR-1 FC This paper/NextCure See Materials and methods
protein LAIR-1- Fc, LAIR-2-Fc
(NC410) and LAIR-2-Fc
(NC410) FES generation
Peptide, recombinant LAIR-2 FC This paper/NextCure See Materials and methods
protein LAIR-1- Fc, LAIR-2-Fc
(NC410) and LAIR-2-Fc
(NC410) FES generation
Peptide, recombinant LAIR-2 FES This paper/NextCure See Materials and methods
protein LAIR-1- Fc, LAIR-2-Fc
(NC410) and LAIR-2-Fc
(NC410) FES generation
Peptide, recombinant Human collagen I R&D Systems; Stem Cell Cat number: 6220 CL-020
protein (R&D); 07005 (StemCell)
Peptide, recombinant Mouse collagen I Ray Biotech Cat number: DF-01-0058
protein
Peptide, recombinant Rat collagen I Yo Protein Cat number: ABIN628947
protein
Peptide, recombinant Human collagen III R&D Systems Cat number: 7294 CL-020
protein
Peptide, recombinant Rat collagen III Yo Protein Cat number: ABIN377054
protein
Commercial assay/kit mouse tumor dissociation Miltenyi Cat number: 130-096-730,
kit RRID:SCR_020285
Commercial assay/kit Cell Stimulation Cocktail ThermoFisher Scientific Cat number: 00-4970-93
plus protein transport
inhibitors
Commercial assay/kit Cytofix/CytoPerm Plus BD Cat number: 555028
Fixation/Permeabilization
Kit
Commercial assay/kit Singleplex Luminex Protein ThermoFisher Scientific Cat number: EPX010-
Assay Kit 10420-901
Commercial assay/kit Human T cell positive StemCell Cat number: 17851
selection kit
Commercial assay/kit Optiview DAB IHC Ventana kit Cat number: 760–700
detection kit
Other Zombie NIR viability dye Biolegend Cat number: 423105
Other ACK lysis buffer KD medical Cat number: 50-101-9080
Other RIPA Lysis buffer ThermoFisher Scientific Cat number: 89900
Other proteinase inhibitor Roche Cat number: 4693116001
Other DNase Millipore Cat number: 69182–3
Other Collagenase (from Sigma Cat number: C0130
Clostridium histolyticum)
Other Triton X-100 Roche Cat number: 10789704001
Other EZ-Link NHS-PEG4-Biotin ThermoFisher Cat number: 21329
Continued on next page
Ramos, Tian, et al. eLife 2021;10:e62927. DOI: https://doi.org/10.7554/eLife.62927 17 of 29Research article Cancer Biology
Continued
Reagent type (species) or
resource Designation Source or reference Identifiers Additional information
Other ZebaSpin Desalting ThermoFisher Cat number: 87770
Columns
Other DELFIA wash buffer PerkinElmer Cat number: 1244-114
Other DELFIA enhancement PerkinElmer Cat number: 4001-0010
solution
Other Europium-labeled PerkinElmer Cat number: 1244-360
Streptavidin
Other Masson’s Trichrome Abcam Cat number: Ab150686
Other Hematoxylin Sigma-Aldrich chemie Cat number: 51275-1L
Other DAPI VectaShield hardset Vector Lab Cat number: H-1500-10,
RRID:AB_2336788
Software, algorithm QuPath version 0.2.0 QuPath RRID:SCR_018257
Software, algorithm GraphPad Prism 8.0 GraphPad Prism RRID:SCR_002798
Software, algorithm TCGA database (https:// RRID:SCR_003193 R codes for TCGA analysis
cancergenome.nih.gov/) Files can be found in the
supplied Source code files
Mice
NSG (NOD-SCID IL2Rgnull) female mice were purchased at the age of 6–8 weeks old from Jackson
Labs. Upon arrival at NextCure, mice were divided into 5–6 mice per cage and kept in the quaran-
tine room for at least 6 days to acclimate to the environment. All mouse studies were performed at
NextCure based on Institutional Animal Care and Use Committee standards according to the proto-
cols of NextCure Animal (NCA) Study 164 (NCA#164 for Figure 3), NCA#122 (for Figure 4),
NCA#209 (for Figure 5), NCA#217 (for Figure 6) and NCA#270 (for Figure 3—figure supplement
4).
Bioinformatics
For collagen expression, the mRNA expression of 44 collagen genes in normal and tumor tissue for
each tumor type was queried using TCGA database (https://cancergenome.nih.gov/). Only those
cancers that contained both normal and tumor data were considered for further analyses. mRNA col-
lagen data was available in TCGA for 43/44 collagen genes except for COL6A5. The transcript per
million (TPM) values were log2 transformed and averaged per individual across all collagen genes.
The distribution of average expression across individuals was plotted using ggplot utility version
2.3.3.2 in R version 4.0.2. The distribution of expression in normal tissues was compared against
those in tumor tissue using a non-parametric Wilcoxon test in R.
For overall survival analysis, the log2 transformed collagen expression across 43 collagen genes
was averaged in each cancer. The average values were divided into four quantiles, and the patients
in lower quantile were considered as individuals with low expression and those in the upper quantile
were considered as those with high expression. The estimate of survival based on collagen expres-
sion was determined using the Kaplan–Meier method. The survival curves were drawn using ggsurv-
plot function in the survminer R package. The survival curves for the protein-tumor combination
where the p-value was less than 0.05 were considered significant. The expression and overall survival
analyses for LAIR-1 and LAIR-2 were performed in the same manner. R codes can be found in the
Source code files.
For collagen gene expression analysis of HT-29 cells, data was acquired from the public dataset
GSE41586 (Xu et al., 2013). Raw count data of untreated HT-29 cells was retrieved and normalized
using the DESeq2 package (v1.28.1) in R (v4.0.2). Data was then log2 transformed and plotted using
the ggplot2 package (v3.3.2).
Ramos, Tian, et al. eLife 2021;10:e62927. DOI: https://doi.org/10.7554/eLife.62927 18 of 29Research article Cancer Biology
Cells and antibodies
2B4 T cell hybridoma cells transduced with a NFAT-GFP reporter and hLAIR-1-CD3z, the hLAIR-1
reporter cells, or transduced with a NFAT-GFP reporter, the WT reporter cells, were cultured in
RPMI 1640 (Life Technologies) supplemented with 10% fetal bovine serum (FBS) (Sigma-Aldrich) and
1% penicillin/streptomycin (Gibco). P815 cells (ATCC) were cultured in DMEM, 2 mM L-glutamine,
25 mM HEPES, 10% FBS and Penicillin-Streptomycin (100 U/mL to 100 mg/mL). HT-29 cells (ATCC)
were cultured in IMDM, 2 mM L-glutamine, 25 mM HEPES, 10% FBS and Penicillin-Streptomycin
(100 U/mL to 100 mg/mL). CHO cells (Lonza) were cultured in CD CHO medium (ThermoFisher Scien-
tific). All cell lines were mycoplasma negative. Anti-human CD45 (hCD45)-BV421, anti-mouse CD45
(mCD45)-APC, anti-human CD3(hCD3)-PerCP.Cy5.5, anti-human CD8(hCD8)-AF488, anti-human
CD45RA (hCD45RA)-eF450, anti-human TNF-a (hTNF-a)-PE and anti-human IFN-V (hIFN-V)-PECy7
were from ThermoFisher Scientific. Anti-human CD4 (hCD4)-BV711 and anti-human CCR7 (hCCR7)-
PE was from Biolegend.
LAIR-1 Fc, LAIR-2 Fc (NC410) and LAIR-2 FES generation
The human LAIR-1 and LAIR-2 genes were synthesized by GeneArt and genetically fused with the N
terminus of IgG1 Fc domain. Stable CHO cell lines expressing recombinant human LAIR-1 Fc, LAIR-2
Fc or LAIR-2 FES (hIgG1 FES mutation silenced Fc receptor binding) fusion protein were developed
using the Lonza GS system. Briefly, 5 107 CHO cells were transfected by electroporation using 80
mg of linearized plasmid DNA in a 0.4 cm cuvette. Following electroporation (300 V, 900 mF), cells
were resuspended in 100 mL glutamine-free CD CHO medium (ThermoFisher Scientific). The follow-
ing day, MSX (Millipore) was added to a final concentration of 50 mM, and cells were monitored for
the next two weeks as prototrophic cells began to grow. Single clone of stably transfected cells was
cultured, and supernatant was harvested and purified by affinity chromatography. The protein purity
was determined by HPLC and sodium dodecyl sulfate-polyacrylamide gel electrophoresis. For the
LAIR-1-collagen binding assay and NC410 flow cytometry, LAIR-1 Fc and NC410 were biotinylated
with EZ-Link NHS-PEG4-Biotin (ThermoFisher Scientific) and free biotin was removed by ZebaSpin
Desalting Columns (ThermoFisher Scientific) following manufacturer’s instructions.
Human PBMC preparation for in vitro experiments
PBMCs were isolated from blood of healthy donors (in agreement with ethical committee of the Uni-
versity Medical Center Utrecht [UMCU] and after written informed consent from the subjects in
accordance with the Declaration of Helsinki) using standard Ficoll density gradient centrifugation.
Briefly, blood was diluted 1:1 with PBS and layered on top of 15 mL of Ficoll-Paque (GE healthcare)
in 50 mL conical tube. Suspension was centrifuged at 400 g for 20 min at 20˚C in a swinging
bucket rotor without brake. The mononuclear cell layer at the interphase was carefully collected and
transferred to a new 50 mL conical tube. The cells were washed with PBS and centrifuged at
300 g for 10 min at 20˚C. The supernatant was discarded, and the cell pellet was washed twice
with 50 mL PBS. The isolated PBMCs were immediately used for in vitro studies.
Binding and blocking studies
Octet avidity analysis
A ForteBio Octet RED96 instrument was used for avidity assessments. The anti-human Fc antibody
capture sensors (ForteBio) were first loaded with LAIR-2-Fc followed by an association step where
the loaded sensor was dipped into wells containing human, mouse or rat collagen I (human, R&D
Systems; mouse, Ray Biotech; rat, Yo Protein) or collagen III (human, R&D Systems; rat, Yo Protein).
NC410 protein was diluted in assay buffer (ForteBio) at 20 mg/mL, and the collagen concentration
ranged from 1.56 mg/mL to 100 mg/mL for collagen I and from 0.78 mg/mL to 50 mg/mL for collagen
III. Data processing was conducted using the Octet’s Data Analysis 9.0 software.
Time-resolved fluorometry (TRF) immunoassay
Enzyme Immuno Assay (EIA) plates were coated with human collagen I (StemCell) in 0.01 N HCL
(100 mL/well) overnight at 4˚C. The following day, plates were equilibrated to ambient temperature
and washed three times (300 mL/well) with DELFIA Wash buffer (PerkinElmer). The plates were
blocked for non-specific binding with 3% BSA (200 mL/well, Millipore) for 1 hr. Plates were washed
Ramos, Tian, et al. eLife 2021;10:e62927. DOI: https://doi.org/10.7554/eLife.62927 19 of 29Research article Cancer Biology
three times (300 mL/well) with DELFIA wash buffer, and an NC410-biotin and human LAIR-1 Fc mix-
ture (50 mL/well) was added to plates and incubated for 2 hr at ambient temperature. The plates
were washed three times (300 mL/well) with DELFIA wash buffer. Europium-labeled Streptavidin (Eu-
SA) (100 mL/well, PerkinElmer) was diluted 1:1000 in DELFIA assay buffer and was added to plates
and incubated for 1 hr at ambient temperature. Following the incubation, the plates were washed
with 300 mL/well of DELFIA wash buffer. DELFIA enhancement solution was equilibrated to ambient
solution during detection antibody incubation. Following the last wash, 100 mL of DELFIA enhance-
ment solution (PerkinElmer) was added to each well and incubated on a plate shaker for 5 min prior
to reading on an EnVision plate reader with excitation at 340 nm, and fluorescence reading at 615
nm (PerkinElmer).
Flow cytometry blocking studies
To assess the blocking capacity of NC410, a titration assay with LAIR-1 reporter cells was performed
as previously described (Lebbink et al., 2006). Black Falcon clear flat bottom 96-well plates were
coated with 5 mg/mL human collagen I (Sigma-Aldrich) in 2 mM acetic acid (Merck), anti-mouse-CD3
(BD), anti-human-LAIR-1 antibody (clone 8A8) in PBS (Sigma-Aldrich) or isotype control (eBioscience)
in PBS by spinning down for 3 min at 1700 rpm and incubating overnight at 4˚C. The next day, plates
were washed with PBS and pre-incubated with the indicated concentrations of NC410 or isotype
control (NextCure) in culture medium by spinning down for 5 min at 1500 rpm at room temperature
(RT) and incubating for 2 hr at 37˚C.
WT and hLAIR-1 reporter cells were harvested and seeded at 1 106 cells/mL in 50 mL/well on
top of the collagen and fusion protein-treated wells and spun down for 3 min at 1700 rpm at RT.
Plates were incubated overnight, approximately 16 hr, at 37˚C, and GFP expression was measured
on a LSRFortessa (BD Biosciences).
Incucyte assay
Plates were prepared similarly to the flow cytometric analysis. After adding reporter cells to collagen
and fusion protein-treated wells, plates were placed in the Incucyte S3 (Sartorius) and green fluores-
cence of the GFP expressed by the reporter cells was imaged every hour for 24 hr.
Analysis of Incucyte images was performed using the Incucyte 2020A analysis program (Sartorius),
where green fluorescence was evaluated using Top-Hat segmentation (radius 100 mm and threshold
2 GCU), edge split turned on, minimum mean intensity of 3 GCU and an area filter of 600 mm2 to cal-
culate the total green integrated intensity (GCU mm2/image) per well.
In vivo experiments
Leukopaks (StemCell) were diluted with PBS and layered with 35 mL of diluted cell suspension over
15 mL of Ficoll-Paque (GE healthcare) in 50 mL conical tube. Suspension was centrifuged at 400 g
for 30 min at 20˚C in a swinging bucket rotor without brake. The mononuclear cell layer at the inter-
phase was carefully collected and transferred to a new 50 mL conical tube. The cells were washed
with PBS and centrifuged at 300 g for 10 min at 20˚C. The supernatant was discarded, and the cell
pellet was washed twice with 50 mL PBS. The isolated PBMCs were frozen and stored in liquid
nitrogen.
Prior to in vivo studies, PBMCs were rested overnight in RPMI 1640, 2 mM L-glutamine, 10 mM
HEPES, 10% FBS, Penicillin-Streptomycin (100 U/mL to 100 mg/mL) and 250 U/mL DNase (Millipore).
Female NSG mice were injected intravenously (i.v.) with 1–2 107 PBMC or T cell-depleted (Stem-
Cell human T cell-positive selection kit) PBMCs in 100 mL of 1 PBS. The next day, 2 105 P815 cells
in PBS, or 0.1–1 106 HT-29 cells in PBS with 50% Matrigel (Corning) were injected subcutaneously
on the right flank. Mice were randomly assigned into treatment or control groups (six mice per
group). The sample size per group was determined with resource equation approach n = DF/k + 1,
where n = number of samples per group, k = number of groups and DF = degrees of freedom with
acceptable range between 10 and 20 in ANOVA and t-test (Charan and Kantharia, 2013;
Arifin and Zahiruddin, 2017). Beginning on day 1, LAIR-2 Fc and control protein were injected intra-
peritoneally (i.p.) Q4D 4 doses followed by Q7D until the endpoint. Tumor size was monitored 2–
3 times a week. Tumor volumes were determined according to the formula tumor volume = 0.5
(shorter diameter)2 longer diameter. At endpoint, tumor and spleen tissues were collected for T
Ramos, Tian, et al. eLife 2021;10:e62927. DOI: https://doi.org/10.7554/eLife.62927 20 of 29Research article Cancer Biology
cell population and/or cytokine analysis. In some studies, blood was collected weekly for T cell popu-
lation and collagen degradation analysis. Mice were randomized in all tumor models prior to treat-
ment. Tumor measurements were performed in a blinded manner.
For ex vivo analysis, cells were stained with Zombie NIR viability dye (Biolegend) in PBS at RT for
10 min. After washing with FACS buffer (2% FBS in PBS), cells were stained with antibodies against
cell surface antigens at 4˚C for 30 min. For the intracellular staining, cells were stimulated with Cell
Stimulation Cocktail plus protein transport inhibitors (ThermoFisher Scientific) at 37˚C for 5 hr fol-
lowed by Zombie NIR and cell surface antigen staining. After cell fixation and permeabilization, the
intracellular TNF-a and IFN-g were stained following the instructions of BD Cytofix/CytoPerm Plus
Fixation/Permeabilization Kit. All antibodies were used at the concentrations recommended by man-
ufacturers. Stained cells were washed and resuspended in 150 mL FACS buffer, and 80 mL of samples
were acquired on an Attune flow cytometer (ThermoFisher Scientific). Human CD4+ and CD8+ T cells
were gated based on live/hCD45+mCD45-hCD3+hCD4+hCD8- and live/
+ - + - +
hCD45 mCD45 hCD3 hCD4 hCD8 , respectively.
To prepare mouse blood T cells for staining, 80–200 mL blood was treated with 3 mL ACK lysis
buffer (KD medical) to lyse the red blood cells for 5 min at RT followed by washing with PBS. The ini-
tial volume of blood was recorded for calculation of cell counts per mL of blood according to the for-
mula: Cell counts per mL of blood = [acquired counts 150 1000] [initial blood volume (mL)
80].
To prepare the single-cell population from tumors for staining, tumor tissues were weighed, cut
into small pieces and digested with mouse tumor dissociation kit (Miltenyi) and dissociated with gen-
tleMACS Dissociator (Miltenyi). The tumor weight was recorded for the normalization of cell counts.
To assess cytokines from tissues, tumor and spleen tissues were weighed and cut into small
pieces in 1.5 mL Eppendorf tube on ice. 200 mL of RIPA Lysis buffer (ThermoFisher Scientific) was
added with proteinase inhibitor (Roche) and 250 U/mL of DNase (Millipore), and the tissues were dis-
sociated with pellet pestles (Sigma) on ice. The samples were kept on ice for 30 min, vortexing occa-
sionally. Centrifuge at 10,000 g for 20 min at 4˚C to pellet cell debris and then transfer the
supernatant to a fresh Eppendorf tube without disturbing the pellet. The tissue weight was recorded
for the normalization analysis of cytokines.
Luminex cytokine assay
Tissue lysate was used for analysis of the cytokine profile (SDF-1a, IL-2, IL-4, IP-10, IL-10, IL-17A,
IFN-g, TNF-a, I-TAC, granzyme B, sCD40L) using a Luminex assay. The Singleplex Luminex Protein
Assay Kit for each cytokine was from ThermoFisher Scientific. Antibody-specific capture magnetic
beads were added to wells of a 96-well plate. Samples and protein standards were then placed into
the microplate wells. After incubation, the beads were washed using a handheld magnet and were
resuspended in secondary detection antibody solution followed by washing and addition of strepta-
vidin-RPE. The beads were then washed again for analysis on a FlexMAP 3D (ThermoFisher
Scientific).
EDTA treatment of HT-29 cells
HT-29 cells were collected from T75 flasks (Thermo Scientific) using different concentrations of
EDTA (0.1; 0.2; 0.5; 1 and 2 mM) for 10 min at 37˚C. Cells were blocked with 10% BSA/10% normal
mouse serum (NMS)/10% FCS for 15 min at 4˚C. Cells were then incubated with biotin-labeled
NC410 (10 mg/mL; NextCure) in PBS + 1% BSA buffer for 30 min RT. After washing with PBS + 1%
BSA, by spinning down for 5 min at 1500 rpm at RT, cells were incubated with streptavidin APC
(eBioscience) diluted in PBS + 1% BSA buffer for 20 min at 4˚C. Cells were washed again and mea-
sured on a FACSCanto (BD Biosciences).
Collagenase treatment of HT-29 cells
HT-29 cells were collected from T75 flasks (Thermo Scientific) using 0.1 mM EDTA for 10 min at 37˚
C. Cells were washed and treated with 40 U Collagenase (from Clostridium histolyticum; Sigma) for
different time points (5, 10, 15, 20 and 30 min) at 37˚C. Cells were washed by spinning down for 5
min at 1500 rpm at RT and blocked with 10% BSA/10% NMS/10% FCS for 15 min at 4˚C. Cells were
washed and incubated with biotin-labeled NC410 (10 mg/mL; NextCure) in PBS + 1% BSA buffer for
Ramos, Tian, et al. eLife 2021;10:e62927. DOI: https://doi.org/10.7554/eLife.62927 21 of 29Research article Cancer Biology
30 min RT. After washing with PBS + 1% BSA, by spinning down for 5 min at 1500 rpm at RT, cells
were incubated with streptavidin APC (eBioscience) diluted in PBS + 1% BSA buffer for 20 min at 4˚
C. Cells were washed again and measured on a FACSCanto (BD Biosciences).
ADCC assay
ADCC with 51Cr-labeled target cells was described previously. Briefly, HT-29 target cells were
labeled with 100 mCi (3.7 MBq) 51Cr for 3 hr in complete medium. After extensive washing, cells
were adjusted to 105/mL. HT-29 cells were then incubated with NC410 or isotype control for 30 min.
Different effector to target ratios (E:T) were made by adding increasing amounts of PBMCs to
NC410 or isotype-treated HT-29 cells per well (a fixed amount of 10.000 tumor cells was used) in
round-bottom microtiter plates (Corning). After 24 hr of incubation at 37˚C, 51Cr release was mea-
sured in counts per minute (cpm). The percentage of specific lysis was calculated using the following
formula: % lysis = [(counts of sample–minimum release)/(maximum release–minimum release)] 100.
Target cells with PBMCs in complete medium or supplemented with 5% Triton X-100 (Roche Diag-
nostics) were used to determine minimum and maximum release, respectively.
Immunofluorescence staining
5000 HT-29 cells were seeded in black Falcon clear flat-bottom 96-well plates and cultured for 3
days. Cells were fixed with 4% paraformaldehyde for 15 min at RT and blocked with 5% BSA in PBS
for 1 hr at RT. Cells were then incubated with isotype control (NextCure), biotin-labeled NC410 (10
mg/mL, NextCure) or pan-collagen antibody (ThermoFisher Scientific) diluted in PBS + 1% BSA buffer
for 1 hr at RT. After thoroughly washing with PBS, the slides were incubated with anti-human IgG1-
AlexaFluor 594 or streptavidin AlexaFluor 594 (ThermoFisher Scientific) diluted in PBS + 1% BSA
buffer for 30 min at RT. Slides were finally washed and mounted with DAPI VectaShield hardset (Vec-
tor Lab) and allowed to settle before image acquisition on a Zeiss fluorescence microscopy (Zeiss)
using Zen software and ImageJ.
Collagen degradation peptide analysis
The mouse serum samples were assessed for collagen-degraded peptides (PRO-C3, C3M, C4M,
C4G, PRO-C6, C6M, VICM, reC1M, PRO-C23) by immunoassays by Nordic Bioscience as previously
described (Jensen et al., 2018; Rønnow et al., 2020).
Tumor specimens for immunohistochemistry
Specimens of seven selected tumor types were included for analysis: HNSC, GBM, SKCM, NSCLC,
HGSC, PDAC and STAD. Of each tumor type, in agreement with the ethical committee of the
UMCU, formalin-fixed paraffin-embedded (FFPE) material of 9–10 tumor specimens and 5 healthy
specimens was collected from the tissue biobank (research protocol 17-786). The cohort of HNSC
tumors comprised tongue tumors with a diameter of 10 mm or larger. Only melanomas with a Bre-
slow thickness of 0.5 mm or higher were included. Tissue was obtained from primary tumors.
Patients did not receive any systemic treatment or radiotherapy before the tumor specimens were
obtained. Healthy specimens were preferably separate tissue blocks obtained from the same
patients the tumor specimens were obtained from. In case of glioblastoma, healthy specimens were
collected postmortem.
Immunohistochemistry
The following stainings were performed on consecutive slides of all tumor specimens: H&E, Masson’s
Trichrome, LAIR-1, NC410, CD45, CD3, CD68 and CD163. The LAIR-1, CD45, CD3, CD68 and
CD163 stainings were performed using a Ventana Bench Mark XT Autostainer (Ventana Medical Sys-
tems, Tucson, AZ, USA). Stainings were performed on 4 mm sections of each tissue block. NC410
was biotinylated and used for manual, IHC staining. Antigen retrieval was performed by incubating
the slides at 100˚C for 24 or 64 min in either EDTA or Citrate buffer, as indicated in the table below.
For all assays, the sections were incubated with the primary antibody for 1 hr at RT. Subsequently,
the sections were incubated with HRP-labeled secondary antibody, developed using H2O2 and DAB
and counterstained with hematoxylin.
Ramos, Tian, et al. eLife 2021;10:e62927. DOI: https://doi.org/10.7554/eLife.62927 22 of 29Research article Cancer Biology
Antibody Supplier Clone Lot no Pretreatment Dilution
0
LAIR-1 (polyclonal) ATLAS antibodies - A103834 24 Citrate pH 6.0 1:500
LAIR-1 (monoclonal) BD Pharmingen DX26 550810 640 EDTA pH 9.0 1:100
NC410 NextCure - - 240 Citrate pH 6.0 1:500
CD45 DAKO PD7/26 + 2B11 110 240 EDTA pH 9.0 1:25
CD3 DAKO - 20042625 240 EDTA pH 9.0 1:100
CD68 Novocastra KP1 6009203 240 EDTA pH 9.0 1:1600
CD163 Novocastra 10D6 6064616 240 EDTA pH 9.0 1:800
Immunohistochemistry analysis
All slides were digitalized using the Aperio Scanscope XT slide scanner. Evaluation of stained tissue
slides was performed using QuPath (version 0.2.0) software. The percentage of tumor tissue binding
NC410 was calculated by annotation of the tumor in the tissue slide and quantifying the percentage
of DAB-stained tissue by using the Pixel Classifier.
Scoring of the immune phenotype was based on the presence and distribution of CD3-positive
lymphocytes (Chen and Mellman, 2017). Tumors with CD3+ cells in the tumor fields were scored
‘inflamed’; tumors with CD3+ cells in their stroma but without or with a relatively low amount of
CD3+ in the tumor fields were scored ‘immune-excluded’; tumors with a lack of CD3+ cells in their
stroma as well as in their tumor fields were scored ‘immune-desert’.
For quantification of the immune cell counts, regions of interest (ROIs) were annotated on the tis-
sue slides by drawing circles with a diameter of 600 mm at five random spots within the NC410 bind-
ing part of the tumor. Positive cells were quantified using the Positive Cell Detection tool. For each
staining, stain vectors and DAB cutoffs were determined based on a representative slide; the set-
tings were kept the same for all slides. Tumor area within the circles that was lost during staining
procedure or that was negative for NC410 binding was excluded from the analysis.
The percentage of NC410 binding to tissue within a tumor was calculated by dividing the stained
area by the total tumor area. The immune cell counts for each tumor were calculated by dividing the
total number of positive cells within the five ROIs by the total surface in mm2 of these ROIs.
Statistics
Data were graphed and analyzed using GraphPad Prism 8.0 (GraphPad software). Data are pre-
sented as the mean ± standard deviation (SD). The significance was analyzed with unpaired, two-
tailed Student’s t-tests and two-way ANOVA followed by multiple comparison.
Acknowledgements
We thank Michiel van der Vlist for his critical comments on the manuscript.
Additional information
Competing interests
Linjie Tian: LT, CS, AP, JS, JB, ZC, LL, SL and DF are employees from Nextcure. Nextcure holds a
patent on NC410. (PCT/US20 17/0453 10). The other authors declare that no competing interests
exist.
Funding
Funder Grant reference number Author
Dutch Research Council Vici 918.15.608 Linde Meyaard
(NWO)
Ramos, Tian, et al. eLife 2021;10:e62927. DOI: https://doi.org/10.7554/eLife.62927 23 of 29You can also read