Islands of retroelements are the major components of - bioRxiv
←
→
Page content transcription
If your browser does not render page correctly, please read the page content below
bioRxiv preprint first posted online Feb. 1, 2019; doi: http://dx.doi.org/10.1101/537357. The copyright holder for this preprint (which
       was not peer-reviewed) is the author/funder, who has granted bioRxiv a license to display the preprint in perpetuity.
                                 It is made available under a CC-BY-NC-ND 4.0 International license.

          Islands of retroelements are the major components of
                          Drosophila centromeres

      Ching-Ho Chang1*, Ankita Chavan2*, Jason Palladino2*, Xiaolu Wei3, Nuno M. C. Martins4, Bryce
      Santinello2, Chin-Chi Chen2,5, Jelena Erceg4, Brian J. Beliveau6,7,8, Chao-Ting Wu4, Amanda M.
      Larracuente1#, and Barbara G. Mellone2,9#.

      1
        Department of Biology, University of Rochester; Rochester, NY 14627
      2
        Department of Molecular and Cell Biology, University of Connecticut; Storrs, CT 06269
      3
        Department of Biomedical Genetics, University of Rochester Medical Center, Rochester, NY
      14642
      4
        Department of Genetics, Harvard Medical School; Boston, MA 02115
      5
        Current address: Department of Pathology, Johns Hopkins Medical Institutions, Baltimore, MD,
      21287
      6
        Wyss Institute for Biologically Inspired Engineering; Harvard Medical School, Boston, MA
      02115
      7
        Department of Systems Biology, Harvard Medical School; Boston, MA 02115
      8
        Department of Genome Sciences, University of Washington; Seattle, WA 98195
      9
        Institute for Systems Genomics, University of Connecticut; Storrs, CT 06269

      *These authors contributed equally to this work
      #Correspondence to: barbara.mellone@uconn.edu; alarracu@bio.rochester.edu

                                                                         1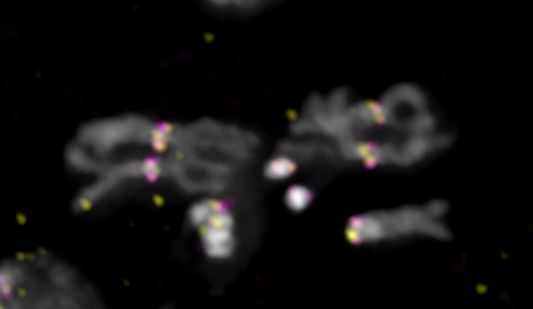
bioRxiv preprint first posted online Feb. 1, 2019; doi: http://dx.doi.org/10.1101/537357. The copyright holder for this preprint (which
       was not peer-reviewed) is the author/funder, who has granted bioRxiv a license to display the preprint in perpetuity.
                                 It is made available under a CC-BY-NC-ND 4.0 International license.

      Abstract
      Centromeres are essential chromosomal regions that mediate kinetochore assembly
      and spindle attachments during cell division. Despite their functional conservation,
      centromeres are amongst the most rapidly evolving genomic regions and can shape
      karyotype evolution and speciation across taxa. Although significant progress has been
      made in identifying centromere-associated proteins, the highly repetitive centromeres of
      metazoans have been refractory to DNA sequencing and assembly, leaving large gaps
      in our understanding of their functional organization and evolution. Here, we identify the
      sequence composition and organization of the centromeres of Drosophila melanogaster
      by combining long-read sequencing, chromatin immunoprecipitation for the centromeric
      histone CENP-A, and high-resolution chromatin fiber imaging. Contrary to previous
      models that heralded satellite repeats as the major functional components, we
      demonstrate that functional centromeres form on islands of complex DNA sequences
      enriched in retroelements that are flanked by large arrays of satellite repeats. Each
      centromere displays distinct size and arrangement of its DNA elements but is similar in
      composition overall. We discover that a specific retroelement, G2/Jockey-3, is the most
      highly enriched sequence in CENP-A chromatin and is the only element shared among
      all centromeres. G2/Jockey-3 is also associated with CENP-A in the sister species
      Drosophila simulans, revealing an unexpected conservation despite the reported
      turnover of centromeric satellite DNA. Our work reveals the DNA sequence identity of
      the active centromeres of a premier model organism and implicates retroelements as
      conserved features of centromeric DNA.

      Introduction
      Centromeres are marked by the histone H3 variant, CENP-A (also called Cid in Drosophila),
      which is necessary and sufficient for kinetochore activity [1, 2]. Although epigenetic mechanisms
      play a major role in centromere identity and propagation [3], centromeric DNA sequences can
      initiate centromere assembly in fission yeast [4] and humans [5], and centromeric transcripts
      play a role in centromere propagation in human cells [6], suggesting that centromeric DNA-
      encoded properties may contribute to centromere specification [7]. However, our current
      understanding of most centromeres remains at the cytological level, as metazoan centromeres
      are embedded in highly repetitive, satellite-rich pericentric heterochromatin and thus are largely
      missing from even the most complete genome assemblies. Only recently, long-read single
      molecule sequencing technologies made it possible to obtain linear assemblies of highly
      repetitive parts of multicellular genomes such as the human Y chromosome centromere [8] and
      maize centromere 10 [9].

      Drosophila melanogaster provides an ideal model to investigate centromere genomic
      organization as it has a relatively small genome (~180 Mb), organized in just three autosomes
      (Chr2, Chr3, and Chr4) and two sex chromosomes (X and Y) [10]. The estimated centromere
      sizes in Drosophila cultured cells range between ~200–500 kb [11] and map to regions within
      large blocks of tandem repeats [12-15]. While CENP-A associates with simple satellites in ChIP-
      seq data [16], it may bind to additional undiscovered sequences. The linear organization at the
      sequence level of any of the centromeres is unknown in this species. Early efforts to determine
      the structural organization of centromeres in D. melanogaster combined deletion analyses and
      sequencing of an X-derived minichromosome, Dp1187. These studies mapped the minimal
      DNA sequences sufficient for centromere function to a 420-kb region containing the AAGAG
      and AATAT satellites interspersed with “islands” of complex sequences [14, 15]. However, it is

                                                                         2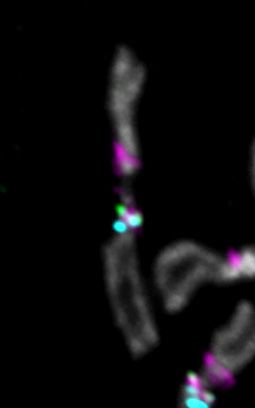
bioRxiv preprint first posted online Feb. 1, 2019; doi: http://dx.doi.org/10.1101/537357. The copyright holder for this preprint (which
       was not peer-reviewed) is the author/funder, who has granted bioRxiv a license to display the preprint in perpetuity.
                                 It is made available under a CC-BY-NC-ND 4.0 International license.

      unclear which parts of this minimal region comprise the active centromere, whether or not it
      corresponds the native X chromosome centromere, and if other centromeres have a similar
      organization. By and large, satellites have been regarded as the major structural elements of
      Drosophila, humans, and mouse centromeres [2, 3, 17].

      In this study, we reveal the detailed organization of all functional centromeres in D.
      melanogaster. By mapping CENP-A on single chromatin fibers at high-resolution, we discover
      that CENP-A primarily occupies islands of complex DNA enriched in retroelements, which are
      flanked by large blocks of simple satellites. Our genomic analyses show that all centromeres
      have a unique sequence organization, even though many of the centromeric elements are
      shared among them. In particular, all centromeres are enriched for a non-LTR retroelement in
      the Jockey family, G2/Jockey-3. While none of these elements are specific to centromeres, they
      are significantly enriched within these regions. We also find G2/Jockey-3 enriched at the
      centromeres of D. simulans, which has centromeric satellite arrays highly divergent from those
      of D. melanogaster [16]. Collectively, these data are consistent with the model that
      retroelements may have a conserved role in centromere specification and function, as proposed
      for other species (for review see [18]).

      Results
      Identification of candidate centromeres by long-read sequencing and ChIP-seq
      To identify the centromeric DNA sequences of D. melanogaster, we combined a long-read
      genome assembly approach [19] with four replicate CENP-A chromatin immunoprecipitations
      (ChIP) on chromatin from Drosophila embryos, followed by paired-end Illumina sequencing
      (ChIP-seq). We also performed ChIP-seq in Drosophila melanogaster Schneider (S2) cells, a
      widely used model for cell division studies. We took four complementary approaches to discover
      regions of the genome enriched for CENP-A: 1) identifying simple repeats enriched for CENP-A
      based on kmers; 2) mapping reads to a comprehensive repeat library to summarize enriched
      transposable elements (TEs) and complex repeats; 3) using de novo assembly methods to
      assemble contigs from the ChIP reads and calculating enrichment relative to input post hoc; and
      4) mapping reads to a heterochromatin-enriched assembly and calling ChIP peaks (Fig. 1A).

      In our ChIP experiments, CENP-A pulls down simple satellites, consistent with a previous study
      [16]. Among the kmers most enriched in CENP-A ChIP relative to input are the dodeca satellite
      and its variants, and complex kmers that include tandem (AATAG)n and (AATAT)n repeats (Fig.
      1B; Fig. S1; Table S1). Prodsat (also known as the 10bp satellite) is enriched in the CENP-A
      ChIP, but not relative to input (Fig. 1B). In addition to satellites, we found that CENP-A is also
      strongly associated with retroelements, particularly non-LTR LINE-like elements in the Jockey
      family and with the Ribosomal Intergenic Spacer (IGS). Among the Jockey elements the most
      highly enriched in CENP-A ChIPs are annotated as G2 and Jockey-3 (Fig. 1C; Table S2).
      However, our phylogenetic analysis suggests that these repeats correspond to the same type of
      element, as genomic copies of G2 and Jockey-3 are interleaved across the tree and not
      monophyletic (Fig. S2). Thus, we hereafter collectively refer to these elements as G2/Jockey-3.

      To detect CENP-A-enriched sequences independently of known repeats in repeat libraries or of
      genome assemblies, we de novo assembled CENP-A ChIP reads into contigs (i.e. ChIPtigs
      [20]) and calculated their CENP-A enrichments. The resulting CENP-A enriched ChIPtigs
      primarily contained fragments of TEs and other complex repeats, and some simple satellite
      repeats (Table S3).
      To determine the genomic location of CENP-A enriched sequences, we mapped ChIP reads to
      a new reference genome assembly that we generated using a heterochromatin-enriched

                                                                         3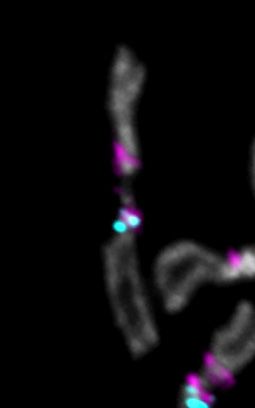
bioRxiv preprint first posted online Feb. 1, 2019; doi: http://dx.doi.org/10.1101/537357. The copyright holder for this preprint (which
       was not peer-reviewed) is the author/funder, who has granted bioRxiv a license to display the preprint in perpetuity.
                                 It is made available under a CC-BY-NC-ND 4.0 International license.

      assembly method resulting in greater representation of heterochromatin-associated regions [19]
      (Table S4, and supplemental results). Five contigs were consistently the most CENP-A enriched
      in the assembly, with highly reproducible ChIP peaks across technical and biological replicates
      (IDR < 0.05; Table S5; Fig. S3). These CENP-A-enriched contigs have a similar organization:
      they contain islands of complex DNA (e.g. TEs) flanked by simple tandem satellite repeats with
      known centromeric locations (Fig. 2; Fig. S4; Table 1). The candidate centromeric contig for the
      X chromosome (Contig79) is 70-kb and contains a 44-kb island of complex DNA (called Maupiti
      [15]), flanked by a short stretch of AAGAT satellite on one side and embedded in AAGAG
      satellite (Fig. 2A). This region has an organization that is nearly identical to that of the Dp1187
      minichromosome putative centromere [14, 15], suggesting that this contig may contain at least
      part of the endogenous X centromere. The candidate centromeric contig for chromosome 4
      (Contig119) contains a 42.8-kb island (we named Lampedusa) flanked by the AAGAT satellite
      (Fig. 2B). A recent study mapped the AAGAT satellite cytologically to centromeres of
      chromosome 4 and a B chromosome derived from this chromosome [21], consistent with
      Lampedusa being a candidate for centromere 4. The candidate centromeric contig for
      chromosome Y (Y_Contig26) consists of a 138-kb island (we named Lipari; Fig. 2C). The
      candidate centromeric contig for chromosome 3 (Contig 3R_5) contains a 68.5-kb island (we
      named Giglio) flanked by Prodsat and the dodeca satellite, which map to this centromere
      cytologically [12, 22, 23] (Fig. 2D). Finally, the candidate contig for chromosome 2
      (tig00057289) contains a small 1.8-kb complex island (we named Capri), flanked by the AATAG
      and AAGAG satellites (Fig. 2E). The majority of the top enriched de novo ChIPtigs (88/100 for
      R1; 19/30 for R2; 26/30 for R3; and 82/100 for R4) map uniquely to these five contigs (Table
      S3), providing independent support for the assembly and further substantiating our hypothesis
      that these contigs correspond to the centromeres.

      Genomic distribution of CENP-A in embryos and S2 cells
      Our ChIP-seq experiments and their analyses provide evidence that CENP-A is specifically
      associated with the island DNA sequences for Contig79 (XMaupiti), Contig119 (4Lampedusa),
      Y_Contig26 (YLipari), 3R_5 (3Giglio), and with a single interspersed G2/Jockey-3 fragment within
      tig00057289 (2Capri; Fig. 2; Fig. S4). A previous study that used a D. melanogaster native ChIP-
      seq dataset (using anti-GFP antibodies and CENP-A-GFP expressing embryos) focused
      exclusively on the quantification of simple repeats and did not identify any complex DNA
      associated with CENP-A [16]. However, our re-analysis of this dataset showed association of
      CENP-A-GFP with the centromere islands (Fig. S3B; Tables S4-S6). We validated individual
      elements for which we could design contig-specific qPCR primers in additional independent
      CENP-A ChIP experiments and confirmed that the CENP-A peaks in these regions are not a
      result of library amplification bias [24] (Fig. S5; Table S7).

      Having shown that CENP-A is associated with the complex islands, we next analyzed if the
      centromere extends to the surrounding satellite DNA. Simple sequences flanking the islands
      appear among the kmers enriched in the CENP-A ChIP (Fig. 1B; Table S1; Fig. S1). However, it
      is difficult to quantify the enrichment of CENP-A on simple satellite repeats for several reasons:
      1) simple satellite sequences may be over or underrepresented as an artifact of library
      preparation [24], particularly for ChIPseq experiments that rely on PCR amplification to
      construct libraries; 2) satellites are abundant genomic sequences that are largely missing from
      whole genome assemblies [10], making it difficult to precisely quantitate how much of these
      sequences exist in genomes (and therefore how much to expect in the input); 3) highly
      abundant repeats are expected to have a low signal-to-noise ratio if a relatively small fraction of
      a simple repeat is enriched in CENP-A relative to the overall abundance of this satellite in the
      genome; and 4) simple satellite repeats present a challenge for even long-read based genome
      assembly methods [25]. While we may be confident in large-scale structural features of

                                                                         4
bioRxiv preprint first posted online Feb. 1, 2019; doi: http://dx.doi.org/10.1101/537357. The copyright holder for this preprint (which
was not peer-reviewed) is the author/funder, who has granted bioRxiv a license to display the preprint in perpetuity.
It is made available under a CC-BY-NC-ND 4.0 International license.
assemblies involving highly repetitive sequences—we see even PacBio read depth in islands,
but uneven depth on simple satellites (Fig. S6). Due to these limitations, we caution against
using strictly assembly-based approaches in regions with simple repeats. Nonetheless, we
report the ChIP peaks on simple satellites (shaded in gray in Fig. 2). To confirm satellite
localization near each centromere, we employed IF with anti-CENP-C (an inner kinetochore
protein that co-localizes with CENP-A), followed by FISH with probes for the satellites dodeca,
AAGAG, AATAT, AAGAT, AATAG, and Prodsat on metaphase chromosome spreads from 3rd
instar larval brains (Fig. S7); a summary of the co-localization data is shown in Table 1.
Although CENP-A localizes exclusively to the centromeres at the cytological level, it is possible
that low-levels of CENP-A occupy non-centromeric DNA. We found a low, but consistent CENP-
A enrichment at genomic regions outside of the centromere islands, including some telomere-
associated elements (e.g. TART-A), rDNA genes from the rDNA clusters, and the LINE-like
retroelements DMRT1B and R2 (Fig. 1C; Table S8 and supplemental results). Many of these
associations likely represent non-specific peaks [26], as they were not highly enriched by
CENP-A ChIP-qPCR (Fig. S5). However, previous studies found evidence for an association of
some centromeric proteins with the nucleolus [27], perhaps relating to the possible association
that we detect for rDNA and rDNA-associated retroelements (e.g. R2). We also noted that non-
centromeric copies of G2/Jockey-3 were not consistently enriched in CENP-A (Table S8).
CENP-A ChIP-seq reads from S2 cells showed a similar enrichment profile of sequences
represented in the embryo ChIP-seq data (e.g. IGS and G2/Jockey-3) but were much more
enriched for additional retroelements that were not represented within our centromere contigs
(e.g. LTR elements Dm1731, HMSBeagle, and Max-I; Table S2). We also observed a similar
pattern of CENP-A enrichment on simple satellite repeats in S2 cells (AATAT, AATAG, AAGAG,
Prodsat, and dodeca; Table S1) and we confirmed that these satellites are also near
centromeres cytologically using IF/FISH in S2 cells (Fig. S8). However, complex satellites that
are pericentric in embryos, including complex satellites in the 1.688 family and Rsp (Table S2),
are CENP-A-enriched in S2 cells. This suggests that the centromeres of S2 cells may have
expanded into regions that are pericentromeric in flies; the additional retroelements enriched in
CENP-A may be pericentric or they may represent new retroelements insertions occurred in this
cell line. Our findings are consistent with the extensive structural rearrangements and polyploidy
reported for these cells [28].
Centromeres are unique, but are composed of similar non-LTR retrotransposons
Although each island has a distinct arrangement of AT-rich sequences, repeats, and TEs, their
compositions are overall similar. In particular, non-LTR retroelements in the Jockey family such
as G2/Jockey-3, Doc, and Doc-2 are especially abundant within CenX, Cen4, and CenY (Fig. 2;
Fig. 3A). Strikingly, G2/Jockey-3 is the only element present in all five of our centromere
contigs, suggesting a potential role in centromere function or specification. In our phylogenetic
analysis of genomic G2/Jockey-3 repeats in D. melanogaster, we cannot distinguish G2/Jockey-
3 elements at centromeres from those across the genome, suggesting that centromeric TEs do
not have a single origin (Fig. 3B and supplemental results). Although G2/Jockey-3 is not unique
to centromeres, and thus cannot be sufficient for centromere identity, it is significantly enriched
at centromeres: ~63% of all genomic copies of G2/Jockey-3 are found within our candidate
centromere contigs (Fig. 4 and Table S9). G2/Jockey-3 elements show signs of recent or
ongoing activity based on their insertion polymorphism [29], pattern of 5’ truncation (see
supplemental results), and expression (Fig. S9A). At least some of this expression comes from
the centromeres: we analyzed total embryo RNA extracts by reverse-transcription qPCR (RT-
qPCR) using primers targeting centromere-associated copies and found evidence for low-levels
5bioRxiv preprint first posted online Feb. 1, 2019; doi: http://dx.doi.org/10.1101/537357. The copyright holder for this preprint (which
was not peer-reviewed) is the author/funder, who has granted bioRxiv a license to display the preprint in perpetuity.
It is made available under a CC-BY-NC-ND 4.0 International license.
of G2/Jockey-3 transcription from copies in the X, 4 and 3 centromeres, with no or negligible
expression from the Y and 2 (Fig. S9B).
In addition to G2/Jockey-3, the 3Giglio island has 240 copies of a centromere-enriched variant of
the ribosomal IGS (supplemental results; Fig. S10). Among the islands, 2Capri differs the most,
being the smallest and harboring only a single fragment of G2/Jockey-3 (Fig. 2E). Importantly,
as was previously reported for the X-derived Dp1187 centromere [14, 15], none of the
sequences contained within these islands are exclusive to centromeres. However, several of
these elements are enriched in these regions compared to the genome in addition to
G2/Jockey-3. For example, DOC2, G, and Jockey-1 elements are non-LTR retroelements
enriched in CENP-A with a genomic distribution biased toward centromeres (Fig. 3A, columns
labeled “genome”; Fig. S11; Table S9).
Validation of centromeric contigs
To verify the association of our contigs with the centromeres, we performed IF with anti-CENP-
C antibodies, followed by FISH with satellite probes and custom-designed Oligopaints libraries
[30](see methods) for XMaupiti, 4Lampedusa, YLipari, and 3Giglio (Fig. 5 and Fig. S12). The XMaupiti
Oligopaints hybridized to the X as well as the Y centromeres on 3rd instar male larval brain
metaphase spreads (Fig. 5A and Fig. S12A). Similarly, the Oligopaints for 4Lampedusa hybridized
to the 4th as well as to the Y centromere (Fig. 5B and S12B), suggesting that Oligopaints for
XMaupiti and 4Lampedusa have homology to sequences at or near the Y centromere. In contrast, the
Oligopaints for YLipari (Fig. 5C and Fig. S12C) and 3Giglio were specific for their respective
centromeres (Fig. 5D and Fig. S12D). We could not use Oligopaints to validate 2Capri because of
its small size, but its organization, with AATAG and AAGAG satellites flanking a small CENP-A
enriched island (Fig. 2E), is consistent with our FISH analyses (Fig. 5E). In line with the CENP-
A ChIP-seq data, we observed significant differences between S2 and embryo centromeres by
Oligopaint FISH. With the exception of 3Giglio, centromeric island organization in S2 cells is
dramatically different from larval brain metaphase spreads (Fig. S13 and supplemental results),
in contrast to the conservation of the centromeric distribution of simple satellites (Fig. S8; Table
S1).
Drosophila centromeres tend to cluster in the nucleus cytologically [31, 32]. We found
independent support for the complex islands being centromeric by analyzing previously
published Hi-C data from D. melanogaster embryos. Island-island interactions were among the
most frequent inter-chromosome interactions, followed by interactions between islands and their
own proximal pericentric heterochromatin, and lastly by interactions between islands and distal
pericentric heterochromatin or euchromatin (Fig. S14; supplemental results). This analysis also
shows that indeed native centromeres interact with one another physically in the 3D nucleus.
Analysis of extended chromatin fibers reveals that CENP-A primarily occupies the
islands
Based on the enrichment of CENP-A with island-associated repeats, we hypothesized that the
TE-enriched islands are the major centromere components in D. melanogaster. To test this, we
investigated CENP-A occupancy, a direct reflection of centromere activity, and estimated the
size of each centromere by visualizing extended chromatin fibers [11, 33]. This method has two
major advantages: it does not rely on mapping low complexity ChIP reads, thus providing more
information that can be inferred by ChIP, and it affords single-chromosome, rather than
population, information on CENP-A localization. We carried out IF with CENP-A antibodies and
FISH with Oligopaint and satellite probes on cells from 3rd instar larval brains, selecting females
to ensure specificity for our XMaupiti and 4Lampedusa Oligopaints (Fig. 5). First, we calibrated our
fiber stretching using three FISH probes spanning 100kb: two heterochromatic (one for the Rsp
locus, Table S11 [34], and one Oligopaint targeting the pericentromere of chromosome 3L, see
6bioRxiv preprint first posted online Feb. 1, 2019; doi: http://dx.doi.org/10.1101/537357. The copyright holder for this preprint (which
was not peer-reviewed) is the author/funder, who has granted bioRxiv a license to display the preprint in perpetuity.
It is made available under a CC-BY-NC-ND 4.0 International license.
methods for coordinates) and one euchromatic (an Oligopaint targeting a region ~600kb from
the telomere of chromosome 3L, see methods). The estimated stretching for these fibers is ~10
kb/µm for all three locations, with no significant difference among them (P=0.085; Fig. S15). We
next determined the sizes of the CENP-A domain and corresponding island of each centromere
(Fig. 5 and Figs. S16–21). The size of the CENP-A domain varies between centromeres,
ranging in mean size between 101–172-kb (~11µm-17µm), smaller than previous estimates that
relied on the measuring of a mixture of centromeres in Drosophila Kc and S2 cells [11]. This is
consistent with our ChIP-seq analysis suggesting that S2 cells may have expanded
centromeres. X, Y and 2 are the largest centromeres, while 3 and 4 are the smallest (Fig. 5F–
G). Importantly, CENP-A primarily occupies the centromeric islands XMaupiti, 4Lampedusa, YLipari and
3Giglio (~70% of the CENP-A domain overlaps with the Oligopaint FISH signal; Fig. 5G and Figs.
S16-21). In some fibers, the XMaupiti Oligopaint FISH signal showed interspersion with FISH
signal for the AAGAG satellite (Fig. S16), this could be due to non-specific binding of the
AAGAG probe during FISH, which is optimized for Oligopaint specificity, or because AAGAG
repeats are collapsed in our assembly, including within Maupiti. We also noticed that the
estimated length of the Oligopaint-stained region was larger than the size of Maupiti in our CenX
contig (101.3 ±48.3-kb versus 44-kb; Fig. 2A and Fig. 5G), a discrepancy that we attribute to
variability in Maupiti Oligopaint probe hybridization. Alternatively, there could be additional
sequences with similarity to Maupiti interspersed in the flanking satellites nearby the contig (and
not in our assembly).
Analysis of centromere 4 shows that the CENP-A domain overlaps primarily with 4Lampedusa, and
partially with the flanking AAGAT satellite (Fig. 5B, F and Fig. S17). The Oligopaints for YLipari
target only the part of the island with the highest enrichment of CENP-A (Fig. 5C). Fibers for this
centromere show a continuous CENP-A domain that extends past the FISH signal, likely
representing the remainder of the YLipari island (Fig. 5C and Fig. S18).
Fibers for 3Giglio show co-localization between CENP-A and the island as well as a short,
variable region of co-localization with flanking dodeca satellite (Figure 5D, Fig. S19–20). We did
not observe CENP-A signal on the opposite side of Giglio, where Prodsat is located according
to our assembly (Fig. 5D). The centromere 3 satellite dodeca co-localizes with CENP-A on
fibers in S2 cells [12] and is highly enriched in our CENP-A ChIP-seq (Fig. 1B; Fig. S1). When
we tracked longer fibers from 3Giglio along dodeca, we observed a second CENP-A domain
where dodeca is interrupted by short fragments of Oligopaint FISH signal (Fig. S20), suggesting
the existence of DNA sequences with homology to Giglio interspersed within dodeca that are
not included in our assembly. A previous study identified sequences with homology to IGS
within the dodeca satellite in one BAC [12]. It is possible that the dodeca-associated Oligopaint
FISH signal in our extended fibers corresponds to these additional IGS sequences. These data
indicate that centromere 3 has two CENP-A domains, a major one on 3Giglio and one minor one
on dodeca, although these appear as a single domain in standard metaphase spread IF. Unlike
centromere 3, all other centromeres display a single CENP-A domain by fiber analysis (see Fig.
S21 for centromere 2 and data not shown). Our conclusions differ from the Talbert et al. study
[16], which concluded that dodeca was not associated with CENP-A. As recognized by the
authors, it is possible that different chromatin preparations, such as the MNase digestion, may
introduce biases, leading to an underrepresentation of sequences like dodeca in ChIPs [16].
Lastly, we analyzed the organization of 2Capri using FISH with a satellite combination unique to
this chromosome: AATAG, AAGAG, and Prodsat and found that the CENP-A domain
overlapped with all three satellites (Fig. 5E and Fig. S21). Thus, we speculate that the Prodsat
sequences pulled down by CENP-A as seen in our kmer analysis (Fig. 1B) and reported
previously [16] are coming from the centromere 2, not 3. We therefore conclude that D.
melanogaster CENP-A is primarily associated with the centromeric islands of chromosomes X,
4, Y, and 3, and less predominantly with the flanking satellites (Fig. 5G).
7bioRxiv preprint first posted online Feb. 1, 2019; doi: http://dx.doi.org/10.1101/537357. The copyright holder for this preprint (which
was not peer-reviewed) is the author/funder, who has granted bioRxiv a license to display the preprint in perpetuity.
It is made available under a CC-BY-NC-ND 4.0 International license.
G2/Jockey-3 is centromere-associated in Drosophila simulans
The G2/Jockey-3 retroelement is a recently active transposon [29] shared amongst all D.
melanogaster centromeres (Fig. 3A; Table S2). To determine if G2/Jockey-3 is enriched at the
centromeres outside of D. melanogaster, we investigated its centromeric distribution in the sister
species, D. simulans, which diverged from D. melanogaster only ~2 million years ago [35] and
yet displays major differences in satellite composition and distribution [36, 37]. These
differences are especially apparent in centromeric regions, where D. melanogaster displays
simple satellite repeats while D. simulans contains complex satellite repeats with larger repeat
units [16]. We reanalyzed published D. simulans cell line CENP-A ChIP-seq data [16] (see
supplemental results) and found that G2/Jockey-3 elements are also highly enriched in CENP-A
in this species, similar to D. melanogaster. The pileup of CENP-A ChIP reads on G2/Jockey-3
show that CENP-A is associated with the entire length of the retroelement in both D. simulans
and D. melanogaster, with no apparent affinity for any particular sequence (Fig. 6A–B).
To validate the association of G2/Jockey-3 with D. simulans centromeres, we designed a FISH
probe that targets ~1.6 kb at the 3’ of the D. melanogaster G2/Jockey-3 consensus sequence
(see methods; ~94% identical to D. simulans G2/Jockey-3 consensus sequence) and performed
IF/FISH on male larval brain metaphase spreads with anti-CENP-C antibodies, which recognize
CENP-A in both species [38]. We observed co-localization between CENP-C and G2/Jockey-3
at all D. simulans centromeres (Fig. 6C; note that chromosome 2 and 3 of D. simulans cannot
be distinguished morphologically [37]). The same probe showed co-localization of CENP-C and
G2/Jockey-3 at all D. melanogaster centromeres, except at centromere 2, which is consistent
with our model for this centromere showing only one copy of G2/Jockey-3 (Fig. 6D and Fig. 2E).
Based on these observations, we propose that G2/Jockey-3 is a conserved centromere-
associated retroelement in these species.
Discussion
Our study shows that combining long-read sequencing with ChIP-seq and chromatin fiber FISH
is a powerful approach to discover centromeric DNA sequences and their organization. We
reveal that, for all but one chromosome (chromosome 2, which has a single G2/Jockey-3
element), ~70% of the functional centromeric DNA of D. melanogaster is composed of complex
DNA islands. The islands are rich in non-LTR retroelements and are buried within large blocks
of tandem repeats (Fig. 7A). They likely went undetected in previous studies of centromere
organization (e.g. [12]) because three of the five islands are either missing or are incomplete in
the published reference D. melanogaster genome [10]. A recent study reported that satellite
DNA repeats comprise the majority of centromeric DNA in D. melanogaster embryos and S2
cells, by counting the relative number of motifs matching simple repeats in CENP-A ChIP
relative to input [16]. Our re-analysis of those data showed CENP-A enrichment on the islands,
suggesting that having an improved reference genome assembly [19] is crucial for identifying
centromeric DNA. To our knowledge, this is the first detailed report on the linear sequence of all
centromeres in a multicellular organism. Our overall strategy therefore provides a blueprint for
determining the composition and organization of centromeric DNA in other species.
To date, satellite DNAs have been regarded as the main sequence components of the
centromeres of primary animal model systems—humans, mice, and Drosophila [2, 3, 17].
However, retroelements are also abundant and widespread at the centromeres of plants such
as maize [39] and rice [40, 41]. Retroelements are also found at the centromeres of fungi [42],
humans [43], marsupials [44], bats [45], and gibbons [46], suggesting that they are pervasive
centromeric features (Fig. 7B). Our study shows that retroelements, particularly G2/Jockey-3,
are not merely present near centromeres but are components of the active centromere cores
through their association with CENP-A. Our BLAST search for G2/Jockey-3 retroelements
8bioRxiv preprint first posted online Feb. 1, 2019; doi: http://dx.doi.org/10.1101/537357. The copyright holder for this preprint (which
was not peer-reviewed) is the author/funder, who has granted bioRxiv a license to display the preprint in perpetuity.
It is made available under a CC-BY-NC-ND 4.0 International license.
suggests that they are restricted to the melanogaster subgroup, therefore we hypothesize that
different non-LTR retroelements may be present at the centromeres of other Drosophila
species. Why retroelements are such ubiquitous components of centromeres and if they play an
active role in centromere function remain open questions. In maize, centromeric retroelements
invade neocentromeres following their inception [47], suggesting a preference for DNA
sequences associated with CENP-A chromatin for retroelement insertion [18]. On the other
hand, a LINE-element was found to be an integral component of a human neocentromere [48,
49], raising the possibility that it is CENP-A that may bind preferentially to retroelement-
associated genomic regions [18]. Other models have proposed that retroelements could
produce non-coding RNAs that affect centromere specification [18, 48], and that retroelement
activity could help maintain centromere size through retrotransposition or by giving rise to
tandem repeats via recombination-mediated mechanisms (e.g. [50, 51]; reviewed in [52]).
Centromeric transcription contributes to centromere homeostasis in several organisms,
including fission yeast [53, 54], wallaby [55], human [6, 56], and Drosophila cells [57, 58]. Our
reanalysis of publicly available total RNA-seq reads was inconclusive about steady state
transcription levels coming from centromeric contigs (data not shown) due to extremely low
expression levels and insufficient read length, however our preliminary analysis with quantitative
RT-PCR with centromere-specific G2/Jockey-3 primer sets shows some evidence for a low level
of centromere expression.
In addition to retroelements, the centromeres of D. melanogaster display a diverse assortment
of repeats, none of which are exclusive to centromeres, with the exception of IGS, for which we
identified a centromere-enriched variant. The identification of the IGS tandem repeat within 3Giglio
is intriguing, as IGS sequences are dynamic in the potato [59], where they are located near the
centromere, as well as in the tobacco [60], the tomato [61], and the common bean [62], where
they show a dispersed pattern over several chromosomes. The origin of novel tandem repeats
is still elusive, but one way it has been proposed to occur for the IGS repeat in plants is through
the initial insertion of a retroelement within rDNA, followed by IGS duplication, amplification, and
transposition to a new locus [61].
Defining the span of the CENP-A domain is important to understand precisely which sequences
are associated with centromere activity and which are part of pericentric heterochromatin.
Although we are able to confidently map our ChIP-seq reads to the islands to determine CENP-
A occupancy, the same cannot be done for simple satellites due to the limitations of mapping to
highly repetitive DNA. We therefore infer the organization of the centromere from analyzing
extended chromatin fibers by IF/FISH. Blocks of simple satellite sequences flank the islands on
each of our contigs, with the exception of the Y centromere contig, however, these regions
represent only a fraction of the estimated abundance of those repeats in the genome. For
example, dodeca satellite occupies ~1Mb of the genome [63] and we have ~570 kb total dodeca
sequence in the assembly, however only ~35 kb of dodeca is on the centromere 3 contig.
Therefore, for many satellite sequences, inferences based on read mapping, even uniquely
mapped reads, are confounded because satellites are underrepresented in the assembly. Our
analysis of chromatin fibers suggests that CENP-A spans beyond the islands into the simple
satellites, although the precise boundaries remain elusive (Fig. 7A).
The finding that CENP-A can bind to several different sequences that are not uniquely
associated with centromere regions is consistent with the epigenetic model of centromere
specification, which proposes that specific sequences alone do not govern centromere activity
[3]. Yet it is possible that the diverse sequence arrangements observed at each centromere
somehow contribute to centromere activity or specification [18, 39]. Possible mechanisms
include the promotion of unusual types of transcription, as reported for fission yeast [64], or the
9bioRxiv preprint first posted online Feb. 1, 2019; doi: http://dx.doi.org/10.1101/537357. The copyright holder for this preprint (which
was not peer-reviewed) is the author/funder, who has granted bioRxiv a license to display the preprint in perpetuity.
It is made available under a CC-BY-NC-ND 4.0 International license.
formation of non-B DNA structures (e.g. stem loops, hairpins, and triplexes) that may promote
CENP-A deposition [7, 12, 65]. Knowing the identity of D. melanogaster centromeric DNA will
enable the functional interrogation of these elements in this powerhouse model organism.
10bioRxiv preprint first posted online Feb. 1, 2019; doi: http://dx.doi.org/10.1101/537357. The copyright holder for this preprint (which
was not peer-reviewed) is the author/funder, who has granted bioRxiv a license to display the preprint in perpetuity.
It is made available under a CC-BY-NC-ND 4.0 International license.
Previous Reports This study
Satellite Sequence Cen Peri Het Cen Peri Het
a,b,c,d
AATAT (AATAT)n X - 3,4,Y X Y 3,4,Y
a,b,c
AAGAG (AAGAG)n X - 2,3,4,Y 2,X 4 3,Y
a,b
AATAG (AATAG)n - - 2,Y 2* 3 2,Y
e
AAGAT (AAGAT)n 4 - - 4 X 2
f
dodeca (CGGTCCCGTACT/ 3 - - 3 - -
GGTCCCGTACT)n
a,g
Prodsat (AATAACATAG)n - 2,3 - 2 2,3 -
Table 1: Location of centromeric and centromere-proximal satellites in Drosophila
melanogaster. Locations of satellite on chromosomes X, Y, 2, 3, and 4 according to previous
reports as well our observations in this report by IF-FISH in the D. melanogaster sequenced
strain iso-1. Each satellite location is characterized as being centromeric (Cen, overlaps with
CENP-C), pericentric (Peri, juxtaposed to CENP-C) or heterochromatic (Het, more distal than
pericentric). Note that the dodeca satellite includes its variant and Prodsat is also known as the
10bp satellite. *Indicates a small block not easily detected by FISH.
a
Lohe et al., 1993 [66]; Jagannathan et al. 2017 [37]
b
Talbert et al., 2018 [16]
c
Sun et al., 2003 [14]
d
Tolchov et al., 2000 [67]
e
Hanlon et al. 2018 [21]
f
Abad et al., 1992 [63]; Garavís et al., 2015 [12]; Jagannathan et al., 2017 [37]
g
Torok et al., 1997,2000 [68, 69]; Blower and Karpen, 2001 [70]; Garavis et al., 2015 [12]
11bioRxiv preprint first posted online Feb. 1, 2019; doi: http://dx.doi.org/10.1101/537357. The copyright holder for this preprint (which
was not peer-reviewed) is the author/funder, who has granted bioRxiv a license to display the preprint in perpetuity.
It is made available under a CC-BY-NC-ND 4.0 International license.
Author contributions
AML and BGM conceived the project, designed experiments, and wrote the manuscript. AC, JP,
BS, and BGM performed wet lab experiments and analyzed data; C-HC, XW, and AML
performed computational experiments and analyzed data; NMCM and BJB designed
Oligopaints; JE and C-TW provided resources; all authors contributed to editing the manuscript
and writing the supplemental results and methods.
Acknowledgments
We are grateful to Gary Karpen for the anti-CENP-A antibody and for comments on the
manuscript. We also thank Guy Nir (Oligopaint design), Kevin Wei (kseek), Karen Miga
(discussion), Tom Eickbush (discussion), Rachel O’Neill (discussion and comments on the
manuscript), Sarah Trusiak (early stages data analysis), Bo Reese and the University of
Connecticut Center for Genome Innovation (sequencing resources), and the University of
Rochester Center for Integrated Research Computing (computing cluster resources). We thank
members of Larracuente’s and Mellone’s labs for comments on the manuscript. Portions of
computational work for Oligopaints design were conducted on the Orchestra and O2 High
Performance Compute Clusters, supported by the Research Computing Group at Harvard
Medical School.
Figure legends
Figure 1. CENP-A binding association with satellites and transposable elements.
A) Schematic of the strategy used to identify the DNA sequence of D. melanogaster
centromeres. The Illumina reads are 2x150bp. B) Kseek plot showing the relative
abundance of simple repeat sequences in CENP-A ChIP compared to the input. Plotted
on the x-axis is the median of CENP-A ChIP reads normalized over total mapped
CENP-A ChIP reads across four ChIP replicates. Plotted on the y-axis is the median of
input reads normalized over total mapped input reads across four replicates. The top 7
kmers in the ChIP read abundance are labeled. The line represents the enrichment of
CENP-A ChIP/Input for AATAC, a non-centromeric simple repeat. Repeats to the right
of the line are putatively enriched in CENP-A. C) Plot of the normalized CENP-A/Input
reads on a log scale for each replicate, sorted by median (red lines) for complex repeat
families. Shown are only the complex repeats in the top 20% across all four CENP-A
ChIP replicates.
Figure 2. CENP-A occupies DNA sequences within putative centromere contigs.
Organization of each CENP-A enriched island corresponding to centromere candidates:
A) X centromere, B) centromere 4; C) Y centromere; D) centromere 3; E) centromere 2.
Different repeat families are color coded (see legend; note that Jockey elements are
shown in one color even though they are distinct elements). Shown are the normalized
CENP-A enrichment over input (plotted on a log scale) from one replicate (Replicate 2,
other replicates are in Fig. S4) colored in gray for simple repeats and black for complex
island sequences. While the mapping quality scores are high in simple repeat regions,
we do not use these data to make inferences about CENP-A distribution (see text for
details). The coordinates of the significantly CENP-A-enriched ChIPtigs mapped to
these contigs (black) and the predicted ChIP peaks (orange) are shown below each
plot.
12bioRxiv preprint first posted online Feb. 1, 2019; doi: http://dx.doi.org/10.1101/537357. The copyright holder for this preprint (which
was not peer-reviewed) is the author/funder, who has granted bioRxiv a license to display the preprint in perpetuity.
It is made available under a CC-BY-NC-ND 4.0 International license.
Figure 3. Centromeres are enriched in non-LTR retroelements in the Jockey
family. A) Density of all repetitive elements on each candidate centromere contig and
the entire genome (minus the centromeres) grouped by type: non-LTR retroelements,
LTR retroelements, rDNA-related sequences, and simple satellites. G2/Jockey-3 is
present on all centromeres. B) Maximum likelihood phylogenetic tree based on the
entire sequence of all G2/Jockey-3 copies in D. melanogaster inside (squares) and
outside (circles) of centromeric contigs, and on the consensus repeat in its sister
species D. sechellia and D. simulans, and a more distantly related species (D. yakuba).
The tree shows that centromeric G2/Jockey-3 elements do not have a single origin.
Figure 4. Genomic distribution of G2/Jockey-3 elements in the D. melanogaster
genome. Location of G2/Jockey-3 elements across chromosome 2 (A), 3 (B), 4 (C), X
(D), and Y (E). Contigs from each chromosome were concatenated in order with an
arbitrary insertion of 100 kb of ‘N’. Distances along the x-axis are approximate. The
order and orientation of the Y chromosome contigs is based on gene order (see [19]).
Each triangle corresponds to one TE, where filled shapes indicate full length TEs and
open shapes indicate truncated TEs. The vertical gray bars represent the arbitrary 100
kb window inserted between contigs, indicating where there are gaps in our assembly.
The centromere positions are set to 0 for each chromosome. The insets zoom in to
show the distribution of G2/Jockey-3 elements on the centromere contigs.
Chromosomes are not drawn to scale (chromosome 4 and Y are enlarged).
Figure 5. Islands of complex DNA are major components of centromeres. A-D)
Top, mitotic chromosomes from male larval brains showing IF with anti-CENP-C
antibodies (green, inset) and FISH with chromosome-specific Oligopaints (magenta).
Bar 1µm. Middle, schematic of centromere contigs (see key) and location of Oligopaint
targets (magenta). Bottom, IF-FISH on extended chromatin fibers from female larval
brains. Anti-CENP-A antibodies (green), Oligopaints FISH (in panels A, B, and D;
magenta) and a centromere-specific satellite (cyan, and in E also in magenta). Dashed
rectangles show the span of the Oligopaint probes, except for E, where it is placed
arbitrarily within the CENP-A domain where the cen 2 contig could be located. Bar 5µm.
A) X centromere; B) Centromere 4; C) Y centromere; D) Centromere 3 (see also Fig.
S20); E) Centromere 2 using FISH probes AAGAG (magenta) and AATAG (cyan). The
scale shown for the centromere 2 diagram is approximate. F) Scatter plot of CENP-A IF
signal length for each centromere. Error bars=SD. n=18-30 fibers for each centromere.
Significant P-values are shown (unpaired T-test). G) Table showing the lengths of
Oligopaint FISH and CENP-A IF signals on fibers (kb±SD estimated based on
10µm=100kb, Fig. S15). % overlap corresponds to CENP-A domain length/Oligopaint
FISH length. The difference between the sizes of the CENP-A domain and the
corresponding islands is significant (unpaired t-test). n/a = not applicable. Additional
fibers are shown in Figs. S16-21.
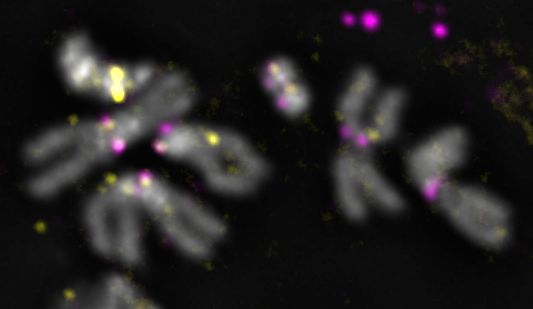
Figure 6. The association between G2/Jockey-3 and centromeres is conserved in
D. simulans. A) Plot of the normalized CENP-A enrichment over input across the D.
simulans G2/Jockey-3 consensus sequence using CENP-A ChIP-seq data from D.
simulans ML82-19a cells (Talbert et al. 2018) showing that G2/Jockey-3 is enriched in
13bioRxiv preprint first posted online Feb. 1, 2019; doi: http://dx.doi.org/10.1101/537357. The copyright holder for this preprint (which
was not peer-reviewed) is the author/funder, who has granted bioRxiv a license to display the preprint in perpetuity.
It is made available under a CC-BY-NC-ND 4.0 International license.
CENP-A in D. simulans. 15m and 5m indicate duration of MNase digestion and IP and
IP2 are technical replicates. Note that the first 487bp of D. simulans G2/Jockey-3
consensus sequence, which are homologous to the 500bp satellite, are not included in
this figure; the 500bp satellite was previously reported as enriched in CENP-A in D.
simulans [16]. B) Plot of the normalized CENP-A enrichment over input across the D.
melanogaster G2/Jockey-3 consensus sequence using our CENP-A ChIP-seq
replicates (R1-R4) and ChIP-seq from CENP-A-GFP transgenic flies from Talbert et al.
2018. IF-FISH on C) D. simulans (w501) and D) D. melanogaster (iso-1) mitotic
chromosomes from male larval brains using an antibody for CENP-C (magenta) and
FISH with a G2/Jockey-3 Digoxigenin labeled FISH probe (yellow). DAPI is shown in
gray. Bar 5µm.
Figure 7. Drosophila centromere organization and widespread presence of
retroelements at centromeres. A) Schematic showing centromere organization of
Drosophila melanogaster. For at least centromeres X, 4 and 3 (since the sequences
flanking the Y centromere are not in our assembly), the bulk of CENP-A chromatin is
associated with the centromere islands, while the remaining CENP-A is on the flanking
satellites. Although the complexity of island DNA allowed us to identify centromere
contigs by long-read sequencing, the flanking satellites remain largely missing from our
genome assembly, due to their highly repetitive nature. The approximate satellite size
estimates are based on Jagannathan et al. [37]. B) Phylogenetic tree showing that
centromere-associated retroelements are common across highly diverged lineages:
Gossypium hirsutum (cotton) [71], Zea mays mays (maize) [9, 39], Oryza sativa (rice)
[40, 41, 72], Triticum boeoticum (wild wheat) [73], Cryptococcus [42], Phyllostomid (bat)
[45], Hoolock leuconedys (gibbon) [46], Homo sapiens (human) [43] and a human neo-
centromere [49], Macropus eugenii (tammar wallaby) [74-76], Phascolarctos cinereus
(koala) [77], Drosophila melanogaster (this paper). The Phylogeny was constructed
using TimeTree [78]. Indicated are the retroelement type and the clade that the element
belongs to with element types as follows: LTR, Long Terminal Repeat retroelement;
Non-LTR, Non-Long Terminal Repeat retroelement. The circles indicate the
experimental evidence for centromere-association of retroelements: FISH, CENP-A
ChIP-seq (ChIP), and genome or BAC sequencing (Seq).
14A B
CENP-A ChIP-seq 0.6
median (Input reads/total reads)
Prodsat
ChIP libraries
ChIP 0.5
0-12h embryos
Input libraries
CENP-A Input
0.4
chromatin
S2 cells
0.3
Computational analyses 0.2 AATAT
•Simple repeat kmer counting •Comprehensive repeat library AATAC AAGAG
•De novo assembly of ChIP reads •Heterochromatin-enriched assembly 0.1
AAGAT AATAG
0.0 dodeca
Validation 0.00 0.02 0.04 0.06 0.08 0.10
•Oligopaints and satellite IF-FISH •Hi-C median (CENP-A ChIP reads/total reads)
•ChIP-qPCR •Fiber-IF-FISH
C
10.0
log2 (ChIP/Input)
7.5
5.0
2.5
0.0
TART-A
DMRT1B
Jockey-1
IGS3cen
DM1731
Blastopia
Chimpo
Bica
G2/Jockey-3
G
Gypsy8
Doc2
R2
G6
BEL-6
Figure 1. CENP-A binding association with satellites and transposable elements. A) Schematic of the strategy used
to identify the DNA sequence of D. melanogaster centromeres. The Illumina reads were 2x150bp. B) Kseek plot showing
the relative abundance of simple repeat sequences in CENP-A ChIP compared to the input. Plotted on the x-axis is the
Repeat
median of CENP-A ChIP reads normalized over total mapped CENP-A ChIP reads across four ChIP replicates. Plotted on
the y-axis is the median of input reads normalized over total mapped input reads across four replicates. The top 7 kmers in
the ChIP read abundance are labeled. The line represents the enrichment of CENP-A ChIP/Input for AATAC, a non-centro-
meric simple repeat. Repeats to the right of the line are putatively enriched in CENP-A. C) Plot of the normalized
CENP-A/Input reads on a log scale for each replicate, sorted by median (red lines) for complex repeat families. Shown are
only the complex repeats in the top 20% across all four CENP-A ChIP replicates.A B
G2/Jockey-3 Density
Jockey-1
color = species/annotation
DOC2
10-2 D. sechellia
non-LTR DOC
D. simulans
G6 10-3 D. melanogaster G2/Jockey-3
G5
fill = completeness
G 10-4
Full length
BS Truncated
DMRT1B 10 -5
shape = location
TART
R2
100 Centromere
Other
Copia
Repeat
Gypsy-2*
LTR
Gypsy-24*
Gypsy-27* 100
Gypsy-7*
Nomad
IGS 3cen
ETS
rDNA
ITS2
5.8S rDNA D. yakuba
28S rDNA
18S rDNA
AAGAT
satellite
AAGAG
AATAG
Prodsat
dodeca
cen X cen 4 cen Y cen 3 cen 2 genome 0.05
Genomic location
Figure 3. Centromeres are enriched in non-LTR retroelements in the Jockey family. A) Density of all repetitive elements on
each candidate centromere contig and the entire genome (minus the genome) grouped by type: non-LTR retroelements, LTR
retroelements, rDNA-related sequences, and simple satellites. G2/Jockey-3 is present on all centromeres. B) Maximum likelihood
phylogenetic tree based on the entire sequence of all G2/Jockey-3 copies in D. melanogaster inside (squares) and outside (circles)
of centromeric contigs, and on the consensus repeat in its sister species D. sechellia and D. simulans, and a more distantly related
species (D. yakuba). The tree shows that centromeric G2/Jockey-3 elements do not have a single origin.A
−20 −10 0 10 20
Ch 2L position (Mb) CEN 2 Ch 2R position (Mb)
−10 0 10
Cen2 position (kb)
B
−30 −20 −10 0 10 20 30
Ch 3L position (Mb) Ch 3R position (Mb)
CEN 3
−40 −20 0 20 40
Cen3 position (kb)
C D
0 1 −20 −10 0
Ch 4 position (Mb)
CEN 4 Ch X position (Mb)
CEN X
−40 −20 0 20 40
−20 0 20
Cen4 position (kb)
CenX position (kb)
E
−10 −5 0
Ch Y position (Mb)
CEN Y
G2/Jockey-3 full-length
G2/Jockey-3 truncated
−60 −40 −20 0 20 40 60
CenY position (kb)
Figure 4. Genomic distribution of G2/Jockey-3 elements in the D. melanogaster genome. Location of G2/Jockey-3 elements across A) chromosome
2, B) chromosome 3 , C) chromosome 4, D) X chromosome, and E) Y chromosome. Contigs from each chromosome were concatenated in order with an
arbitrary insertion of 100 kb of ‘N’. Distances along the x-axis are approximate. The order and orientation of the Y chromosome contigs is based on gene
order (see [19]). Each triangle corresponds to one TE, where filled shapes indicate full length TEs and open shapes indicate truncated TEs. The vertical
gray bars represent the arbitrary 100kb window inserted between contigs, indicating where there are gaps in our assembly. The centromere positions are
set to 0 for each chromosome. The insets zoom in to show the distribution of G2/Jockey-3 elements on the centromere contigs. Chromosomes are not
drawn to scale (chromosome 4 and Y are enlarged).A B C
X Chromosome Chromosome 4 Y Chromosome Prodsat
AAGAG
CENP-C
CENP-C
CENP-C
AAGAT
AATAG
AATAT/AATATAT
dodeca
Gypsy
DNA transposon
IGS
Maupiti Lampedusa Lipari Jockey
Other LTR
Other Non-LTR
10kb 10kb 10kb Other repeats
Merge Merge Merge
Lampedusa Lipari
Maupiti
CENP-A
CENP-A
CENP-A DAPI
AAGAT
AAGAG
DAPI
F P=0.0011
P=0.0158
DAPI P=0.0170
P=0.0012
40
P-3
ey
A C erg
e
NP
-C
2/J
o ck
M CE G
X
0 2 4 6 8 10
15m IP
log2(ChIP/Input)
5m IP
CENP-C G2/Jockey-3 DAPI
5m IP2 4
ii
i
4 Y
Y X
2 or 3 (i)
D. simulans
0 1000 2000 3000 4000 2 or 3 (ii)
D. simulans G2/Jockey-3 position (bp)
-3
ey
B D rge
-C
NP 2/Jo
ck
Me C E G
2 4 6 8 10 12 14
R1
R2
R3 X
R4
log2(ChIP/Input)
CENP-AGFP CENP-C G2/Jockey-3 DAPI
4
Y 4
X 2
Y
3
3
D. melanogaster
2
0
0 1000 2000 3000 4000
D. melanogaster G2/Jockey-3 position (bp)
Figure 6. The association between G2/Jockey-3 and the centromeres is conserved in D. simulans. A) Plot of the normalized CENP-A
enrichment over input across the D. simulans G2/Jockey-3 consensus sequence using CENP-A ChIP-seq data from D. simulans ML82-19a
cells (Talbert et al. 2018) showing that G2/Jockey-3 is enriched in CENP-A in D. simulans. 15m and 5m indicate duration of MNase digestion
and IP and IP2 are technical replicates. Note that the first 487bp of D. simulans G2/Jockey-3 consensus sequence, which are homologous to
the 500bp satellite, are not included in this figure; the 500bp satellite was previously reported as enriched in CENP-A in D. simulans [16]. B)
Plot of the normalized CENP-A enrichment over input across the D. melanogaster G2/Jockey-3 consensus sequence using our CENP-A
ChIP-seq replicates (R1-R4) and ChIP-seq from CENP-A-GFP transgenic flies from Talbert et al. 2018. IF-FISH on C) D. simulans (w501) and
D) D. melanogaster (iso-1) mitotic chromosomes from male larval brains using an antibody for CENP-C (magenta) and FISH with a
G2/Jockey-3A centromere contig CENP-A chromatin
H3 chromatin
satellite island satellite
>>>>> >>>>>
0–35kb 1.8–138kb 0–35kb
unassembled unassembled
~200kb–5.5Mb ~200kb–5.5Mb
>>>>>>>>>>>>>>>>>>>>>>>>>>>>>>>>>>>>>>>>>>>>>>>>>>>>>>>>>>>>>>>>>>>>> >>>>>>>>>>>>>>>>>>>> >>>>>>>>>>>>>>>>>>>>>>>>>>>>>>>>>>>>>>>>>>>>>>>>>
pericentromere centromere pericentromere
~110-172kb
B
Species Retroelements Evidence Refs
type | clade FISH ChIP Seq
Plants Gossypium hirsutum LTR | Ty3-gypsy 71
Zea mays mays LTR | CRM 9,39
Oryza sativa LTR | CRR 40,41,72
Triticum boeoticum LTR | CRW 73
Fungi Cryptococcus sp. LTR | Ty3-gypsy, Ty1-copia 42
Phyllostomid sp. Non-LTR | LINE-1 45
Hoolock leuconedys Non-LTR | LAVA 46
1,100 Mya Mammals
Homo sapiens Non-LTR | LINE-1 43, 49
Marsupials
Macropus eugenii Non-LTR, LTR 74-76
800 Mya Phascolarctos cinereus Non-LTR, LTR 77
Animals
Drosophila melanogaster Non-LTR | Jockey this paper
1,500 200 0
Time (Million years ago)
Figure 7. Drosophila centromere organization and widespread presence of retroelements at centromeres. A)
Schematic showing centromere organization of Drosophila melanogaster. For at least centromeres X, 4 and 3 (since the
sequences flanking the Y centromere are not in our assembly), the bulk of CENP-A chromatin is associated with the
centromere islands, while the remaining CENP-A is on the flanking satellites. Although the complexity of island DNA
allowed us to identify centromere contigs by long-read sequencing, the flanking satellites remain largely missing from
our genome assembly, due to their highly repetitive nature. The approximate satellite size estimates are based on
Jagannathan et al. [37]. B) Phylogenetic tree showing that centromere-associated retroelements are common across
highly diverged lineages: Gossypium hirsutum (cotton) [71], Zea mays mays (maize) [9, 39], Oryza sativa (rice) [40, 41,
72], Triticum boeoticum (wild wheat) [73], Cryptococcus [42], Phyllostomid (bat) [45], Hoolock leuconedys (gibbon) [46],
Homo sapiens (human) [43] and a human neo-centromere [49], Macropus eugenii (tammar wallaby) [74-76],
Phascolarctos cinereus (koala) [77], Drosophila melanogaster (this paper). The Phylogeny was constructed using
TimeTree [78]. Indicated are the retroelement type and the clade that the element belongs to with element types as
follows: LTR, Long Terminal Repeat retroelement; Non-LTR, Non-Long Terminal Repeat retroelement. The circles
indicate the experimental evidence for centromere-association of retroelements: FISH, CENP-A ChIP-seq (ChIP), and
genome or BAC sequencing (Seq).You can also read