Wideband 67-116 GHz receiver development for ALMA Band 2
←
→
Page content transcription
If your browser does not render page correctly, please read the page content below
Astronomy & Astrophysics manuscript no. 36777corr                                                                                      c ESO 2020
                                               February 21, 2020

                                                       Wideband 67-116 GHz receiver development for ALMA Band 2
                                                P. Yagoubov1? , T. Mroczkowski1?? , V. Belitsky2 , D. Cuadrado-Calle3, 4 , F. Cuttaia5 , G. A. Fuller3 , J.-D. Gallego6 ,
                                                                   A. Gonzalez7 , K. Kaneko7 , P. Mena8 , R. Molina8 , R. Nesti9 , V. Tapia8 , F. Villa5 ,
                                               M. Beltrán , F. Cavaliere10 , J. Ceru11 , G. E. Chesmore12 , K. Coughlin12 , C. De Breuck1 , M. Fredrixon2 , D. George4 , H.
                                                         9

                                                  Gibson11 , J. Golec12 , A. Josaitis12 , F. Kemper1, 13 , M. Kotiranta14 , I. Lapkin2 , I. López-Fernández6 , G. Marconi1 ,
                                                   S. Mariotti15 , W. McGenn3, 4 , J. McMahon12 , A. Murk14 , F. Pezzotta10 , N. Phillips1 , N. Reyes8 , S. Ricciardi5 ,
                                                   M. Sandri5 , M. Strandberg2 , L. Terenzi5 , L. Testi1 , B. Thomas11 , Y. Uzawa7 , D. Viganò10 , and N. Wadefalk16

                                                        1
                                                            European Southern Observatory (ESO), Garching, Germany
                                                        2
                                                            Group for Advanced Receiver Development (GARD), Chalmers University of Technology, Gothenburg, Sweden
arXiv:1912.10841v3 [astro-ph.IM] 20 Feb 2020

                                                        3
                                                            Jodrell Bank Centre for Astrophysics, School of Physics & Astronomy, The University of Manchester (UoM), Manchester, UK
                                                        4
                                                            School of Electrical & Electronic Engineering, The University of Manchester (UoM), Manchester, UK
                                                        5
                                                            Istituto Nazionale di Astrofisica (INAF/OAS), Bologna, Italy
                                                        6
                                                            Observatorio de Yebes, Guadalajara, Spain
                                                        7
                                                            National Astronomical Observatory of Japan (NAOJ), Mitaka, Tokyo, Japan
                                                        8
                                                            Universidad de Chile (UdC), Santiago, Chile
                                                        9
                                                            Istituto Nazionale di Astrofisica (INAF/OAA), Arcetri, Italy
                                                       10
                                                            Dipartimento di Fisica, Universita degli Studi di Milano, Milano, Italy
                                                       11
                                                            Radiometer Physics GmbH (RPG), Meckenheim, Germany
                                                       12
                                                            University of Michigan, Department of Physics, Ann Arbor, MI, USA
                                                       13
                                                            Academia Sinica, Institute of Astronomy & Astrophysics (ASIAA), Taipei, Taiwan
                                                       14
                                                            Institute of Applied Physics, University of Bern, Switzerland
                                                       15
                                                            Istituto Nazionale di Astrofisica / Istituto di Radioastronomia (INAF/IRA), Bologna, Italy
                                                       16
                                                            Low Noise Factory (LNF), Sweden
                                                       —

                                                                                                                    ABSTRACT

                                                       Context. The Atacama Large Millimeter/submillimeter Array (ALMA) has been in operation since 2011, but it has not yet been
                                                       populated with the full suite of its planned frequency bands. In particular, ALMA Band 2 (67-90 GHz) is the final band in the original
                                                       ALMA band definition to be approved for production.
                                                       Aims. We aim to produce a wideband, tuneable, sideband-separating receiver with 28 GHz of instantaneous bandwidth per polarisation
                                                       operating in the sky frequency range of 67-116 GHz. Our design anticipates new ALMA requirements following the recommendations
                                                       of the 2030 ALMA Development Roadmap.
                                                       Methods. The cryogenic cartridge is designed to be compatible with the ALMA Band 2 cartridge slot, where the coldest components
                                                       – the feedhorns, orthomode transducers, and cryogenic low noise amplifiers – operate at a temperature of 15 K. We use multiple
                                                       simulation methods and tools to optimise our designs for both the passive optics and the active components. The cryogenic cartridge
                                                       is interfaced with a room-temperature (warm) cartridge hosting the local oscillator and the downconverter module. This warm cartridge
                                                       is largely based on GaAs semiconductor technology and is optimised to match the cryogenic receiver bandwidth with the required
                                                       instantaneous local oscillator frequency tuning range.
                                                       Results. Our collaboration has resulted in the design, fabrication, and testing of multiple technical solutions for each of the receiver
                                                       components, producing a state-of-the-art receiver covering the full ALMA Band 2 and 3 atmospheric window. The receiver is suitable
                                                       for deployment on ALMA in the coming years and it is capable of dual-polarisation, sideband-separating observations in intermediate
                                                       frequency bands spanning 4-18 GHz for a total of 28 GHz on-sky bandwidth per polarisation channel.
                                                       Conclusions. We conclude that the 67-116 GHz wideband implementation for ALMA Band 2 is now feasible and that this receiver
                                                       provides a compelling instrumental upgrade for ALMA that will enhance observational capabilities and scientific reach.
                                               1. Introduction                                                              of construction. Recent technological developments in cryo-
                                                                                                                            genic monolithic microwave integrated circuits (MMICs) and
                                               The Atacama Large Millimeter/submillimeter Array1 (ALMA;                     optical components, such as wide bandwidth feedhorns, ortho-
                                               for background and project definition, see Wootten & Thomp-                  mode transducers (OMT), and lens designs – have opened up
                                               son 2009) is a versatile observatory delivering groundbreaking               the opportunity to extend the originally-planned radio-frequency
                                               scientific discovery since 2011. It is not, however, fully equipped          (RF) bandwidth of this receiver, to cover the 67-116 GHz fre-
                                               with all of the receiver bands that had originally been planned.             quency range on-sky with a single receiver. This holds the po-
                                               In particular, Band 2 (67-90 GHz) has only recently been ap-                 tential for combining ALMA Band 2 (67-90 GHz) with ALMA
                                               proved by the ALMA board of directors for the initial phase                  Band 3 (84-116 GHz), serving as an upgrade that paves the
                                                   ?                                                                        way for wider bandwidth ALMA operations. As discussed in
                                                    e-mail: pyagoubo@eso.org
                                               ??
                                                    e-mail: amroczko@eso.org                                                Mroczkowski et al. 2019a, this approach offers several opera-
                                               1
                                                   https://www.almaobservatory.org

                                                                                                                                                                       Article number, page 1 of 23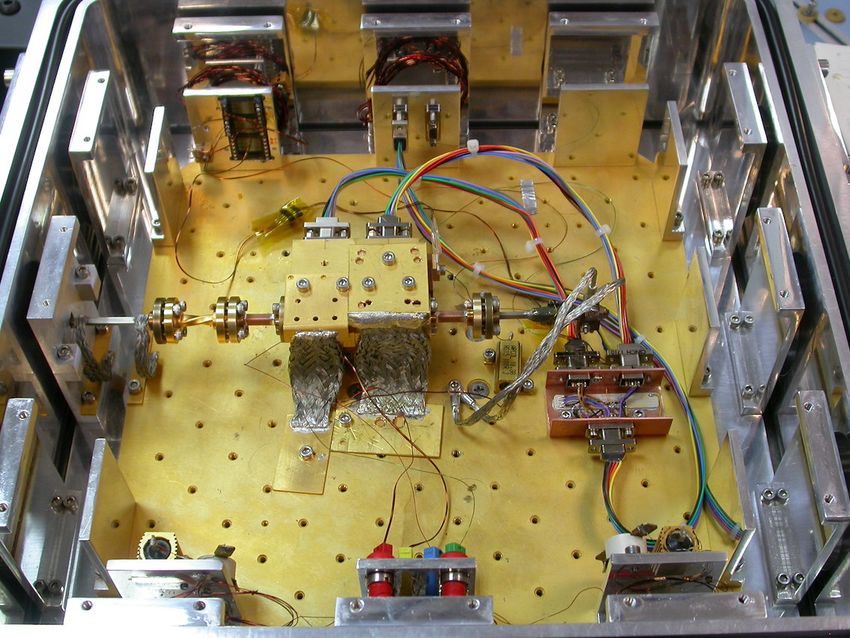
A&A proofs: manuscript no. 36777corr

tional and scientific advantages. Furthermore, the aim to cover          ration. The best LNAs tested so far show a noise temperature
both wider on sky and instantaneous bandwidth is well aligned            below 28 K from 70 GHz to 110 GHz for a cryogenic ambient
with the ALMA 2030 Development Roadmap (ALMA Develop-                    operating temperature of 15 K. With such developments, cryo-
ment Working Group et al. 2018), a document summarising the              genic LNAs have begun to offer noise performance comparable
highest priority upgrades enabling new ALMA science in the               to the more traditional superconductor-insulator-superconductor
2030s and beyond.                                                        (SIS) mixer technologies employed in ALMA Bands 3-10 (see
     At the time when the band ranges and original receiver              e.g. Cuadrado-Calle et al. 2017a, for a comparison of the two
specifications for the ALMA project were defined, roughly two            technologies). We also note the use of cryogenic LNAs in the
decades ago, an instantaneous bandwidth of 8 GHz was an am-              ALMA Band 1 receivers, now in production, to achieve state-of-
bitious goal. However, a number of compelling observational              the-art performance (Huang et al. 2016, 2018).
advantages come from delivering wider intermediate frequency                  A prototype cold cartridge assembly (CCA) – fully compati-
(IF)2 and RF bandwidths, including lower noise in continuum              ble with ALMA’s electrical and mechanical interfaces – has been
observations, the ability to probe large portions of an astronom-        designed and built to accommodate the optics and the LNAs. The
ical spectrum for such phenomena as widely spaced molecular              downconverter module for the receiver is located in the (room-
transitions, and the ability to efficiently scan in frequency space      temperature) warm cartridge assembly (WCA). The full system
to perform, for example, surveys where the redshift of an ob-            has been assembled and its performance has been characterised,
ject is not known a priori. Since bandpass and phase calibration         demonstrating an uncorrected mean noise temperature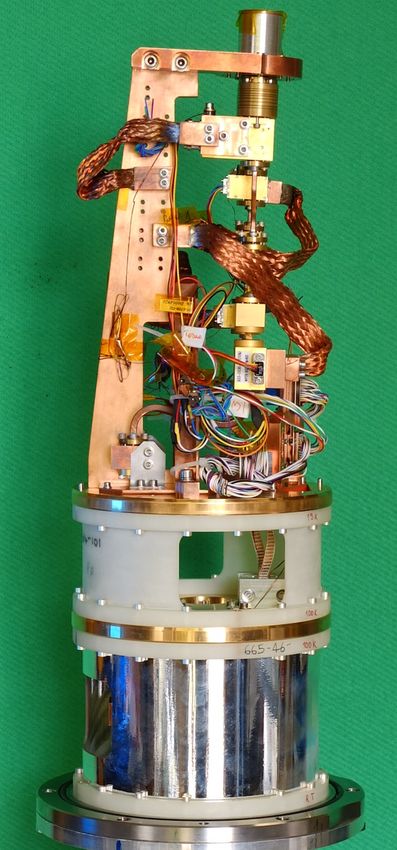
P. Yagoubov et al.: Wideband 67-116 GHz receiver development for ALMA Band 2
NH132D +
H CO
13C34S
+
Atmospheric transmission
C34S
1.00
N2 H +
C18O NH2D
HCO
DNC
CS
CO
C17O
DCO +
D13CO +
0.95
0.90
0.85
0.80
0.75
D13DCN
HCN
HNC
13CO
CN
H1313CN
HN C
13CS
C33S
N2 D +
0.70 70 80 90 100 110
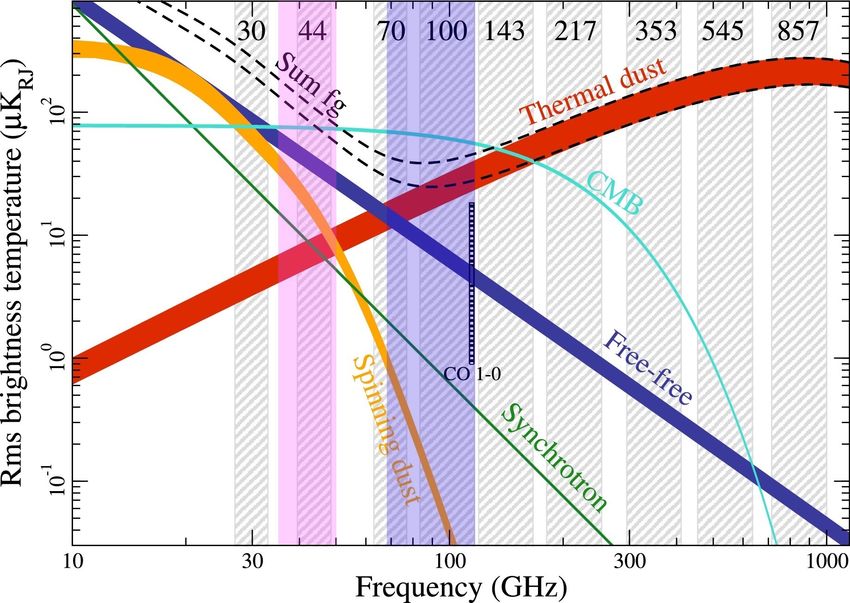
Frequency (GHz) Fig. 2. Combined millimetre/sub-millimetre spectrum of foreground
Fig. 1. Two example spectral setups of the wide RF+IF Band 2 receiver dust, synchrotron, anomalous microwave emission, etc, plotted with the
presented here that would cover the entire 67-116 GHz atmospheric band centres of the instruments on the Planck satellite denoted (grey
window. The x-axis shows the frequency and the horizontal coloured vertical bands). The ALMA wide RF Band 2 (transparent dark blue re-
bars show the upper and lower sideband frequency ranges for two dis- gion) will cover most of the Planck 70 and 100 GHz channels (Tauber
tinct LO settings (‘x’ markers at 85 and 98 GHz on the plot), one shown et al. 2010), where the sum of the contributions is lowest. We also high-
in purple and the other in gold. The LO frequency is marked by the light Band 1 (35-50 GHz; transparent magenta region), which together
coloured cross in each case. The blue curve shows the typical zenith at- with Wide RF Band 2 will likely leverage the free-free and spinning
mospheric transmission assuming the PWV is 2 mm. The vertical black dust contributions. Figure is adapted from Dickinson et al. (2018) to
lines denote the frequencies of some molecular transitions in the band. highlight the role of the lower ALMA bands.
The full band can be explored in only two spectral setups, assuming the
backend digitisation and correlation hardware is upgraded to match the
receiver output. Figure adapted from Mroczkowski et al. (2019a). We outline below some of the key areas where the wideband
Band 2 receiver will have a significant science impact, although
we expect it to have a broad impact across the full range of
Namely, the two key science drivers addressed directly by this ALMA science.
project are the the Origins of Galaxies and the Origins of Chem-
ical Complexity, although we also note that improved contin-
uum imaging and the ability to probe the carbon monoxide (CO) The Sunyaev-Zeldovich effect: Briefly, the Sunyaev-
snowline will partially address the third key science driver, the Zeldovich (SZ; Sunyaev & Zeldovich 1972) effect is a faint,
Origins of Planets. extended decrement in the Cosmic Microwave Background
(CMB) which has a redshift-independent surface brightness
We note that ALMA Band 2 and Band 3 span a single,
that traces the warm and hot gas in large scale structures, such
continuous atmospheric window, the typical zenith atmospheric
as groups and clusters of galaxies (for a recent review, see
transmission of which is plotted assuming a precipitable water
Mroczkowski et al. 2019b). High-resolution observations of
vapour (PWV) of 2 mm in Fig. 1 (blue curve). As one of the low-
the SZ effect have become nearly routine using ALMA and
est frequency bands planned for ALMA, Band 2 is a relatively
the Atacama Compact Array (ACA) in Band 3 (Basu et al.
low atmospheric opacity band that is available for > 87.5% of
2016; Kitayama et al. 2016; Ueda et al. 2017; Di Mascolo et al.
ALMA observing conditions (e.g. Otarola et al. 2019) and it will
2019a,b; Gobat et al. 2019). Yet the recent Band 3 studies are
contribute substantial observational flexibility to the observatory.
all fundamentally limited by the small angular scales accessible
Many of the science cases we discuss here will benefit from the
with ALMA and the ACA. Band 2 and Band 1 (35-50 GHz;
ability to cover the entire 67–116 GHz window with only two
see e.g. Di Francesco et al. 2013 for details on the science case)
spectral setups, as shown in the example tuning in Fig. 1.
will access larger scales than Band 3, making it better suited for
In ALMA Memo #605 (Mroczkowski et al. 2019a), we imaging cluster scales (typically several arcminutes at redshifts
specifically considered the observational and scientific advan- z > 0.2), while the improved bandwidth translates to a direct
tages for the deployment of a wideband receiver fully spanning improvement in imaging speed. In addition, Band 2 extends the
the atmospheric window originally defined as ALMA Bands 2 observations to the frequency range with minimal contamination
and 3. The memo considered the impacts of a receiver system from free-free and dust emission (see Fig. 2).
meeting hypothetical, proposed ALMA system requirements
that relax the noise temperature performance modestly in ex-
change for a substantially wider on-sky and instantaneous band- High redshift extragalactic surveys and studies: As detailed
width. Specifically, it was assumed that up to 10% on average in Mroczkowski et al. (2019a); Fuller et al. (2016), ALMA Band
additional integration time for observations of a single line at a 3 observations have been a powerful tool for redshift determi-
known frequency would be tolerated in exchange for improved nations, particularly at the high redshifts of 2 < z < 8.5, where
frequency coverage. We note, however, that it is not our goal at least one transition of CO or [CI] line is available. Wideband
to relax the ALMA specifications simply to gain more band- Band 2 will be cover 50% extra frequency in two tunings in-
width; the optimised designs we present in this paper represent stead of five (Fig. 1). This will not only make spectral surveys
the state-of-the-art in mm-wave optics and MMIC HEMT re- 2.5 times faster, but it will also increase the redshift identifica-
ceiver technology, regardless of bandwidth. tion efficiency (see Fig. 3) and better leverage their dusty and
Article number, page 3 of 23
A&A proofs: manuscript no. 36777corr

        110

                                                                             Atmospheric transmission
                                                                                                        1.00

                                                                                                                                   HCO +
        100

                                                                                                                                   HCN
                                                                                                                                   HNC

                                                                                                                                           CS

                                                                                                                                                                CO
                                                                                                                                                       C1318O
                                                                                                                                                          CO
(GHz)

         90                                                                                             0.95              z=0.00
         80                                                                                                      z=0.05
                                                                                                        0.90   z=0.10
         70
                                                                                                        0.85                                                 z=0.15
               0            5                    10                     15                                                                             z=0.20
                                         z                                                              0.80                                        z=0.25
        10 3                                                CO J1-0                                                                             z=0.30
                                                            CO J2-1                                     0.75
                                                            CO J3-2
                                                            CO J4-3
                                                            CO J5-4                                     0.70 70            80        90     100         110
                                                            CO J6-5
                                                            CO J7-6                                                             Frequency (GHz)
(GHz)

                                                            CO J8-7
                                                            CO J9-8               Fig. 4. Spectral configurations assuming a 4-18 GHz IF band that al-
                                                            CO J10-9              low the simultaneous observation of low density tracers (12 CO(1-0),
                                                                                  13
                                                            [CI] 492.2 GHz           CO(1-0), and C18 O(1-0)), and tracers of dense gas (CS(2-1), C34 S(2-
        10 2                                                [CI] 809.3 GHz
                                                                                  1), 13 CS(2-1), N2 H+ (1-0), HNC(1-0), HCO+ (1-0), and HCN(1-0)) for
                                                            [CII]
                                                            [OIII]                a range of redshifts. The vertical black lines indicate the position ma-
                                                                                  jor spectral lines with each horizontal row corresponding to the redshift
                                                                                  (z) indicated. The corresponding coloured bars show the sky frequency
                                                                                  coverage of the upper and lower sidebands for the LO frequency in-
               0     5              10            15                              dicated by the coloured cross. The solid blue curve shows the zenith
                             z                                                    atmospheric transmission at ALMA for a PWV value of 2 mm. Figure
                                                                                  adapted from Mroczkowski et al. (2019a).
Fig. 3. Upper panel: Curves show bright molecular CO rotational tran-
sitions and atomic [CI] lines (neutral carbon at 492 & 809 GHz in the
rest frame) redshifted into the Band 2 & Band 3 frequency range as a              Roadmap (ALMA Development Working Group et al. 2018). As
function of redshift. For all redshifts other than 0.72 < z < 0.99 (pink          noted in, for example, Beltran et al. (2015); Fuller et al. (2016),
shaded region) out to formation of the earliest galaxies, at least one CO
                                                                                  and in Figures 1 & 4, the Band 2 and 3 portion of the spectrum
rotational transition is available (yellow shaded region). The redshift
determination is unambiguous for 1.98 < z < 2.44 and z ≥ 3, where                 contains numerous molecular and atomic transitions. These in-
two or more lines are available (green shaded regions). Importantly, the          clude the ground state transitions of deuterated dense gas prob-
wideband Band 2 receiver system we present here will extend ALMA’s                ing species which trace the cold, quiescent regions at the cusp
capability to probe the [CI] 809.3 GHz rest frame transition at redshifts         of star formation and complex organic molecules that can trace
z & 8.5. Lower panel: Same bright mm/submm lines for all ALMA                     building blocks of life (including amino acids such as glycene),
bands. We note that the full ALMA frequency range covers the red-                 which at these lower frequencies are easier to identify due to the
shifted [CII] and [OIII] lines, although they do not intersect Bands 2&3          lower spectral-crowding. In addition, this frequency range is rich
for z . 15. ALMA Bands 2 & 3, as originally defined, are respectively             in recombination lines of hydrogen (see Murchikova et al. 2019
shaded in green and yellow (horizontal regions). The wide bandwidth               and the discussion in Mroczkowski et al. 2019a), along with trac-
receiver we present here will be unique in its ability to probe simultane-
                                                                                  ers of the chemical evolution of stars and stellar envelopes, to
ously two or more lines for z ≥ 3. The legend is common to both panels.
The figures are based on those presented in Fuller et al. (2016).                 name a few. As with the above case, the molecular lines found
                                                                                  in Band 2 are often due to ground state transitions, meaning they
                                                                                  are brighter and that they leverage abundances directly.
free-free continuum spectra (see Fig. 2). Combined, these new
capabilities directly address the key science driver to probe the
                                                                                  Proto-planetary disks: The large bandwidth of the Band 2 re-
origins of galaxies (ALMA Development Working Group et al.
                                                                                  ceiver will improve the fidelity of the continuum imaging of
2018).
                                                                                  proto-planetary disks and the lower frequencies can leverage the
                                                                                  tail of the modified blackbody spectrum typically fit to the emis-
Local universe extragalactic science:         Also detailed in                    sion from dust (see Fig. 2). Additionally, Beltran et al. (2015)
Mroczkowski et al. (2019a), the wideband Band 2 receiver will                     and Fuller et al. (2016) note that the CO snowline can best be
improve spectral coverage of galaxies in the local universe (z <                  probed in the wideband Band 2 range.
0.3), allowing for observations that probe unique combinations
of molecular lines (see Fig. 4). At low frequencies, line identifi-
cation can be less ambiguous due to the ground state transitions                  Spectral dependence and component separation of the low-
being more sparse and it can directly leverage abundances.                        frequency continuum: In addition to thermal emission from
                                                                                  dust, a number of components contribute to the typical Galactic
                                                                                  foreground and extragalactic continuum emission (see Fig. 2).
Molecular/chemical complexity in the Milky Way Galaxy:                            These include free-free emission and the so-called anomalous
The second key science driver proposed in Mroczkowski et al.                      microwave emission (AME; see Dickinson et al. 2018) such as
(2019a) is to probe the origins of chemical complexity, one of                    that coming from spinning dust, which could present a signifi-
the key science goals identified in the ALMA 2030 Development                     cant foreground source of contamination for such studies as that
Article number, page 4 of 23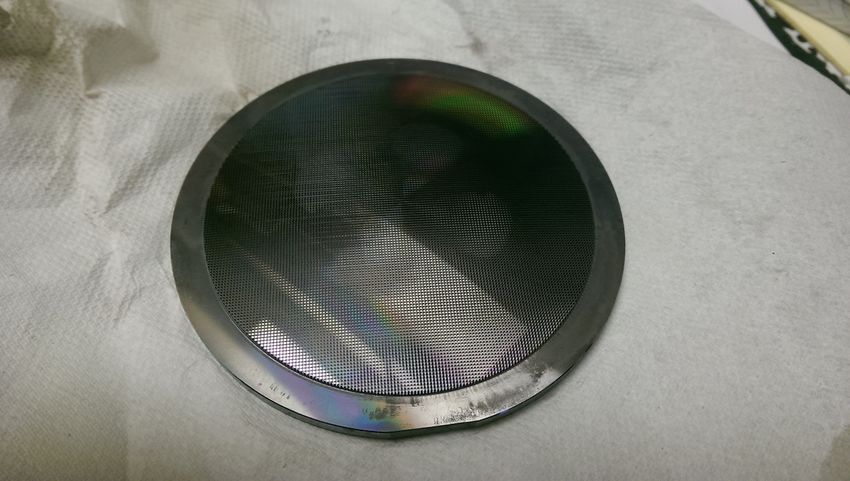
P. Yagoubov et al.: Wideband 67-116 GHz receiver development for ALMA Band 2

of the polarisation of the primary CMB. As Fig. 2 shows, Band          ipate achieving the necessary gain with a single package cryo-
2 can serve a crucial role in separating the thermal dust emission     genic LNA. This will allow to minimise the number of compo-
from the CMB and other emission mechanisms, in combination             nents and improve the overall performance, specifically the noise
with Band 1.                                                           and the gain flatness.

Solar Observations: The scale height probed by millimetre-             3.2. Optical Designs
wave emission from our Sun is proportional to wavelength
(Wedemeyer et al. 2016) and this places Band 2 in a good po-           Here we present the optical designs explored for the lenses, feed-
sition for probing the upper chromosphere and, potentially, the        horns, and OMTs. The approaches taken explored differing par-
beginning of the corona. Wider bandwidth, in turn, allows for          allel paths to meet the design challenges presented by the large
a probing of a larger range of scales simultaneously. Thus, we         fractional bandwidth (> 70% of an octave), the requirement
expect our wideband receiver to transform ALMA’s view of the           of low loss, limited space within the cartridge, and potentially
Sun.                                                                   strong truncation by the ALMA FE receiver window. The result
                                                                       is that several suitable alternatives, produced mainly by the three
                                                                       groups in parallel within our collaboration – exist, and each one
Solar System physics: Our own solar system provides a wealth           can readily be implemented in the receiver cartridge. The designs
of information about planet formation, potentially informing us        and performance measurements are presented in the following
of the building blocks of life. As noted in Mroczkowski et al.         subsections.
(2019a), comets may provide key insights into the composition               The maximum theoretical aperture efficiency that can be
of the early Solar System. Additionally, a number of studies have      achieved for the designated Band 2 position in the ALMA FE
indicated that low-resolution, next-generation millimetre-wave         cryostat, under direct illumination from the secondary mirror,
CMB surveys could probe trans-Neptunian objects, a so-called           can be calculated through Airy-pattern considerations. Gonzalez
‘Planet X’ or ‘Planet Nine’, or even extra-solar Oort clouds,          et al. (2016b) showed that the maximum aperture efficiency for
where searches for their thermal emission can be much more             the Band 2 cartridge slot is below 84% at the lower end of the
effective than for reflected light (Cowan et al. 2016; Gerdes et al.   range (near 67-70 GHz), whereas it is ∼91% at the upper end
2017; Baxter et al. 2018b,a; Sehgal et al. 2019). The wideband         (near 110-116 GHz). At the lower end of the band, the num-
ALMA Band 2 receiver will be the ideal tool for detailed, high-        bers are very close to the ALMA aperture efficiency specifica-
resolution follow-up, providing more precise locations, imaging,       tion (> 80%), implying that the optimisation of the entire optical
spectroscopy, and kinematic information. With its large instanta-      chain design is crucial.
neous spectral grasp, the receiver will also enable detailed com-
parative studies of the temporal variation in spectral emission
from rapidly evolving sources such as comets and volcanoes on          3.2.1. Lens Designs
solar system bodies (see e.g. de Pater et al. 2019).
                                                                       The aperture of the Band 2 cartridge contains a lens which serves
                                                                       both as a refractive optical element and as a vacuum window for
3. Design                                                              the cryostat. Being the first optical component of the cartridge,
                                                                       it is important to minimise the noise contributions from the lens
3.1. Receiver Architecture Overview                                    by minimising both the reflection (S 11 ) and the dielectric loss.
The block diagram for the Band 2 receiver is shown in Fig. 5.          For this purpose, we explored three lens materials: HDPE, ultra-
It consists of two major sub-assemblies: the cold cartridge as-        high-molecular-weight polyethylene (UHMW-PE), and intrinsic
sembly and the warm cartridge assembly. The tertiary optics –          stoichiometry float zone silicon with high purity and resistivity.
defined as those optical components coming after the primary           For each of these, we developed an anti-reflective (AR) layer, as
and secondary mirrors of the telescope – comprise the refractive       discussed below.
lens, the cryogenic IR filter(s), the feedhorn, and the OMT. The
CCA is the portion of the receiver that is installed, using vacuum     High-density polyethylene: Our initial lens design was made
flanges to make the seals, in the ALMA front end (FE) receiver         of HDPE. In order to minimise the loss due to reflection at the
cryostat. It consists of the cartridge body support structure, the     air-lens and lens-vacuum transitions, we employed AR surfac-
feedhorn, OMT, two pairs of cryogenic LNAs separated by cryo-          ing techniques that result in meta-material surfaces. The full re-
genic isolators to minimise standing waves, DC bias harnesses,         sults from five different approaches for the AR are presented
temperature sensors, RF signal transport waveguides (one set for       in Tapia et al. (2018), which compares the noise contribution,
each polarisation), two RF vacuum feedthroughs (one for each           cross-polarisation leakage, reflection loss, and beam and polari-
polarisation) providing the RF connections to the WCA, and the         sation efficiencies.
LNA bias protection boards. The WCA houses the local oscil-                HDPE has served as a standard window and lens material for
lator (LO) sub-assembly, downconverter module, bias modules            ALMA and many other mm/submm-wave observatories, but has
for the cryogenic LNAs, and other power and control units. The         the drawback of a relatively high dielectric loss (see e.g. Lamb
LO sub-assembly includes the YIG oscillator, multiplier chain,         1996; Tapia et al. 2018). In order to minimise the total insertion
the digital phase locked loop (PLL), and the monitor and control       loss in the HDPE lens, we have designed and implemented a
electronics. The downconverter is a dual polarisation sideband         Fresnel zoned lens. This geometry puts constraints on the band-
separating receiver. It includes mixers, LO and IF quadrature hy-      width, and in practicality it limits the choice of AR geometry
brids, room temperature IF amplifiers, passband filters, and the       that can be manufactured.
WCA body. The use of cascaded LNAs inside the CCA, as well
as the optional room temperature amplifiers in front of the down-
converter module, is necessitated by the relatively low gains of       Ultra-high molecular weight polyethylene:     UHMW-PE is a
the current prototypes. For the final implementation, we antic-        newer form of plastic with potentially lower loss than HDPE.
                                                                                                              Article number, page 5 of 23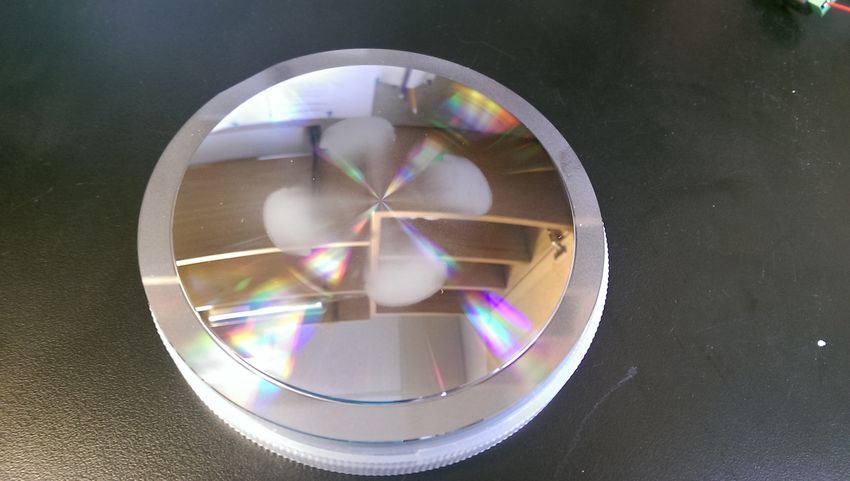
Band 2+3 receiver
A&A proofs: manuscript no. 36777corr
USB BP
filter
Isolators Pol.0 Y-junction
Cold cartridge Coax
IF-hybrid
Pol.0
WG BP
filter Isolators IF LNAs
DSB mixers
WR-10
LSB
BP
filter
OMT
Cryogenic LNAs Coax
Feedhorn
Pol.1
IR filter
Window / lens
Pol.1 LO Pol.0 LO
WR-10 RF-hybrid RF-hybrid
Downconverter
module
Warm cartridge
X6 active WG BP Direct.
multiplier filter coupler
WR-10 Optical (photomixer)
Coax
or coaxial (multiplier)
YIG PLL Photomixer,
assembly system or X6 multiplier
Coax WR-10
Power and
control Ref.
coax
Fig. 5. 67-116 GHz dual-polarisation, 2SB receiver functional block diagram. The lens and infra-red (IR) filter are installed on the ALMA FE
cryostat, the former serving as a vacuum window. Room temperature amplifiers can optionally be used at the input of the downconverter in case
the gain in the cold cartridge is insufficient (i.e. if the gain G < 40 dB; see Table 2).
in machining – including single point diamond turning on a
computer numerical control (CNC) lathe and precision groove
cutting on a five-axis CNC dicing saw – as well as numerical
optimisation of meta-material surfaces like those described for
the HDPE and UHMW-PE lenses above led us to explore their
potential application for wideband ALMA Band 2. The lower
panel of Fig. 6 shows a cross-section of the 2-layer groove de-
sign implemented to reduce the reflections at the air-dielectric
1 mm and dielectric-vacuum interfaces.
The design of the lens and the AR surface (or ‘coating’)
was simultaneously optimised using a similar approach as that
demonstrated in Datta et al. (2013). The team at University of
Michigan produced the AR surface using a similar approach as
that taken for the Simons Observatory receiver design (Galitzki
et al. 2018), applying this to a blank produced by Nu-Tek Preci-
1 mm sion Optics.3 The resulting prototype is shown in Fig. 7.
Fig. 6. Microscope photos of the cross sections of the UHMW-PE and
silicon AR profiles implemented on test samples. The red lines over- Comparison of lens materials: In order to evaluate and com-
laid approximately indicate the target design shape. A small amount of pare the dielectric losses of HDPE, UHMW-PE, and high resis-
chipping at the edge of the silicon sample is expected. tivity silicon, as well as the performances of the AR layers we
have designed, we manufactured a number of flat samples from
each of these materials, both with and without AR surface lay-
This may allow one to avoid using Fresnel zone lenses and to ers. The loss tangent characterisation tests are ongoing and in-
implement better performance AR geometry, such as triangular clude open resonator, transmission and reflection using a vector
groves. The upper panel of Fig. 6 shows the groove design im- network analyser (VNA), and radiometric measurements of the
plemented to reduce the loss due to reflections, discussed at the total insertion loss.
end of this section. While most of the above-mentioned measurements are still
underway, our preliminary finding is that the UHMW-PE loss
tangent is indeed equal or better than that of HDPE. In order to
High resistivity float zone silicon: High resistivity float zone compare against the silicon, we have so far fabricated and tested
(FZ) silicon with high purity and intrinsic stoichiometry has long radiometrically two samples: the 10 mm thick high resistivity
held the promise of being a very low loss optical material for silicon with AR layer geometry as in the lower panel of Fig. 6,
millimetre and submillimetre-wave applications (see e.g. Parshin
3
et al. 1995; Lamb 1996; Chesmore et al. 2018). Recent advances nu-tek-optics.com
Article number, page 6 of 23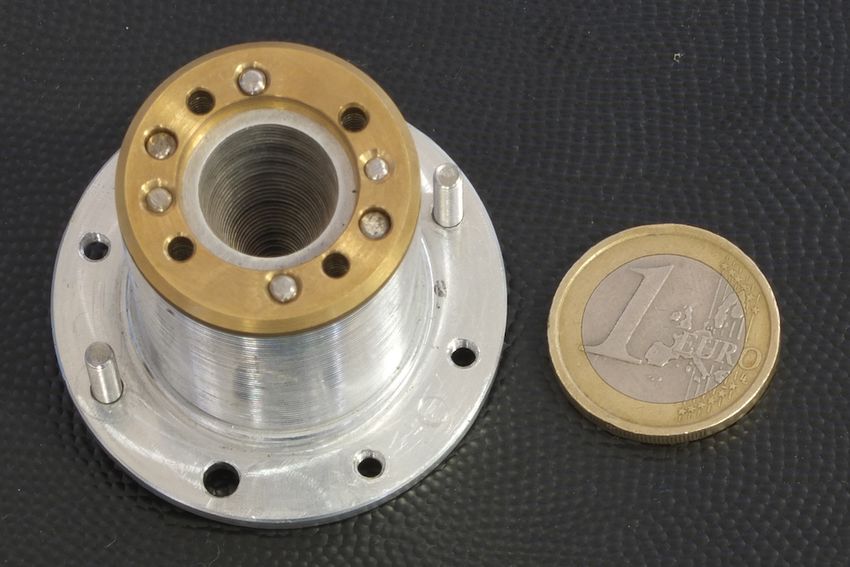
P. Yagoubov et al.: Wideband 67-116 GHz receiver development for ALMA Band 2

                                                                                                 10
                                                                                                           UHMW-PE, 28mm thick
                                                                                                           HR Silicon, 10mm thick
                                                                                                           Reference 1
                                                                                                  8        Reference 2

                                                                                                  6

                                                                              Noise excess (K)
                                                                                                  4

                                                                                                  2

                                                                                                  0

                                                                                                 -2
                                                                                                      70       75     80      85        90     95     100   105   110   115
                                                                                                                                    Frequency (GHz)

                                                                              Fig. 8. Noise temperature (K) contributions of the test samples across
                                                                              the RF band. Reference 2 (black) was used as the baseline noise for
                                                                              comparison. Reference 1 (yellow) is a second measurement of the ref-
                                                                              erence, and its difference with respect to Reference 2 is indicative of the
                                                                              systematic calibration and measurement uncertainties.

Fig. 7. Photos of the silicon lens prototype. The left panel shows the lens
blank, which was produced by Nu-Tek Precision Optics using a CNC
lathe. The right panel shows the lens after application of an AR surface
layer manufactured using a 5-axis dicing saw. The outer diameter of
the lens, including the outer ring used for mounting, is approximately
11 cm.

and 28 mm thick UHMW-PE with triangular AR layer, in the                      Fig. 9. Computer model of UdC horn (left) and picture of the final cop-
upper panel of Fig. 6. The flattened tips of the UHMW-PE sam-                 per version (right). A 100 Chilean peso (CLP) coin is shown for scale
ple, which clearly show burrs, resulted from the non-optimised                (23.5 mm).
manufacturing process of the first prototypes. More recent sam-
ples manufactured by a different workshop are of substantially
improved quality and confirm that UHMW-PE is in fact easier to                determine material parameters and AR layer properties individ-
machine than HDPE.                                                            ually, the results of which will be reported elsewhere.
    For the tests, the samples are installed in front of the proto-
type receiver at a distance of a few millimetres from the lens.
The system noise temperature is then measured as described in                 3.2.2. Feedhorn Designs
Appendix A. Two reference measurements are performed, one                     The feedhorn is located at the 15 K stage of the CCA. All
before and one after the samples tests. Figure 8 shows the calcu-             the designs presented here have a corrugated profile and have
lated difference in the receiver noise with respect to the second             been optimised for the goals of achieving low cross-polarisation
reference measurement. The difference between the two refer-                  (< −30 dB), a reflection loss S 11 < −25 dB, good beam symme-
ence measurements (yellow and black curves in Fig. 8) thus in-                try and appropriate beam size and phase centre location (PCL)
dicates the level of measurement uncertainty is of the order of               as a function of frequency. The designs for the AR surface
. 1 K.                                                                        vary in their manufacturing approaches, and include modular
    The sample thicknesses were selected for each material to                 stacked designs, monolithic machined designs, electroformation,
represent the maximum thickness for the 96 mm diameter lens.                  and variations in where the profiling occurs, which can be imple-
Thus, the derived excess noise corresponds to an upper limit for              mented by varying the inner radius of the horn or the depths of
the noise contribution expected for a lens made from each ma-                 the corrugations.
terial. The preliminary results from the lens material tests are
very encouraging, and despite the nonidealities in the geome-
try of the AR surface, imply similar total loss for the silicon               Universidad de Chile feedhorn design: In addition to being
and UHMW-PE samples. Further measurements are planned or                      corrugated, the UdC horn has a non-monotonic profile for the
ongoing, using samples with improved quality fabricated from                  feedhorn inner diameter (see Fig. 9, left panel). The number of
UHMW-PE and HDPE. These tests will allow us to accurately                     corrugations, their dimensions, and the profile of the horn were
                                                                                                                                               Article number, page 7 of 23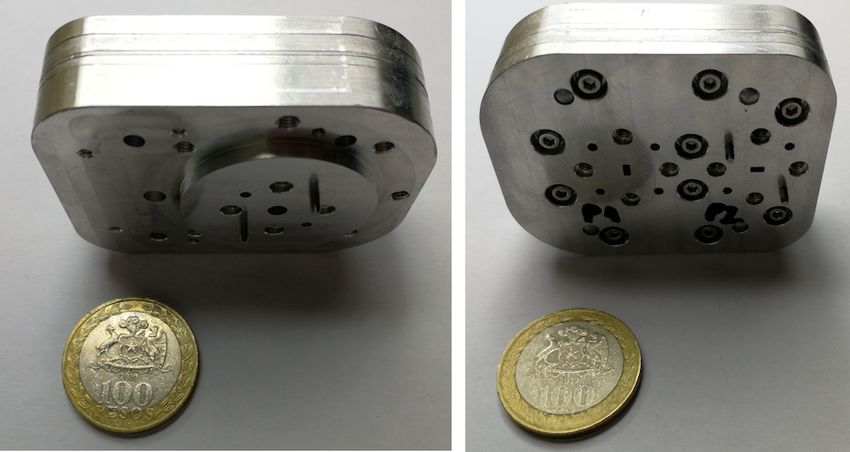
A&A proofs: manuscript no. 36777corr

                     -25

                     -30
  Reflections (dB)

                     -35

                     -40

                     -45
                                                                                          Fig. 11. The photos show the mouth (left) and waveguide interface end
                                                                                          (right) of the platelet feedhorn produced by INAF. A 1 euro coin is
                     -50                                                                  shown in the left panel for scale (23.25 mm). The total length of the
                                                                            Meas.
                                                                            Sim.
                                                                                          feedhorn is 41.4 mm, and the outer diameter is 12.92 mm.
                     -55
                              70      80         90       100        110            120
                                           Frequency (GHz)                                Istituto Nazionale di Astrofisica feedhorn design: The INAF
                                                                                          feed was designed to obtain a taper of -12 dB at 17◦ at 91.5 GHz
                       0
                                                                      E Co. Meas.
                                                                                          (the centre frequency of the RF band), and a return loss and
                                                                      H Co. Meas.         cross polar performance lower (better) than -30 dB over the full
                                                                      45° Xp. Meas.
                      -10                                             E Co. Sim.          RF band. To meet such stringent performance requirements over
                                                                      H Co. Sim.          the 53% fractional bandwidth, a curved-profile corrugated horn
                                                                      45° Xp. Sim.
                                                                                          has been designed using a matching step-section before corruga-
                      -20                                                                 tions, as well as very narrow corrugation grooves (0.2 mm wide
     Magnitude (dB)

                                                                                          and 1.54 mm deep) at the throat section. As a consequence, we
                      -30
                                                                                          decided as a baseline to fabricate the horn using a platelet ap-
                                                                                          proach (see Fig. 11). The platelet-based prototype was fabricated
                                                                                          from aluminium (6082) with the top flange (at the aperture) op-
                      -40                                                                 timised for cross polarisation performance. A similar unit, equal
                                                                                          in the design and interfaces, was electroformed, and shows sim-
                      -50
                                                                                          ilar performance.
                                                                                               A test setup based on the Anritsu Vector Star MS4647B with
                                                                                          millimetre wave extension modules has been used for reflection
                      -60
                        -40    -30   -20   -10        0   10    20         30       40    coefficient and beam pattern measurements. The feed reflection
                                             Angle (deg)                                  coefficient is very good and in agreement with expected simu-
                                                                                          lations once the effects of the circular to rectangular waveguide
Fig. 10. Upper: Measurement and simulation results for the reflected                      adaptor, used to connect the feed to the instrument, have been
power, S 11 , from the UdC feedhorn. Lower: Measured and simulated                        calibrated (upper panel of Fig. 12). The beam pattern measure-
far-field radiation pattern of the UdC feedhorn at 90 GHz, near the                       ments were performed across the RF band in an anechoic cham-
band centre. Our EM simulations confirm that the beam properties scale
                                                                                          ber environment. Scans have been done in the far-field range on
smoothly as a function of wavelength and, hence, we only show one
representative frequency.                                                                 the principal E- and H-planes and the 45◦ -plane, taking both co-
                                                                                          polar and cross-polar components. The measurements show very
                                                                                          good results also in terms of agreement with simulation data.
                                                                                          The lower panel of Fig. 12 show examples of the co-polar and
all optimised using the mode-matching method implemented in                               the cross beam pattern measurements at the representative fre-
the commercial software Microwave Wizard. Some mechanical                                 quency of 91.5 GHz, near the band centre.
constraints were included to allow the machining of the horn as
a single piece on a CNC lathe. Particular attention was put in
the design of the corrugations corresponding to the converter-                            National Astronomical Observatory of Japan feedhorn de-
mode, since they are critical in the transformation of circular                           sign: Wideband corrugated feedhorns traditionally make use of
waveguide modes to the hybrid modes propagating into the horn.                            non-linear and often non-monotonic profiles in order to obtain
The depth of these corrugations were limited in order to allow                            wideband performance, which complicates their fabrication. The
the fabrication on a lathe. The resulting design is very compact,                         NAOJ corrugated feedhorn we present here makes use of novel
with a physical length of 43 mm (corresponding to a 14 wave-                              ideas presented in Gonzalez et al. (2017) and obtains good per-
lengths at the central frequency). A photograph of the copper                             formance over a wide bandwidth by implementing the profile
feedhorn prototype is shown in the right panel of Fig. 9. The                             in the corrugation depth, while keeping the horn profile linear
reflection loss S 11 < −25 dB (see upper panel of Fig. 10), and                           (i.e. the inner diameter follows a simple flare; see Fig. 13). This
the maximum cross-polarisation is < −30 dB in the centre of the                           eases the fabrication to a single monolithic block of aluminium
band, as shown in the lower panel of Fig. 10. The beam waist                              by direct machining, since the horn profile can be drilled with
and PCL present good Gaussian behaviour with excellent E and                              a linear taper tool and then corrugations are turned individually
H-plane symmetry. The co-polarisation patterns show excellent                             on a lathe. Using this idea, the NAOJ feedhorn is composed of
Gaussicity, symmetry and lower sidelobes as shown in the ex-                              50 corrugations with constant pitch and optimised depth, which
ample presented in Fig. 10. The general shape of the measured                             changes every few corrugations. The corrugations in the throat of
co-polarisation patterns shows good agreement with simulations.                           the horn change both depth and width individually for optimum
Article number, page 8 of 23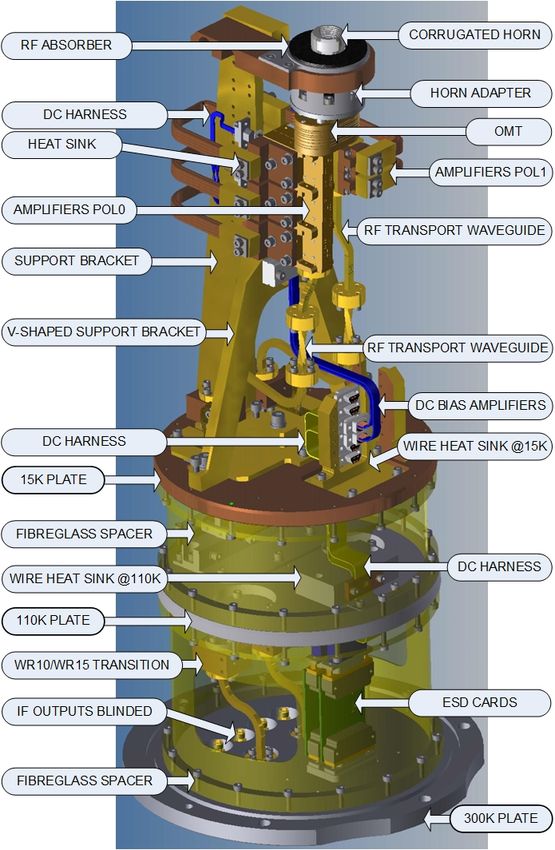
P. Yagoubov et al.: Wideband 67-116 GHz receiver development for ALMA Band 2
-25 -15
Meas. adapter+feed
Meas. feed Meas. WR-10
Sim. feed -20 Meas. WR-6
-30
Sim. WR-10
-25
Reflections (dB)
Reflections (dB)
-35
-30
-40
-35
-45
-40
-50 -45
-55 -50
70 80 90 100 110 120 70 80 90 100 110 120
Frequency (GHz) Frequency (GHz)
0 0
E Co. Meas. E Co. Meas.
H Co. Meas. H Co. Meas.
45° Xp. Meas. 45° Xp. Meas.
E Co. Sim. -10 E Co. Sim.
-10
H Co. Sim. H Co. Sim.
45° Xp. Sim. 45° Xp. Sim.
-20
-20 Magnitude (dB)
Magnitude (dB)
-30 -30
-40 -40
-50 -50
-60 -60
-40 -30 -20 -10 0 10 20 30 40 -40 -30 -20 -10 0 10 20 30 40
Angle (deg) Angle (deg)
Fig. 12. Upper: Reflected power S 11 for the feedhorn designed at INAF. Fig. 14. Upper: Measured S 11 for the NAOJ feedhorn design. The pur-
Here, the simulation data are compared with the measurements. The ple curve presents data measured directly with WR10 VNA extenders,
effect of the adaptor used for the measurements is also shown, in lighter whereas the black curve (> 110 GHz) shows data taken with WR6 ex-
purple. Lower: INAF feedhorn test results for co-polar (Co) and cross- tenders and waveguide transitions and are affected by the S 11 of the
polar (Xp) beam pattern cuts: E-plane (E), H-plane (H) and 45◦ -plane. additional transitions. Lower: Comparison of the NAOJ feedhorn beam
The results for the measurements (lines) versus the simulations (dashed) pattern from simulations and measurements at 95 GHz, close to the cen-
are shown near the band centre, 91.5 GHz. Our EM simulations confirm tral frequency of 91.5 GHz. Our EM simulations confirm that the beam
that the beam properties scale smoothly as a function of wavelength and, properties scale smoothly as a function of wavelength, and hence we
hence, we only show one representative frequency. only show one representative frequency.
(see Fig. 14). Most of the band is measured directly with 67-
112 GHz WR10 VNA extenders. However, the upper end of the
band, from 110 to 120 GHz, is measured with 110-170 GHz
WR6 extenders, which necessitates additional waveguide tran-
sitions. These transitions have a relatively poor back-to-back
S 11 ∼ −20 dB, which degrades the measurement results by a
Fig. 13. Computer model of NAOJ feedhorn, showing the corrugation few dB. In addition, the calibration kit does not have a quarter-
depth is varied. Figure to appear in Gonzalez et al. (in prep). wavelength waveguide standard and both the short and open
standards are measured through short waveguides with lengths 1
and 1.25 wavelengths. In addition to these transitions, a circular-
matching (Zhang 1993). The design has been performed by the to-rectangular (C2R) waveguide transition is necessary for any
hybrid mode-matching/Method-of-Moments code in WaspNET. measurement to connect the circular waveguide output of the
Two prototypes have been fabricated, each as a single piece, by horn to the rectangular standard waveguides in the measure-
direct machining of a single block of aluminium. ment setup. Back-to-back S 11 values of two C2R transitions are
The feedhorns have been characterised using a VNA with around -30 dB. This degrades the measurement results by a few
mm-wave extenders at NAOJ, and show similar performance dB and is indicated in darker purple in the upper panel of Fig. 14.
Article number, page 9 of 23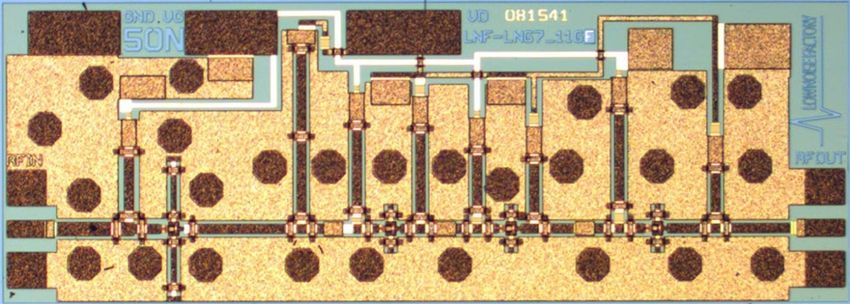
A&A proofs: manuscript no. 36777corr

Table 1. Requirements for the OMT. Note that the waveguide flange
diameters in the designs presented here differ as each OMT design
couples to a specific feedhorn design (Sect. 3.2.2) and the assembly is
jointly optimised. Therefore, different input waveguide diameters were
a design choice left to each group’s discretion.

  Specification                              Value             Unit
  Bandwidth                               67-116               GHz
  Return Loss                        < −15 (< −20 goal)        dB
  Insertion loss                           < 0.5               dB
  Cross-polarisation maximum               < −30               dB
  Isolation                                 > 30               dB
  Output waveguides                        WR10                NA
  Input waveguide flange                 UG387/U               NA
  Input waveguide diameter                2.93/3.1             mm

The reflection loss is S 11 < −24 dB over the entire 67-116 GHz
band and rises sharply for frequencies ν & 120 GHz.
    Apart from S-parameter characterisation, the NAOJ feed-
horn radiation patterns have been measured, together with the
OMT described (Section 3.2.3) and a thin quarter-wavelength-
long transition, using a near field beam scanner. Details of the
measurement system can be found in Gonzalez et al. (2016a).
The far field results for the feedhorn are obtained by Fourier
transformation of the measured near field data. The compari-              Fig. 15. 3D model of UdC OMT (upper) and a photograph of the final
son between the measured patterns and simulation results using            aluminium version (lower). A 100 CLP coin is shown in each photo-
WaspNET (mode-matching + Method-of-Moments) is shown in                   graph for scale (23.5 mm).
Fig. 14. We note that, in this comparison, the simulation results
are for the horn alone while the measurements were performed
with the combination of horn, waveguide transition, and OMT.              final optimised OMT design. The OMT was constructed in five
This is evident in the values of cross-polarisation at the bore-          metal plates fabricated on a CNC milling machine, as shown in
sight angle of the horn. The measurements and simulation results          the photograph in Fig. 15 (lower panels). Aluminium was cho-
agree well. The maximum value of the cross-polarisation pattern           sen due to its good electrical conductivity, mechanical robust-
as a function of frequency is < −23 dB over the full range, and is        ness, and relative machinability (compared to pure copper). Cuts
typically ∼ −29 dB. These results are again for the full feedhorn,        in the narrow side of the waveguide, which possibly translate
transition, and OMT assembly. The cross-polarisation leakage is           in higher loss, were necessary due to the complex and compact
less than -23 dB for every frequency in the 67-116 GHz range.             OMT’s geometry.
                                                                              Preliminary S-parameter measurements at room temperature
                                                                          were performed using a scalar network analyser built in house,
3.2.3. Orthomode transducer designs
                                                                          and are shown in Fig. 16. Cross-polarisation and isolation are
An OMT is used after the feedhorn to separate the orthogonal              under −30 dB in all bandwidth. Reflection losses are lower than
linear polarisation components. The main performance drivers              −15 dB (except for the range 67 − 69 GHz), corresponding to
for the OMT design, summarised in Table 1, are to minimise in-            peak differences of about 7 dB with respect to simulations. This
sertion loss and cross-polarisation, and to minimise the return           suggests that the fabrication procedure could be improved some-
loss (with a goal of S 11 < −20 dB loss) and the isolation be-            what. Insertion loss is around 0.5 dB over 85 GHz and around
tween the polarisation channels. As with the feedhorn designs             1 dB in the lower part of the frequency band (upper panel of
(Section 3.2.2), in this section we detail the three designs devel-       Fig. 16).
oped in parallel by teams at Universidad de Chile (UdC), Istituto
Nazionale di Astrofisica (INAF), and the National Astronomical
Observatory of Japan (NAOJ).                                              Istituto Nazionale di Astrofisica OMT design: The develop-
                                                                          ment effort at INAF to produce an OMT design meeting the re-
                                                                          quirements stated in Table 1 resulted in three slightly different
Universidad de Chile OMT design: The OMT designed by                      designs and models, all of which are based on turnstile junctions.
UdC is based on a turnstile junction architecture (Henke &                Each design was fabricated using platelet technology, where in-
Claude 2014). It has a circular waveguide input and two WR10              dividual plates can be fabricated by standard machining. The first
rectangular waveguide outputs (as noted in Table 1). It is com-           OMT model was developed with the primary goal of demon-
posed of the turnstile junction, bends, steps, and power combin-          strating the ability to cover the 53% of bandwidth. It was man-
ers. Each of these elements was optimised separately using fi-            ufactured using aluminium but it showed high insertion losses
nite element simulations. Then, the connection distance between           (with losses ranging from 0.6-0.8 dB across most of the band
the different elements was optimised to minimise trapped modes.           to 1.2-1.4 dB at the lower end of the band). At the time of this
However, there is an inherent trade off in the wave path length.          first design, matching was presumed to be a more challenging
Short paths result in fewer losses, but have a higher probability of      task, due to the very broad bandwidth. The second OMT in-
trapping undesired modes. The upper panel of Fig. 15 shows the            corporated a revised design to reduce the insertion loss, while
Article number, page 10 of 23
P. Yagoubov et al.: Wideband 67-116 GHz receiver development for ALMA Band 2
1.5
H Meas.
V Meas.
H Sim.
V Sim.
Insertion Loss (dB)
1
0.5
Fig. 17. Left: EM model used for simulation of the INAF OMT. Right:
Photograph of the INAF OMT connected to the setup used for S-
parameter tests in Fig. 18.
0
70 80 90 100 110 120
Frequency (GHz) stainless steel. The resulting insertion loss performance is ex-
cellent, approximately 0.25 dB on average over the whole band.
-15 However, the OMT performance at cryogenic temperature de-
grades such that the unit produced by INAF most suitable for use
-20
in the wide Band 2 receiver was the second (brass) OMT design.
-25
This unit was extensively tested in the CCA during the cryogenic
noise measurement campaign together with the platelet INAF
Reflections (dB)
-30 feedhorn.
Fig. 17 shows the electromagnetic design (left) and a pho-
-35 tograph (right) of the second OMT during S-parameter tests.
Fig. 18 shows the S-parameter test results using a VNA setup.
-40
H Meas. As regards return loss, isolation, and cross polarisation, the sim-
V Meas. ulations are in very good agreement with the measurements.
-45 H Sim.
V Sim. We note that, due to the adopted setup and load, the cross-
-50 polarisation measurement is contaminated by effects arising
70 80 90 100 110 120
from the polarisation induced by the loading short non-ideality
Frequency (GHz)
and the resonant peaks of spurious high order mode excitation.
-30 Since these effects are very difficult to remove in the post pro-
cessing, we caution the reader to regard the cross-polarisation
-40 measurements as upper limits.
Xpol and Isolation (dB)
-50
National Astronomical Observatory of Japan OMT design:
The NAOJ OMT design is based on a standard dual-ridged
-60 waveguide Boifot junction modified for wideband performance
(Gonzalez & Asayama 2018). The design has been performed
-70 by the hybrid mode-matching/finite-elements (MMFE) code in
Xpol Meas. WaspNET, and confirmed by FE simulations using the Ansys
Iso Meas.
-80
Xpol Sim.
High-Frequency Structure Simulator (HFSS). The EM model for
Iso Sim. the OMT and a photo of the OMT produced are shown in Fig. 19.
-90 After the initial design was completed, rounded corners with ra-
70 80 90 100 110 120
Frequency (GHz)
dius 0.2 mm were added in the models and the design was re-
optimised. The design is very compact, which translates in very
Fig. 16. Measured (solid lines) and simulated (dashed lines) perfor- low loss. The output waveguide size is standard WR10, consis-
mance of UdC OMT: insertion losses (upper), reflection (middle) and tent with the requirement in Table 1. Two prototypes have been
cross-polar and isolation (lower), using a 1.2·107 S/m finite conductivity fabricated by direct machining as a split-block. These have been
of aluminium for simulations. characterised by VNA and mm-wave extenders at NAOJ in the
same way as for the NAOJ corrugated horn (Section 3.2.2).
Measurement results for the reflection (S 11 ), insertion loss,
maintaining all other performance by minimising the waveguide cross-polarisation, and isolation of the NAOJ OMT are shown
path lengths and optimising the accuracy and roughness during in Fig. 20. The insertion loss at room temperature is less than
fabrication. For this design we used brass, which easily allows 0.25 dB across the full band, and < 0.15 dB at most frequen-
for gold plating the OMT in the future (i.e. to reduce loss by cies. Reflection (S 11 ) measurements match simulations and the
improving the surface conductivity). The resulting unit showed performance is better (lower) than -23 dB across most of the
an insertion loss of 0.3-0.4 dB across most of the band, with a band, except at 112-116 GHz due to the effect of waveguide
degradation up to 0.7-1 dB at lower frequencies. Ultimately, a transitions. All measured values of cross-polarisation and iso-
third OMT was developed using a design approach that aimed lation are below -40 dB. Some of the presented measurements
to reduce the number of plates for manufacturing and to further exhibit spikes, although they are in general very clean of reso-
reduce the insertion loss. The core was manufactured using cop- nances. These are associated to trapped modes in the connection
per tellurium while the external mechanical support flange was between the OMT and the transition from square to rectangular
Article number, page 11 of 23A&A proofs: manuscript no. 36777corr
1.5
H Meas.
V Meas.
H Sim.
V Sim.
Insertion Loss (dB)
1
0.5
Fig. 19. Left: EM model for the NAOJ OMT, used for simulation and
optimisation in HFSS. Right: Photograph of the two OMT prototypes,
one of them connected to the WR10 to square waveguide transition used
0
70 80 90 100 110 120 for measurements.
Frequency (GHz)
Table 2. Proposed key technical requirements for the cryogenic LNAs.
-15
Specification Value Unit
-20
Bandwidth 67-116 GHz
-25 Noise temperature (67-90 GHz) < 23 K
Reflections (dB)
Noise temperature (90-116 GHz) < 30 K
-30
Input reflection < −6 dB
-35
Output reflection < −10 dB
Gain > 40 dB
-40 H Meas. 1 dB output compression point > −10 dBm
V Meas. DC Power Dissipation < 35 mW
H Sim.
-45 V Sim. Nominal Operating Temperature 15 K
-50
70 80 90 100 110 120
Frequency (GHz) 3.3. Low noise amplifier designs
-20 As the first active component in the receiver and based on the as-
sumption that the passive optical components that come before
-30 are designed to have low loss, the cryogenic LNA largely deter-
mines the overall receiver noise. Here we report on the efforts
Xpol and Isolation (dB)
-40 of two groups to develop LNAs with very low noise, low reflec-
tion loss, wide bandwidth (∼ 53% fractional), high gain, and a
-50 relatively flat passband gain.
The key performance drivers for the cryogenic LNAs are
-60 summarised in Table 2. We note that these are the requirements
envisaged for the final implementation. In the current develop-
-70 Xpol Meas. ment phase, the main focus of optimisation is to meet the most
Iso Meas.
Xpol Sim.
challenging requirements, which are the wide RF bandwidth and
-80
Iso Sim. the low noise temperature.
70 80 90 100 110 120
Frequency (GHz)
Fig. 18. Panels show the simulation and measured results for the inser-
3.3.1. University of Manchester LNA design and results
tion loss (upper), reflection coefficient (middle), and cross-polarisation For its MMIC LNA designs covering the full 67-116 GHz band-
and isolation (lower) measurements for the INAF OMT. width, the UoM team uses the 35 nm gate length Indium Phos-
phide (InP) semiconductor process made available by Northrop
Grumman Corporation (NGC; Lai et al. 2007). The MMIC de-
sign process was performed with individual simulations of the
different matching networks using the EM simulator Momen-
tum, a tool included with the Keysight Advanced Design System
waveguide used for 2-port measurements. To verify this, 1-port (ADS) package. The MMIC design consists of two two-finger
measurements were performed with a short in the square waveg- transistor stages in common source configuration and features
uide of the OMT. Then, the loss can be calculated as half the the possibility of independently biasing the gate and drain of
value of S 11 . In this case, the results do not show resonances each transistor stage (Cuadrado-Calle et al. 2017b). The size of
at the frequencies at which they appear in the 2-port measure- the fabricated chip is 1300 µm × 900 µm and it is shown in
ment. This indicates that the resonances do not occur in the in- Fig. 21.
ternal structure of the OMT. The values of loss in both cases are In order to select and package only the chips with the
comparable, although the 1-port measurement shows a stronger best noise performance, they were first tested in the cryogenic
standing wave. probe station at the Cahill Radio Astronomy Laboratory (CRAL;
Article number, page 12 of 23P. Yagoubov et al.: Wideband 67-116 GHz receiver development for ALMA Band 2
0.25
H Meas.
V Meas.
Insertion Loss (dB)
0.2
Fig. 21. Left: Microscope photograph of one of the fabricated UoM
0.15 MMICs. The die size of the UoM MMICs is 1.3 mm × 0.9 mm. Right:
Interior of the packaging showing the MMIC, the waveguide to mi-
crostrip transitions, WR10 waveguide channels (with the RF input on
the left and output on the right), and the off-chip bias protection circuit.
0.1
The MMIC die can be seen in the lower middle portion of the photo, be-
70 80 90 100 110 120 low the bias protection circuit. This figure is based on figures presented
Frequency (GHz) in Cuadrado-Calle et al. (2017b).
-15
-20
-25
Reflections (dB)
-30
-35
-40 Fig. 22. Photograph of the W-band MMIC LNA from LNF. The die
H Meas.
V Meas. measures 2.0 mm × 0.75 mm.
-45 H Sim.
V Sim.
-50 signed specifically to interface to the MMICs and a bias pro-
70 80 90 100 110 120
Frequency (GHz)
tection circuit consisting of a custom made PCB and off-chip
capacitors situated close the MMIC.
-20 The S-parameters and noise performance of the packaged
Xpol Meas. LNAs were first fully characterised at room temperature. The
Iso Meas.
-30 noise performance was then tested at a cryogenic ambient tem-
perature of 20 K. The results of the on-wafer testing of the
Xpol and Isolation (dB)
-40 MMICs and the assembled LNAs, along with further informa-
tion about the LNAs, the MMICs and the other components used
-50
in the LNAs, can be found in Cuadrado-Calle et al. (2017b).
Then the LNAs were installed and tested at a common test fa-
cility at Yebes observatory (see Section 3.4) and, finally, the best
-60
LNAs were selected for the integration in the prototype Band 2
receiver.
-70
Efforts to improve the performance of these LNAs to better
fit the 67–116 GHz frequency band are underway. First, we have
-80 modified the design of the waveguide elements of the blocks
70 80 90 100 110 120
Frequency (GHz) and the waveguide-to-microstrip transitions. A second wafer run
with NGC has taken place and updated versions of the MMIC
Fig. 20. The panels show the measured insertion loss (upper), the design have been produced. These efforts and their results will
measured and simulated reflection coefficients (middle), and the cross- be presented in detail in a future publication.
polarisation and isolation (lower) of the NAOJ OMT. The reflections
are shown for the Waspnet simulations, which are in good agreement
with the HFSS simulations. The insertion loss measurement is limited 3.3.2. Low Noise Factory LNA design and results
to frequencies < 112 GHz by the waveguide extenders used in the mea-
surement setup. The loss is expected to remain flat or decrease at higher Here we give a short overview of the Low Noise Factory W-
frequency. band LNA design and performance; more details can be found
in Tang et al. (2017). The gate length of the InP HEMT pro-
cess is 0.1 µm. The epitaxy structure grown on InP wafer,
Russell et al. 2012), which is located at the California Insti- from bottom to top, consists of an In0.52Al0.48As buffer, an
tute of Technology (Caltech). The MMICs with the best noise In0.65Ga0.35As channel, an In0.52Al0.48As spacer, a Si delta
performance were selected from those measured on the cryo- doping, an In0.52Al0.48As Schottky barrier, and a Si-doped
genic probe station and packaged into highly integrated blocks, In0.53Ga0.47As cap layer. The device selected for this design
as shown in Fig. 21. As well as the MMICs, these blocks is 2-finger with total periphery of 40 µm. Biased with a drain
contain WR10 or WR9.921 waveguide interfaces for the RF voltage Vd = 1 V and a drain current of Id = 10 mA, de-
signals, gold-on-quartz waveguide-to-microstrip transitions de- vice S-parameters are measured at room temperature on a probe
Article number, page 13 of 23You can also read