A living biobank of ovarian cancer ex vivo models reveals profound mitotic heterogeneity - ERIBA
←
→
Page content transcription
If your browser does not render page correctly, please read the page content below
ARTICLE
                   https://doi.org/10.1038/s41467-020-14551-2                OPEN

                  A living biobank of ovarian cancer ex vivo models
                  reveals profound mitotic heterogeneity
                  Louisa Nelson1,11, Anthony Tighe1,11, Anya Golder 1, Samantha Littler1, Bjorn Bakker2, Daniela Moralli 3,
                  Syed Murtuza Baker4, Ian J. Donaldson 4, Diana C.J. Spierings 2, René Wardenaar2, Bethanie Neale5,
                  George J. Burghel6, Brett Winter-Roach7, Richard Edmondson1,8, Andrew R. Clamp9, Gordon C. Jayson1,9,
                  Sudha Desai 10, Catherine M. Green3, Andy Hayes 4, Floris Foijer 2, Robert D. Morgan1,9 &
                  Stephen S. Taylor 1*
1234567890():,;

                  High-grade serous ovarian carcinoma is characterised by TP53 mutation and extensive
                  chromosome instability (CIN). Because our understanding of CIN mechanisms is based
                  largely on analysing established cell lines, we developed a workflow for generating ex vivo
                  cultures from patient biopsies to provide models that support interrogation of CIN
                  mechanisms in cells not extensively cultured in vitro. Here, we describe a “living biobank” of
                  ovarian cancer models with extensive replicative capacity, derived from both ascites and solid
                  biopsies. Fifteen models are characterised by p53 profiling, exome sequencing and tran-
                  scriptomics, and karyotyped using single-cell whole-genome sequencing. Time-lapse
                  microscopy reveals catastrophic and highly heterogeneous mitoses, suggesting that analy-
                  sis of established cell lines probably underestimates mitotic dysfunction in advanced human
                  cancers. Drug profiling reveals cisplatin sensitivities consistent with patient responses,
                  demonstrating that this workflow has potential to generate personalized avatars with
                  advantages over current pre-clinical models and the potential to guide clinical decision
                  making.

                  1 Divisionof Cancer Sciences, Faculty of Biology, Medicine and Health, University of Manchester, Manchester Cancer Research Centre, Wilmslow Road,
                  Manchester M20 4GJ, UK. 2 European Research Institute for the Biology of Ageing (ERIBA), University of Groningen, University Medical Center Groningen,
                  9713 AV Groningen, The Netherlands. 3 Wellcome Centre Human Genetics, University of Oxford, Roosevelt Drive, Oxford OX3 7BN, UK. 4 Genomic
                  Technologies Core Facility, Faculty of Biology, Medicine and Health, University of Manchester, Michael Smith Building, Dover Street, Manchester M13 9PT,
                  UK. 5 NIHR Manchester Biomedical Research Centre, Manchester University NHS Foundation Trust, Manchester Academic Health Science Centre,
                  Manchester, UK. 6 Genomic Diagnostic Laboratory, St Mary’s Hospital, Central Manchester NHS Foundation Trust, Oxford Road, Manchester M13 9WL, UK.
                  7 Department of Gynaecological Surgery, The Christie NHS Foundation Trust, Wilmslow Rd, Manchester M20 4BX, UK. 8 Department of Gynaecological

                  Surgery, St Mary’s Hospital, Central Manchester NHS Foundation Trust, Oxford Road, Manchester M13 9WL, UK. 9 Department of Medical Oncology, The
                  Christie NHS Foundation Trust, Wilmslow Rd, Manchester M20 4BX, UK. 10 Department of Histopathology, The Christie NHS Foundation Trust, Wilmslow
                  Rd, Manchester M20 4BX, UK. 11These authors contributed equally: Louisa Nelson, Anthony Tighe. *email: stephen.taylor@manchester.ac.uk

                  NATURE COMMUNICATIONS | (2020)11:822 | https://doi.org/10.1038/s41467-020-14551-2 | www.nature.com/naturecommunications                               1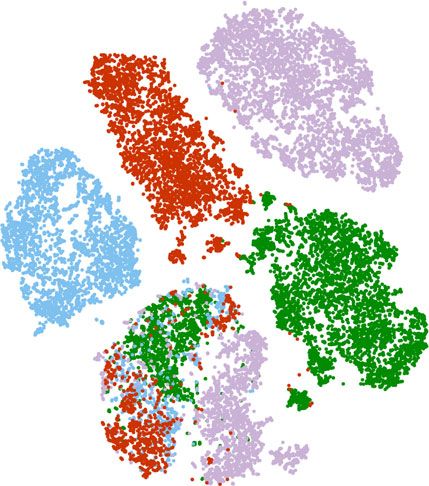
ARTICLE                                                                  NATURE COMMUNICATIONS | https://doi.org/10.1038/s41467-020-14551-2

O
          varian cancer is the leading cause of gynaecological-               principle, we describe 15 OCMs derived from 12 patients.
          related mortality, accounting for ~152,000 deaths world-            Average patient age at diagnosis was 59 years (range 25–81 years)
          wide annually1. The most prevalent subtype, high-grade              with a mean survival from diagnosis of 27 months (range
serous ovarian carcinoma (HGSOC), which is believed to originate              2–125 months; Supplementary Table 1). For 12 samples, ascites
from the fallopian tube2–5, is particularly lethal because it develops        were collected following treatment while two ascites and one solid
rapidly and often presents with advanced stage disease. Treatment             biopsy were chemo-naïve. Ten patients had HGSOC while two
options are limited, typically cytoreductive surgery and plati-               had mucinous ovarian carcinoma. Longitudinal biopsies were
num/paclitaxel-based chemotherapy6. While many patients initi-                collected from three patients (Fig. 1a).
ally respond well, most develop recurrent disease, yielding                      To establish cultures, red blood cells were lysed, the remaining
relatively poor survival rates that have not changed substantially            cellular fraction harvested by centrifugation, disaggregated if
for 20 years7.                                                                necessary then plated in OCMI media (Fig. 1b). Serial passaging
   HGSOC is characterised by ubiquitous TP53 mutation and                     and selective detachment eliminated white blood cells and yielded
extensive copy number variation8,9. Recurrent amplifications of                separate tumour and stromal fractions, which were characterised
MYC, PTK2 and CCNE1 are common, whereas PTEN is fre-                          using phenotypic assays prior to next-generation sequencing and
quently lost, and chromosome breakage events often inactivate                 functional profiling. The models are referred to using the OCM
NF1 and RB110–12. BRCA1/BRCA2 are inactivated in ~20% of                      prefix followed by the patient number and, if one of a series, the
cases, leading to homologous recombination (HR) defects10, but                biopsy number (Supplementary Fig. 1a). Models generated
DNA damage repair defects are more widespread12,13. Extensive                 independently from the same biopsy are distinguished by an
copy number variation implies chromosomal instability (CIN),                  alphabetical suffix. Pilot experiments showed that standard media
i.e. the gain/loss of chromosomes and/or acquisition of structural            formulations only supported proliferation of the stromal cells.
rearrangements14. While p53 loss permits CIN, the underlying                  However, during the course of our pilot studies, Ince et al.
primary causes remain poorly understood and are likely com-                   described OCMI media which enabled them to establish 25 new
plex15–17. Indeed, whole-genome sequencing of HGSOCs iden-                    patient-derived ovarian cancer cell lines36. In our hands, OCMI
tified multiple CIN signatures, including foldback inversions, HR              also supported tumour cell proliferation, allowing us to routinely
deficiency and whole-genome duplication18,19.                                  generate primary cultures with extensive proliferative potential
   CIN presents both challenges and opportunities when treating               (Supplementary Fig. 1a). Thus our observations confirm the
HGSOC. By driving phenotypic adaptation, CIN accelerates drug                 ability of OCMI media to routinely generate ex vivo ovarian
resistance; ABCB1 rearrangements have been identified in 18.5%                 cancer models.
of recurrent tumours, enhancing drug-pump-mediated efflux of
chemotherapy agents12,20. However, CIN can be exploited to
develop synthetic-lethality-based strategies, pioneered by the use            Characterisation of ex vivo models. To determine whether the
of poly (ADP-ribose) polymerase (PARP) inhibitors to target                   OCMs possess the expected hallmarks of ovarian cancer, we
BRCA-mutant tumours21–27. Because of the paucity of actionable                characterised the cultures using an array of molecular cell bio-
driver mutations in HGSOC, synthetic lethality is an attractive               logical approaches (Fig. 1b). Tumour and stromal fractions were
option and a better understanding of CIN may open up new                      morphologically differentiated, with the epithelial appearance of
therapeutic strategies.                                                       the tumour cells contrasting the fibroblastic stromal cells
   Delineating disease-specific CIN mechanisms and developing                  (Fig. 2a). Time-lapse microscopy and Ki67 expression confirmed
novel therapeutic strategies requires models that reflect various              both fractions were proliferative (Fig. 2b, c), and the veracity of
human cancers. While judiciously selected cell lines provide                  the separation workflow was confirmed with immunological
tractable models to study cancer cell biology28, they under-                  markers and p53 profiling (Fig. 2d, e and Supplementary Figs. 1a
represent the genetic heterogeneity exhibited by tumours29 and                and 2a). Tumour cells were typically positive for PAX8, EpCAM
lack the clinical annotations necessary to correlate in vitro drug            and CA125, and failed to elicit a functional p53 response upon
sensitivities with in vivo chemotherapy responses. While patient-             Mdm2 inhibition (Supplementary Fig. 1a). Consistently, tumour
derived xenografts are excellent translational resources30,31, high-          cells expressed p53 mutants and frequently overexpressed MYC
throughput drug profiling is difficult and the timescales involved              (Supplementary Figs. 1a and 2a). Some tumour cells however
are challenging in terms of directing personalised treatment. By              were negative for one or more tumour markers despite har-
contrast, living biobanks have the potential to more rapidly                  bouring TP53 mutations (Supplementary Fig. 1a), possibly
generate well-characterised and tractable models suitable for                 reflecting tumour heterogeneity and/or epithelial–mesenchymal
discovery research, drug screening and guiding clinical deci-                 transition37. In light of these exceptions, tumour cultures were
sions32–35. To develop clinically annotated models that recapi-               defined as such if they had an epithelial morphology, expressed
tulate HGSOC, we built a living biobank of ex vivo cultures. Here             PAX8, EpCAM and/or CA125, and/or had a TP53 mutation,
we describe a workflow and exemplar panel of ovarian cancer                    while stromal cells were defined as having a fibroblastic mor-
models (OCMs), and demonstrate their potential to study CIN                   phology, strong vimentin staining and wild-type TP53.
and drug sensitivity.                                                            Interestingly, OCM.64–3, generated from the third biopsy from
                                                                              patient 64, exhibited phenotypic heterogeneity; some cells had
                                                                              large, atypical nuclei and were negative for PAX8 and EpCAM,
Results                                                                       while others were positive for both and had smaller nuclei
Establishing a living biobank of ovarian cancer ex vivo models.               (Supplementary Fig. 2b). EpCAM/PAX8-positive cells were not
To build a living biobank, we established a biopsy pipeline, col-             detected in OCM.64–1, established from the first biopsy, possibly
lecting samples from patients diagnosed with epithelial ovarian               reflecting tumour evolution during treatment. By exploiting
cancer treated at the Christie Hospital, and a workflow to gen-                EpCAM status, we separated the two sub-populations (Supple-
erate ex vivo OCMs with extensive proliferative potential.                    mentary Fig. 2c), revealing that only the EpCAM-negative
Between May 2016 and June 2019, we collected 312 samples from                 population (OCM.64–3Ep−) expressed high levels of MYC
patients with chemo-naïve and relapsed disease, either as solid               (Supplementary Fig. 2a).
biopsies or as ascites (Fig. 1a). Using our standard workflow, thus               Two tumour cultures, OCM.69 and OCM.87, had wild-type
far we have generated 76 ex vivo cultures. Here, as proof of                  TP53 and a functional p53 response (Supplementary Figs. 1a and

2                 NATURE COMMUNICATIONS | (2020)11:822 | https://doi.org/10.1038/s41467-020-14551-2 | www.nature.com/naturecommunications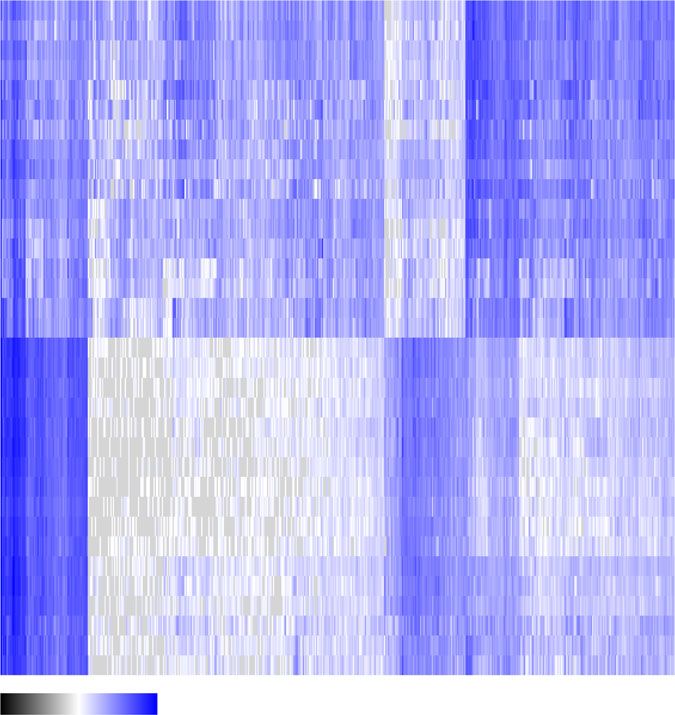
NATURE COMMUNICATIONS | https://doi.org/10.1038/s41467-020-14551-2 ARTICLE
a 68
33 RIP
71
81 *
38 RIP
83
*
71
RIP RIP
46 72 59 46
*
45
64
*
61 66 RIP
65
53
* * *
64 RIP
61
58
* *
69 RIP
57
54
25
*
72 RIP
30
64 *
74 RIP
74
57 **
RIP 87 RIP
79 74 57
73
* *
Ascites collected Time (yrs)
Paclitaxel
Solid biopsy
Carbo/cisplatin 1 2 3
Debulking surgery
VEGFi
Primary tumour Age at
Other diagnosis
* Ex vivo culture
b Validation:
Microscopy
Patient LN2
Flow cytometry
ascites p53 status
RBC WBC
NGS:
Selective Stromal Exome
detachment LN2 RNAseq
scWGS
Fluid OCMI
Cell biology:
Tumour
Time-lapse
Drug sensitivity
–80 °C Lenti-GFP-H2B Cell fate
Fig. 1 Establishing a biobank of ovarian cancer ex vivo models. a Patient timelines showing age at diagnosis and death, treatments and biopsy collections.
b Workflow for processing and storage of stromal and tumour fractions. (RBC red blood cells, WBC white blood cells, LN2 and −80 °C specifies long-term
storage, OCMI ovarian carcinoma modified Ince medium, NGS next-generation sequencing, VEGFi vascular endothelial growth factor inhibitor). See also
Supplementary Fig. 1 and Supplementary Tables 1 and 2.
2a). Re-evaluation of OCM.69, which was also CA125 and EpCAM negative OCM 9 years later, displayed focal PAX8 staining
negative, demonstrated stromal overgrowth so this culture was used indicating that heterogeneity already existed in the primary tumour.
as a negative internal control for subsequent studies. By contrast, Nevertheless, these observations demonstrate that the OCM models
OCM.87 was positive for PAX8, EpCAM and CA125 and thus possess the hallmarks of cancer cells and reflect their respective
confirmed as a tumour model. To determine whether OCMs primary tumours.
reflected the primary tumours, we analysed archival tissue, either
from the original diagnostic biopsy or from primary cytoreductive
surgery (Fig. 1a). Formalin-fixed and paraffin-embedded archival Exome and gene expression analysis. To determine if the models
tumour blocks were available for eight patients and immunohis- displayed the genomic features typical of HGSOC, they were
tochemistry (IHC) analysis correlated well with immunofluores- interrogated by exome sequencing and RNAseq. Analysis of
cence analysis of the ex vivo cultures (Supplementary Fig. 1a, b). For exome variants showed that sequential cultures from the same
example, OCMs 61 and 72, the two mucinous tumours, were PAX8 patient had similar mutational burdens (Fig. 3a). p53-proficient
negative in both contexts. By contrast, OCMs 46, 66 and the other OCM.87 displayed a highly elevated mutational load, possibly
the HGSOC tumours were PAX8 positive, consistent with a indicating a tumour driven by a mismatch repair defect. By
fallopian tube origin. Interestingly, 74, which yielded a PAX8- contrast, the well-differentiated mucinous ovarian carcinoma
NATURE COMMUNICATIONS | (2020)11:822 | https://doi.org/10.1038/s41467-020-14551-2 | www.nature.com/naturecommunications 3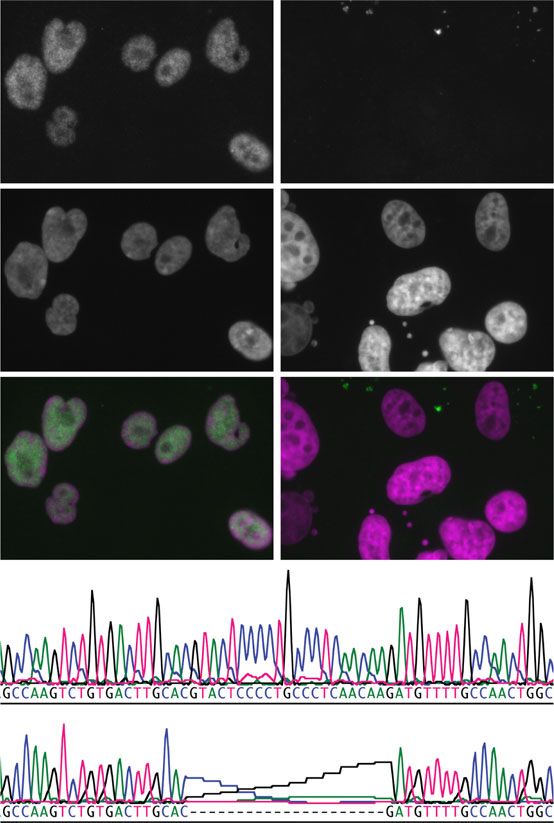
ARTICLE NATURE COMMUNICATIONS | https://doi.org/10.1038/s41467-020-14551-2
a Stromal Tumour
c Stromal
Pax8 DNA Merge
OCM.79
OCM.79
Ki67
b Stromal Tumour
60 60
OCM.38a OCM.38a Tumour
Confluency (%)
40 40 Pax8 DNA Merge
20 20
OCM.79
0 0 Ki67
0 48 96 0 48 96
Time (H) Time (H)
Ctrl Taxol Cisplatin
d OCM.66-5 e Stromal Tumour
86.4 70.8
Epcam-PE/Cy7
CA125-AF488
Tumour
OCM.79 p53
Epcam-PE/Cy7
CA125-AF488
Stromal
Stromal
DNA
92.0 87.3
10
6 47.3 37.6 Merge
Epcam-PE/Cy7
CA125-AF488
5
10
Mixed
Stromal
4
10
Mixed
3
10
OCM.38a
2
10
1
10
0
Tumour
10 43.4 45.8
2 3 4 5 6 7
10 10 10 10 10 10
CD44-BV421 CD105-APC
Fig. 2 Characterisation of ex vivo models. a Phase contrast images showing distinct morphologies of stromal and tumour cells. Scale bar, 200 µm. b Time-
lapse imaging measuring confluency showing suppression of proliferation by 1 µM cisplatin and 100 nM paclitaxel. c Immunofluorescence images showing
expression of PAX8 and Ki67. Scale bar, 50 µm. d Flow cytometry profiles quantitating the tumour markers EpCAM and CA125, and the stromal markers
CD44 and CD105. Numbers represent percentage of cells in the quadrant. e Immunofluorescence images of Nutlin-3-treated cells (OCM.79) showing
stabilisation of p53 in stromal cells but not tumour, and DNA sequence showing TP53 mutation in tumour cells (OCM.38a). Scale bar, 20 µm. Data in
panels a and c are derived from analysis of OCM.79, while data in panels b and d are derived from analysis of OCMs 38a, and 66-5 respectively. Panels
a, c and e are representative images from single experiments. Source data for panels b, c and d are provided as a Source Data file, including the
gating/sorting strategy for panel d. See also Supplementary Figs. 1 and 2.
model, OCM.61, had a relatively low mutation rate. Interrogating were also closely associated while p53-proficient OCM.87 was an
genes known to be mutated in HGSOC confirmed the TP53 outlier. The phenotypic heterogeneity displayed by OCM.64–3
lesions and identified additional mutations in BRCA1, NF1 and also manifested in the PCA; OCM.64–3Ep− associated more
RB1 (Fig. 3b). Importantly, targeted amplicon sequencing of the closely with EpCAM-negative OCM.64–1 but was detached from
primary tumours revealed TP53 mutations identical to those OCM.64–3Ep+. Taken together, these observations further confirm
identified by the exome sequencing (Supplementary Table 2), the separation of distinct tumour and stromal populations,
again demonstrating that the OCMs reflect the primary tumours. and also highlight the phenotypic inter and intratumour
Gene expression profiling showed that the tumour and stromal heterogeneity.
cultures clustered into two distinct clades (Fig. 3c). Principal
component analysis (PCA) showed that the stromal cultures
clustered very closely, despite originating from 12 different patients Single-cell transcriptomics. To further explore the phenotypic
(Fig. 3d). While the PCA scores for the tumour cultures associated heterogeneity, we turned to single-cell approaches, initially ana-
less tightly, those derived from the same patient, e.g. OCM.66–1 lysing chemo-naïve OCM.38a using a Fluidigm platform. Hier-
and OCM.66–5, clustered very tightly. The two mucinous cultures archical clustering identified two dominant clusters, Tumour A
4 NATURE COMMUNICATIONS | (2020)11:822 | https://doi.org/10.1038/s41467-020-14551-2 | www.nature.com/naturecommunications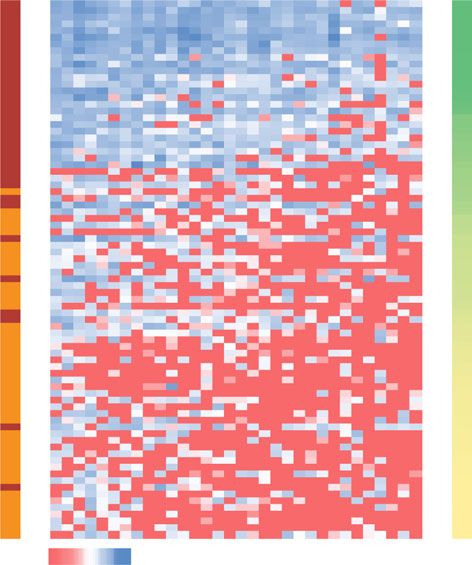
NATURE COMMUNICATIONS | https://doi.org/10.1038/s41467-020-14551-2 ARTICLE
a
b
PDGFRB
NOTCH2
NOTCH4
MAP3K5
MECOM
NCOR2
NUMBL
RPTOR
BRCA1
BRCA2
ERBB3
105
STAT1
PRKCI
ITGAV
MTOR
EGFR
KRAS
BRAF
MLH1
PTEN
TSC2
RBL2
TP53
E2F7
JAK2
87-p53+
RB1
NF1
KIT
104
103 33
38b
46
74 3
1
59
61
3+ 3– 59
38b 64–1
Somatic
33 64–3
31
64–3–
64 79 64–3+
69*
66–1
p4
72 66–5
1
5 66 69
p14 46 72
74–1
102 74–3
61 79
87
0 1×10⁴ 2×10⁴ 3×10⁴
LOH Missense Deletion Substitution
Nonsense Insertion
564 genes
c d
46-p4 40
46-p14
66–1
66–5 3+
61 1
72 3 46 p14
59 20 3–
Tumour
79 64 p4
38 33 66
87
64–3 69* 1 5
PC2: 10% variance
64–3+ 74 Tumour
33 0
64–1 13
64–3–
74–3 79
74–1 Stromal 59
46-p15 38b
46-p5 61
66–1 –20
72
74–1
69
59 87-p53+
Stromal
74–3
64–3 –40
33
64–1
38
87 61
79
61 72
66–5 –60 Mucinous
69*
–50 0 50 100
–15 0 15 PC1: 42% variance
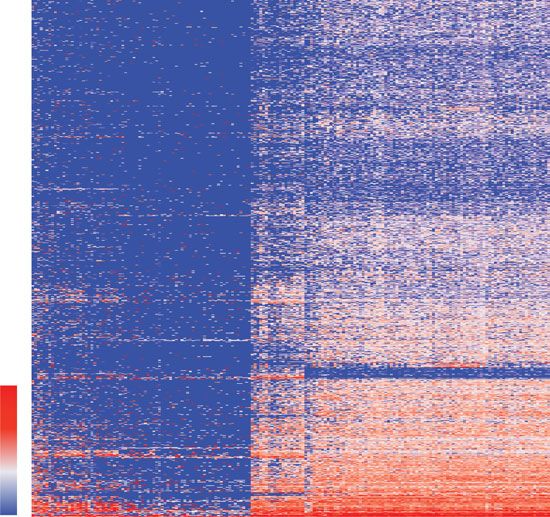
Fig. 3 Exome and gene expression analysis. a Whole-exome sequencing showing somatic and loss of heterozygosity variants identified by referencing
tumour cells to their matched stromal counterparts. b Summary of mutations in genes associated with HGSOC. c Hierarchical clustering and d principal
component analysis of global gene expression profiles, distinguishing stromal and tumour clades, and showing the close relationship of tumour samples
from the same patient. 69* is a stromal culture. Symbol colours in a and d serve to distinguish different OCM tumour samples. Source data for panels a and
d are provided as a Source Data file.
and Stromal A (TA and SA, Fig. 4a). Interspersed within SA were To extend this analysis, we analysed OCMs 38b, 59, 74–1 and
8 cells from the tumour fraction (TB), presumably contaminating 79 using a 10x Genomics platform. Tumour and stromal cells
stromal cells. Adjacent to TA was a small cluster from the stromal from the four pairs were mixed 3:1 and analysed in parallel. t-
fraction (SB), possibly reflecting tumour contaminants in the SNE plots showed that the majority of cells from each sample
stromal fraction. A PCA and pathway analysis resolved SA into formed distinct clusters, whereas smaller fractions formed an
two clusters, SAa and SAb, and SB formed a third, distinct cluster overlapping cluster (Fig. 5a). Based on the 3:1 mix, we reasoned
(Fig. 4b). By contrast, TA comprised two overlapping clusters, that the large distinct clusters represented the tumour cells while
TAa and TAb. This classification was supported by interrogating the overlapping cluster corresponded to the stromal cells.
specific genes, with the tumour cells expressing EPCAM, TP53 Consistently, the distinct clusters accounted for ~75% of the
and MYC but negative for XIST and TSIX, consistent with loss of cells while ~25% made up the overlapping cluster (Fig. 5b).
the inactive X chromosome (Fig. 4c). Interrogating cell cycle Moreover, cells in two of the distinct clusters did not express
signatures showed that TAa and TAb had low and high G2/M XIST (Fig. 5c), consistent with loss of the inactive X chromosome.
scores respectively (Fig. 4d). Moreover, genes involved in mitosis Pathway analysis identified 10 different sub-clusters (Fig. 5d).
and chromosome segregation were overdispersed in the tumour Seven were private to the tumour cells, with OCMs 38b and 79
cells (Fig. 4e, f), and the cells expressing high levels of mitotic dominated by single sub-clusters (1 (87%) and 2 (96%)),
genes had high G2/M scores (Fig. 4g). Thus, the heterogeneity OCM.74–1 composed of two sub-clusters (3 (69%) and 7
exhibited by the tumour cells most likely reflects cell cycle stage. (30%)), and OCM.59 composed of three (6 (46%), 8 (17%) and
NATURE COMMUNICATIONS | (2020)11:822 | https://doi.org/10.1038/s41467-020-14551-2 | www.nature.com/naturecommunications 5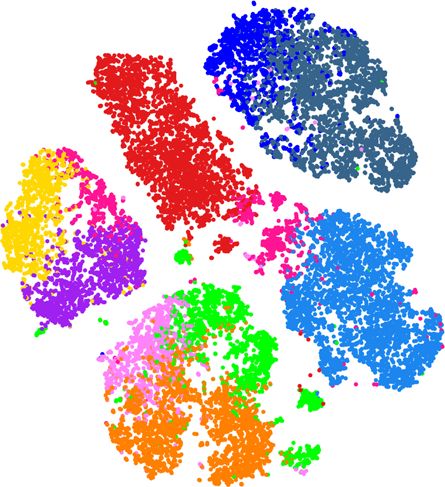
ARTICLE NATURE COMMUNICATIONS | https://doi.org/10.1038/s41467-020-14551-2
a b c TAa TAb SAa SAb SB
Integrated analysis
EPCAM 10
ATR
PRKCI 5
PTK2
50 EIF5A2
KRAS 0
PIK3CA
Tumour
KDM5A
HES1
PC 2: 3% variance
TP53
GSK3B
CDH2
0 MYC
BCL2L1
CDH1
DLL3
SAa NCSTN
SAb NOTCH3
CCNE1
SB MDC1
–50 TAa IL33
TFPI
TAb TSIX
Stromal
TB XIST
15 POSTN
COL1A1
10 IGFBP5
HAS2
–100 HSD11B1
5 COL3A1
ANXA10
0 DAB2
Stromal A Stromal B –200 –100 0 100 200
Tumour A Tumour B
PC 1: 42% variance
d e Overdispersed stromal genes Overdispersed tumour genes
1.0
–5 –2
TAa
TAb Spindle
Log10 –4
–15 p value
checkpoint
log10 p Value
log10 p Value
–20 –6
–40
G2/M
–25
0.5 Biosynthesis
Ribosome Count –8 Chromosome
biogenesis segregation
700 Log10
–35 –10 p value
Mitotic
Catabolism cell cycle –10
–45 –12 Mitosis and
Viral chromosome
Count
processes segregation
Metabolism –14 80
–55 Intracellular transport
0
0 0.5 1.0 2 3 4 5 6 4 8 12 16 20 24
G1 Fold enrichment Fold enrichment
f KIF23 g Mitotic genes G2/M
Cenp-E Nuf2 1.0
HMMR
PRC1 Sgo2
Survivin
Mklp2 Ndc80 Asp
Bub1
Cenp-K
KIF20B
TA cells
CycB1 RRM2 Mad2
Knl1
CycB2 0.5
Cdkn2
Topo2 α BubR1 Mps1
Ki-67 CDK1
CEP55
Brca1
Hurp Nek2
HMGA2 UbcH10
Eg5
Cap-G
Bard1
0
0 5 10
Fig. 4 Fluidigm single-cell transcriptomics. a Hierarchical clustering of gene expression profiles distinguishing stromal and tumour cells from chemo-naïve
OCM.38a. b Principal component analysis integrated with pathway analysis showing subpopulations of tumour and stromal cells. c Heat map showing
mean expression levels of selected genes in OCM.38a tumour and stromal sub-populations. d Scatter plots of G1 score versus G2/M score for individual
cells within the TAa/TAb sub-populations. e Gene ontology analysis of overdispersed genes in stromal and tumour cells. f Network analysis of
overdispersed genes in tumour cells. g Heat map of overdispersed genes showing that TAb cells expressing higher levels of mitotic genes and have high
G2/M scores. Source data for panels b–e and g are provided as a Source Data file.
9 (37%)). By contrast, three sub-clusters were shared between the ex vivo models, namely the ability to analyse highly purified
stromal cells from all four patients; for example, 24%, 42% and tumour fractions unfettered by contaminating stromal cells and
35% of the OCM.38b stromal cells fell into sub-clusters 4, 5 and the microenvironment.
10 respectively. Thus, single-cell transcriptomics confirms that
despite originating from different patients, the stromal cells are Single-cell shallow whole-genome sequencing. To karyotype the
phenotypically similar while the tumour cells display marked ex vivo models, cultures were subjected to single-cell whole-genome
inter-patient heterogeneity. Further analysis will however be sequencing (scWGS). Analysis of stromal cultures showed that
required to evaluate the nature of this heterogeneity, including they were largely diploid (Fig. 6a and Supplementary Fig. 3b). By
whether or not it reflects differences in cell cycle stage. contrast, the tumour cells displayed profound deviations. Moreover,
Nevertheless, these data highlight an advantage of deriving the inter-cellular heterogeneity within any given culture was
6 NATURE COMMUNICATIONS | (2020)11:822 | https://doi.org/10.1038/s41467-020-14551-2 | www.nature.com/naturecommunications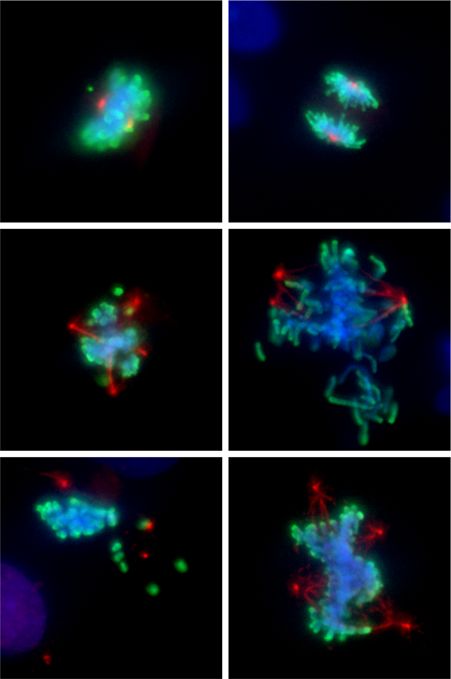
NATURE COMMUNICATIONS | https://doi.org/10.1038/s41467-020-14551-2 ARTICLE
74–1
38b
a b e
59
79
38b
100
59 1
Tumour 74–1
2
79 80
Tumour
3
Cell count (%)
6
60
7
8
40
9
Stromal
20 4
Stromal 5
0 10
S T 100 50 0
c XIST d 7 74–1
79 2
3
59
8
9
1
6
10 38b
5
Stromal
4
Fig. 5 10x Genomics single-cell transcriptomics. a t-Stochastic neighbour embedding (t-SNE) plot showing clustering of single cells from four OCM pairs,
with tumour and stromal cells mixed 3:1. b Dot plots quantitating the percentage of cells in the stromal and tumour clusters. Line represents the mean (N =
4 biological independent samples i.e. n = 1 for each of the four OCMs). c, d t-SNE plot from a overlaid with XIST expression (c) and 10 sub-populations
identified by hierarchical clustering (d). e Heat maps quantitating the percentage of cells from each patient sample in the 10 sub-populations. Source data
for panels b and e are provided as a Source Data file.
conspicuous, consistent with extensive CIN. Interestingly, four Compared with HCT116, a near-diploid colon cancer cell line,
features stood out whereby genomes were marked by whole- OCMs 38b, 66–1 and 79 were dominated by features consistent
chromosome aneuploidies, rearranged chromosomes, monosomies with the scWGS, namely tetraploidies, rearranged chromosomes
or tetrasomies (Fig. 6a, b and Supplementary Fig. 3b). OCMs 38a, and whole chromosome aneuploidies respectively (Fig. 7a).
46 and 79 were characterised by whole-chromosome and chro- OCM.59 was also dominated by rearranged chromosomes,
mosome arm aneuploidies (Fig. 6a and Supplementary Fig. 3a). By including recurrent and unique derivative chromosomes, chro-
contrast, OCMs 33, 59 and 66–1 also displayed rearrangements and mosome fragments, micro-chromosomes, dicentrics and ring
focal amplifications. OCMs 64–1, 87, 38b and, to some extent, chromosomes (Fig. 7b). Interestingly, the primary tumour from
64–3Ep− displayed numerous tetrasomies, while OCMs 64–3Ep+ patient 59 was notable in that the IHC analysis revealed profound
and 74–1/3 harboured several monosomies (Fig. 6a and Supple- nuclear atypia and multi-nucleated giant cells (Supplementary
mentary Fig. 3b). Note that OCM.38a and OCM.38b, independent Fig. 1c), indicating that the extensive CIN observed ex vivo was
models developed from the same biopsy sample, had very different present in vivo.
karyotypes; whether this reflects intratumour heterogeneity or Immunofluorescence analysis of the stromal cultures and nine
evolution ex vivo remains to be determined. The two mucinous established ovarian cancer cell lines showed that mitotic cells
samples were very different; chemo-naïve OCM.61 was largely were typically bipolar (Fig. 7c, d). By contrast, multipolar spindles
disomic but OCM.72 displayed numerous aneuploidies and focal were prevalent in OCM tumour cells. We extended this analysis
amplifications (Supplementary Fig. 3b). Note that while OCM.61 to include eight additional OCMs generated during the latter part
was derived from a low-grade mucinous adenocarcinoma, OCM.72 of this study, including three recently described by us38, thereby
was derived from a poorly differentiated tumour, indicating more including an additional four chemo-naïve models. All eight
aggressive disease (Supplementary Table 1). The karyotypes of the satisfied the working definition above, i.e. they had epithelial
OCM.64–3 sub-clones were strikingly different; while 64–3Ep− morphologies, were positive for PAX8, and/or had a TP53
displayed trisomies and tetrasomies, 64–3Ep+ harboured mono- mutation. Interestingly, in four out of six chemo-naïve OCMs,
somies and disomies (Fig. 6a). Moreover, there was an interesting multipolar spindles were rare (OCMs 38, 118, 124 and 195),
symmetry; the monosomic and disomic chromosomes in 64–3Ep+ consistent with CIN becoming more pervasive as the disease
were typically disomic and tri/tetrasomic respectively in 64–3Ep−. evolves in response to cytotoxic chemotherapy12,14. Nevertheless,
While the relationship between these sub-clones remains to be the M-FISH and spindle pole quantitation supports the extensive
determined, the scWGS vividly highlights the profound CIN CIN observed by the scWGS.
exhibited between and within different ovarian cancer models. Quantitating spindle poles also gave us an opportunity to
analyse CIN in tumour cells at much earlier passage. Because the
M-FISH reveals highly rearranged chromosomes. To verify the selective detachment workflow requires several passages, the
CIN highlighted by the scWGS karyotyping, we used two ex vivo cultures were typically analysed by passage 10. To analyse
orthogonal approaches, namely multiplex fluorescence in situ earlier stages, frozen unseparated populations were recovered
hybridization (M-FISH) and quantitation of mitotic spindle poles. (Fig. 1b) and exposed to the Mdm2 inhibitor Nutlin-3, thereby
NATURE COMMUNICATIONS | (2020)11:822 | https://doi.org/10.1038/s41467-020-14551-2 | www.nature.com/naturecommunications 7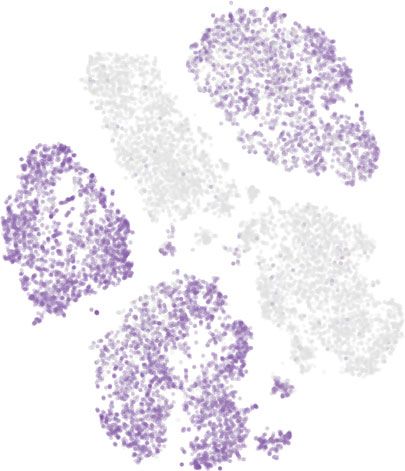
ARTICLE                                                                                                                NATURE COMMUNICATIONS | https://doi.org/10.1038/s41467-020-14551-2

                           a

                                                 38 stromal
                                                 33 tumour
                                                 38a tumour
                                                 46 tumour
                                                 59 tumour
                                                 64–3 Ep–
                                                 64–3 Ep+
                                                 66–1 tumour
                                                 79 tumour

                                                                1          2           3          4         5     6        7     8    9    10 11 12 13 14 15        17 19 21 X
                                                                                                                                                               16     18 20 22
                           b                  0.03
                                                                                                                59                                       0            1       2
                                                                    74–1
                                                                                     Rearranged                                                          3            4       5
                                                                    74–3                              66–5
                                                                                                                                                         6            7       8
                                              0.02                                                     66–1
                                                                                                                                                         9            +10
                           Structural score

                                                               Mono-                                    33                     Tetraploidy
                                                               somies                                           64–3–
                                                                                                                    64–1             38b                Heterogeneity score
                                              0.01                                           72
                                                                        64–3+
                                                                                                                      87                                             0.4
                                                                                      79              46
                                                                                     WCA                                                                             0.2
                                                                       61
                                                                                                      38a                                                            0.1
                                                                                   Diploid
                                              0.00                                                                                                                   0.05
                                                                                        Stromal                                                                      0.01

                                                         –1                    0              1                            2               3
                                                                                       Aneuploidy score

Fig. 6 scWGS karyotyping. a Genome-wide chromosome copy number profiles determined by single-cell whole-genome sequencing showing aneuploidies
and rearranged chromosomes in tumour cells. Each row represents a single cell, with chromosomes plotted as columns and colours depicting copy number
state. b Bubble plot showing structural, aneuploidy and heterogeneity scores. See also Supplementary Fig. 3. Source data for panel b are provided as a
Source Data file.

8                  NATURE COMMUNICATIONS | (2020)11:822 | https://doi.org/10.1038/s41467-020-14551-2 | www.nature.com/naturecommunications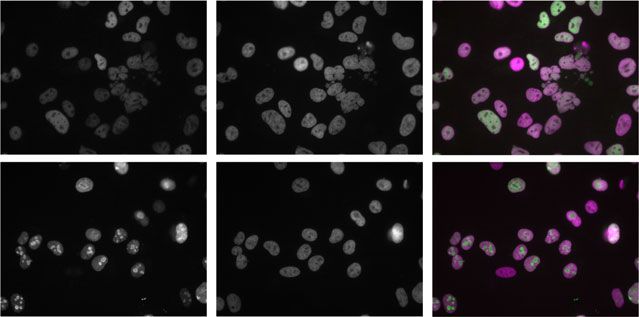
NATURE COMMUNICATIONS | https://doi.org/10.1038/s41467-020-14551-2 ARTICLE
a b Derivative
D cro e
M niqu
chromosomes
g
/R
U
i
T HCT116 T 38b
ic
T A BCDEFGH I J K LM
138
100
80
92
60
*
40
46
0 4 8 Der
T 66–1 T 79 0 2 4 6
Cells
1 4 8 12 16 20 X
Chromosomes
c d 100
Cell lines
Stromal
Tumour
Chemo-naïve
Cells with two spindle poles (%)
118
pH3 ArA DNA 195
75 124 79
38 66–1
1 0 11
15 46
16
12
110 74–1
87
50
0
13
1 33
2
25
0 15 30 45 60
Cells with ≥4 spindle poles (%)
Fig. 7 M-FISH karyotyping. a Heat maps quantitating total chromosome count (T, range 40–>100) and individual chromosome counts (matrix, range
0–8), for OCMs 38b, 66–1 and 79, enriched for tetraploidy, rearranged chromosomes and whole-chromosome aneuploidy features respectively. Derivative
chromosomes indicated by white. HCT116, a near-diploid, stable cell line with two derivative chromosomes, is shown for comparison. b M-FISH analysis of
OCM.59. Heat map, exemplar chromosome spread and two exemplar M-FISH images. Heat map shows total chromosome count (T) and individual
chromosome counts (matrix, range 0–6), quantitating recurring derivatives (A to M), unique derivatives (U), DNA fragments and micro-chromosomes
(Micro), and other abnormal structures including dicentrics and ring chromosomes (Dic/Rg). The chromosome spread shows a micro (arrow) and
dicentric (arrowhead) chromosome while the M-FISH images show whole chromosome aneuploidies, rearranged chromosomes and different derivatives.
c Immunofluorescence images of cells stained to detect phospho-histone H3 (serine 10), Aurora A and the DNA (representative images from single
experiment). Scale bar, 10 µm. d Quantitation of mitotic spindle poles in stromal cells, OCM tumour cells and nine established cell lines. Numbers outside
the symbols indicate OCM culture while numbers inside the symbols indicate passage number. Orange arrows connect tumour samples from the same
OCM culture analysed at different passages. Source data for panels a, b and d are provided as a Source Data file.
rapidly eliminating the p53-proficient stromal cells. OCMs 33, 46, Time-lapse microscopy reveals highly abnormal mitoses. The
66–1, 74–1 and 79 were then analysed between passage zero and karyotype heterogeneity and abnormal spindle poles numbers
two, showing an abundance of multipolar spindles (Fig. 7d). suggests mitotic dysfunction. Indeed, the extensive copy number
Interestingly, for OCMs 33, 46 and 74–1, the frequency of bipolar variations exhibited by HGSOC predicts a high level of CIN. To
spindles increased at later passage, suggesting that continued determine the extent of mitotic dysfunction, we introduced a
propagation ex vivo leads to the emergence of relatively stable GFP-tagged histone then characterised the ex vivo models using
sub-clones more reminiscent of established cell lines. Never- fluorescence time-lapse microscopy (Fig. 1b). Often, mitosis was
theless, our analysis of OCM cells very shortly following biopsy successful with chromosomes separating equally (Fig. 8a). Fre-
isolation confirms a profound level of CIN, consistent with the quently however, chromosome alignment was protracted and
scWGS karyotyping. segregation abnormal. While stromal cells completed mitosis
NATURE COMMUNICATIONS | (2020)11:822 | https://doi.org/10.1038/s41467-020-14551-2 | www.nature.com/naturecommunications 9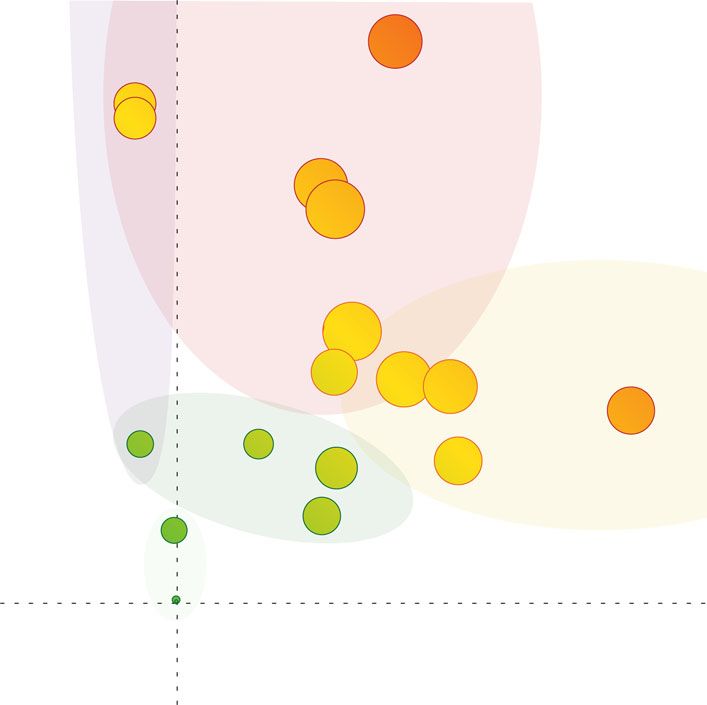
ARTICLE NATURE COMMUNICATIONS | https://doi.org/10.1038/s41467-020-14551-2
a Cytokinesis/abscission
Successful mitosis Multipolar mitosis
failure
Chromosome bridge/ Anaphase with unaligned Other
lagging chromosome chromosomes e.g. cohesion fatigue
b 104 40 0.8
Relative frequency (%)
33
Time in mitosis (min)
30 0.6
3 46
10
64
74 1
Skew
20 0.4 1 59
3
3–
2
10 1
10 33 0.2 72 5
66
3+ 79
66–5
46 38
87
101 0 0.0
46
87
3+
72
79
38
3–
1
33
1
3
59
5
1
101 102 103 104 0 100 200 300 400
Stromal
Time (min) Mean
64 74 66
c 24 h
18
12
6
Bridge 9.9
Stromal
Multipolar –
Unaligned –
Cytokinesis –
Other 0.7
All other
defects
Normal
Bridge 54.2
Multipolar 14.5
33 Unaligned 11.5
Cytokinesis 13.7
Other 16.0
Bridge
only
Bridge 21.1
Multipolar 2.6
46 Unaligned 0.9
Cytokinesis 2.6
Other 4.4
Bridge 59.6
Multipolar 6.1
59 Unaligned 12.3
Cytokinesis 17.5
Other 13.2
Bridge 31.1
Multipolar 16.5
72 Unaligned 6.1
Cytokinesis 53.0
Other 5.2
Bridge 55.5
Multipolar 30.9
74–3 Unaligned –
Cytokinesis 32.7
Other 25.5
swiftly, mitosis in the tumour cells was protracted and exhibited a were dissimilar; OCM.64–3Ep+cells, which have smaller nuclei
profound range, often with skewed distributions (Fig. 8b), con- and monosomies, underwent mitosis faster than their EpCAM
sistent with spindle assembly checkpoint (SAC) delaying mito- negative counterparts (Fig. 8b).
sis39. While cultures from the same patient had similar Mitosis in the stromal cells was largely error-free (Fig. 8c). By
characteristics (e.g. OCM.66–1/5), the OCM.64–3 sub-clones contrast, lagging chromosomes and anaphase bridges dominated
10 NATURE COMMUNICATIONS | (2020)11:822 | https://doi.org/10.1038/s41467-020-14551-2 | www.nature.com/naturecommunicationsNATURE COMMUNICATIONS | https://doi.org/10.1038/s41467-020-14551-2 ARTICLE
Fig. 8 Time-lapse microscopy. a Examples of abnormal mitoses in tumour cells expressing GFP-H2B, showing images before and after anaphase onset
(representative images at multiple positions from single experiment). Scale bar, 10 µm. b Analysis of time spent in mitosis, at least 100 cells measured from
nuclear envelope breakdown to anaphase onset. Rank ordered box-and-whisker plot with boxes, whiskers and “+” showing the interquartile range, 10–90%
range, and mean respectively. Line graph showing linear regression of the frequency distributions for OCMs 33, 46 and 66–5. Bubble plot of Hougaard’s
skew against the mean, with bubble size proportional to the variance. c Quantitation of mitotic anomalies with each column representing one cell and the
vertical grey bars representing the time each cell spent in mitosis. Pie charts show the number of normal mitoses, those with anaphase bridges only and all
other defects combined. Note that the stromal data is compiled from three cultures, namely OCMs 33, 66 and 79. See also Supplementary Fig. 4. Source
data for panels b and c are provided as a Source Data file, including number of biological independent samples for each OCM in panel B.
the tumour cultures (Fig. 8c and Supplementary Fig. 4a, b), but cycle46,47. Nevertheless, despite the high frequency of abnormal
these events were more dramatic compared with those observed mitoses, sufficient cells survived to yield proliferative cultures.
in established CIN cell lines40,41. Cytokinesis/abscission failures
and multipolar mitoses occurred frequently, with OCMs 72 and
74–3 standing out. Daughter nuclei often reconvened long after Drug sensitivity profiling. To determine drug sensitivity, we
anaphase, consistent with DNA blocking abscission. OCM.33 had measured culture dynamics in the presence of cisplatin and
a high degree of cohesion fatigue42, possibly accounting for the paclitaxel (Fig. 10c). IC50 values for cisplatin ranged ~7-fold
high skew score (Fig. 8b); note that premature sister chromatid across the cohort, with OCMs 33 and 64–3Ep+ the most sensitive
separation prevents SAC satisfaction, enforcing a mitotic arrest43. and resistant respectively (Fig. 10d). These values did not corre-
A corollary of this observation is that despite extensive mitotic late with paclitaxel IC50 values, which were less variable. While
dysfunction, the SAC is intact. Indeed, cells exhibiting anomalies the two cultures from patient 66 responded similarly to both
took longer to complete mitosis and arrested when challenged cisplatin and paclitaxel, the two OCM.64-3 sub-cultures diverged
with paclitaxel (see below). Conversely, OCM.46 completed considerably, with OCMs 64–3Ep− and 64–3Ep+ having cisplatin
mitosis relatively quickly and displayed the least number of IC50 values of ~0.6 µM and ~2.1 µM respectively. Despite
anomalies (Fig. 8b, c and Supplementary Fig. 4a). However, appearing karyotypically similar, the sequential cultures from
despite SAC functionality, anaphase with unaligned chromo- patient 74 also had distinct sensitivities, with OCM.74–1 more
somes, a phenomenon very rarely seen in established cell lines, resistant to both cisplatin and paclitaxel. The patients’ tumour
was a recurrent feature. OCM.59 stood out with 12% premature responses to chemotherapy broadly correlated with ex vivo drug
anaphases (Fig. 8c). Thus, the time-lapse data demonstrates that sensitivities (see Supplementary Table 1). OCMs 33, 38b, and
mitosis in the ex vivo models is profoundly defective and 74–3 had the lowest IC50 values for cisplatin and were derived
considerably heterogeneous, indicating that the analysis of from patients who achieved a radiological response and a sig-
established cell lines underestimates the mitotic dysfunction in nificant reduction in serum CA125 following platinum-based
advanced human cancers. chemotherapy. In contrast, OCMs 46, 59, 64–1, 66–1/5 and 79
Disrupting tissue architecture can influence chromosome originated from patients with progressive disease. Moreover, none
segregation fidelity44. Therefore, we asked whether the OCMs of these patients achieved an improvement in serum CA125 levels
also displayed mitotic dysfunction when cultured as 3D during treatment. A notable exception was OCM.74–1, which
organoids45. Analysis of OCM.66–1 in 3D revealed aberrant exhibited a cisplatin IC50 suggestive of platinum-resistant disease
mitoses including anaphases with unaligned chromosomes yet the patient had a partial radiological response and a sig-
(Fig. 9a). We also observed a phenotype not seen in 2D, namely nificant reduction in serum CA125. In this case, the in vivo
chromosome ejection at anaphase, possibly reflecting the ability response could have resulted from the gemcitabine component of
of a 3D environment to better anchor ectopic spindle poles. her chemotherapy. Nevertheless, the congruence between the
Importantly, the frequency of aberrant mitoses in 3D was similar patient tumour responses and the drug sensitivity of the ex vivo
to 2D (Fig. 9b). Interestingly, the 3D mitoses were not as cultures suggests that models generated by this workflow do
protracted as those in 2D (Fig. 9c), suggesting that the 3D indeed reflect the patient’s tumours.
environment might constrain the spindle leading to more rapid
SAC satisfaction.
Heterogeneous responses to paclitaxel. Paclitaxel is routinely
used in the treatment of ovarian cancer. Previously, we showed
Cell fate profiling. To understand how aberrant mitoses impact that paclitaxel-induced cytotoxicity in established cancer cells
cell fate and culture dynamics, we set out to determine pro- lines is highly heterogeneous40. The OCMs also exhibited inter
liferation rates and post-mitotic cell fate. Doubling times ranged and intra-culture variation (Fig. 10b and Supplementary Fig. 5).
from under 30 h for OCMs 46 and 87, to over 100 h for OCMs 59 For example, in 10 nM paclitaxel, 60% of cells in OCM.46
and 74–1/3 (Fig. 10a). Fate profiles of the faster growing models underwent an abnormal mitosis while at 100 nM, 32% underwent
showed that most cells completed multiple cell divisions slippage and 22% died in mitosis (Fig. 10b). OCM.87 exhibited a
(Fig. 10b). By contrast, in slow growing OCM.74–1, only 32% of similar behaviour; abnormal mitoses dominated in 10 nM, with
cells divided; 20% remained in interphase and 24% died without 26% slippage and 22% death in mitosis at 100 nM paclitaxel. By
entering mitosis. This anti-proliferative phenomenon was contrast, the fate profiles of OCM.66–1 were similar at both
observed to some extent in most of the cultures (Supplementary concentrations despite an extended mitosis at 100 nM. Consistent
Fig. 5). Taken together with the high frequency of abnormal with its high IC50, 10 nM paclitaxel had a marginal impact on
mitoses described above, a likely explanation is that prior divi- OCM.74–1, only reducing the number of successful divisions
sions generated daughters harbouring genomes incompatible with from 32 to 28%. Strikingly in most models, the number of cells
continued cell cycle progression. Interestingly, 12% of cells in that died in interphase following slippage or an abnormal mitosis
OCM.74–1 fused with neighbouring cells. Although less frequent, was low, with an average of only 12% across the cohort. Never-
this occurred in several other cultures (Supplementary Fig. 5). theless, these observations show that the ex vivo ovarian cancer
Fusion events typically involved daughter cells, suggesting that models represent a valuable resource for drug sensitivity profiling
abscission was not fully executed at the end of the previous cell and detailed mode of action studies.
NATURE COMMUNICATIONS | (2020)11:822 | https://doi.org/10.1038/s41467-020-14551-2 | www.nature.com/naturecommunications 11ARTICLE NATURE COMMUNICATIONS | https://doi.org/10.1038/s41467-020-14551-2
a 0 30 35 45
115 125 130 140 175
b c
24 h
12
Bridge 35.3 103
Time in mitosis (min)
66–1 Multipolar 2.6
Unaligned 9.5
2D Cytokinesis 5.2
Other 2.6
12 h
6 102
Bridge 33.6
66–1 Multipolar 2.7
Unaligned 6.2
3D Cytokinesis 2.7
Other 10.6
101
S 2D 3D
Fig. 9 Mitosis in 3D. a Z-stack projections showing examples of abnormal mitoses in OCM.66–1 from three biological replicates when cultured in 3D.
Numbers show minutes after imaging initiated. Scale bar, 20 µm. Arrowhead shows unaligned chromosomes at anaphase, arrow shows an ejected
chromosome. b Quantitation of mitotic anomalies with each column representing one cell and the vertical grey bars representing the time each cell spent in
mitosis. c Violin plot showing the time spent in mitosis for OCM.66–1 when cultured in 3D. Lines show the median and interquartile ranges. The 2D data
from Fig. 8b is for comparison only. Source data for panels b and c are provided as a Source Data file.
Discussion track genomic and phenotypic evolution during culture estab-
Living biobanks are powerful resources, with the transformative lishment and propagation. During the course of this work, addi-
aspect coming from the ability to perform detailed phenotypic tional methodologies were described to establish panels of ovarian
studies on well-characterised models that accurately reflect a cancer models, either as 2D cultures and organoids35,45,49,50.
patient’s tumour, and in turn, the ability to correlate ex vivo Another next step will be to compare genome evolution and CIN
observations with clinical chemotherapy responses32–34,48. As in these different culture conditions. Moreover, it will be important
such, living biobanks can potentially address limitations associated to characterise the genomes as the primary cultures evolve ex vivo
with established cancer cell lines, and indeed, our analysis shows in to established cell lines. The reduction in spindle pole numbers
that thus far, we have grossly underestimated the mitotic dys- at later passages suggests that more stable subclones might be
function in advanced human tumours. The biopsy pipeline and selected for rapidly once the tumour cells are liberated from the
workflow we describe here generates ex vivo ovarian cancer cul- in vivo microenvironment.
tures with extensive proliferative potential, rendering models The workflow characterising the models involved a com-
amenable to detailed cell cycle studies, including characterisation plementary array of orthogonal approaches including expression
of mitotic chromosome segregation and drug sensitivity profiling. of tumour markers, p53 profiling, exome sequencing, global
Efficient generation of proliferative cultures was facilitated by transcriptomics and scWGS-based karyotyping. Our analysis
adopting OCMI media36, extending the potential of this for- highlights the risk of relying only on the expression of a small
mulation beyond generating cell lines to also creating tumour cell number of tumour markers51, which is perhaps not surprising in
cultures that can be analysed shortly following biopsy isolation; the light of the extensive heterogeneity exhibited by HGSOC. And
vast majority of analyses here were performed within 10 passages. importantly, while the case of OCM.69 highlights the technical
Importantly, by using conditions that allow immediate tumour cell challenges during the early phase of culture establishment, it also
proliferation, bottlenecks that might otherwise select for distinct illustrates the veracity of the workflow. We recognised that this
sub-populations are minimised; indeed, OCMI media maintains culture was outgrown by stromal cells upon p53 profiling and
the genomic and transcriptomic landscapes of the original closer inspection of cell biological parameters. This assessment
tumours36. Consistently, the congruence of the gene expression was confirmed by the exome and RNAseq analysis. Thus far, of
profiles and karyotypes of cultures generated from sequential the 312 samples from 135 patients, we have attempted to generate
biopsies indicates that the workflow generates consistent and cultures from 290, yielding 76 OCMs, i.e., a success rate of 26.2%.
reflective tumour models. At the same time, the ability of different These OCMs are derived from 44 patients, yielding a per patient
sub-cultures to emerge indicates that the models also potentially success rate of 32.6%. In some cases, however, when the first
reflect intra-tumour heterogeneity. Important next steps will be to attempt failed, we were able to generate a tumour culture from a
12 NATURE COMMUNICATIONS | (2020)11:822 | https://doi.org/10.1038/s41467-020-14551-2 | www.nature.com/naturecommunicationsNATURE COMMUNICATIONS | https://doi.org/10.1038/s41467-020-14551-2 ARTICLE
a b DMSO 10 nM Taxol 100 nM Taxol %
200 12 6
22
Doubling time (h)
150
76
60
32
46
100
22
50 10
6
10
10 14
6
0
0 24 48 72 96
–
+
–1
b
–1
79
–1
59
72
46
33
–3
–5
87
–3
–3
38
66
74
64
74
66
Time (h)
64
64
c
8 8
46 - Cisplatin 46 - Taxol
42 38
6 6
Normalised GOC
88
66–1
4 4 22
24
22
2 2 24
8
6 8
0 0
0 24 48 72 96 0 24 48 72 96 0 24 48 72 96
Time (h) Time (h) Time (h)
300 300
46 - Cisplatin 46 - Taxol 16
32 28
IC50= 0.85 μM IC50= 6.3 nM
Area under curve
22
200 200 12 18
74–1
8 16
18 8
100 100 24
30 34
20
0 0
–2 –1 0 1 –1 0 1 2 3 0 24 48 72 96
Log (μM) Log (nM) Time (h)
d
4 60
10
Cisplatin (μM) Taxol (nM) 26
30
3 *
18 6 26
88
IC50
87
2 12 26
46
1 6 22
10
6 8
6
0 0
0 24 48 72 96
64–3+
64–3+
64–3–
64–3–
74–3
66–5
66–1
64–1
74–1
74–3
66–5
66–1
64–1
74–1
38b
38b
Time (h)
33
87
46
72
79
59
33
87
46
72
79
59
Interphase Death in interphase
Taxol (nM)
0 0.49 0.98 1.95 3.91 7.81 15.63 31.25 62.50 125 250 500 Mitosis No mitotic entry
Abnormal mitosis Fusion
Cisplatin (μM) Slippage Fission
0 0.05 0.10 0.20 0.39 0.78 1.56 3.13 6.25 12.5 25 50
Death in mitosis
subsequent attempt, facilitated by the availability of frozen, several of the cell lines generated by Ince et al.36 are cultured in
unseparated cells (Fig. 1b). Important next steps will be to define atmospheric oxygen, suggesting that oxygen concentration may
workflow modifications that increase the first-attempt success also be a factor.
rate. Preliminary observations suggest that serum source and The scWGS-based karyotyping was particularly informative,
plating surface can be important factors. All the OCMs described in terms of validating and comparing the different models.
here were generated in low-oxygen conditions, but we note that In particular, we identified four karyotype features whereby
NATURE COMMUNICATIONS | (2020)11:822 | https://doi.org/10.1038/s41467-020-14551-2 | www.nature.com/naturecommunications 13ARTICLE NATURE COMMUNICATIONS | https://doi.org/10.1038/s41467-020-14551-2
Fig. 10 Drug sensitivity profiling. a Rank ordered plot measuring population doubling times (time-lapse microscopy). b Cell fate profiles of untreated
cultures and following exposure to paclitaxel, with each horizontal line showing the behaviour of a single cell and the columns quantitating specific cell
fates. c Line graphs using green object count (GOC) to measure nuclear proliferation of sample OCM.46 in response to increasing concentrations of
cisplatin and paclitaxel, plus corresponding IC50 curves. d Dot plots showing IC50 values for cisplatin (rank ordered) and paclitaxel. Asterisk represents p <
0.05 for comparison of the sensitivity of OCMs 64–3Ep− and 64–3Ep+ to cisplatin (one-way ANOVA; Tukey’s multiple comparison). In a and d, lines
represent mean and standard deviation from at least three biological replicates. In c lines show mean and standard deviation from three technical
replicates. See also Supplementary Fig. 5. Source data for panels a and d are provided as a Source Data file.
genomes were enriched for either whole-chromosome aneu- The workflow we describe here represents a major step forward
ploidies, rearranged chromosomes, monosomies or tetrasomies. in modelling ovarian cancer. In 36 months, we generated 76
Integrating these classes with recently described CIN signatures ex vivo models from 44 patients, yielding a diverse and com-
is an important future step18,19. By comparing the genomes of prehensive collection, with the exemplar panel described here
single cells, the scWGS-based karyotyping also illustrates the providing proof of concept. By addressing the limitations asso-
profound heterogeneity within the cultures, indicating perva- ciated with established cell lines, these models better reflect the
sive CIN. The proliferative nature of the cultures also facilitated specific diseases of individual patients, and as such the living
M-FISH karyotyping, which identified structures not detected biobank will serve as a resource to enable discovery research, in
by sequencing, including acentric fragments and ring chro- particular enabling a better understanding of CIN, genome evo-
mosomes. However, the key advantage of a living biobank is the lution and tumour micro-heterogeneity. The tractability of the
ability to perform detailed phenotypic studies on early passage models in terms of drug sensitivity profiling will also provide
tumour cells, and here we show that ovarian cancer cells display tools for drug discovery. Indeed, we recently showed that chemo-
an unprecedented level of mitotic heterogeneity. Analysis of naïve OCMs derived from patients with platinum-refractory
established cell lines has not captured this heterogeneity, pre- disease are sensitive to a first-in-class compound targeting PARG
sumably because long-term cell culture selects the fitter, more when combined with a CHK1 inhibitor38. A key future priority
stable subclones. Indeed, clonal evolution analysis of estab- will be to correlate the drug sensitivity of the ex vivo cultures with
lished colorectal cancer cells shows that despite persistent in vivo tumour behaviours, in response to both standard of care
chromosome segregation errors, specific karyotypes are main- chemotherapy and emerging agents, a process that will be
tained52, and while multipolar spindles were prevalent in the facilitated by correlating clinical outcomes with each OCM. While
OCMs, established ovarian cancer cell lines typically undergo the numbers here are small, initial results in terms of platinum
bipolar divisions. Another advantage of viable cultures is the responses are encouraging, suggesting that models generated by
ability to analyse highly purified tumour fractions unfettered by this workflow could potentially serve as predictive patient avatars.
contaminating, genetically normal stromal cells and the This in turn will provide opportunities to tailor chemotherapy
microenvironment. The workflow does however retain matched choices based on phenotyping individual tumours as well as
tumour-associated fibroblasts and can be adapted to retain stratifying patients for clinical trials testing new agents.
tumour-infiltrating lymphocytes53, in turn allowing recon-
struction of tumour-microenvironment interactions. Methods
Consistent with the highly deviant karyotypes, mitosis in the Patient samples. Research samples were obtained from the Manchester Cancer
OCMs was often highly aberrant. Note however that most of our Research Centre (MCRC) Biobank with informed patient consent obtained prior to
analysis was performed on cells grown as monolayers. Impor- sample collection. The MCRC Biobank is licensed by the Human Tissue Authority
(license number: 30004) and is ethically approved as a research tissue bank by the
tantly, it was recently shown that tissue architecture can influence South Manchester Research Ethics Committee (Ref: 07/H1003/161+5). The role of
chromosome segregation fidelity44. Specifically, mouse epithelial the MCRC Biobank is to distribute samples and does not endorse studies per-
cells in 3D spheroids exhibited very low missegregation rates; but formed or the interpretation of results. For more information see www.mcrc.
when disaggregated and analysed in 2D, ~7% of cells displayed a manchester.ac.uk/Biobank/Ethics-and-Licensing.
lagging chromosome, a level comparable to that displayed by the
patient-derived stromal cells analysed in this study. By contrast, Cell culture. Ovarian cancer and stromal cells were cultured in OCMI media36
using a 50:50 mix of Nutrient Mixture Ham’s F12 (Sigma Aldrich) and Medium
the OCM tumour cells exhibited a much higher rate of abnormal 199 (Life Technologies) was supplemented with 5% FBS (Life Science Group) or
mitoses; 52% of the mitoses we analysed were abnormal. Thus, 5% Hyclone FBS (GE Healthcare), 2 mM glutamine (Sigma Aldrich), 100 U/ml
disrupted tissue architecture is unlikely to account for this very penicillin, 100 U/ml streptomycin (Sigma Aldrich), 10 mM HEPES at pH7.4,
high rate of chromosome missegregation. Indeed, when cultured 20 µg/ml insulin, 0.01 µg/ml EGF; 0.5 µg/ml hydrocortisone, 10 µg/ml transferrin,
in 3D, OCM.66–1 exhibited a high frequency of aberrant mitoses. 0.2 pg/ml Tridothyronine, 5 µg/ml o-phosphoryl ethanolamine, 8 ng/ml selenious
acid, 0.5 ng/ml 17 β-oestradiol, 5 µg/ml all trans retinoic acid, 1.75 µg/ml hypox-
Despite the high frequency of catastrophic mitoses, sufficient anthine, 0.05 µg/ml lipoic acid, 0.05 µg/ml cholesterol, 0.012 µg/ml ascorbic acid,
daughter cells survive to yield actively proliferating cultures. 0.003 µg/ml α-tocopherol phosphate; 0.025 µg/ml calciferol, 3.5 µg/ml choline
However, the doubling times are long compared with established chloride, 0.33 µg/ml folic acid, 0.35 µg/ml vitamin B12, 0.08 µg/ml thiamine HCL,
cell lines. Several factors contribute to this including long cell 4.5 µg/ml i-inositol, 0.075 µg/ml uracil, 0.125 µg/ml ribose, 0.0125 µg/ml para-
aminobenzioic acid, 1.25 mg/ml BSA, 0.085 µg/ml xanthine and 25 ng/ml cholera
cycle times, cell cycle blocks and apoptosis, indicating that the toxin (all from Sigma). Taxol (Sigma Aldrich) and Nutlin-3 (Sigma Aldrich),
prior cell division yielded a fatal genome. Nevertheless, the fact dissolved in DMSO, and Cisplatin (Sigma Aldrich), dissolved in 0.9% sodium
that many cells survive following highly abnormal divisions chloride, were stored below −20 °C. Nutlin-3 was used at a final concentration of
indicates that post-mitotic responses are severely compromised, 10 µM. Taxol and Cisplatin were used as described in the figure legends. Estab-
lished ovarian carcinoma cell lines COV318, COV362 (Sigma), CAOV3 (ATCC)
most likely due in large part to loss of p53 function14. were cultured in DMEM, while OVCAR3 (ATCC), Kuramochi, OVSAHO,
However, p53-independent mechanisms may also be defective. OVMANA and OVISE (JCRB Cell Bank) were cultured in RPMI. RMG1 (JCRB
For example, as well as driving proliferation and biogenesis, MYC Cell Bank) were cultured in Hams-F12 media. HCT116 colon cancer cells were
drives an apoptosis module that sensitises cells to mitotic from the ATCC and cultured in DMEM. All cell lines were grown with 10% foetal
bovine serum, 100 U/ml penicillin, 100 U/ml streptomycin and 2 mM glutamine,
abnormalities54,55. Interrogating the apoptotic machinery in these and were maintained at 37 °C in a humidified 5% CO2 atmosphere. OV56 (Sigma)
models is a future priority, as it may open up opportunities to were cultured in DMEM/F12 as above but supplemented with 10 mg/ml insulin,
explore pro-survival inhibitors as therapeutics56. 0.5 mg/ml hydrocortisone and 5% foetal bovine serum. All lines were authenticated
14 NATURE COMMUNICATIONS | (2020)11:822 | https://doi.org/10.1038/s41467-020-14551-2 | www.nature.com/naturecommunicationsYou can also read