Lung For Export Only - Tissue for Research
←
→
Page content transcription
If your browser does not render page correctly, please read the page content below
®

                                    ®

                 Lung

OncoTect iO Lung Kit                L12050
OncoTect iO Control Cells           L13010

                       CDXL12050-02

            For Export Only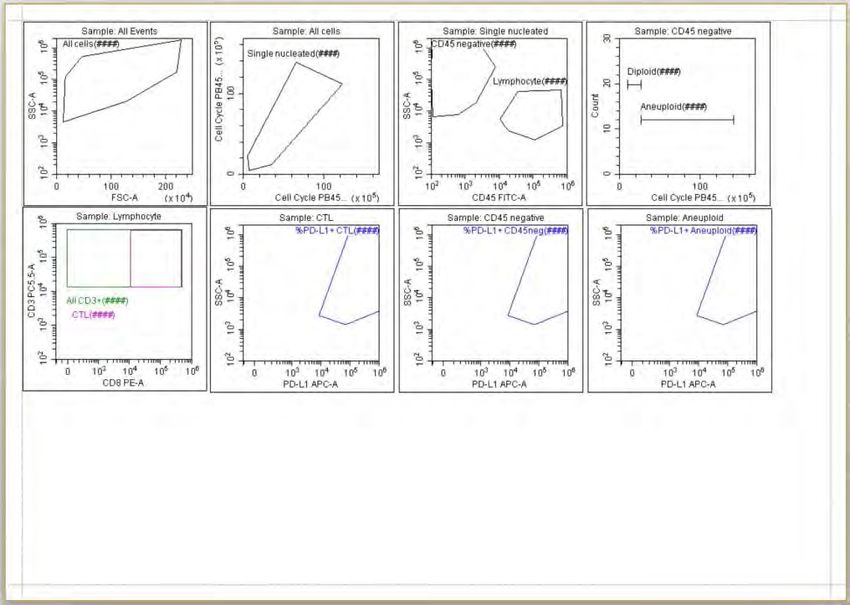
INTENDED USE

The OncoTect iO® Lung Kit is an in vitro quantitative flow cytometry test to detect tumor cells and immune cells expressing
PD-L1 protein in single cell suspensions prepared from non-small cell lung cancer (NSCLC) tissue. PD-L1 protein expression,
defined as the percentage of tumor and immune cells exhibiting positive staining, is quantified using a rabbit monoclonal
anti-PD-L1 antibody.

Indications for Use
The OncoTect iO Lung assay is indicated for use in patients with NSCLC. Results from the OncoTect iO Lung assay should not
be the sole criteria used for patient management. Test results should be interpreted by a qualified pathologist in
conjunction with histological examination, relevant clinical information and proper controls. Detection of PD-L1 expressing
tumor cells in a NSCLC patient specimen may indicate an enhanced survival benefit from PD-L1 immunotherapeutic
treatment for the patient.

SUMMARY AND EXPLANATION

Binding of the ligands PD-L1 and PD-L2 to PD-1, a cell surface receptor found on T cells and other immune cells, inhibits T-
cell proliferation and cytokine production. Up-regulation of PD-1 ligands, specifically PD-L1, occurs in some tumors, and
signaling through this pathway can contribute to inhibition of active T-cell immune surveillance of tumors.1,2,3,4 New
monoclonal immunotherapies bind to PD-1 and block its interaction with PD-L1 and PD-L2, releasing PD-1 pathway-
mediated inhibition of the immune response, including the anti-tumor immune response.5

PRINCIPLES OF THE PROCEDURE

Testing is performed on single cell suspensions from unfixed tumor samples. The cells in suspension are fixed and
permeabilized in a one-step reaction, washed, and then incubated with an antibody mixture containing fluorescently
labeled anti-PD-L1 and a cell identification panel of fluorescently labeled antibodies containing anti-CD3, CD8, and CD45.
Following incubation and wash, a DNA dye is added to identify nucleated cells. Detection of nucleated cells stained with
the labeled antibodies is performed on a flow cytometer with the following configuration:
    •   Lasers:
            o 488nm
            o 638nm
            o 405nm
    •   Detector Configuration (10 detectors):
            o Blue: 525/40 BP, 585/42 BP, 690/50 BP, 780/60 BP
            o Red: 660/20 BP, 712/25 BP, 780/60 BP
            o Violet: 450/45 BP, 525/40 BP, 610/20 BP

Gates are established to separate tumor from immune cell subsets. PD-L1 expression is measured by the intensity of the
signal from antibody bound to the cells of interest. Percentage of cells expressing PD-L1 per cell population is reported.

Validation of this assay was performed on a Beckman Coulter CytoFLEX flow cytometer.

                                                        Page 2 of 132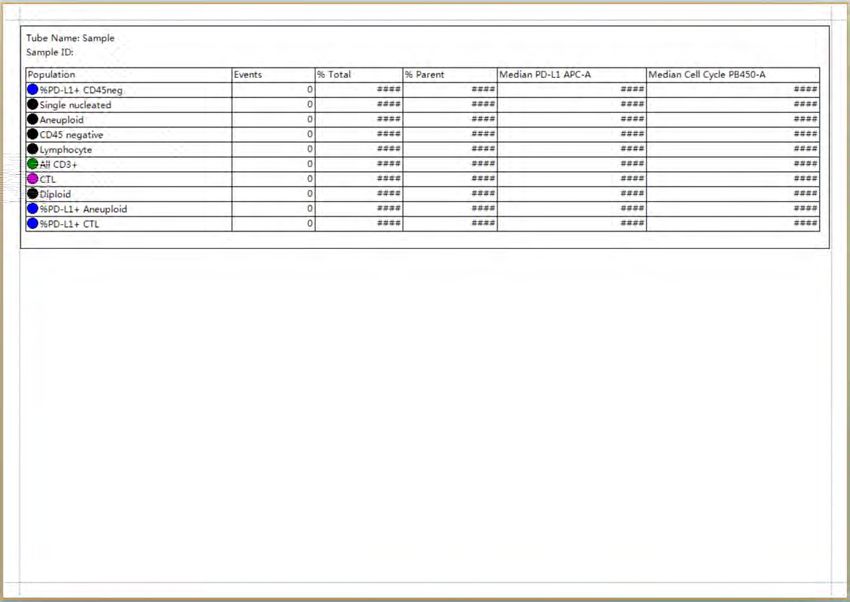
MATERIALS PROVIDED

  OncoTect iO® Lung Kit (50 tests)
  Store at 2-8 °C
                     Component       Quantity     Description

                                                  Fixation and permeabilization solution (to be diluted to 1X
                  incellMAX™, 2X     1 x 15 mL
                                                  prior to use)

                  Anti-PD-L1                      Rabbit monoclonal to human PD-L1 (extracellular), labeled
                                     50 µL
                  Antibody                        with ALEXA Fluor® 647; excitation 652nm, emission 668nm
                                                  Dye labeled antibody cocktail of mouse IgG2b anti-human
                                                  CD45-FITC (Fluorescein Isothiocyanate), mouse IgG1 anti-
                                                  human CD8-RD (Phycoerythrin) and mouse IgG1 anti-human
       L12050                                     CD3-PC5 (Phycoerythrin-Cy5)
                  Cell ID Cocktail   0.5 mL       Ab-dye         excites           emits
                                                  CD45-FITC      468-509nm          504-541nm
                                                  CD8-RD1        486-580nm          568-590nm
                                                  CD3-PC5        468-509nm         660-680nm

                  Cell Cycle Dye     1 mg         Powder form (to be reconstituted and diluted prior to use)

  OncoTect iO® Control Cells (10 tests)
  Store at 2-8 °C
                     Component       Quantity      Description
                                                   Mixture of PD-L1-positive human adenocarcinoma cells, PD-L1
        L13010       Control Cells   2 x 1.2 mL    negative epithelial cells, and Peripheral Blood Mononuclear
                                                   Cells (PBMCs) in D-PBS.

MATERIALS AND EQUIPMENT REQUIRED BUT NOT SUPPLIED

   •    incellPREP™ Tissue Single Cell Suspension™ system, optional, cat. # K17020, # K17008, # K15008
   •    Dulbecco’s PBS (D-PBS), Thermo Scientific cat. # SH30028.02
   •    10% Bovine Serum Albumin, Sigma cat. # A1595
   •    Water, sterile, nuclease-free, Fisher Scientific cat. # BP2484100
   •    CytoFLEX Daily QC Fluorospheres, Beckman Coulter cat. # B53230
   •    CytoFLEX FlowClean Cleaning Agent, Beckman Coulter cat. # A70449
   •    CytoFLEX Sheath Fluid, Beckman Coulter cat. # B51503
   •    SPHEROTM Rainbow Calibration Particles, 8-Peak, Spherotech cat. # RCP-30-5A (INCELLDX)
   •    Trypan Blue 0.4 % solution in PBS
   •    Micropipettors (1-20 µL, 20-200 µL, 200-1000 µL)
   •    Sterile micropipette tips (1-20 µL, 20-200 µL, 200-1000 µL)
   •    1.5 mL microcentrifuge tubes, with caps
   •    Vortex mixer
   •    Vacuum aspiration system compatible with microcentrifuge tubes
   •    Microcentrifuge, 600 g, for 1.5 mL tubes
   •    Hemocytometer (or equivalent for cell counting)
   •    Flow Cytometer with Blue (488 nm), Violet (405 nm), and Red (638) lasers. Beckman Coulter CytoFLEX with Plate
        Loader, or equivalent. NOTE: the CytoFLEX is for Research Use Only.
   •    96-well V-bottom plates, Corning #3897

                                                     Page 3 of 132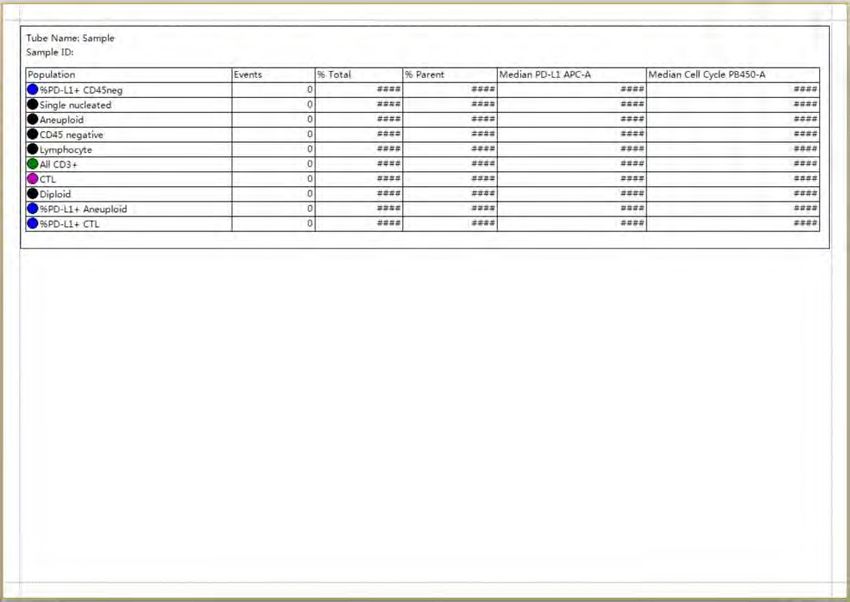
WARNINGS AND PRECAUTIONS

  •   For in vitro diagnostic use.
  •   For professional users.
  •   All human sourced biological samples should be treated as if capable of transmitting infectious agents.6,7,8,9,10
  •   Universal precautions should be employed with biosafety levels appropriate to the source of the samples.
  •   All samples and consumables should be disposed of appropriately.
  •   All hazardous materials should be disposed following local, regional or federal guidelines for hazardous waste
      disposal.
  •   incellMAX, 2X

          o   Danger
          o   Hazard Statements
              • H315                   Causes skin irritation.
              • H317                   May cause an allergic skin reaction.
              • H319                   Causes serious eye irritation
              • H341                   Suspected of causing genetic defects.
              • H350                   May cause cancer.
          o Precautionary Statements
              • P201                   Obtain special instructions before use.
              • P202                   Do not handle until all safety precautions have been read and understood.
              • P261                   Avoid breathing dust / fume / gas / mist / vapors / spray.
              • P264                   Wash skin thoroughly after handling.
              • P272                   Contaminated work clothing should not be allowed out of the workplace.
              • P280                   Wear protective gloves/ protective clothing/ eye protection/ face protection.
              • P302/P352              IF ON SKIN: Wash with plenty of soap and water.
              • P305/P351/P338 IF IN EYES: Rinse cautiously with water for several minutes. Remove contact
                                       lenses, if present and easy to do. Continue rinsing.
              • P308/P313              IF exposed or concerned: Get medical advice/ attention.
              • P333/P313              If skin irritation or rash occurs: Get medical advice/ attention.
              • P337/P313              If eye irritation persists: Get medical advice/ attention.
              • P362                   Take off contaminated clothing and wash before reuse.
              • P405                   Store locked up.
              • P501                   Dispose of contents/ container to an approved waste disposal plant.
          o The SDS can be found on the IncellDx website http://incelldx.com.
  •   Do not pipette by mouth.
  •   Avoid microbial and DNA/RNA contamination of reagents.
  •   Do not use components after their expiration dates.
  •   Do not pool reagents from different lots.
  •   The use of sterile disposable pipettes and tips is required.

                                                       Page 4 of 132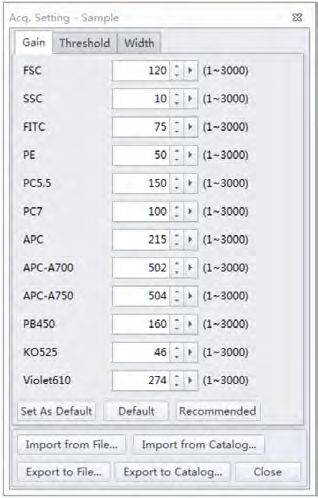
REAGENT PREPARATION, HANDLING, AND STORAGE

    1. IncellMAX, 1X - Dilute incellMAX, 2X, by adding 15 mL of nuclease-free water to the bottle. Check box next to H2O
       symbol on the label to confirm water was added. incellMAX, 1X is stable for 8 weeks at 2-8°C. Record the
       preparation and expiration date for the 1X solution on the bottle.
    2. 2% BSA Solution - Prepare the 2% BSA Solution by mixing 20 mL of 10% BSA with 80 mL of D-PBS. Examine the
       solution regularly for signs of contamination. Prepare fresh 2% BSA Solution as needed.
    3. Cell Cycle Dye Working Solution
       3.1. Prepare a 1 mg/mL Cell Cycle Dye Stock Solution by adding 1 mL of nuclease-free water to the Cell Cycle Dye
             bottle. Cell Cycle Dye Stock Solution is stable until the expiration date printed on the vial when stored in the
             dark at 2-8°C. Record the preparation and expiration dates on the container.
       3.2. Prepare a 1 µg/mL Cell Cycle Dye Working Solution by adding 5 µL of the Stock Solution to 4995 µL of D-PBS.
             The Cell Cycle Dye Working Solution is stable for 1 week when stored in the dark at 2-8°C. Record the
             preparation and expiration dates on the container.
    4. Store all kit components and prepared reagents at 2-8°C, protected from light. Return all components to 2-8°C
       immediately after use.

SPECIMEN COLLECTION, TRANSPORT, AND STORAGE

The OncoTect iO Lung assay utilizes single cell suspensions prepared from NSCLC tissue. Samples collected by traditional
means must be processed into single cell suspensions in order to be tested. Tissue should be transported on cold packs in
media. Transit time should be minimized to allow for prompt sample processing into single cell suspension.

Performance of the OncoTect iO Lung assay was validated with single cell suspensions prepared from NSCLC biopsy tissue
using the IncellDx incellPREP system.

PROCEDURE

    1. Instrument set-up must be completed prior to sample fixation and staining.
    2. Controls should be prepared and analyzed at the same time as the patient samples. The OncoTect iO Control Cells
       are pre-fixed and ready to use in the assay. Processing of the Control Cells starts at the PD-L1 and Cell ID Staining
       section of the procedure.
    3. Each test requires 2.5 x 10⁵ viable cells suspended in D-PBS at a concentration of 1.0 x 10⁶ cells/mL. Operators must
       determine the viable cell count using a hemocytometer (or equivalent) and 0.4% Trypan Blue staining and then
       adjust the viable cell concentration accordingly.

    Patient Sample Fixation

    1. Add 250 µL of the patient sample cell suspension from the previous step to a 1.5 mL microcentrifuge tube.
    2. Add 1 mL D-PBS and centrifuge at 300 g for 5 min at room temperature.
    3. Using a vacuum aspiration system, aspirate the supernatant from each sample, leaving 50-100 µL of residual liquid.
       Do not disturb the cell pellet.
    4. Re-suspend each cell pellet in 250 µL of incellMAX, 1X by gently pipetting up and down several times, and then
       incubate at room temperature for 1 h ± 5 min.

                                                        Page 5 of 132
PD-L1 and Cell ID Staining
1. Add 200 µL of Control Cells to a clean 1.5 mL microcentrifuge tube. Process in exactly the same manner as patient
samples from this point forward.
2. Add 1 mL of 2% BSA Solution to each cell suspension and incubate for 5 min at room temperature.
3. Centrifuge samples at 600 g for 5 min at room temperature.
4. Using a vacuum aspiration system, aspirate the supernatant from each sample, leaving 50-100 µL of residual liquid.
Do not disturb the cell pellet.
5. Prepare the Working Antibody Mixture immediately prior to use. DO NOT use a previously prepared Working
Antibody Mixture.
a. Perform a quick spin of the Anti-PD-L1 Antibody to force the reagent to the bottom of the tube.
b. Prepare the Working Antibody Mixture in a microcentrifuge tube or 15 mL conical tube according to the
volumes given below for various sample quantities plus controls. The master mix volumes given for >1
sample include a 10% excess to allow for pipetting loss when testing multiple samples. Prepare a master
mix when testing >1 sample to improve pipetting accuracy. Accurate pipetting is critical.
# Samples 2% BSA Solution Cell ID Cocktail Anti-PD-L1 Antibody
1 89 µL 10 µL 1 µL
5 489.5 µL 55 µL 5.5 µL
16 1566.4 µL 176 µL 17.6 µL
20 1958 µL 220 µL 22 µL
c. Mix by gently pipetting up and down several times.
6. Add 100 µL of Working Antibody Mixture to each sample and control tube. Mix thoroughly by pipetting. Discard
any unused Working Antibody Mixture.
7. Incubate samples for 30 min ± 2 min in the dark at room temperature.
Cell Cycle Dye
1. Add 1 mL of 2% BSA Solution to each patient sample and control tube, mix gently, and then incubate for 5 min at
room temperature.
2. Centrifuge samples at 600 g for 5 min at room temperature.
3. Using a vacuum aspiration system, aspirate the supernatant from each sample, leaving 50-100 µL of residual liquid.
Do not disturb the cell pellet.
4. Repeat steps 1 through 3 once.
5. Add 100 µL of the 1 µg/mL Cell Cycle Dye Working Solution to each sample and control, mix gently by pipetting,
and incubate for 30 min ± 2 min in the dark at room temperature.
6. Samples are now ready for analysis.
Page 6 of 132FLOW CYTOMETER INSTRUMENT SET UP USING THE BECKMAN COULTER CYTOFLEX
Initiate the CytoFLEX start up procedure at least 30 min prior to performing instrument Quality Control and analyzing
patient samples.
1. Perform the instrument startup procedures according to the CytoFLEX Instructions for Use (IFU).
CytoFLEX Instrument Cleaning and Quality Control (QC) Procedure
1. Perform the daily instrument quality control (QC) using the CytoFLEX Daily QC Fluorospheres according to the
CytoFLEX IFU.
2. NOTE: QC results must meet the following criteria to pass:
a. The gain differences must be ≤20% from the target gain.
b. The median fluorescence intensity (MFI) differences must be ≤5% from the target MFI.
c. The CV must be ≤5%.
Confirm that CytoFLEX Instrument QC results have met the above criteria before proceeding to calibration, application
of compensation settings, and analysis of the patient samples.
Use of other flow cytometry instruments: Instrument standardization and quality control should be performed every
day that samples will be run on the system. The methods used to do this are provided by the instrument manufacturer
and should be followed as described. Users should also refer to the manufacturer’s instrument manuals for specific
instructions for setting fluorescence compensation prior to analysis. The institution may have additional requirements
for assessing system performance according to the laboratory’s standard operating procedures. These must also be
performed and the results recorded. Prior to running samples, instrument set-up should be performed according to the
manufacturer’s protocols.
CytoFLEX Calibration
The CytoFLEX is calibrated with SPHEROTM Rainbow Calibration Particles, 8-Peak, using established targets for peak MFI
on each channel used in the assay. The established targets are specific for every lot of calibration particles, and are
specified in the CytoFLEX 8 Peak Beads Specifications for OncoTect iO Lung insert included with the OncoTect iO Lung
Kit.
The bead particles are used to set the detector gains for each CytoFLEX Instrument every day. This procedure will allow
for the comparison of data collected day-to-day and instrument-to-instrument.
1. Prepare 8-peak bead solution by adding 3 drops of SPHERO Rainbow Calibration Particles to 500 µL nuclease-free
water.
2. Pipette 200 µL of the working bead solution into one well of a 96-well V-bottom plate, then load the plate on the
cytometer.
3. Load the 8-peak QC template by selecting New Experiment from Template. Click Browse on the experiment line
and give the experiment file (.xit) an appropriate name (i.e. YYYYMMDD 8-Peak Beads Setup.xit), then click Browse
on the template line and navigate to the 8-peak bead template file (500130, 8-Peak Beads Template Oncotect iO
Lung.xitm).
4. Click on the Acq. Setting button and apply the preliminary acquisition settings below:
5. Ensure that the settings are as listed below and Click Close.
Page 7 of 132Gain Tab Threshold Tab
6. Run the beads on Slow; 100 events per second is recommended.
7. Use 8-peak beads to define detector gains for each instrument.
7.1. In the FSC vs. SSC plot, adjust the FSC and SSC gain so that the beads population falls within the P1 gate.
Gated events in P1 should be ≥87.00% of total events.
7.2. Use the ranges provided in the CytoFLEX 8-Peak Beads Specifications for OncoTect iO Lung to fine tune FSC
and SSC detector gains to meet target median within confidence limits if the values are not in the ranges
listed. (NOTE – Target specifications are lot specific and must be confirmed with each new lot of 8-Peak
Beads.)
7.3. Repeat the same adjustment for the FITC, PE, PC5.5, APC, and PB450 channels.
Page 8 of 1327.4. Ensure that 8 peaks are observed in the FITC, PE, PC5.5, APC, and PB450 channels.
Use the 8-Peak bead target ranges to fine tune FITC, PE, PC5.5, APC, and PB450 detector gains to meet target
median within confidence limits.
7.5. Click Set As Default button to save the detector gains in order to be able to load them into the experiment
file.
8. Select New Experiment From Template and load the OncoTect iO Lung template file (500129, OncoTect iO Lung
Template.xitm). Name and save your experiment file.
9. Open the Acq. Settings window, and apply the detector gains established during the 8-peak bead setup by clicking
the Default button. Apply to all tubes.
Page 9 of 13210. Apply compensation matrix that has been previously generated with the appropriate single –color fluorescent
reagents.
a. Click on the Settings menu at the top of the program. From the drop down menu select Compensation
Matrix or:
Click the Compensation Matrix button located in the Tube section of the screen.
b. From inside the Compensation Matrix window, click the Import button.
11. Navigate to the most recent compensation file.
Page 10 of 13212. Select Import compensation matrix and convert based on the current gain.
13. Run Daily Clean to remove any residual 8-peak bead particles. Refer to Daily Clean in the CytoFLEX IFU.
CONTROL CELL AND PATIENT SAMPLE ANALYSIS
Quality Control
At least one replicate of Control Cells should be processed with each batch of patient samples. If the Control Cells do not
perform per their specifications, the run should be considered invalid and the test procedure should be repeated. Control
Cell specifications are lot-specific. A lot-specific Certificate of Analysis is provided with each Control Cells. Verify that
Control Cells lot number in use is identical to the lot number stated in the Certificate of Analysis.
Sample Analysis
Control Cells
1. Open the Data Collection Template that was prepared and saved previously (see CytoFLEX Calibration, Step 8).
Use the same template to collect Control Cell and patient sample readings.
2. Collect samples at a Medium flow rate. If the events per second is >500, decrease flow rate to Slow.
3. Confirm that 50,000 total events are collected.
4. Following data collection, adjust gates to ensure that the populations of interest are encompassed. Follow the
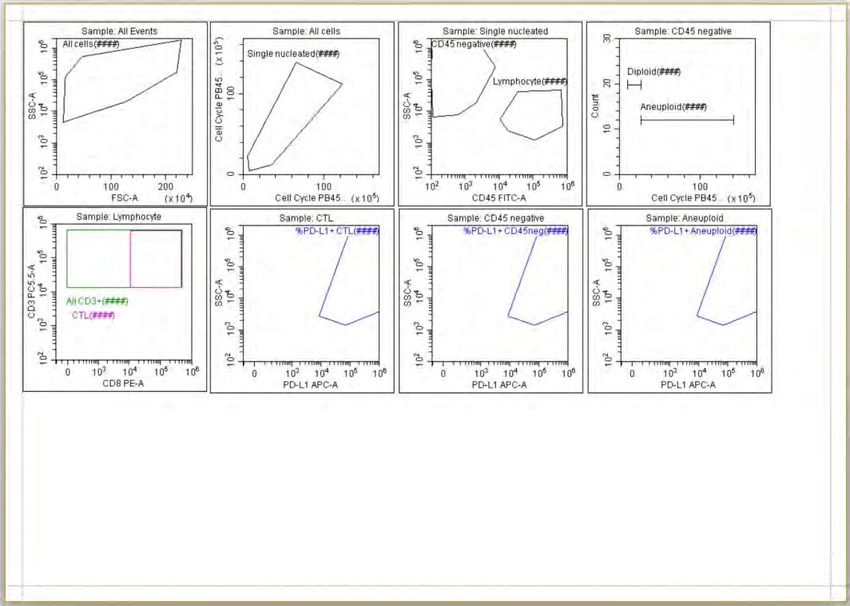
gating guidelines below for each sample:
4.1. Single Nucleated
In the Cell Cycle PB450-H vs. Cell Cycle PB450-A plot, adjust the Single Nucleated gate so that doublets are
excluded from the analysis. Doublets are a disperse smear of events to the left of the main population.
Examples of poor gating and proper gating are shown below:
Page 11 of 132Example of poor gating Example of proper gating
4.2. CD45 negative and Lymphocyte
In the CD45 FITC-A vs. SSC-A plot, adjust the CD45 negative gate to encompass the events in the upper
left corner of the plot. Adjust the Lymphocyte gate to encompass the events in the lower right corner of
the plot. Examples of poor gating and proper gating are shown below:
Example of poor gating Example of proper gating
Page 12 of 1324.3. All CD3+ and CTL
In the CD8 PE-A vs. CD3 PC5.5-A plot, adjust the All CD3+ gate to encompass the events located in the
top half of the plot. Adjust the CTL gate to encompass the population located in the upper right region of
the All CD3+ gate, excluding the population located in the upper left. Examples of poor gating and proper
gating are shown below:
Example of poor gating Example of proper gating
4.4. Diploid and Aneuploid
In the Cell Cycle PB450 vs. Count plot, adjust the Diploid gate to encompass the left-most peak on the x-
axis. Adjust the Aneuploid gate to encompass the peaks to the right of the Diploid gate. Examples of poor
gating and proper gating are shown below:
Example of poor gating Example of proper gating
Page 13 of 1324.5. PD-L1+ CD45neg and % PD-L1+ CTL
NOTE: DO NOT ADJUST PD-L1 GATES FOR CD45 NEGATIVE AND CTL POPULATIONS
PD-L1 expression on CD45- and CTL populations are found in the following plots:
% PD-L1+ CD45neg % PD-L1+ CTL
5. Determine if Control Cell values fall within the acceptance range specified in the lot-specific Certificate of
Analysis provided with the Control Cells.
6. If the values meet the acceptance criteria, proceed with collection of Patient Samples.
7. If the values do not meet acceptance criteria, do not proceed with collection of Patient Samples. Investigate
possible causes of error in Control Cell processing. Contact Field Applications for troubleshooting assistance.
Patient Samples
1. Use the same Data Collection Template to collect patient samples that was used to collect Control Cells.
2. Collect patient samples at a Medium flow rate. If the events per second is >500, decrease flow rate to Slow.
3. Confirm that at least 5,000 events were collected in the Single Nucleated gate.
4. Following data collection, adjust gates to ensure that the populations of interest are encompassed. Refer to
Steps 4.1-4.5 in previous section for detailed instructions.
5. The following metrics are to be reported:
Metric Gate Name Format
CD3+ Cells All CD3+ Percent Gated
Cytotoxic T-Cells CTL Percent Gated
PD-L1 expression CD45negative cells %PD-L1 + CD45neg Percent Gated
PD-L1 expression aneuploid
%PD-L1 + Aneuploid Percent Gated
CD45negative cells*
PD-L1 expression Cytotoxic T-Cells %PD-L1+ CTL Percent Gated
CD45 negative & Median PB450-A CD45negative /
DNA Index
Lymphocyte Median PB450-A Lymphocyte
*Only reported if DNA Index is >1.05
Page 14 of 1325.1. DNA Index
Calculate as follows: Median PB450-A CD45 negative divided by Median PB450-A Lymphocyte
5.2. % PD-L1+ Aneuploid (to be reported if DNA Index is >1.05)
NOTE: DO NOT ADJUST PD-L1 GATES FOR CD45 NEGATIVE AND CTL POPULATIONS
Page 15 of 132Printout of Results
1. Locate the printer icon on the tool bar.
2. Select Print Preview.
3. Click on the printer icon to print the report. A sample printout is below:
4. Repeat for each sample.
Page 16 of 132INTERPRETATION OF RESULTS
If controls do not meet acceptance criteria, investigate possible causes of error in sample processing. Contact your Field
Application Specialist to assist in troubleshooting.
LIMITATIONS
This test is for use with NSCLC tumor single cell suspensions. The performance of the OncoTect iO Lung Kit has not been
established for other sample types.
NON-CLINICAL PERFORMANCE EVALUATION
Analytical Specificity
Analytical specificity of Anti PD-L1 antibody (Alexa Fluor 647) was demonstrated by competitive binding with recombinant
PD-L1 protein followed by flow cytometry analysis. Recombinant PD-L1 protein (0.5 – 0.00098 µg) was pre-mixed with 0.5
µg of labeled anti-PD-L1 antibody (Alexa Fluor 647). The mixtures were incubated with PD-L1-positive human
adenocarcinoma cells and PD-L1-negative human epithelial cells. Specificity was exhibited by modulation of signal from
bound, labeled PD-L1 antibody in the presence of recombinant PD-L1 protein (Figure A). The signal-to-noise ratio also
demonstrates increased PD-L1 antibody binding to PD-L1-positive cells as recombinant PD-L1 protein decreases (Figure B).
Figure A: PD-L1 Signal by Protein Amount Figure B: Signal-to-Noise Ratio
90000 7.00
Median Fluorescence
80000 6.00
70000
60000 5.00
50000 4.00
40000 3.00
30000
2.00
20000
10000 1.00
0 0.00
µg of Recombinant Protein µg of Recombinant Protein
Linearity
PD-L1 expression levels were measured using Anti-PD-L1 antibody (Alexa Fluor 647 conjugate) on cell mixtures prepared
with PD-L1-positive human adenocarcinoma cells, PD-L1-negative human epithelial cells, and PBMCs. Data analysis
performed by 1st, 2nd and 3rd order least squares regression indicate that the OncoTect iO Lung assay is linear from 0% to
100%, with a repeatability of 2.13% in this interval.
Page 17 of 132Figure C: Linearity
100
% PD-L1-Positive (Single Nucleated)
90
80
70
60
50
40
30
y = -3E-05x3 + 0.0038x2 + 0.8345x + 1.4517
20
10
0
0 20 40 60 80 100
% PD-L1-Positive Cells in Mixture
Interfering Substances
The presence of red blood cells, in single cell suspensions from NSCLC biopsy was determined as a possible assay interferent.
Red blood cells were tested at concentrations between 0% - 50% in simulated patient sample mixtures containing PD-L1-
positive human adenocarcinoma cells, PD-L1-negative human epithelial cells, and PBMCs. The data indicates that red blood
cells do not interfere with the measurement of PD-L1 expression in the CD45 negative population of the simulated patient
samples.
Assay Precision
OncoTect iO Lung assay precision was evaluated in two studies using simulated patient samples prepared with PD-L1-positive
human adenocarcinoma cells, PD-L1-negative human epithelial cells, and PBMCs. The first study was a single-site study
performed in-house. The second study was a multi-site study performed using an external testing site running one system
and an internal testing site running two systems.
Single-Site Study:
Simulated samples were freshly prepared each day to simulate manipulations with actual patient tissues. Three levels of PD-
L1-positive cells were used. The study was performed over 8 days by 5 operators using 1 system and 2 lots of reagent. A total
of 180 measurements (60 at each of 3 PD-L1 expression levels) were collected and analyzed to establish intra-run precision
(1 day x 2 lots x 15 replicates per level), inter-day precision (5 days x 2 lots x 3 replicates per level) and inter-lot precision.
Results were analyzed by continuous variance component analysis. Results are shown below.
Multi-Site Study:
Assay reproducibility was evaluated using simulated patient samples that were pre-fixed in-house. Three levels of PD-L1-
positive cells were used. The study was performed over 5 days at 2 sites using 3 systems and 1 lot of reagents. A total of 225
measurements (75 at each of 3 PD-L1 expression levels) were collected and analyzed to establish intra-run, inter-day, inter-
site, and inter-system precision (25 replicates per instrument for each of 3 levels). Results were analyzed by continuous
variance component analysis. Results are shown below.
Page 18 of 132Single-Site and Multi-Site Variance Component Analysis Expressed as Standard Deviation (SD)
98.0% PD-L1+ 83.3% PD-L1+ 50.0% PD-L1+ 15.6% PD-L1+ 3.4% PD-L1+
Tumor Cells Tumor Cells Tumor Cells Tumor Cells Tumor Cells
Single Site Precision / Reproducibility
Mean 89.00 75.25 47.41
Intra Run (N = 30 per sample ) SD 3.28 9.58 3.26
% PD-L1+ Tumor
Inter Day (N = 30 per sample) SD 6.15 13.20 5.43
Inter Lot (N = 60 per sample) SD 0.00 0.00 0.00
Mean 92.30 80.23 58.22
Intra Run (N = 30 per sample ) SD 2.51 9.90 3.25
%PD-L1+ Aneuploid Tumor
Inter Day (N = 30 per sample) SD 3.45 14.47 7.89
Inter Lot (N = 60 per sample) SD 0.00 0.00 0.00
Mean 3.03 0.20 0.10
Intra Run (N = 30 per sample ) SD 2.92 0.12 0.05
% PD-L1+ CTL
Inter Day (N = 30 per sample) SD 0.66 0.12 0.09
Inter Lot (N = 60 per sample) SD 0.63 0.02 0.00
Multi Site Precision / Reproducibility
Mean 43.15 20.75 6.45
Intra Run (N = 75 per sample) SD 3.13 1.34 1.00
% PD-L1+ Tumor Inter Day (N = 75 per sample) SD 7.29 2.68 2.72
Inter Site (N = 75 per sample) SD 0.00 5.57 2.77
Inter System (N = 75 per sample) SD 9.64 0.00 0.00
Mean 63.09 33.37 11.80
Intra Run (N = 75 per sample) SD 3.57 2.97 1.60
%PD-L1+ Aneuploid Tumor Inter Day (N = 75 per sample) SD 7.20 4.33 3.77
Inter Site (N = 75 per sample) SD 11.43 4.22 3.16
Inter System (N = 75 per sample) SD 0.00 0.00 0.00
Mean 0.18 0.10 0.09
Intra Run (N = 75 per sample) SD 0.08 0.08 0.07
% PD-L1+ CTL Inter Day (N = 75 per sample) SD 0.07 0.04 0.05
Inter Site (N = 75 per sample) SD 0.13 0.02 0.00
Inter System (N = 75 per sample) SD 0.00 0.00 0.00
Note: Expected values for simulated patient samples are for PD-L1+ Tumor Cells only. Expected values for % PD-L1+ Aneuploid Tumor
Cells and % PD-L1+ CTL were not characterized.
CLINICAL PERFORMANCE EVALUATION
Clinical performance of the OncoTect iO Lung assay was evaluated at two sites using NSCLC tumor tissues. Single cell
suspensions were prepared using the IncellPREP™ Tissue Single Cell Suspension™ system.
Inter-Site Clinical Reproducibility
The clinical reproducibility of OncoTect iO Lung on NSCLC tissues was evaluated at two testing sites. The percentages of PD-
L1+ CD45-, PD-L1+ Aneuploid, and PD-L1+ CTL populations were determined for each NSCLC samples. A 5% cutoff was
then applied to segregate positive from negative samples. The average inter-site average negative agreement (ANA),
average positive agreement (APA), and overall percent agreement (OA) were calculated. Results are provided below.
Page 19 of 132Reproducibility of the OncoTect iO Lung Assay Tested at Two Sites
Reproducibility Study Diagnostic Cutoff Inter-site % Agreement
% PD-L1+ CD45-
ANA = 93%
APA = 77%
OA = 89%
% PD-L1+ CTL
ANA = 100%
Inter-site ≥5%
APA = NA*
OA = 100%
% PD-L1+ Aneuploid CD45-
ANA = 88%
APA = 82%
OA = 86%
ANA=Average Negative Agreement; APA=Average Positive Agreement; OA=Overall Agreement
*No Sample showed PD-L1 expression on the CTL population
Clinical Concordance to Immunohistochemistry (IHC)
Concordance with immunohistochemistry was determined by comparing the results from the OncoTect iO Lung assay to
those obtained through parallel testing with the Dako PD-L1 IHC 28-8 PharmDx Kit.A Nineteen NSCLC tumor tissues were
tested using both methods. Cutoffs of 5% and 1% were applied to the OncoTect iO Lung and Dako assays, respectively, to
derive positive or negative call outs. The observed agreement (OA), positive percent agreement (PPA), and negative percent
agreement (NPA) were determined, as well as the Kappa value for overall agreement. Results are summarized below.
Concordance of OncoTect iO Lung Assay vs IHC
Study Diagnostic Cutoff % Agreement
NPA : 97%
PPA: 89%
Concordance ≥5% OA: 95%
Kappa Statistic for Overall
Agreement :0.85
NOTE – The Dako PD-L1 IHC 28-8 PharmDx Kit reports the percentage of positively stained tumor cells. It does not report results for aneuploidy or
CTLs. Consequently, concordance for these populations is indeterminable.
A
Three unstained FFPE slides were prepared for each of the NSCLC samples. The slides were tested using the Dako PD-L1 IHC 28-8 PharmDx Kit, using a 1% cutoff to
determine positivity, per manufacturer instructions.
Page 20 of 132Metrics Reported for OncoTect iO Lung Assay vs IHC
IHC OncoTect iO Lung
% PD-L1 + %PD-L1+ %PD-L1+ CTL %PD-L1+ Aneuploid DNA
Sample
Tumor CD45 negative (CD3+/CD8+) (DNA index >1.05) Index
1 0 0.19% 0.00% 0.30% 1.73
2 0 0.01% 0.00% - 1.00
3 0 0.01% 0.00% 0.02% 1.88
4 50-60% 11.67% 0.10% 19.76% 1.91
5 0 0.15% 0.00% 0.18% 2.74
6 0 4.42% 0.08% 8.54% 1.39
7 0 0.23% 0.03% 0.44% 1.23
8Catalogue Number Serial Number
Part Number Batch Code
Consult Instruction For Use Authorized Representative in the European Community
Unique website URL to download the product
Contains Sufficient for Tests
specific Instructions For Use
“For Export Only” those products which are not
Manufacturer
meant to be distributed in the USA.
Lower Systemic Health Hazard Dilute the reagent by adding water
Systemic Health Hazard CE Mark
In Vitro Diagnostic Medical Device Anti-PD-L1 Antibody
Cell Cycle Dye incellMAX, 2X
Cell ID Cocktail
INTELLECTUAL PROPERTY
Alexa Fluor is a registered trademark of Molecular Probes, Inc, a Thermo Fisher Scientific company.
SPHEROTM is a trademark of Spherotech, Inc.
CytoFLEX is a trademark of Xitogen Technologies (Suzhou), Inc., a Beckman Coulter company.
Dako PD-L1 IHC 28-8 PharmDx Kit is a trademark of Dako, Inc., an Agilent company.
incellMAX and incellPREP are trademarks of IncellDx, Inc., Patent Pending.
OncoTect iO is a registered of IncellDx, Inc., Patent Pending
IncellDx, Inc.
1541 Industrial Road
San Carlos, CA 94070
Telephone: +1 650.777.7630
Fax: +1 650.587.1528 300317_05
©2017 Effective date: 07/11/2018
Page 22 of 132®
®
Lung
OncoTect iO Lung Kit L12050
OncoTect iO Control Cells L13010
CDXL12050-02
Nur für den Export vorgesehenVORGESEHENER VERWENDUNGSZWECK
Beim OncoTect iO® Lung Kit handelt es sich um einen quantitativen In-vitro-Durchflusszytometrietest für den Nachweis von
Tumorzellen und Immunzellen mit Expression des PD-L1-Proteins in Einzelzellsuspensionen, die aus nicht-kleinzelligem
Lungenkrebsgewebe hergestellt wurden. Die Expression des PD-L1-Proteins, die definiert ist als der Prozentsatz von
Tumor- und Immunzellen, die eine positive Anfärbung zeigen, wird mithilfe eines monoklonalen Anti-PD-L1-Antikörpers
vom Kaninchen quantifiziert.
Indikationen
Der OncoTect iO Lung-Assay ist zur Verwendung bei Patienten mit NSCLC indiziert. Die Ergebnisse des OncoTect iO Lung-
Assays dürfen nicht als alleiniges Kriterium für die Patientenbehandlung herangezogen werden. Die Testergebnisse sind
zusammen mit der histologischen Untersuchung, relevanten klinischen Informationen und einwandfreien Kontrollen von
einem Pathologen zu interpretieren. Der Nachweis von PD-L1 als Expression von Tumorzellen in einer NSCLC-
Patientenprobe kann auf einen verbesserten Überlebensvorteil des Patienten durch eine immuntherapeutische PD-L1
Behandlung hinweisen.
ZUSAMMENFASSUNG UND ERLÄUTERUNG
Die Bindung der Liganden PD-L1 und PD-L2 an PD-1, einem auf T-Zellen und anderen Immunzellen gefundenen
Zelloberflächenrezeptor, inhibiert die T-Zell-Proliferation und die Zytokin-Produktion. In einigen Tumoren findet eine
Hochregulierung von PD-1-Liganden, insbesondere von PD-L1, statt, und die Signalisierung über diesen Signalweg kann zur
Inhibition der aktiven T-Zell-Immunüberwachung von Tumoren beitragen.1,2,3,4 Neue monoklonale Immuntherapien binden
an PD-1 und blockieren die Interaktion mit PD-L1 und PD-L2 unter Freigabe der durch den PD-1-Signalweg-vermittelten
Inhibition der Immunantwort, einschließlich der Antitumor-Immunantwort.5
PRINZIPIEN DES VERFAHRENS
Der Test wird in Einzelzellsuspensionen aus unfixierten Tumorproben durchgeführt. Die Zellen in der Suspension werden in
einer einstufigen Reaktion fixiert und permeabilisiert, dann gewaschen und anschließend mit einer Antikörpermischung
mit fluoreszierend markiertem Anti-PD-L1 und einem Zellidentifikationspanel mit fluoreszierend markierten Antikörpern
mit Anti-CD3, CD8 und CD45 markiert. Nach Inkubation und Waschen wird ein DNA-Farbstoff zur Bestimmung der
kernhaltigen Zellen hinzugegeben. Der Nachweis von kernhaltigen Zellen, die mit den markierten Antikörpern angefärbt
wurden, erfolgt auf einem Durchflusszytometer mit der folgenden Konfiguration:
• Laser:
o 488 nm
o 638 nm
o 405 nm
• Detektorkonfiguration (10 Detektoren):
o Blau: 525/40 BP, 585/42 BP, 690/50 BP, 780/60 BP
o Rot: 660/20 BP, 712/25 BP, 780/60 BP
o Violett: 450/45 BP, 525/40 BP, 610/20 BP
Es werden Gates errichtet, um Tumor- von Immunzellen-Untergruppen zu trennen. Die PD-L1-Expression wird anhand der
Intensität des Signals des Antikörpers gemessen, der an die relevanten Zellen gebunden ist. Es wird der Prozentwert von
Zellen mit PD-L1-Expression pro Zellpopulation ausgegeben.
Page 24 of 132Die Validierung dieses Assays wurde mithilfe eines Beckman Coulter CytoFLEX flow cytometer durchgeführt.
IM LIEFERUMFANG ENTHALTENE MATERIALIEN
OncoTect iO® Lung Kit (50 Tests)
Bei 2–8 °C aufbewahren
Komponente Menge Beschreibung
Fixierungs- und Permeabilisierungslösung (vor Gebrauch auf
incellMAX™, 2 x 1 x 15 ml
1 x verdünnen)
Monoklonal (vom Kaninchen) zu humanem PD-L1
Anti-PD-L1
50 µl (extrazellulär), markiert mit ALEXA Fluor® 647; Exzitation
Antibody
652 nm, Emission 668 nm
Mit Farbstoff markierter Cocktail aus antihumanem lgG2b
CD45-FITC (Fluorescein-Isothiocyanat) von der Maus,
antihumanem IgG1 CD8-RD (Phycoerythrin) von der Maus und
L12050 antihumanem IgG1 CD3-PC5 (Phycoerythrin-Cy5) von der
Cell ID Cocktail 0,5 ml Maus.
Ak-Farbstoff Anregung Emission
CD45-FITC 468-509nm 504-541nm
CD8-RD1 486-580nm 568-590nm
CD3-PC5 468-509nm 660-680nm
Pulverform (vor Gebrauch zu rekonstituieren und zu
Cell Cycle Dye 1 mg
verdünnen)
OncoTect iO® Control Cells (10 Tests)
Bei 2–8 °C aufbewahren
Komponente Menge Beschreibung
Mischung aus PD-L1-positiven humanen Adenokarzinomzellen,
L13010 Control Cells 2 x 1,2 ml PD-L1 negativen Epithelialzellen und peripheren
mononuklearen Blutzellen (PBMCs) in D-PBS.
ERFORDERLICHE, NICHT IM LIEFERUMFANG ENTHALTENE MATERIALIEN UND AUSRÜSTUNG
• incellPREP™ Tissue Single Cell Suspension™-System, optional, Kat.- Nr. K17020, Nr. K17008, Nr. K15008
• Dulbecco’s PBS (D-PBS), Thermo Scientific Kat.- Nr. SH30028.02
• 10 % Bovine Serum Albumin, Sigma Kat.- Nr. A1595
• Wasser, steril, nukleasefrei, Fisher Scientific Kat.- Nr. BP2484100
• CytoFLEX Daily QC Fluorospheres, Beckman Coulter Kat.- Nr. B53230
• CytoFLEX FlowClean Cleaning Agent, Beckman Coulter Kat.- Nr. A70449
• CytoFLEX Sheath Fluid, Beckman Coulter Kat.- Nr. B51503
• SPHEROTM Rainbow Calibration Particles, 8-Peak, Spherotech Kat.- Nr. RCP-30-5A (INCELLDX)
• Trypan Blue 0,4%ige Lösung in PBS
• Mikropipettoren (1–20 µl, 20–200 µl, 200–1000 µl)
• Sterile Mikropipettorenspitzen (1–20 µl, 20–200 µl, 200–1000 µl)
• 1,5 ml-Mikrozentrifugenröhrchen, mit Kappen
• Vortexer
• Mit Mikrozentrifugenröhrchen kompatibles Vakuumaspirationssystem
• Mikrozentrifuge, 600 g, für 1,5-ml-Röhrchen
• Hämozytometer (oder Gleichwertiges für die Zellzählung)
Page 25 of 132• Durchflusszytometer mit blauem (488 nm), violettem (405 nm) und rotem (638) Laser. Beckman Coulter CytoFLEX
mit Plattenlader oder Gleichwertigem. HINWEIS: CytoFLEX ist nur zu Forschungszwecken vorgesehen.
• 96-Vertiefungs-V-Basisplatten, Corning Nr. 3897
WARNUNGEN UND VORSICHTSMASSNAHMEN
• Zur Verwendung in der In-vitro-Diagnostik.
• Für gewerbliche Anwender.
• Alle biologischen Proben vom Menschen sind als potenziell infektiös zu behandeln6,7,8,9,10.
• Es sind universelle Vorsichtsmaßnahmen mit für die Probenquelle geeigneten Biosicherheitsstufen zu ergreifen.
• Alle Proben und Verbrauchsmaterialien müssen ordnungsgemäß entsorgt werden.
• Alle gefährlichen Materialien müssen in Übereinstimmung mit den örtlichen, regionalen oder Bundesvorschriften
für die Entsorgung gefährlicher Abfälle entsorgt werden.
• incellMAX, 2x
o Gefahr
o H-Sätze
• H315 Verursacht Hautreizungen.
• H317 Kann allergische Hautreaktionen verursachen.
• H319 Verursacht schwere Augenreizung.
• H341 Kann vermutlich genetische Defekte verursachen.
• H350 Kann Krebs verursachen.
o Prävention
• P201 Vor Gebrauch besondere Anweisungen einholen.
• P202 Vor Gebrauch alle Sicherheitshinweise lesen und verstehen.
• P261 Einatmen von Staub/Rauch/Gas/Nebel/Dampf/Aerosolen vermeiden.
• P264 Nach Gebrauch Hände gründlich waschen.
• P272 Kontaminierte Arbeitskleidung nicht außerhalb des Arbeitsplatzes tragen.
• P280 Schutzhandschuhe/Schutzkleidung/Augenschutz/Gesichtsschutz tragen.
• P302/P352 BEI BERÜHRUNG MIT DER HAUT: Mit reichlich Seife und Wasser spülen.
• P305/P351/P338 BEI KONTAKT MIT DEN AUGEN: Vorsichtig mehrere Minuten mit Wasser spülen.
Eventuell vorhandene Kontaktlinsen nach Möglichkeit entfernen. Weiter
ausspülen.
• P308/P313 Bei Exposition oder falls betroffen: Ärztlichen Rat einholen/ärztliche Hilfe
hinzuziehen.
• P333/P313 Bei Hautreizung oder -ausschlag: Ärztlichen Rat einholen/ärztliche Hilfe
hinzuziehen.
• P337/P313 Bei anhaltender Augenreizung: Ärztlichen Rat einholen/ärztliche Hilfe hinzuziehen.
• P362 Kontaminierte Kleidung ausziehen. Vor erneutem Tragen waschen.
• P405 Unter Verschluss aufbewahren.
• P501 Inhalt/Behälter einer zugelassenen Deponie zuführen.
o Das MSDB finden Sie auf der IncellDx-Webseite http://incelldx.com.
• Nicht mit dem Mund pipettieren.
• Mikrobielle und DNA/RNA-Kontaminierung von Reagenzien vermeiden.
• Komponenten nach dem Ablaufdatum nicht mehr verwenden.
• Reagenzien aus verschiedenen Chargen nicht vermischen.
Page 26 of 132• Die Verwendung steriler Einwegpipetten und -spitzen ist vorgeschrieben.
REAGENZIENHERSTELLUNG, HANDHABUNG UND AUFBEWAHRUNG
1. IncellMAX, 1x - Verdünnen Sie incellMAX, 2x, durch Hinzufügen von 15 ml nukleasefreiem Wasser. Versehen Sie
das Kästchen neben dem H2O-Symbol auf dem Etikett mit einem Häkchen, um die Wasserzugabe zu bestätigen.
incellMAX, 1x ist bis zu 8 Wochen lang bei 2–8 °C stabil. Notieren Sie sich das Zubereitungs- und Ablaufdatum der
1x-Lösung auf der Flasche.
2. 2%ige BSA-Lösung – Bereiten Sie die 2%ige BSA-Lösung vor, indem Sie 20 ml der 10%igen BSA mit 80 ml D-PBS
mischen. Überprüfen Sie die Lösung regelmäßig auf Hinweise für eine Kontaminierung. Bereiten Sie ggf. eine
frische 2%ige BSA-Lösung vor.
3. Cell Cycle Dye-Arbeitslösung
3.1. Bereiten Sie eine 1 mg/ml Cell Cycle Dye-Stammlösung vor, indem Sie 1 ml nukleasefreies Wasser in die Cell
Cycle Dye-Flasche geben. Die Cell Cycle Dye-Stammlösung ist bei lichtgeschützter Aufbewahrung bei 2–8 °C
bis zum auf der Ampulle aufgedruckten Ablaufdatum stabil. Notieren Sie das Herstellungs- und Ablaufdatum
auf dem Behälter.
3.2. Bereiten Sie eine 1 µg/ml Cell Cycle Dye-Arbeitslösung vor, indem Sie 5 µl der Stammlösung in 4995 µl D-
PBS geben. Die Cell Cycle Dye-Arbeitslösung ist bei lichtgeschützter Aufbewahrung bei 2–8 °C 1 Woche lang
stabil. Notieren Sie das Herstellungs- und Ablaufdatum auf dem Behälter.
4. Bewahren Sie alle Kitkomponenten und vorbereiteten Reagenzien bei 2–8 °C auf und schützten Sie sie vor Licht.
Alle Komponenten müssen unmittelbar nach Gebrauch wieder auf 2–8 °C gebracht werden.
PROBENENTNAHME, TRANSPORT UND AUFBEWAHRUNG
Der OncoTect iO Lung-Assay verwendet Einzelzellsuspensionen, die aus NSCLC-Gewebe hergestellt wurden. Proben, die
mit herkömmlichen Mitteln entnommen wurden, müssen zu Einzelzellsuspensionen verarbeitet werden, um getestet
werden zu können. Gewebe müssen auf Kühlpacks in Medien transportiert werden. Die Transitzeit sollte so kurz wie
möglich sein, um eine unverzügliche Verarbeitung der Probe in eine Einzelzellsuspension zu ermöglichen.
Die Leistung des OncoTect iO Lung-Assays wurde mit Einzelzellsuspensionen aus NSCLC-Biopsiegewebe mithilfe des
IncellDx incellPREP-Systems validiert.
VERFAHREN
1. Die Geräteeinrichtung muss vor der Fixierung und der Färbung abgeschlossen werden.
2. Die Kontrollen sollten zur gleichen Zeit wie die Patientenproben hergestellt und analysiert werden. Die OncoTect
iO Control Cells sind vorfixiert und gebrauchsfertig. Die Verarbeitung der Kontrollzellen startet am Abschnitt PD-
L1 und Zell-ID-Färbung des Verfahrens.
3. Für jeden Test sind 2,5 x 10⁵ lebensfähige Zellen erforderlich, die in D-PBS in einer Konzentration von 1,0 x 10⁶
Zellen/ml suspendiert sind. Bediener müssen die Anzahl der lebensfähigen Zellen mithilfe eines Hämozytometers
(o. ä.) und 0,4%igem Trypan Blue-Farbstoff bestimmen und anschließend die Konzentration der lebensfähigen
Zellen anpassen.
Fixierung der Patientenproben
1. Geben Sie 250-µl-Patientenproben-Zellsuspension vom vorherigen Schritt in ein 1,5-ml-Mikrozentrifugierröhrchen.
2. Fügen Sie 1 ml D-PBS hinzu und zentrifugieren Sie das Röhrchen 5 Minuten lang bei 300 g und Raumtemperatur.
Page 27 of 1323. Aspirieren Sie den Überstand jeder Probe mithilfe eines Vakuumaspirationssystems und lassen Sie 50–100 µl
Flüssigkeit übrig. Stören Sie nicht das Zellpellet.
4. Resuspendieren Sie jedes Zellpellet in 250 µl incellMAX, 1x, indem Sie es mehrmals vorsichtig auf- und
abpipettieren und inkubieren Sie es dann bei Raumtemperatur 1 Std. ± 5 min. lang.
PD-L1 und Zell-ID-Färbung
1. Geben Sie 200 µl Control Cells in ein 1,5-ml-Mikrozentrifugierröhrchen. Verarbeiten Sie sie ab diesem Punkt auf die
gleiche Weise wie Patientenproben.
2. Geben Sie 1 ml 2%ige BSA-Lösung in jede Zellsuspension und inkubieren Sie sie 5 Minuten lang bei
Raumtemperatur.
3. Zentrifugieren Sie die Proben 5 Minuten lang bei Raumtemperatur und 600 g.
4. Aspirieren Sie den Überstand jeder Probe mithilfe eines Vakuumaspirationssystems und lassen Sie 50–100 µl
Flüssigkeit übrig. Stören Sie nicht das Zellpellet.
5. Bereiten Sie die Antikörper-Arbeitsmischung unmittelbar vor der Verwendung vor. KEINESFALLS eine zuvor
hergestellte Antikörper-Mischung verwenden.
a. Führen Sie einen schnellen Spin des Anti-PD-L1 Antibody durch, damit sich das Reagenz auf dem Boden des
Röhrchens absetzt.
b. Bereiten Sie die Antikörper-Arbeitsmischung in einem Mikrozentrifugierröhrchen oder einem konischen
15-ml-Röhrchen vor, und zwar gemäß der unten für mehrere Probenmengen plus Kontrollen angegebenen
Volumen. Das für >1 Probe vorgegebene Master Mix-Volumen enthält einen zehnprozentigen Überschuss
zur Kompensierung des Pipettierverlustes beim Testen mehrerer Proben. Stellen Sie beim Testen von >1
Probe einen Master Mix her, um die Pipettiergenauigkeit zu verbessern. Eine genaue Pipettierung ist
entscheidend.
Anzahl Proben 2%ige BSA-Lösung Cell ID Cocktail Anti-PD-L1 Antibody
1 89 µl 10 µl 1 µl
5 489,5 µl 55 µl 5,5 µl
16 1566,4 µl 176 µl 17,6 µl
20 1958 µl 220 µl 22 µl
c. Durch vorsichtiges mehrmaliges Auf- und Abpipettieren mischen.
6. Geben Sie 100 µl Antikörper-Arbeitsmischung zu jeder Probe und in jedes Kontrollröhrchen. Mischen Sie sie
gründlich durch Pipettieren. Entsorgen Sie jede nicht gebrauchte Antikörper-Arbeitsmischung.
7. Inkubieren Sie die Proben 30 min. lang ± 2 min. vor Licht geschützt bei Raumtemperatur.
Cell Cycle Dye
1. Geben Sie 1 ml 2%ige BSA-Lösung in jede Patientenprobe und das Kontrollröhrchen, mischen Sie sie vorsichtig und
inkubieren Sie sie 5 Minuten lang bei Raumtemperatur.
2. Zentrifugieren Sie die Proben 5 Minuten lang bei Raumtemperatur und 600 g.
3. Aspirieren Sie den Überstand jeder Probe mithilfe eines Vakuumaspirationssystems und lassen Sie 50–100 µl
Flüssigkeit übrig. Stören Sie nicht das Zellpellet.
4. Wiederholen Sie die Schritte 1 bis 3 einmal.
5. Geben Sie 100 µl der 1 µg/ml Cell Cycle Dye-Arbeitslösung in jede Probe und Kontrolle, mischen Sie sie vorsichtig
und inkubieren Sie sie 30 min ± 2 min. lang vor Licht geschützt bei Raumtemperatur.
6. Die Proben sind nun bereit für die Analyse.
Page 28 of 132DURCHFLUSSZYTOMETER-EINRICHTUNG MITHILFE DES BECKMAN COULTER CYTOFLEX
Starten Sie das folgende CytoFLEX-Inbetriebnahmeverfahren mindestens 30 Minuten früher, bevor Sie die
Gerätequalitätskontrolle und die Analyse von Patientenproben durchführen.
1. Führen Sie das Inbetriebnahmeverfahren für das Gerät gemäß der Gebrauchsanweisung für das CytoFLEX
Instrument durch.
CytoFLEX-Instrumentenreinigungs- und Qualitätskontrolle
1. Führen Sie die tägliche Instrumentenqualitätskontrolle mithilfe des CytoFLEX Daily QC Fluorospheres gemäß der
CytoFLEX-Gebrauchsanweisung durch.
2. HINWEIS: Die QK-Ergebnisse müssen die folgenden Kriterien erfüllen, um erfolgreich zu sein:
a. Die Verstärkungsunterschiede müssen ≤ 20 % der Zielverstärkung betragen.
b. Die mittleren Fluoreszenzintensitäts-(MFI-)Unterschiede müssen ≤ 5 % der Ziel-MFi betragen.
c. Der CV muss ≤ 5 % betragen.
Bestätigen Sie, dass die Ergebnisse der CytoFLEX-Geräteinstrumenten-QK die obigen Kriterien erfüllen, bevor Sie mit
der Kalibrierung, der Anwendung der Kompensationseinstellungen und der Analyse von Patientenproben fortfahren.
Verwendung anderer Durchflusszytometer: Die Instrumentenstandardisierung und die Qualitätskontrolle sollten an
jedem Tag, an dem Proben auf dem System analysiert werden, durchgeführt werden. Die Methoden, die dafür
verwendet werden, sind vom Gerätehersteller vorgegeben und sind wie beschrieben durchzuführen. Die Anwender
sollten für bestimmte Anweisungen die Handbücher heranziehen, um die Fluoreszenzkompensation vor der Analyse
einzustellen. Die Einrichtung kann zusätzliche Anforderungen an die Beurteilung der Systemleistung gemäß den
Standardbetriebsverfahren des Labors umfassen. Diese müssen ebenfalls durchgeführt werden und die Ergebnisse
müssen aufgezeichnet werden. Vor der Analyse von Proben muss die Geräteeinrichtung gemäß den Vorgaben des
Herstellers durchgeführt werden.
CytoFLEX-Kalibrierung
Das CytoFLEX wird mit SPHEROTM Rainbow Calibration Particles, 8-Peak kalibriert, und zwar unter Verwendung
festgelegter Ziele für die Peak-MFI auf jedem Kanal, der im Assay verwendet wird. Die festgelegten Ziele sind für jede
Charge Kalibrierungspartikel spezifisch und werden in der Beilage zum CytoFLEX 8 Peak Beads Specifications for
OncoTect iO Lung angegeben, die im OncoTect iO Lung Kit enthalten ist.
Die Bead-Partikel werden verwendet, um die Detektorverstärkungen für jedes CytoFLEX-Gerät jeden Tag einzustellen.
Dieses Verfahren ermöglicht den Vergleich der erfassten Daten auf tagtäglicher Basis und zwischen Geräten.
1. Bereiten Sie eine 8-Peak-Bead-Lösung vor, indem Sie 3 Tropfen SPHERO Rainbow Calibration Particles in 500 µl
nukleasefreies Wasser geben.
2. Pipettieren Sie 200-µl-Bead-Arbeitslösung in eine Vertiefung einer 96-Vertiefungs-V-Basisplatte; laden Sie
anschließend die Platte in das Zytometer.
3. Laden Sie die 8-peak-QK-Vorlage durch Auswahl von New Experiment from Template. Klicken Sie in der
Experimentzeile auf Browse und benennen Sie die Experimentdatei (.xit) entsprechend (d. h. JJJJMMTT 8-peak
Beads Setup.xit). Klicken Sie anschließend auf Browse auf der Vorlagezeile und navigieren Sie zu 8-peak bead
template file (500130, 8-Peak Beads Template Oncotect iO Lung.xitm).
Page 29 of 1324. Klicken Sie auf die Schaltfläche Acq. Setting und übernehmen Sie die untenstehenden Vorab-
Akquisitionseinstellungen:
5. Stellen Sie sicher, dass die Einstellungen wie unten aufgelistet sind und klicken Sie auf Close.
Gain Tab Threshold Tab
6. Lassen Sie die Beads auf Slow laufen; 100 Ereignisse pro Sekunde werden empfohlen.
7. Verwenden Sie die 8-peak Beads, um Detektorverstärkungen für jedes Gerät zu definieren.
7.1. Passen Sie im FSC vs. SSC die FSC und SSC gain so an, dass die Bead-Population in das P1-Gate fällt. Gegatete
Ereignisse in P1 sollten ≥ 87,00 % der gesamten Ereignisse betragen.
7.2. Verwenden Sie die Bereiche, die im CytoFLEX 8-Peak Beads Specifications for OncoTect iO Lung vorgegeben
sind, um FSC und SSC-Detektorverstärkungen feineinzustellen, um den Zielmedianwert zu erreichen, und zwar
innerhalb von Konfidenzgrenzen, wenn die Werte sich nicht in den aufgeführten Bereichen befinden.
(HINWEIS – Zielspezifikationen sind chargenspezifisch und müssen für jede neue Charge von 8-Peak Beads
bestimmt werden.)
7.3. Wiederholen Sie die gleiche Anpassung für die Kanäle FITC, PE, PC5.5, APC und PB450.
Page 30 of 1327.4. Stellen Sie sicher, dass 8 Peaks auf den Kanälen FITC, PE, PC5.5, APC und PB450 beobachtet werden.
Verwenden Sie die 8-peak Bead-Ziele, um die FITC, PE, PC5.5, APC und PB450-Detektorzunahmen
feineinzustellen, um die Zielmedianwerte innerhalb der Konfidenzgrenzen zu erreichen.
7.5. Klicken Sie auf die Schaltfläche Set As Default, um die Detektorverstärkung zu speichern und sie in die
Experimentdatei zu laden.
8. Wählen Sie New Experiment From Template und laden Sie die OncoTect iO Lung template-Datei (500129,
OncoTect iO Lung Template.xitm). Benennen und speichern Sie Ihre Experimentdatei.
9. Öffnen Sie das Acq. Settings-Fenster und übernehmen Sie die Detektorverstärkungen, die während der 8-peak
Bead-Einrichtung durch Klicken der Schaltfläche Default angegeben wurden. Gehen Sie bei allen Röhrchen
entsprechend vor.
Page 31 of 13210. Wenden Sie die Kompensationsmatrix an, die zuvor mit den geeigneten einfarbigen fluoreszierenden Reagenzien
generiert wurde.
a. Klicken Sie auf das Menü Settings oben im Programm. Wählen Sie im Dropdown-Menü Compensation
Matrix aus oder:
Klicken Sie auf die Schaltfläche Compensation Matrix, die sich im Röhrchenabschnitt des Bildschirms
befindet.
b. Klicken Sie im Fenster Compensation Matrix auf die Schaltfläche Import.
11. Navigieren Sie zur neuesten Kompensationsdatei.
Page 32 of 13212. Wählen Sie Import compensation matrix and convert based on the current gain.
13. Führen Sie eine tägliche Reinigung durch, um ggf. vorhandene 8-peak bead Partikel zu entfernen. Siehe Tägliche
Reinigung in der CytoFLEX-Gebrauchsanweisung.
CONTROL CELL- UND PATIENTENPROBENANALYSE
Qualitätskontrolle
Mindestens ein Replikat der Control Cells sollte mit jeder Charge von Patientenproben verarbeitet werden. Wenn die
Control Cells keine spezifikationsgemäße Leistung erbringen, sollte die Analyse als ungültig betrachtet und das
Testverfahren wiederholt werden. Control Cell-Spezifikationen sind chargenspezifisch. Ein chargenspezifisches Certificate
of Analysis wird mit allen Control Cells bereitgestellt. Verifizieren Sie, dass die Control Cell-Chargennummern, die
verwendet werden, identisch mit der Chargennummer im Certificate of Analysis sind.
Probenanalyse
Control Cells
1. Öffnen Sie die Datenerfassungsvorlage, die vorbereitet und gespeichert wurde (siehe CytoFLEX-Kalibrierung,
Schritt 8.) Verwenden Sie die gleiche Vorlage, um die Control Cell und die Patientenprobenwerte zu erfassen.
2. Erfassen Sie Proben mit einer Medium-Durchflussrate. Wenn die Ereignisse pro Sekunde >500 betragen,
verringern Sie die Durchflussrate auf Slow.
3. Bestätigen Sie, dass 50.000 Gesamtereignisse erfasst werden.
4. Nach der Datenerfassung müssen Sie die Gates anpassen, um sicherzustellen, dass die relevanten Populationen
berücksichtigt werden. Beachten Sie die Gating-Richtlinien unten für jede Probe:
4.1. Single Nucleated
Im Diagramm Cell Cycle PB450-H/Cell Cycle PB450-A muss das Single Nucleated-Gate so angepasst werden,
dass Doubletten von der Analyse ausgeschlossen werden. Doubletten sind ein verteilter Ereignisausstrich
links der Hauptpopulation. Beispiele für schlechtes Gating und richtiges Gating sind unten aufgeführt:
Page 33 of 132Beispiel für schlechtes Gating Beispiel für richtiges Gating
4.2. CD45 negative und Lymphocyte
Passen Sie im Diagramm CD45 FITC-A/ SSC-A plot das CD45 negative Gate an, um die Ereignisse in der
oberen linken Ecke des Diagramms zu berücksichtigen. Passen Sie das Lymphocyte-Gate an, um die
Ereignisse in der unteren rechten Ecke des Diagramms zu berücksichtigen. Beispiele für schlechtes Gating
und richtiges Gating sind unten aufgeführt:
Beispiel für schlechtes Gating Beispiel für richtiges Gating
Page 34 of 1324.3. All CD3+ und CTL
Passen Sie im Diagramm CD8 PE-A/CD3 PC5.5-A das All CD3+-Gate an, um die Ereignisse zu
berücksichtigen, die sich in der oberen Hälfte des Diagramms befinden. Passen Sie das CTL-Gate an, um
die Population im oberen rechten Bereich des All CD3+-Gate zu berücksichtigen, ausschließlich der
Population oben links. Beispiele für schlechtes Gating und richtiges Gating sind unten aufgeführt:
Beispiel für schlechtes Gating Beispiel für richtiges Gating
4.4. Diploid und Aneuploid
Passen Sie im Diagramm Cell Cycle PB450/Count plot das Gate Diploid an, um den Peak ganz links auf der
x-Achse zu berücksichtigen. Passen Sie das Gate Aneuploid, um die Peaks rechts vom Diploid zu
berücksichtigen. Beispiele für schlechtes Gating und richtiges Gating sind unten aufgeführt:
Beispiel für schlechtes Gating Beispiel für richtiges Gating
Page 35 of 132You can also read