Single-Cell RNA Sequencing Reveals Stromal Evolution into LRRC15 + Myofi broblasts as a Determinant of Patient Response to Cancer Immunotherapy
←
→
Page content transcription
If your browser does not render page correctly, please read the page content below
Published OnlineFirst November 7, 2019; DOI: 10.1158/2159-8290.CD-19-0644

RESEARCH ARTICLE

Single-Cell RNA Sequencing Reveals
Stromal Evolution into LRRC15+
Myofibroblasts as a Determinant of
Patient Response to Cancer
Immunotherapy
Claudia X. Dominguez1, Sören Müller2, Shilpa Keerthivasan1,
Hartmut Koeppen3, Jeffrey Hung3, Sarah Gierke4,
Beatrice Breart1, Oded Foreman3, Travis W. Bainbridge5,
Alessandra Castiglioni1, Yasin Senbabaoglu2,
Zora Modrusan6, Yuxin Liang6, Melissa R. Junttila7,
Christiaan Klijn2, Richard Bourgon2, and Shannon J. Turley1

               ABSTRACT            With only a fraction of patients responding to cancer immunotherapy, a better
                                   understanding of the entire tumor microenvironment is needed. Using single-cell
               transcriptomics, we chart the fibroblastic landscape during pancreatic ductal adenocarcinoma (PDAC)
               progression in animal models. We identify a population of carcinoma-associated fibroblasts (CAF) that
               are programmed by TGFβ and express the leucine-rich repeat containing 15 (LRRC15) protein. These
               LRRC15+ CAFs surround tumor islets and are absent from normal pancreatic tissue. The presence of
               LRRC15+ CAFs in human patients was confirmed in >80,000 single cells from 22 patients with PDAC
               as well as by using IHC on samples from 70 patients. Furthermore, immunotherapy clinical trials com-
               prising more than 600 patients across six cancer types revealed elevated levels of the LRRC15+ CAF
               signature correlated with poor response to anti–PD-L1 therapy. This work has important implications
               for targeting nonimmune elements of the tumor microenvironment to boost responses of patients with
               cancer to immune checkpoint blockade therapy.

               SIGNIFICANCE: This study describes the single-cell landscape of CAFs in pancreatic cancer during
               in vivo tumor evolution. A TGFβ-driven, LRRC15+ CAF lineage is associated with poor outcome in immu-
               notherapy trial data comprising multiple solid-tumor entities and represents a target for combinatorial
               therapy.

1
 Department of Cancer Immunology, Genentech, South San Francisco,             C.X. Dominguez and S. Müller contributed equally to this article.
California. 2Department of Bioinformatics and Computational Biology,          Corresponding Author: Shannon J. Turley, Genentech, 1 DNA Way, South
Genentech, South San Francisco, California. 3Department of Pathology,         San Francisco, CA 94080. Phone: 650-225-2790; E-mail: turley.shannon@
Genentech, South San Francisco, California. 4Center for Advanced Light        gene.com
Microscopy, Genentech, South San Francisco, California. 5Department of
Protein Chemistry, Genentech, South San Francisco, California. 6Depart-       Cancer Discov 2020;10:1–22
ment of Microchemistry, Proteomics & Lipidomics, Genentech, South San         doi: 10.1158/2159-8290.CD-19-0644
Francisco, California. 7Department of Translational Oncology, Genentech,      ©2019 American Association for Cancer Research.
South San Francisco, California.
Note: Supplementary data for this article are available at Cancer Discovery
Online (http://cancerdiscovery.aacrjournals.org/).

OF1 | CANCER DISCOVERY              FEBRUARY 2020                                                                                   AACRJournals.org

         Downloaded from cancerdiscovery.aacrjournals.org on February 13, 2021. © 2019 American Association for
                                                  Cancer Research.
Published OnlineFirst November 7, 2019; DOI: 10.1158/2159-8290.CD-19-0644

INTRODUCTION                                                    with immunotherapies improved outcomes in several pre-
                                                                clinical models (2, 4, 10). As these studies model cancers
   Pancreatic ductal adenocarcinoma (PDAC) remains a dev-       that show resistance to immunotherapies alone, they suggest
astating disease, with a 5-year survival rate of 7% (1). One    that elucidating CAF functions may provide the understand-
of the hallmarks of this aggressive cancer is a dramatic des-   ing needed to design more efficacious immunotherapeutic
moplasia driven by carcinoma-associated fibroblasts (CAF).      approaches and address the unmet clinical need in devastat-
CAFs not only deposit the extracellular matrix (ECM) that       ing cancers like PDAC. The full scope of CAF functions in the
characterizes desmoplasia, but also produce factors that        context of cancer immunotherapy remains to be determined,
promote tumor growth. Subsequently, CAFs have been tar-         but will necessarily be influenced by the fibroblast state at the
geted in efforts to improve PDAC outcomes, with conflict-       tissue–tumor interface.
ing results (2–6). The discrepancy in outcomes might be            We sought to provide an unbiased assessment of fibro-
explained by CAF heterogeneity, with different fibroblast       blast heterogeneity in normal as well as PDAC tissues by
populations having separate, perhaps even opposing, func-       using a combination of bulk and single-cell RNA sequenc-
tions (7, 8). Smooth muscle actin (SMA) and fibroblast-         ing (RNA-seq) of stromal cells. Normal tissues, nonmalig-
activating protein (FAP) have been described as showing         nant adjacent tissue, and early and advanced tumors from
heterogenous expression on CAF populations (8, 9), and          genetically engineered mouse models (GEMM) were utilized
SMA-high CAFs have further been identified as a tumor-          in this study. We hypothesized that the changing microen-
adjacent TGFβ-driven population with different inflamma-        vironment during tumor progression affects the phenotype
tory properties from SMA-low CAFs.                              of tissue-resident fibroblasts, resulting in their development
   Intriguingly, despite the conflicting results of targeting   into multiple CAF subsets. Our analyses revealed that preex-
CAFs as a single therapy, modulating CAFs in combination        isting fibroblast heterogeneity in normal tissue dictated the

                                                                               FEBRUARY 2020       CANCER DISCOVERY | OF2

    Downloaded from cancerdiscovery.aacrjournals.org on February 13, 2021. © 2019 American Association for
                                             Cancer Research.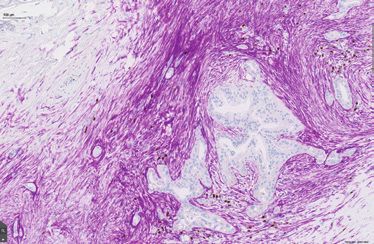
Published OnlineFirst November 7, 2019; DOI: 10.1158/2159-8290.CD-19-0644

RESEARCH ARTICLE                                                                                                   Dominguez et al.

developmental trajectories of murine CAFs. These data ena-          The transcriptional profiles confirmed that PDPN+ stromal
bled identification of the transcriptional profiles of indi-        cells are enriched for fibroblast signature genes and the DN
vidual CAF populations, and revealed a TGFβ-programmed              population for pericyte signature genes (ref. 17; Fig. 1D).
CAF, identifiable by expression of leucine-rich repeat con-         Several CAF-associated genes were enriched in the PDPN+
taining 15 (LRRC15), that became the dominant fibroblast            PDAC population, although in mice Fap, Sma (Acta2), Fsp1,
in advanced tumors. Combining publicly available human              and Pdgfrb, often described as CAF marker genes, were
sequencing data with newly acquired IHC of tissues from             detected to some degree in both stromal populations in nor-
70 patients with PDAC, we confirmed the identification              mal and PDAC pancreas. Particularly, we found that Acta2
of these LRRC15+ CAFs in human patients. The LRRC15+                is highest in normal pericytes and Fap is equally high in
CAF signature was used to evaluate their impact on anti–            normal fibroblasts (Fig. 1E). Although the pericyte-enriched
PD-L1 immunotherapy response in large patient cohorts               population also showed changes between normal and tumor
and revealed that high expression of the LRRC15+ CAF                tissues, we focused on the PDPN+ populations as they repre-
signature was associated with poor response to anti–PD-L1           sent the major CAF constituent.
therapy in immune-excluded tumors.
                                                                    Single-Cell RNA-seq Identifies Several
                                                                    Populations of PDPN+ Cells
RESULTS
                                                                       Although PDPN+ stromal cells constituted the majority
PDPN+ Cells Are the Dominant Fibroblast                             of CAFs, they expressed individual CAF markers at variable
Population in Normal and PDAC Murine Pancreas                       levels between replicates [e.g., Il6 levels ranged from 60 to
   To characterize the stromal compartment in PDAC, we              240 reads per kilobase of transcript per million mapped
began by optimizing digestion conditions for stromal cell           reads (RPKM)], and furthermore they appeared to simulta-
phenotyping from murine pancreas, starting with protocols           neously express markers reported to separate CAF subsets,
to isolate the known dominant stromal cell in the pancreas,         that is, Acta2 and Il6 (Fig. 1E). This implied a significant
the stellate cell. Standard stellate cell pronase-based diges-      heterogeneity within the PDPN+ stroma. To resolve this
tion (11) was observed to cleave many surface markers,              heterogeneity, we performed single-cell RNA-seq (scRNA-
whereas our novel digestion method preserved podoplanin             seq) of viable PDPN+ stromal cells from the pancreas of
(PDPN) and platelet endothelial cell adhesion molecule 1            KPP and normal mice. To better capture changes that
(PECAM1/CD31) expression (Fig. 1A). To model PDAC, we               occur with tumor progression, we divided the KPP samples
used the Pdx1cre/+;LSL-KrasG12D/+;p16/p19flox/flox (KPP) mice       into tumor-adjacent tissue as well as small (1–4 mm) and
that form aggressive tumors within 12 weeks (12). Although          large (5–10 mm) tumor samples for scRNA-seq (Fig. 2A).
tumors from these mice often show several different carci-          Five animals were pooled per condition in each of two bio-
noma types, including sarcomatoid, acinar, and mucinous             logical replicates, and scRNA-seq was performed (Fig. 2A).
subtypes, we observed that up to 88% of a given cohort              After quality control and batch correction (Supplementary
developed substantial regions of PDAC as has been reported          Fig. S2A; described in Methods), we obtained 13,454 high-
previously (refs. 13, 14; Supplementary Fig. S1A). Flow             quality cells for downstream analysis (replicate 1: n = 3,315;
cytometry of dissociated pancreases from the KPP mice and           replicate 2: n = 10,139). Graph-based clustering of cells after
normal mice from the same albino B6 background [B6(Cg)-             dimensionality reduction with t-Distributed Stochastic
Tyrc-2J/J] revealed three major populations of stromal cells        Neighbor Embedding (t-SNE; Fig. 2B) or Uniform Manifold
with similar composition between the two states (Fig. 1B;           Approximation and Projection (UMAP; Supplementary Fig.
Supplementary Fig. S1B). CD31+ stromal cells were pre-              S2B) identified 12 robust groups of cells (Supplementary
dominantly PDPN− blood endothelial cells with very few              Table S1).
lymphatic endothelial cells (15). The remaining CD31− cells            Endothelial, myeloid, and acinar cell clusters represent con-
were largely PDPN+ with fibroblast and stellate cell charac-        taminating cells as anti-CD31, anti-CD45, and anti-EPCAM,
teristics (Fig. 1B; Supplementary Fig. S1C-S1F). Immuno-            respectively, were used to gate out those populations in our
fluorescence microscopy confirmed the presence of PDPN+             flow protocol prior to sequencing (3% of all cells, Fig. 2A–C;
cells around structures in the normal pancreas including            Supplementary Fig. S2C). Within the remaining 97% of cells,
acinar clusters, ducts, and islets as well as a single-cell layer   83.5% of cells were identified as fibroblasts, 11.5% were clas-
of mesothelial cells encapsulating the pancreas (Fig. 1C,           sified as tumor cells undergoing epithelial-to-mesenchymal
left; Supplementary Fig. S1G). The KPP mice exhibited               transition (EMT), and 5.1% were mesothelial cells. All clus-
increased PDPN expression, most dramatically bordering              ters were represented in both replicates (Fig. 2B–D). Clus-
tumor islets, but also in some areas distal to tumors (Fig.         ters 5 and 7 had lost Epcam expression but retained higher
1C, middle and right; Supplementary Fig. S1H). To better            expression of several keratins and genes associated with an
characterize changes in the nonendothelial stroma with              epithelial origin. This suggested they might be EMT tumor
tumor progression, we harvested tissues from normal mice,           populations (Supplementary Fig. S2D). To confirm this
mice with early tumors (5 mm). Pancreatic stromal cells were               by these clusters (Fig. 2C). Flow cytometry confirmed ALCAM
sorted on CD31−PDPN+PDGFRA+ and CD31−PDPN− (DN)                     protein was expressed by a subset of cells found only in some
cells for RNA-seq of these two populations. This strategy           large tumors. Isolation and sequencing of ALCAM+ cells
was used to exclude mesothelial cells, which are also PDPN+         revealed expression of the KrasG12 allele with 98% variant
but negative for PDGFRA (ref. 16; Supplementary Fig. S1I).          allele frequency (Supplementary Fig. S2E), confirming their

OF3 | CANCER DISCOVERY         FEBRUARY 2020                                                                     AACRJournals.org

        Downloaded from cancerdiscovery.aacrjournals.org on February 13, 2021. © 2019 American Association for
                                                 Cancer Research.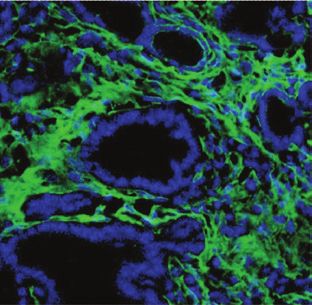
Published OnlineFirst November 7, 2019; DOI: 10.1158/2159-8290.CD-19-0644
Characterization of TGFa-Activated LRRC15+ CAFs in PDAC RESEARCH ARTICLE
A B PDPN+ normal PDPN+ PDAC
Standard stellate New stellate DN normal DN PDAC
cell enrichment cell isolation Normal PDAC BEC normal BEC PDAC
2% 96% 80 *** *** 108 ****
****
% of stromal gate
# of cells/gram
60 107
40 106
PDPN
PDPN
20 105
0 104
CD31 CD31 PDPN+ DN BEC PDPN+ DN BEC
C Normal pancreas PDAC distal PDAC proximal
PDPN
DAPI
D E
z-score Col1a Il6 Cdh11 Postn
2 P < 0.05 P < 0.05 P < 0.05 P < 0.05
Fbn1
0 15 10 8 10
Pdgfra
8 8 PDPN+ normal
Fibroblast signature
Dpt −3 6
rPKM Log2
rPKM Log2
rPKM Log2
rPKM Log2
10 PDPN+ PDAC
Dcn 6 6 DN normal
4
Lum 4 4 DN PDAC
5
Pdpn 2 2 2
Fap
0 0 0 0
Tcf21
Fn1
Acta2 Pdgfra Pdgfrb Fap Fsp1 Acta2
Cnn1 P < 0.05 P < 0.05 P < 0.05 P < 0.05 P < 0.05
8 10 8 8 15
Pericyte signature
Nes
Mcam 6 8 6 6
rPKM Log2
rPKM Log2
rPKM Log2
rPKM Log2
rPKM Log2
Rgs5 10
6
Des 4 4 4
4
Pdgfrb 5
2 2 2 2
Cspg4
0 0 0 0 0
PDPN+ DN
Figure 1. PDPN expression identifies the majority of tissue fibroblasts in normal and tumor-bearing pancreas. A, PDPN and CD31 expression on cells
digested according to standard stellate cell pronase protocols (left) or new digestion protocol (right) and enriched by gradient centrifugation, gated
on live CD45−EPCAM− cells. B, PDPN and CD31 expression in normal or tumor-bearing KPP GEMM pancreases (left) with quantification (right). Blood
endothelial cells (BEC) are PDPN− CD31+ as highlighted in the contour plots (green). C, Immunofluorescence imaging of PDPN staining in normal pancreas
(left; arrowheads highlight examples of PDPN+ cells surrounding acinar clusters) and KPP GEMM in advanced PDAC, either in “distal” tissue not directly
contacting tumor (middle) or “proximal” tissue, in which tumor cells were visibly contacting nontumor tissue (right). Scale bars, 50 μm. D, Heat map show-
ing relative gene-expression levels from RNA-seq analysis of PDPN+CD31−PDGFRa+ stroma and the DN populations demonstrating fibroblastic nature
of the PDPN+ population. E, Expression of selected CAF-associated genes in respective fibroblast populations [log2(RPKM+1)]. Statistical comparison
between all groups performed with Tukey test; bars designate pairwise comparisons where P < 0.05. All dot plots are representative of flow cytometry
data from single cell–dissociated tissues. A is representative of four independent experiments with 5 animals pooled per condition. B, Combined data
from five independent experiments with total n = 12 for normal and n = 25 for PDAC GEMM. Sidak multiple comparisons test was used for statistical
analysis (***, P < 0.0005; ****, P < 0.0001). C, Representative image from normal n = 4 for PDAC GEMMs n = 10. D, For normal samples n = 3–4, with 5 animals
pooled/single sequenced sample; for tumor n = 4 with 1–2 animals pooled/single sequenced sample.
FEBRUARY 2020 CANCER DISCOVERY | OF4
Downloaded from cancerdiscovery.aacrjournals.org on February 13, 2021. © 2019 American Association for
Cancer Research.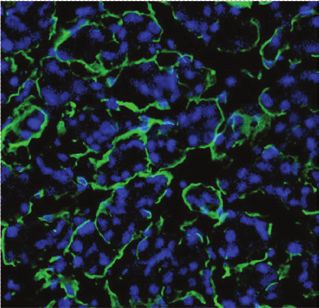
Published OnlineFirst November 7, 2019; DOI: 10.1158/2159-8290.CD-19-0644
RESEARCH ARTICLE Dominguez et al.
z-score
A Normal mice Pdx1cre/+;LSL-KrasG12D/+; B 50
−1 0 1 2 3
Ly6c1
B6(Cg)-Tyr c-2J/J p16/p19flox/flox mice n = 13,454 cells 0
12 Pi16
Endothelial cells Serpine2
Animals 1 Gpx3
Mesothelial cells 4 Acinar cells Tagln
11 2 Cthrc1
n = 5 per replicate n = 5 per replicate 25
Ti obl
Fi
6 1 3 Tmem100
ss as
br
Dpp4
1–4 mm
ue ts
5–10 mm Smoc2
tumor tumor 4 Col15a1
Isolate and 3 Crabp1
5
t-SNE_2
CAFs Crabp2
dissociate Adj. tissue 0 Upk3b
w/o tumor 2 0 6 Lrrn4
7 Krt8
−
Viable CD45 , EPCAM , − Krt18
Sort cells + 8 Cxcl1
CD24a−, CD31−, PDPN 8 Has1
−25 9 Proliferating Top2a
10x Sequence Batch 1 cells
9 Mki67
5
Batch 2 7 C1qb
fEMT
pEMT tumor
10 Csf1r
Batch correction Lineage Enrichment tumor cells Pnlip
cells 11
reconstr. analysis Cpa1
Bioinformatics −50 Myeloid
Pecam1
10 cells 12 Esam
−50 −25 0 25 50
t-SNE_1
C Pdpn Pdgfra Log(CPM/100+1)
D al en
t
r al en
t
r
rmdjac all rge uste o rmdjac all rge uste
o
N A S La Cl
m N A S La Cl
m
0 Max
fibroblasts
EMT cells
t-SNE_2
4 7
Tissue
3 5
1
12
Alcam (Cd166) Krt18 Msln 0
CAFs
11
Others
8
10
t-SNE_2
2
6
Prolif.
9
−1 0 1 % of cells
Replicate 1 z-score
Replicate 2
Csf1r Cpa1 Mki67
t-SNE_2
t-SNE_1 t-SNE_1 t-SNE_1
E Single-cell markers: Gsta3
Igfbp5
z-score
2
F 0.6
2
Fraction of fibroblast cells
Mesothelial cell Igfbp6
Arhgap29
Fibroblast Atp1b1
Crip1
Cldn15
0.4
5 10 15 20 25
Tm4sf1
Gas6
Clu −1
−Log10 (Padj)
C2
Rspo1 0
Fgf1
Slc9a3r1 0.2
Ezr 8
Nkain4
Krt19
Lrrn4
Slpi 1
Lgals2
Upk3b 0
Msln
−10 −5 0 5 Gpm6a Adjacent Small Large
Csrp2
Log2 (fold change) Mpp6
Sdc4
Mesothelial cells vs. fibroblasts 6 3 4 0 1 2 8 Cluster
Buechler et al.
Figure 2. PDPN expression is a feature of several stromal populations. A, Experimental design of the scRNA-seq experiment. B, Left, t-SNE embed-
ding of 13,454 single cells sorted from n = 20 mice across all conditions (normal, adjacent, small, and large tumors). Clusters identified through graph-
based clustering are indicated by color. Right, heat map showing the relative average expression of the most strongly enriched genes for each cluster
identified by log-fold change of cells within a cluster to all other cells in the dataset. Two representative genes are highlighted for each cluster. fEMT, full
EMT; pEMT, partial EMT. C, t-SNE embedding as in B; color indicates normalized expression level [log(CPM/100+1)] of indicated genes. D, Fraction of cells
in each cluster (z-scored per row) from each condition (column). Two adjacent rows per cluster visualize the fraction in each replicate. E, Left, comparison
of gene expression from bulk RNA-seq data between normal mesothelial cells and fibroblasts based on log2 fold-change (x-axis) and −log10(Padj; limma).
Genes enriched in cluster 6 of the scRNA-seq data in B are highlighted in red, genes upregulated in clusters 3 and 4 are highlighted in green. Right, heat
map of the relative average expression of markers for mesothelial cells identified by both Xie and colleagues (scRNA-seq) and Buechler and colleagues
(bulk RNA-seq) in clusters 0, 1, 2, 3, 4, 6, and 8 from B. F, The fraction of fibroblast cells from clusters 0, 2, 8, and 1 (y-axis) in tumor-adjacent tissue, tissue
from small tumors, and tissue from large tumors (x-axis; columns sum to 1).
OF5 | CANCER DISCOVERY FEBRUARY 2020 AACRJournals.org
Downloaded from cancerdiscovery.aacrjournals.org on February 13, 2021. © 2019 American Association for
Cancer Research.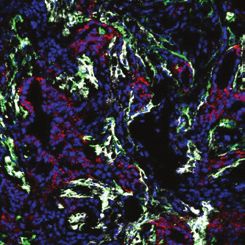
Published OnlineFirst November 7, 2019; DOI: 10.1158/2159-8290.CD-19-0644

Characterization of TGFa-Activated LRRC15+ CAFs in PDAC                                                   RESEARCH ARTICLE

identity as tumor cells. Cluster 6 was identified as mesothelial   unbiased separation were the same found in the supervised
cells based on previous work from Buechler and colleagues,         differential expression test between the two ntFibs c3 and c4
who transcriptionally profiled these cells and their transcrip-    (Fig. 3C, bottom). This analysis strongly suggests a lineage
tional differences to fibroblasts using bulk RNA-seq, as well      relationship between CAFs and preexisting fibroblasts in
as Xie and colleagues, who identified their signature genes        the tissue. To investigate this further, we calculated a score
with scRNA-seq (16, 18). Genes identified by both studies as       for each CAF cell based on the normal fibroblast ontogeny
mesothelial cell markers were strongly enriched in cluster 6;      signature genes (Supplementary Fig. S3C), which enabled
conversely, 18 of the 20 most enriched genes in cluster 6 were     tracing of the CAF populations back to their nonmalignant
also upregulated in mesothelial cells compared with fibro-         ancestor (Fig. 3D; Supplementary Fig. S3C). c3 and c4 ntFibs
blasts in the Buechler and colleagues dataset (Fig. 2C and E;      have separate differentiation trajectories during tumor pro-
Supplementary Table S2). We primarily observed mesothelial         gression, with c4 giving rise to c1 CAFs, which predomi-
cells in normal and normal-adjacent tissues (Fig. 2D).             nantly give rise to c2 CAFs; meanwhile, c3 ntFibs give rise to
   Clusters 0 to 4, 8, and 9 were identified as fibroblasts by     c0 CAFs, which then predominantly progress into c8 CAFs
their expression of signature fibroblast genes (Supplementary      (Fig. 3D, right; Fig. 3E). We find c9, strongly characterized
Fig. S2D). Two clusters of normal tissue fibroblasts (ntFib)       by high expression of proliferation markers (Mki67, Top2a),
derived from normal mice (c3 and c4), as well as five clusters     splits into two clusters in UMAP space (Supplementary Fig.
of CAFs, were identified (Fig. 2B; Supplementary Fig. S2B;         S2B), one aligning with EMT tumor cells, the other one
c0, c1, c2, c8, and c9). c0 and c1 were most abundant in tis-      aligning with c2 CAFs. The proliferating, CAF-proximal cells
sue adjacent to tumors (∼88% of CAFs; Fig. 2F). Meanwhile,         also exhibit a higher c4 ntFIB score, explaining the observed
the frequency of cells from c8 and especially c2 increased         expansion of descendants of this lineage with tumor pro-
with tumor progression and dominated in late-stage tumors          gression (Supplementary Fig. S3D). We thus conclude that
(>70% of all CAFs; Fig. 2F). Given the disappearance of ntFib      nontumor cells from c9 are mostly a proliferating subset of
with tumor progression, but proximity of normal fibroblast         c2 CAF.
and CAF clusters in t-SNE and UMAP space, we hypothesized             The trajectories for the two separate fibroblast popula-
that heterogeneity at baseline might play a role in subsequent     tions were confirmed with pseudotime analysis for each of
CAF development.                                                   the lineages (ref. 19; Fig. 3F). Comparing the expression of
                                                                   ECM genes and selected immune-regulatory genes across
In Mice, Two Separate Fibroblast Lineages                          all of the CAF clusters revealed a sharp transcriptional shift
Coevolve during Tumor Progression Driven                           in the programming of c2 and c8 (Fig. 3G). In the transi-
by TGFa and IL1                                                    tion from c4 ntFib, there is a significant loss of basement
   UMAP dimensionality reduction of ntFib alone con-               membrane components (e.g., type IV and type VI collagens)
firmed two major Pdpn+Pdgfra+ cell populations (Fig. 3A),          with a drastic increase in levels of several fibrillar collagens
and we identified their transcriptional profiles (Supple-          in c2 (Fig. 3G), indicating an increase and reorganization of
mentary Fig. S3A; Supplementary Table S3). The c3 popu-            fibrillar collagen deposition (20, 21). CAFs originating from
lation expressed ECM genes associated with elastin fibrils         c3 also increase expression of ECM genes, particularly fibril-
and ECM attachment (e.g., Emilin2, Mfap5, Fbn1) whereas            lar collagens (Fig. 3G, top), but the most dramatic changes
the c4 population was characterized by high expression             observed with tumor progression are in chemokine and
of ECM proteins that suggested a predominant role in               cytokine expression (Fig. 3G, bottom) such as the upreg-
structural support through the production and main-                ulation of Cxcl9/10, Cxcl1, and Ccl2, which likely recruit
tenance of collagen networks and basement membranes                myeloid populations through CXCR2 and CCR2 as well as
(e.g., Col4a1, Col6a6, Plc). Consequently, c4 exhibited a sig-     pleiotropic cytokines such as IL6 (22–24), particularly in late-
nificantly higher overall expression of collagens compared         stage fibroblasts (Fig. 3G). Interestingly, although there are
with c3 (Wilcoxon rank-sum test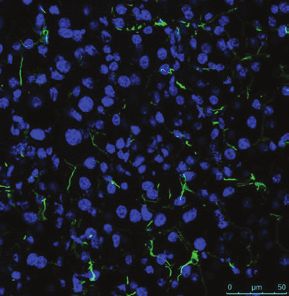
Published OnlineFirst November 7, 2019; DOI: 10.1158/2159-8290.CD-19-0644
RESEARCH ARTICLE Dominguez et al.
A Dpp4 Eng B PDPN+ fibroblasts
8 8
c3
c3 c3
c3
4 4
UMAP2
UMAP2
0 0
c4 c4
DPP4
Ly6C
−4 −4 c4 c4
2 4 6 8 2 4 6 8 2 4 6 8 2 4 6 8
UMAP1 UMAP1 UMAP1 UMAP1 ENG ENG
C 3
D E
Score
50 2.0 z-score
2 8 −1 2 1.5
Cell density
0.10 0 25 −1 0 1
c4 Score
1.0
t-SNE_2
1
4 0 0.5
0.05 0.0 Sparcl1
−25 −0.5 Col15a1
c4 Score −1 Cxcl14
0.00 −50 Serpine2
−30 −20 −10 0 10 20 −50 −25 0 25 50 3 0 8 2 1 4 Col4a2
Eng
PC1 50 2.0
Dpp4
PC1 loadings
25 1.5 Ackr3
c3 Score
t-SNE_2
0.06 1.0 Cd248
0 Sfrp2
0
0.5 Ly6c1
−25 0.0 Scara3
-0.06 c3 Score −0.5 2 4 1 8 3 0 Cluster
−50
Ly 3c
1
kr3
Sp15a2
Ac 48
Cd 6c1
Coarcl1
Col4a2
Se Il31
ma 3
−50−25 0 25 50 3 0 8 2 1 4
Corpine
l4a
2
l
Se
F G Cluster z-score
c4 Lineage 4: Normal fib. 1
1: Early CAF 4
0
3 2: Late CAF 1
−1
2
Component 2
2
1 3
0 0
−1 8
−2
Pseudotime
ol 3
C p11
m 1
o 1
Ti a1
m 0
o 1
ol 9
p2
C p8
C l1a1
ol 1
C p11
m 1
C l4a1
o 3
o 3
ol 4
M 5a3
ol 2
C l1a2
C mp2
ol 2
o 2
C 6a6
C p14
Ti 11
ol 2
Ti 4a1
M 8a1
C p3
C p3
C p7
M 10a
M 11a
C 2a
M p1
C mp
C ol3a
M 7a
M l8a
C l6a
C l4a
C l4a
C ol5a
M 8a
C l4a
C l6a
14
m
m
p
m
m
m
−5
m
1
0 5 10
ol
ol
m
2
2
M
o
o
o
o
ol
Component 1
3: Normal fib. Cluster z-score
c3 Lineage 0: Early CAF 1
4
2
8: Late CAF
1 0
Component 2
1 2 −1
3
0
0
−1 8
−2 Pseudotime
xc a
C 2a
Pd fa
C c
a
C cl1
Il1 1
C 2
9
C 3
Il1 l8
C 6
Tg p1
C 10
C 3
xc 2
C cl2
l9
8
Ve 3
C l6
Sp17
C 3
C 12
24
C cl6
1
C 4
C cl7
C 5
7d
C if
Il1 f
C Il1
gf
gf
i
1
cl
cl
cl
l1
l
C sf
Il1
Il3
fb
cl
g
l
L
M
c
xc
xc
I
xc
cl
−10 −5
l
cl
cl
cl
0 5
Pd
x
x
Component 1
H I z-score z-score
Enrichment z-score −Log10(Padj)
−.5 0 1 2 −.5 0 1
0 2 4 6 Cluster
SP1 Cellular reponse to IL1
c2 CAF c8 CAF
c8 CAF
4 4
NFκB
Cellular reponse to TNF 1 1
RELA Reponse to cytokine 2 2
MZF1_1-4
0 2 4 6 3 3
SMAD3
Cell adhesion 0
c2 CAF
MZF1_5-13 0
Cellular reponse to TGFβ 8 8
0 10 20
Collagen fibril organization
Ac gln
am 2a
C a
SeAct n1
Ta p3
C ta2
am p1
m g2
Px ns1
Sh F m1
1
Ad sb19
T 2
Adpxdtl3
ol 1
Ig fbi
Tp tgf
Tg b1
Il6
3
C l2
l1
a7
4a
1
C dc
fb
c
xc
n
fb
3 s
Tg
f
C
Tg
H
J
Normal c4 fib. genes Meso. genes Normal c3 fib. genes z-score
apCAF 1
Normal meso.
0
iCAF
Normal c3 −1
myCAF
Normal c4
Spry1
Col15a1
Hsd11b1
Sparcl1
Emp1
Ifitm1
Col4a1
Pkhd1l1
Slc9a3r1
Ano1
Fbn1
Ly6c1
Efhd1
Fn1
Lsp1
Abca8a
Tmem151a
Gpm6a
Cav1
Ly6a
Bgn
Ptn
Aspn
Cxcl14
Lrrn4
Nkain4
Esam
Sfrp4
Cygb
Mgp
Upk1b
Cd248
Tmem100
Cldn10
Krt8
Anxa3
Sema3c
Smpd3
Plpp3
Ackr3
Il33
Stk26
Serpine2
Smoc2
Crispld2
Col4a2
G0s2
Cxcl12
Pcolce2
Pi16
Mfap5
Lpl
Lsr
Cxadr
Lgals7
F11r
Myrf
Dominguez et al., WT B6(Cg)-Tyr c-2J/J
Elyada et al., KPC
OF7 | CANCER DISCOVERY FEBRUARY 2020 AACRJournals.org
Downloaded from cancerdiscovery.aacrjournals.org on February 13, 2021. © 2019 American Association for
Cancer Research.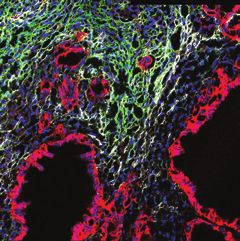
Published OnlineFirst November 7, 2019; DOI: 10.1158/2159-8290.CD-19-0644

Characterization of TGFa-Activated LRRC15+ CAFs in PDAC                                                                        RESEARCH ARTICLE

site enrichment (Fig. 3H). Pathway enrichment analysis sup-                      from early- and late-stage tumor PDPN+ CAFs identified
ported these predictions, suggesting signaling through IL1                       Lrrc15 to be one of the most differentially expressed genes
and TNFα as a driver of the c8 transcriptional signature                         between CAFs and ntFIBs (Fig. 4A). Lrrc15 encodes a trans-
and TGFβ-driven activation of c2 (Fig. 3H). Furthermore,                         membrane domain–containing molecule expressed in the
we observed a strong enrichment of a TGFβ fibroblast gene                        stroma of several human tumors and upregulated by TGFβ
signature (32) in c2 cells, further validating TGFβ as a key                     (38). Cross-referencing genes enriched in the TGFβ-driven
driver of the c2 phenotype (Fig. 3I, left). Interestingly, their                 c2 to an atlas of proteins experimentally identified to be on
transcriptional signatures suggest these populations may                         the cell surface (39) further validated Lrrc15 to be a strongly
promote their own programming; whereas c8 cells express                          enriched c2 gene encoding a surface protein (Supplemen-
IL1α and their chemotactic profile suggests paracrine interac-                   tary Fig. S4A).
tions with myeloid cells, which can also be a primary source                        The presence of LRRC15+ PDPN+ cells with fibroblast
of IL1 and TNF (Fig. 3I, right; refs. 33–35), c2 shows expres-                   morphology in tumor-bearing pancreases was confirmed
sion of Tgf b1 and Tgf b3 (Fig. 3I).                                             by immunofluorescence microscopy; LRRC15+ cells were
   To confirm the validity of our fibroblast evolution model,                    usually found in nests throughout the tumor-bearing
we compared our expression signatures to the previously                          pancreas surrounding tumor cells in KPP GEMMs (Fig.
published fibroblast-enriched data from KPC mice (36).                           4B). We further employed subcutaneous models of PDAC,
UMAP clustering identified a group of Pdpn+ Pdgfra+ cells                        using a cell line derived from KPP GEMMs (KPP14388).
that could be dissected into three different subclusters (Sup-                   Characterization of flank injections of 100K tumor cells
plementary Fig. S3E): one cluster of Ly6a/c1+ cells, previously                  showed tumors with similar stromal composition to the
described as “iCAFs,” one cluster of Col15a1+ cells, previously                  KPP mice (Supplementary Fig. S4B). Immunofluorescence
described as “myCAFs,” and one cluster with high levels of                       microscopy revealed abundant LRRC15+ PDPN+ cells in
Cd74, H2-Ab1, and Saa3, previously described as “apCAFs.”                        the subcutaneous tumors derived from KPP PDAC lines
When we compared the average expression levels of our                            (Fig. 4C). Flow cytometry analysis showed that LRRC15
two normal fibroblast lineage programs to those of these                         marked a significant portion of PDPN+ stromal cells,
clusters, we found that myCAFs clearly clustered with our                        and was largely absent from other cell populations in
c4 fibroblasts and iCAFs with c3 fibroblasts, confirming that                    the tumor microenvironment (TME; Fig. 4D). Notably,
the lineage hierarchy is similarly present in the KPC model                      LRRC15, unlike many other CAF markers, is also absent
(Fig. 3J). Notably, apCAFs clustered with c6 mesothelial cells                   in lymph-node stroma as well as normal pancreas (Sup-
from normal pancreas (markers, Supplementary Table S3).                          plementary Fig. S4C).
Accordingly, the IL1 c8 CAFs exhibited most similar expres-                         Because of their proximity to tumor islets, we decided to
sion profiles to iCAFs, the TGFβ c2 CAFs clustered with                          assess whether LRRC15+ CAFs can directly enhance tumor
myCAFs, and the c6 mesothelial cells clustered with apCAFs                       growth. We generated a KPP line expressing diphtheria toxin
(Supplementary Fig. S3F).                                                        receptor (DTR) that allowed us to remove residual tumor
                                                                                 cells and culture isolated CAFs with the addition of diphthe-
Mouse Models of PDAC Identify LRRC15                                             ria toxin. Two thousand KPP-mApple tumor cells were grown
as a Marker of TGFa-Driven c2 CAFs                                               alone or in coculture with LRRC15+ CAFs compared with
   We were particularly interested in further characterizing                     LRRC15− Ly6C+ CAFs or c3 and c4 ntFIBs and assessed for
c2 as it increased with tumor progression, dominating                            their ability to promote spheroid growth in 3-D culture. Tumor
the CAF compartment in late-stage tumors (Fig. 2F), and                          spheroids cultured with any fibroblast population grew larger
because TGFβ-associated stroma is correlated with poor                           than those in medium alone. This demonstrated that all the
prognosis (32, 37). Therefore, we sought to identify mark-                       fibroblasts tested can directly enhance tumor growth (Fig. 4E).
ers that distinguish TGFβ-driven c2 CAFs from the other                          Although we cannot rule out that the spheroids them-
fibroblast stromal subsets in PDAC. Bulk RNA-seq data                            selves reprogrammed the fibroblasts as has been previously

Figure 3. Two normal tissue fibroblasts follow two separate differentiation trajectories driven by IL1 and TGFβ. A, Left, UMAP embedding of cells
from normal pancreas. Color and numbers indicate dot density (gray, low; blue, low/medium; red, medium/high; yellow, high). Middle, color indicates
cluster membership. Right, color indicates marker gene expression. B, Representative flow cytometry plots of fibroblasts gated on live PDPN+ fibro-
blasts from normal mouse pancreas stained for DPP4 and endoglin (ENG) or Ly6c and ENG. C, Top, density distribution of cells from individual fibroblast
clusters (color) along the first principal component of a PCA. Bottom, PC1 loadings of genes highlighted in Supplementary Fig. S3A. D, Left, t-SNE from
Fig. 2B restricted to fibroblasts. Color indicates the score for expression of marker genes for two populations from normal pancreas shown in A. Right,
box plots outline the distribution of scores in each cluster. E, Heat map visualizing the relative average expression of indicated genes (rows) in fibroblast
clusters (columns). F, Top, Monocle 2 pseudotime trajectory of c4 normal fibroblasts and c4-derived CAFs. Cells are colored by cluster. Bottom, same
as top, but for c3 normal fibroblasts and c3-derived CAFs. G, Heat maps visualizing the relative average expression of ECM-encoding genes (top) and
chemokines/cytokines (bottom) across the 6 main fibroblast clusters (rows). Columns were clustered using complete linkage clustering and Euclidean
distance as distance measure. H, Left, transcription factor motif enrichment analysis in promoters (±10 kb of transcription start site) of genes specific
to CAF populations c2 and c8. Right, pathway enrichment analysis for genes specific to CAF clusters 8 (top) and 2 (bottom). I, Left, heat map visualizing
the relative average expression of genes from the F-TBRS signature across fibroblast clusters. Columns were clustered with complete linkage clustering
using Euclidean distance. Right, relative average expression of indicated genes (columns) in CAF clusters (rows). Columns were clustered with complete
linkage clustering using Euclidean distance. J, Heat map comparing the relative average expression of marker genes (rows) of normal fibroblast clusters
3 and 4, as well as normal mesothelial cells between iCAFs, myCAFs, apCAFs, c3 normal fibroblasts, c4 normal fibroblasts, and normal mesothelial cells
(rows). Rows and columns were clustered with complete linkage clustering using Euclidean distance as distance measure.

                                                                                                    FEBRUARY 2020          CANCER DISCOVERY | OF8

     Downloaded from cancerdiscovery.aacrjournals.org on February 13, 2021. © 2019 American Association for
                                              Cancer Research.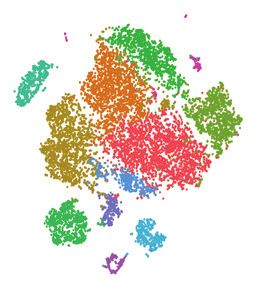
Published OnlineFirst November 7, 2019; DOI: 10.1158/2159-8290.CD-19-0644
RESEARCH ARTICLE Dominguez et al.
A B C
KPP GEMM KPP subcutaneous
Log FC late PDAC vs. healthy Lrrc15
DAPI PDPN EPCAM LRRC15
DAPI PDPN EPCAM LRRC15
Log FC early PDAC vs. healthy
Sign. different both comparisons
Sign. different only late PDAC
Sign. different only early PDAC
D
Subcutaneous KPP, gated on PDPN+ CAF
For all P < 0.05 For all P < 0.005
80 2.5 × 10⁶
# of LRRC15+ Cells/g
% LRRC15+ Cells
60 2.0 × 10⁶
over isotype
1.5 × 10⁶
40
1.0 × 10⁶
20
PDPN
PDPN
5.0 × 10⁵
0 0.0
Isotype LRRC15 PDPN DN BEC CD45 Tumor PDPN DN BEC CD45 Tumor
CAF CAF
E c3 Fibroblast c4 Fibroblast
KPP LRRC15+ CAF Ly6C+
alone + KPP + KPP + KPP + KPP
Day 12
2.0 × 10⁷
Tumor KPP
**** LRRC15+ c2 CAF + KPP
1.5 × 10⁷
Total area (µm2)
Ly6C+ CAF c0/c3 + KPP
c3 Fibroblast + KPP
1.0 × 10⁷
c4 Fibroblast + KPP
5.0 × 10⁷
0.0
0 5 10 15
Days in coculture
Figure 4. TGFβ-responsive CAFs can be identified by LRRC15 expression. A, Log2 fold change of gene expression (dots) between normal fibroblasts
and early PDPN+ PDAC CAFs (x-axis) and normal fibroblasts and late-stage PDAC CAFs (y-axis). Genes significant [Padj < 0.1 and absolute (log2FC) > 1]
are indicated in blue, genes significant in only late-stage CAFs in green, and in only early CAFs in red. B, Immunofluorescence image of PDPN (green),
LRRC15 (white), EPCAM (red), and DAPI (blue) expression in tumor-bearing KPP GEMM pancreas; yellow arrowheads highlight examples of LRRC15+
clusters. C, Immunofluorescence image of PDPN (green), LRRC15 (white), EPCAM (red), and DAPI (blue) expression in subcutaneous KPP tumor showing
PDPN+LRRC15+ fibroblasts. D, Representative plot showing LRRC15 staining by flow cytometry in the PDPN+ fibroblast gate (left), quantification of
LRRC15+ cells by frequency of population and numbers normalized to weight in the KPP sc model. E, Top, representative images from single wells (from
24-well plate) of KPP-mApple spheroids after 12 days of 3-D culture. KPP-mApple spheroids were cultured alone or cocultured with the designated
fibroblast population. Bottom, quantification of total area of mApple+ spheroids per whole well over time. These data are combined from two independ-
ent experiments; for each experiment n = 4 wells/condition. Dunnett multiple comparisons test, comparing tumor alone against all other conditions,
showed a significant difference (****, P < 0.0001) for all conditions.
OF9 | CANCER DISCOVERY FEBRUARY 2020 AACRJournals.org
Downloaded from cancerdiscovery.aacrjournals.org on February 13, 2021. © 2019 American Association for
Cancer Research.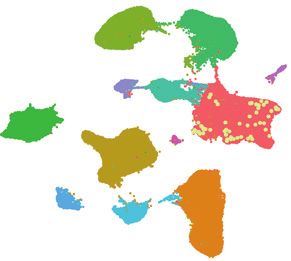
Published OnlineFirst November 7, 2019; DOI: 10.1158/2159-8290.CD-19-0644
Characterization of TGFa-Activated LRRC15+ CAFs in PDAC RESEARCH ARTICLE
reported (40), it suggests that the specific in situ positioning undergone EMT, we collected three independent lines of
of LRRC15+ CAFs next to tumor islets might be one of the evidence. First, we confirmed only cells in cluster 0 were
keys to their role in a protumor niche, rather than a unique positive for mRNA with the KRASG12 missense mutation
ability to promote tumor growth. This experiment also repre- (Fig. 5A). Second, reanalysis of a separate publicly avail-
sents a single functional test; given the unique transcriptional able microdissection study (42) showed that only markers
differences between the fibroblast populations, we might for tumor cells (cluster 0) are enriched in bulk RNA-seq
expect functional differences in other areas, such as immune of microdissected tumor samples compared with sam-
regulation. ples from microdissected stroma or nonmalignant control
pancreas (Fig. 5C). Third, we identified large-scale copy-
LRRC15+ CAFs Are Present number variants in cells from cluster 0, but not cells from
in Human PDAC Samples the CAF cluster (Supplementary Fig. S5A).
To translate our findings from mouse models into After confirming the nontumor origin of the popu-
human cancer, we reanalyzed data from a recently pub- lation identified as CAF cells, we specifically focused
lished study of scRNA-seq of human patients with PDAC, on this cluster. Subclustering of the 8,931 fibroblasts
by Peng and colleagues (41). After quality control and fil- revealed three distinct subsets (Supplementary Table S5):
tering, we retained 84,276 cells from 22 patients for down- 52% of cells expressed high levels of the TGFβ c2 CAF
stream analysis. Clustering in dimensionality-reduced markers TAGLN and LRRC15, 3% were strongly enriched
space revealed 12 clusters of 11 main cell types (Fig. 5A; in the IL1 c8 CAF markers HAS1 and CCL2 (Fig. 5D),
Supplementary Table S4). All clusters were comprised of and 44% of cells expressed high levels of C7 and CFD.
cells from more than 8 patients (Fig. 5B). To confirm our LRRC15 was also highly expressed in the bulk RNA-seq
tumor-cell assignment and by extension ensure that our from microdissected stroma compared with tumor or
fibroblast assignment did not include tumor cells that had normal control samples, suggesting that this population
A B
20
# Patients
n = 84,276 cells Cell with detected KRAS mutation z-score
Fibroblasts FXYD3 3
0 AGR2 10
3 5
10 TRAC 1
1 CD3D
Pericytes Endocrine 0
HLA−DRA Cluster 0 1 2 3 4 5 6 7 8 9 10 11
2 C1QA −1
10 z-score
5 Acinar 9 6 3 RGS5
PDGFRB C Tumor Stroma Normal
−2 2
4 PLVAP
UMAP_2
Mac/Mono Ductal 0 PECAM1 FXYD2
0 4 LUM SFRP5
11 5 DCN AMBP
2 Mast FXYD2 CLU
Endothelial Tumor 6 CLU
−5 7 CD79A SLPI
MZB1 FXYD3
8 8 IGHA1 AGR2
7 1 CPA1 TFF1
−10 T cells 9 PNLIP
B cells NEUROD1 COL1A1
B cells 10 LUM
NKX2−2
−15 11
1 TPSB2 DCN
MS4A2 MMP2
−10 0 10 20 Cluster sig. genes 0 5 6
UMAP_1
D z-score E F
microdissected stroma
n = 8,931 cells COL11A1 1 LRRC15 HAS1 10.0
Avg. expression in
0 LRRC15 10 4
6
Log2(CPM+1)
Log2(CPM+1)
2 TAGLN −1 8 7.5
3 C7 3
UMAP_2
1 CFD 6 5.0
0 PTGDS 4 2
1
−3 0 IL6 1 2.5
2 HAS1 2
−6 CCL2 0 0 0.0
−5 0 5 or a l or a l C0 C1 C2
m om ma m om ma
UMAP_1 Tu Str Nor Tu Str Nor Cluster sig genes.
Figure 5. TGFβ-responsive LRRC15+ CAFs are the most frequent fibroblast population in human PDAC. A, Left, UMAP embedding of 84,276 high-
quality cells from 22 patients with PDAC. Clusters identified through graph-based clustering are indicated by color. Cells with identified KRAS single-
nucleotide variations identified from scRNA-seq reads are highlighted in orange. Labels for each cluster were identified by markers on the right. Right,
heat map showing the relative average expression of the most strongly enriched genes for each cluster identified by log fold change of cells within a
cluster to all other cells in the dataset. Two representative genes are highlighted for each cluster. B, Bar plots representing the number of patients that
contributed at least 10 cells to a cluster given in A. C, Relative expression of marker genes for clusters 0, 5, and 6 from A in bulk RNA-seq samples from
microdissected tumor (n = 65), stroma (n = 122), and normal pancreas (n = 247). D, Left, UMAP embedding of 8,931 fibroblast cells. Clusters identified
through graph-based clustering are indicated by color. Right, heat map showing the most strongly enriched genes for each cluster identified by Wilcoxon
rank sum test, all P < 1e-10. Three representative genes are highlighted for each cluster. E, Distribution of LRRC15 (left) and HAS1 (right) expression in
bulk RNA-seq data from 65 tumor, 122 stroma, and 247 normal samples. F, Average expression (± SEM) of signature genes from D in 122 microdissected
PDAC stroma bulk RNA-seq samples. (continued on next page)
FEBRUARY 2020 CANCER DISCOVERY | OF10
Downloaded from cancerdiscovery.aacrjournals.org on February 13, 2021. © 2019 American Association for
Cancer Research.Published OnlineFirst November 7, 2019; DOI: 10.1158/2159-8290.CD-19-0644
RESEARCH ARTICLE Dominguez et al.
G H I z-score Human
−1 0 1 Mouse
Mouse IL1 CAF markers Mouse TGFβ CAF markers
Stromal gate
80
55.7 0
% LRRC15 postive
60 IL1
CAFs
40
Control
LRRC15
20
TGFβ
44.3 0 CAFs
0
EPCAM
HAS2
MAFF
HAS1
CCL2
CXCL1
LIF
IL6
IL1R1
CTHRC1
MMP11
FZD1
INHBA
COL8A1
LRRC15
SDC1
TAGLN
ACTA2
C m+
+
Ep AF
45
ca
C
D
J Human PCC = 0.97 L
TIMP1
COL1A1 COL1A2 All fibroblasts PDPN+FAP+Lum + Dcn + All fibroblasts LUM + DCN +
SPARC DPP4 +
ENG +
PDPN hi PDPN − Not in
COL3A1 Ly6C+ PDGFRa+ PDGFRa− FAP − current
Nonmalignant*
C7
hCluster 1
PDGFRa+ DPP4hi ENG + datasets
PTGDS MHCII+ C7 +
DPT CFD CD74+
Nonmalignant
ntFib1 ntFib2 meso NM Fib meso
Mouse z-score (C3) (C4) (C6)
Norm. Small Large 1
Timp1 ENG+
0 DPP4+/− Both eCAF ENG + CD74 +
Col1a1
Col3a1 Ly6C+ PDGFRa+ C7 + HLA-DRAlo
Early tumor
+
Sparc −1 PDGFRa+ Col1a1 COL1A1 +
msCluster 3 4 0 1 2 8 ENG+/− Col3a1 + COL3A1 +
Timp1 + TIMP1 +
eCAF2 eCAF2 eCAF
K Nonmalig.
(c0) (c1) (c1)
FAP +
Early C1 CAF
40 TGFβ C0 CAF
Ly6C+ LRRC15+ HAS1 + LRRC15 +
IL1 C2 CAF PDGFRa+ IL1 TGFβ PDGFRalo CXCL1 + IL1 TGFβ COL11A +
20
Established tumor
PC_2
ENG+/− Col11a + CCL2 + ACTA2 +
0 Has1+ Acta2 + FAP + FAP +
Cxcl1+ CD74hi IL1 CAF TGFβ CAF CD74hi
IL1 CAF TGFβ CAF
HLA-DRA + HLA-DRA+
−20 (c8) (c2) (C2) (C0)
eCAF 8% eCAF2 25% eCAF 44%
−60 −40 −20 0 20 40 CAF1 12% TGFβ CAF 55% CAF1 3% TGFβ CAF 52%
PC_1
Figure 5. (Continued) G, Representative IHC image from a PDAC patient sample (1 of 70; more images in Supplementary Fig. S5B). Purple, LRRC15
staining; blue, nuclear counterstaining; brown, CD8 staining. Dashed line demarcates tumor islet. Arrowheads, CD8+ T cells. Scale bar, 200 μm. H, Rep-
resentative flow cytometry plots of mesenchymal cells, gated on live EPCAM−, CD45−, CD31− cells from PDAC tissue stained for LRRC15 and EPCAM.
I, Heat map visualizing the relative average expression of mouse IL1 CAF markers and mouse TGFβ CAF markers and their respective homologs in
human across human and mouse IL1 CAFs, human and mouse normal fibroblasts, as well as human and mouse TGFβ CAFs (rows). Rows and columns were
clustered using complete linkage clustering and Euclidean distance as distance measure. Representative genes for each of the two main clusters are
highlighted and represented by their human gene symbol. J, Top, scatter plot comparing the average expression of genes in fibroblast single-cell cluster
5 from normal pancreas (Supplementary Fig. S5D) to the average expression of CAF cluster 1 from D. Bottom, heat map visualizing the relative average
expression of indicated genes (rows) in mouse CAF clusters from Fig. 2B. Columns were clustered using complete linkage clustering and Euclidean
distance as distance measure. K, PCA of normal fibroblasts from Supplementary Fig. 5D in purple and human CAFs colored by clusters from D. Dots
and dashed lines represent the cluster-based minimum spanning tree. L, Schematic representation of mouse and human PDAC fibroblast evolution.
Rectangles demarcate different stages of tumor progression; purple, the nonmalignant stage*; orange, the early stage of tumor development; red, the
established tumor stage. Proteins shown have been validated as markers that identify the respective population; genes that are shown were among the
most significantly enriched for that population. Currently, we cannot identify all populations by protein markers. The pie charts show the frequency of
CAF populations found in late tumors for mouse, and overall in patient PDAC tumor samples based on the scRNA-seq experiments described in
Figs. 2 and 5. *In mice this is the normal tissue baseline; in humans the control tissues come from patients with either duodenal tumors, bile-duct tumors,
or nonmalignant pancreatic tumors that were scored by a pathologist to have “no visible inflammation” (41).
is prominent in PDAC stroma (Fig. 5E). Conversely, we sequencing samples (Fig. 5F). To confirm protein expres-
found HAS1 lowly expressed across tumor, stroma, and sion of LRRC15 in human CAFs, we performed dual IHC on
nonmalignant samples and enriched in only a small frac- tissue from 70 patients with PDAC (Supplementary Table S6)
tion of microdissected stroma samples, likely represent- for LRRC15 and CD8. We found 100% of patients showed
ing only a minor population in PDAC stroma. These LRRC15 staining in nonnormal areas of pancreas and
trends were confirmed when the average expression of LRRC15 appeared fibrillar and was largely excluded from
signature genes for each of the human fibroblast single- tumor islets. Mostly, it was found surrounding them;
cell clusters was compared within the microdissected bulk- additionally, it was frequently seen in proximity to CD8+
OF11 | CANCER DISCOVERY FEBRUARY 2020 AACRJournals.org
Downloaded from cancerdiscovery.aacrjournals.org on February 13, 2021. © 2019 American Association for
Cancer Research.Published OnlineFirst November 7, 2019; DOI: 10.1158/2159-8290.CD-19-0644 Characterization of TGFa-Activated LRRC15+ CAFs in PDAC RESEARCH ARTICLE T cells in the area (Fig. 5G; Supplementary Fig. S5B). An LRRC15+ CAF Signature Can Be Found across Flow cytometry on 4 patient samples further confirmed Several Human Cancer Indications LRRC15 was largely restricted to the EPCAM− CD45− stro- mal gate and marked the majority of CAFs (Fig. 5H). Alto- As it had been previously reported that stromal LRRC15 gether, we find that LRRC15+ TGFβ cluster 0 (hC0) CAFs expression could be observed in several tumor types (38), we are the most prominent fibroblast population in multiple performed a pan-cancer analysis across tumors in The Cancer human PDAC datasets, confirming our findings from the Genome Atlas (TCGA; n = 9,736) and compared these data to mouse model. matched nonmalignant tissues from the GTEx database (n = Although human fibroblast clusters 0 and 2 (hC0 and 8,587). We found that LRRC15 expression was consistently hC2) exhibited overlapping genes of mouse TGFβ c2 and low/absent across normal tissues, but upregulated in a variety IL1 c8 CAFs in a cross-species comparison, respectively of tumors including but not limited to pancreatic, breast, and (Fig. 5I), cluster 1 (hC1) did not obviously match the early head and neck cancers (Fig. 6A). To verify that the LRRC15 CAF populations observed in mouse. Although HC1 was signal was derived from TGFβ-activated CAFs in tumor types characterized by high levels of mouse c4 relative to c3 genes other than PDAC, we first identified a more robust expression (Supplementary Fig. S5C), individual cells did not show signature of TGFβ CAFs from our human PDAC scRNA- a clear phenotype of one or the other population. To test seq analysis. We focused on genes significantly enriched in if, in contrast to mice, human pancreatic fibroblasts are a TGFβ CAFs compared with all other fibroblast populations homogeneous population, we performed in silico isolation that showed no/low expression by any other cell type in the of single fibroblast cells from 11 nonmalignant pancreatic full dataset (Fig. 6B). The gene set was strongly enriched in tissues, published as part of Peng and colleagues (41). microdissected PDAC bulk stroma versus tumor samples Dimensionality reduction with UMAP and clustering in (Fig. 6C), suggesting that their combined signal allows con- reduced space revealed a population of 1,407 fibroblasts clusions about the presence/absence of TGFβ fibroblasts in (DCN, LUM; Supplementary Fig. S5D; Supplementary bulk RNA-seq data. Table S7). Subclustering of these cells identified two clus- To next confirm the presence of this population in other ters, of which the minor one (
Published OnlineFirst November 7, 2019; DOI: 10.1158/2159-8290.CD-19-0644
RESEARCH ARTICLE Dominguez et al.
A LRRC15 expression
B C
Epithelial Stroma
0 1 2 4 6 8 10 All other cells
1.0
Fraction of all other cells
Tumor type Patient number
BLCA (404; 28)
expressing gene
0.8
BRCA (1085; 291) COL12A1
0.6 COL11A1
COAD (275; 349) LRRC15
DLBC (47; 337) 0.4 C1QTNF3
AEBP1
ESCA (182; 286) 0.2 CTHRC1
HNSC (519; 44) THBS2
0.0 COL5A2
LUAD (483; 347) COL10A1
MMP11
COL11A1
CTHRC1
COL12A1
COL10A1
AEBP1
ITGA11
C1QTNF3
COL5A2
GJB2
THBS2
MFAP2
LRRC15
PLAU
(486; 338) ITGA11
LUSC MFAP2
OV (426; 88) MMP11
(179; 171) PLAU
PAAD GJB2
Fibroblasts
READ (92; 318) 0 z-score
SARC (262; 2) 1
(408; 211) 2 −2 2
STAD Cluster
z-score
Cancer (TCGA) Normal (GTEx) −0.5 1
D E
COL1 C13
COHR F3
CTQTNA1
THOL5 0A1
CTQT A1
CO L12A1
TH L5 0A1
C L12A1
COL1 C1
COHRNF
M A1 5
GA 5
2
AEBS2 2
C1 L111
C1 L111
COMP11
11
IT RC 1
1
G 1
IT RC1
AEBSA
A
2
Head and neck cancer TME
CO P1
LR BP
LR BP
MM
15 Myocyte MCAM LRRC15
Macrophage 15 MMP11
10 COL11A1
UMAP_2
C1QTNF3 Cor.
10 5 CTHRC1
B cell 1
0 COL12A1
−5 COL10A1 0
UMAP_2
5 Dendritic
COL5A2
−10 THBS2
LUM COL11A1 Max AEBP1 −1
Endothelial 15
0 LRRC15
10
UMAP_2
Fibroblast 0 ITGA11
Mast 5
T cell PAAD UVM
−5 0
−5
n = 3,363 cells −10
TGFβ CAF expression program
−10 0 10 20 −10 0 10 20
15 15 UMAP_1
BRCA
11 UMAP_1 11 LUAD PAAD
z-score MESO HNSC LUSC
Average expression
10 MMP11 SARC
9 COL11A1 3 10
C1QTNF3 2 READ
STAD
Fibroblasts UCS OV
UMAP_2
CTHRC1 1
5 8 COL12A1 9 BLCA
13 COL10A1 0 CHOL COAD
SKCM ESCA
2 COL5A2
0 GJB2 UCEC CESC
14 1 THBS2 8 GBM
12 7 0 KIRC TGCT
10 AEBP1
4 3 MFAP2 THYM PCPG PRAD DLBC
−5 Myoblasts Pericytes LRRC15 7 THCA
5 UVM
6 PLAU KIRP LIHC
ITGA11
0 2 4 6 8 1012 15 6 LGG ACC KICH
−10 0 10 20
0.2 0.3 0.4 0.5 0.6 0.7 0.8
UMAP_1 Average correlation
Figure 6. Pan-cancer analysis identifies LRRC15+ CAFs as a frequent population across several human tumor types. A, Distribution of LRRC15
expression (Log2 TPM) across indicated cancer types (TCGA, n = 4,848) compared with their host tissues (GTEx, n = 2,810). B, Top, expression of the
14 most significantly enriched (Wilcoxon rank sum test < 1e-285) genes in TGFβ CAF cluster 0 compared with cluster 1 as well as cluster 2 from
Fig. 5D that are expressed by less than 10% of the other cells in the complete PDAC single-cell dataset. Bottom, relative average expression in CAF
clusters from Fig. 5D. C, Relative expression of genes from B in 122 microdissected stroma and 65 microdissected tumor samples. D, Top left, UMAP
embedding of 3,363 nonmalignant cells from 18 HNSCC biopsies. Cell-type assignments provided by the authors are indicated by color. Top right,
UMAP reduction as on the left, colored by expression [Log(CPM/10+1)] of indicated genes. Bottom left, UMAP as on top, clusters identified through
graph-based clustering are indicated by color. Bottom right, heat map visualizing the relative average expression of indicated genes (rows) in clusters
given on the bottom left. E, Top, gene-by-gene correlation matrix visualizing the pairwise Spearman correlation coefficients in bulk RNA-seq TCGA data
from patients with pancreatic cancer (left, n = 178) and uveal melanoma (right, n = 80). Bottom, scatter plot comparing the average pairwise correla-
tions (x-axis) and average expression (y-axis) of genes from given on top across 31 cancer indication from TCGA (total of 9,712 samples from primary
tumors; regression line in blue).
lung cancer (LUSC, LUAD), ovarian cancer (OV), colon can- An LRRC15+ CAF Signature Predicts Poor Clinical
cer (COAD), renal cancer (READ), esophageal cancer (ESCA), Response to Checkpoint Blockade
stomach adenocarcinoma (STAD), and bladder cancer (BLCA; Having shown that Lrrc15+ CAFs are present in human
Supplementary Fig. S6B), as well as HNSCC. In summary, cancers, we next sought to test the clinical impact of this
these data suggest that LRRC15+ CAFs are a prominent popu- population. Because of the known roles of TGFβ in modu-
lation across multiple human cancer types that emerges from lating immunotherapy (32, 44), we evaluated the clinical sig-
an LRRC15− fibroblast population. nificance of the newly identified LRRC15+ CAFs in response
OF13 | CANCER DISCOVERY FEBRUARY 2020 AACRJournals.org
Downloaded from cancerdiscovery.aacrjournals.org on February 13, 2021. © 2019 American Association for
Cancer Research.Published OnlineFirst November 7, 2019; DOI: 10.1158/2159-8290.CD-19-0644
Characterization of TGFa-Activated LRRC15+ CAFs in PDAC RESEARCH ARTICLE
A Excluded Inflamed Desert B IMvigor210 trial-excluded tumors C
*** N.S. N.S. TGFβ CAF
1.00 0.8
Pairwise correlation
2 High: n = 67
Survival probability
TGFβ CAF score
0.75 Low: n = 67
P < 0.001 0.4
1 HR = 2.3
0.50
0.0
0
0.25
−0.4
−1 0.00 TGFβ F-TBRS
# Patients (28) (85) (19) (43) (14)(55) 0 5 10 15 20 25 CAF
Follow-up time (months)
CR/PR SD/PD High levels Low levels
D E PCD trial
IMvigor210 trial-excluded tumors
TGFβ CAF
1.00 F-TBRS 1.00
High: n = 67 Low: n = 64
High: n = 64
Survival probability
Survival probability
Low: n = 67
0.75 P = 0.017 0.75 P = 0.01
HR = 1.7 HR = 1.9
0.50 0.50
0.25 0.25
0.00
0.00
0 5 10 15 20 25 0 10 20 30 40 50
Follow-up time (months) Follow-up time (months)
Figure 7. LRRC15 expression and its transcriptional signature predicts response to immunotherapy. A, Box plots comparing the distribution of the
TGFβ CAF (top) in excluded, inflamed, and immune-desert tumors from IMvigor210 between responders and nonresponders. ***, P < 0.001, two-sided t
test; CR, complete response; PR, partial response; SD, stable disease; PD, progressive disease. B, Kaplan–Meier survival plot comparing survival probabil-
ity (y-axis) and follow-up time for 134 patients with locally advanced or metastatic urothelial carcinoma (IMvigor210) receiving atezolizumab treatment,
restricted to tumors with immune-excluded phenotype. Groups were split by high (red) or low (green) levels of TGFβ CAF marker gene signature
expression (median cutoff). C, Box plots comparing the distributions of pairwise correlations of genes from the TGFβ CAF and the F-TBRS signature in
IMvigor210 bulk RNA-seq data. D, Survival plot as in B, but here with a score based on the F-TBRS signature genes. E, Kaplan–Meier survival plot compar-
ing survival probability (y-axis) and follow-up time for 128 patients from the PCD trial receiving atezolizumab treatment. Groups were split by high (red)
or low (green) levels of TGFβ CAF marker gene signature expression (>upper vs. 1.5) was apparent
Fig. S7B). This effect is explained by the increased expression across several individual cancer indications, despite their
of the signature in patients who fail to respond to anti–PD-L1 small individual sample sizes (Supplementary Fig. S7E). It
therapy exclusively in immune-excluded tumors, but not in remains unclear what the nature of LRRC15+ CAF immuno-
tumors with inflamed or immune-desert phenotype (Fig. 7A). suppression might be, but these data provide a strong basis
Consequently, we observe a significant association of the to further elucidate the functions of these cells. The correla-
LRRC15+ CAF signature with worse outcome specifically in tion between LRRC15+ CAFs and poor outcome in immuno-
patients with immune-excluded tumors (P < 0.001, HR = 2.3; therapy treatment suggests that multiple tumor indications
Fig. 7B). Our result represents an improvement over the fibro- may benefit from LRRC15+ CAF reprogramming combined
blast TGFβ response signature obtained through in vitro with immunotherapy.
FEBRUARY 2020 CANCER DISCOVERY | OF14
Downloaded from cancerdiscovery.aacrjournals.org on February 13, 2021. © 2019 American Association for
Cancer Research.You can also read