Modular Micro-Physiological Human Tumor/Tissue Models Based on Decellularized Tissue for Improved Preclinical Testing
←
→
Page content transcription
If your browser does not render page correctly, please read the page content below
Research Article
Modular Micro-Physiological Human
Tumor/Tissue Models Based on Decellularized
Tissue for Improved Preclinical Testing
Johanna Kühnemundt 1,#, Heidi Leifeld 1,#, Florian Scherg 1,#, Matthias Schmitt 1,#, Lena C. Nelke 1,
Tina Schmitt 1, Florentin Baur 1,2, Claudia Göttlich 1,2, Maximilian Fuchs 3, Meik Kunz 3,4, Matthias Peindl 1,
Caroline Brähler 1, Corinna Kronenthaler 1, Jörg Wischhusen 5, Martina Prelog 6, Heike Walles 1,2,7,
Thomas Dandekar 3, Gudrun Dandekar 1,2,§ and Sarah L. Nietzer 1,2,§
1Department Tissue Engineering and Regenerative Medicine, University Hospital Würzburg, Würzburg, Germany; 2Translational Center Regenerative
Therapies, Fraunhofer Institute for Silicate Research ISC, Würzburg, Germany; 3Bioinformatics, Biocenter, University of Würzburg, Würzburg, Germany;
4Chair of Medical Informatics, Friedrich-Alexander University (FAU) of Erlangen-Nürnberg, Erlangen, Germany; 5University Hospital Würzburg,
Department for Obstetrics & Gynecology, Section for Experimental Tumor Immunology, University of Würzburg, Würzburg, Germany; 6Children’s
University Hospital, Pediatric Rheumatology/Special Immunology, University of Würzburg, Würzburg, Germany; 7FVST, Core Facility Tissue
Engineering, Otto-von Guericke University, Magdeburg, Germany

       Abstract
       High attrition rates associated with drug testing in 2D cell culture and animal models stress the need for improved mod-
       eling of human tumor tissues. In previous studies, our 3D models on a decellularized tissue matrix have shown better
       predictivity and higher chemoresistance. A single porcine intestine yields material for 150 3D models of breast, lung, col-
       orectal cancer (CRC) or leukemia. The uniquely preserved structure of the basement membrane enables physiological
       anchorage of endothelial cells and epithelial-derived carcinoma cells. The matrix provides different niches for cell growth:
       on top as monolayer, in crypts as aggregates, and within deeper layers. Dynamic culture in bioreactors enhances cell
       growth. Comparing gene expression between 2D and 3D cultures, we observed changes related to proliferation, apop-
       tosis and stemness. For drug target predictions, we utilize tumor-specific sequencing data in our in silico model, finding an
       additive effect of metformin and gefitinib treatment for lung cancer in silico, validated in vitro. To analyze mode-of-action,
       immune therapies such as trispecific T-cell engagers in leukemia or toxicity on non-cancer cells, the model can be modu-
       larly enriched with human endothelial cells (hECs), immune cells and fibroblasts. Upon addition of hECs, transmigration of
       immune cells through the endothelial barrier can be investigated. In an allogenic CRC model, we observe a lower basic
       apoptosis rate after applying PBMCs in 3D compared to 2D, which offers new options to mirror antigen-specific immu-
       notherapies in vitro. In conclusion, we present modular human 3D tumor models with tissue-like features for preclinical
       testing to reduce animal experiments.

1 Introduction                                                              of preclinical models fail to predict efficacy in patients. The need
                                                                            for improvements in this area is thus obvious (Arrowsmith and
1.1 Preclinical test systems in oncology                                    Miller, 2013). Improved in vitro models could drastically reduce
Preclinical models in oncology still rely mostly on two-dimen-              the number of animals used for basic, preclinical as well as trans-
sional (2D) culture and on animal experiments. Translatability of           lational research. Of a total of about 9.6 million animals used in
such results into the clinic is, however, limited (Bhattacharjee,           basic (45%) and translational/applied research (23%) in the EU
2012). About 30% of failures in cancer-related drug testing are             in 2017, cancer was the third-leading or even the most common
related to safety and toxicity issues. In addition, more than 50%           field of application, respectively (EC, 2020).

# contributed equally; § shared senior authors

Received August 14, 2020; Accepted December 9, 2020;                        This is an Open Access article distributed under the terms of the Creative Commons
Epub December 11, 2020; © The Authors, 2021.                                Attribution 4.0 International license (http://creativecommons.org/licenses/by/4.0/),
                                                                            which permits unrestricted use, distribution and reproduction in any medium, provi-
ALTEX 38(2), 289-306. doi:10.14573/altex.2008141                            ded the original work is appropriately cited.
Correspondence: Sarah L. Nietzer, PhD
Department Tissue Engineering and Regenerative Medicine
University Hospital Würzburg
Röntgenring 11, 97070 Würzburg, Germany
(sarah.nietzer@uni-wuerzburg.de)

ALTEX 38(2), 2021                                                                                                                                          289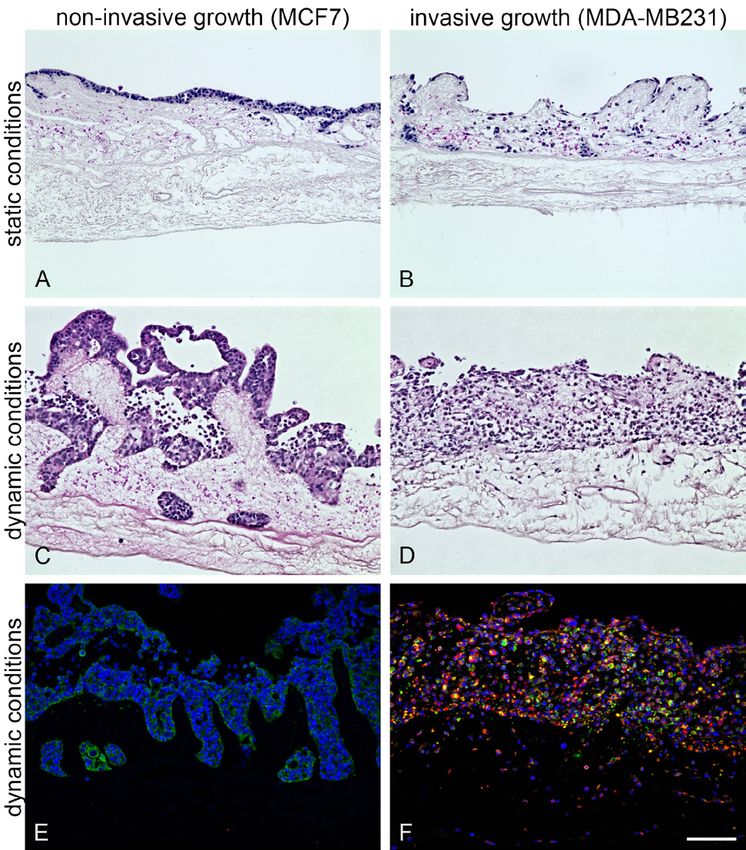
Kühnemundt et al.

   Innovative three-dimensional (3D) approaches reflecting rele-       Medicine (Jannasch et al., 2015; Linke et al., 2007; Schanz et al.,
vant aspects of the in vivo situation reach from transwell cultures,   2010) (Ref, DE 30 2014 008, Int.: 1 255 634, US: 79168704)),
spheroids, synthetic or biological matrices, 3D printed models         which is derived from an intestinal porcine tissue matrix. When
and organoids to whole organ-on-a-chip models (Albritton and           seeded with tumor cells, it is referred to as OncoVaSc-TERM®.
Miller, 2017; Katt et al., 2016; Nath and Devi, 2016; Santo et         The BioVaSc-TERM® -technology and its derivatives are already
al., 2017; van Duinen et al., 2015; Weeber et al., 2017; Xu et         being used for vascularized skin equivalents as well as for intes-
al., 2014). As so far no “magic bullet” exists for all cancer types,   tinal and airway models (Groeber et al., 2016; Schweinlin et al.,
stages and patients, no single test system can be expected to meet     2017). As the decellularized and sterilized intestine of one single
the testing requirements of all different therapeutic approaches.      pig is sufficient to generate about 150 3D tumor models, the ap-
Depending on the respective questions and the therapeutic strat-       proach minimizes the use of animals for research.
egies to be assessed, the required test systems have to be specifi-       The extremely versatile biological matrix “Small Intestinal
cally adapted. More advanced therapeutic options, including tar-       Submucosa with mucosa” (SISmuc) is produced by removing
geted and immune therapies and their combinations with more            all vessel structures and offers different tissue niches: i) on the
conventional chemotherapeutics or radiation approaches, require        surface of villi, ii) within former crypts, and iii) within deeper
suitable complex models. Optimized in vitro models could also          layers of the collagen matrix. As a unique feature of the matrix,
reduce the large number of animals required to analyze different       structures of the basement membrane are preserved after decel-
combinations of compounds.                                             lularization, which enables physiological anchorage-dependent
   There are, however, defined features that are commonly ad-          growth of epithelial cells (Stratmann et al., 2014). Furthermore,
vantageous for reliable models. A fully human setting avoids ex-       this structure enables the testing of substances that are intended
trapolations across species boundaries. A gradual 3D growth of         to eliminate invasive tumor cells once they cross this natural bor-
cancer cells is more likely to result in structures similar to those   der. Early steps in metastasis formation can also be studied in or-
found in tumors in vivo. Due to their unphysiologically high pro-      der to understand underlying mechanisms and to identify possi-
liferation index (often 80 to 90%), 2D models generally lead to        ble points of action. Our matrix-based lung cancer models were
an overestimation of cytostatic effects (Cree et al., 2010). Gen-      already shown to accurately reflect drug responses upon targeted
eral tissue architecture, which includes response-modulating ac-       therapies observed in the clinic – not just better than 2D, but part-
cessory cells as found in the tumor microenvironment, can only         ly also more reliably than animal models (Göttlich et al., 2018;
be replicated in complex 3D models. Moreover, a loss of tumor          Stratmann et al., 2014).
stroma over time, which is frequently observed in transplantable
in vivo tumor models as well as in organoids (Yada et al., 2018;       1.3 Applications of 3D tumor tissue models
Kim et al., 2019), may render these test systems insensitive to        Building on these previous findings, we now characterized our
important contributions from the stromal compartment. Seri-            modular micro-physiological 3D tissue models using microar-
ous limitations also apply for the testing of immunotherapeutic        rays and immunohistochemical staining for stem cell markers
agents in humanized animal models: Apart from the enormous             to analyze differences between 2D and 3D conditions in more
cost and effort, species-specific differences of cytokines typi-       detail. Supported by in silico analyses, our 3D test system of-
cally result in an impaired maturation and differentiation of cer-     fers a time-efficient way to test effects of drug combinations on
tain human immune cell subsets in a murine microenvironment            complex tissues, to analyze effects on signaling pathways, and
(Rongvaux et al., 2013, 2014; Song et al., 2019; Walsh et al.,         to identify interdependencies. As an example, we present a new
2017; Anselmi et al., 2020).                                           combination therapy for lung cancer treatment combining met-
   Being able to monitor immune-mediated tumor control in a            formin and gefitinib. Our 3D tissue culture test system not only
predictive, fully human in vitro system will thus significantly ad-    validates the prediction. It also allows functional tests to identify
vance preclinical research.                                            requirements for a synergistic response.
                                                                          The modular approach further enables the addition of hECs to
1.2 3D tumor tissue models                                             3D tissue models. These hECs were seeded onto the former sero-
The present study aims to establish high-output modular 3D tis-        sal side of the decellularized intestine so that toxic effects on the
sue drug test systems that model tissue niches sufficiently well to    vasculature and the diapedesis behavior of immune cells can be
enable a reliable testing of drug responses. While investigations      addressed. To include the stromal compartment, we established
of homophilic cell-cell-interactions, cell migration, invasion, and    different co-culture models with primary fibroblasts and found
changes of signaling pathways may also yield reasonably reli-          that dynamic cell culture within flow bioreactors overcomes
able results in 2D tumor cell culture models, interactions of tu-      problems with poor stroma development in vitro (Nietzer et al.,
mor cells with different other cell types such as fibroblasts, hECs    2016). In the context of immune therapeutic approaches, we ob-
and immune cells are challenging to explore in such 2D systems.        served an enhanced efficacy compared to 2D culture of MHCI
  In this study we present modular human 3D tumor models for           independently acting trispecific T-cell engagers in a 3D leuke-
lung, colorectal, and breast cancer as well as leukemia. Their         mia model with artificial endothelium. Moreover, CRC 3D mod-
complexity can be adapted according to the therapeutic question.       els show a drastically reduced induction of tumor cell apopto-
All models are based on the patented BioVaSc-TERM® (Biolog-            sis by allogeneic peripheral blood mononuclear cells (PBMCs)
ical Vascularized Scaffold – Tissue Engineering Regenerative           in monocultures and also in fibroblast-enriched co-culture mod-

290                                                                                                                         ALTEX 38(2), 2021
Kühnemundt et al.

els. This indicates that complex 3D models with allogeneic cells     DMEM with GlutaMAX™ (Gibco/Life Technologies, USA) sup-
offer a therapeutic window for testing antigen-independent im-       plemented with 10% FCS and 100 mM sodium pyruvate. Primary
mune-stimulatory or ‑inhibitory agents.                              microvascular hECs were isolated from the dermis of foreskin bi-
  These promising advantages of our modular 3D culture ap-           opsies and cultured in VascuLife Media (Lifeline Cell Technology,
proach should reduce attrition rates and save animal experiments     USA). Endothelial cell cultures were morphologically confirmed
on account of its more physiologic tissue features, which are ex-    to contain no fibroblasts after isolation from a skin biopsy. If fi-
amined in detail in the following.                                   broblasts were found in the cultures, cells were sorted using mag-
                                                                     netic associated cell sorting beads directed against the endotheli-
                                                                     al marker CD31 (Miltenyi, Germany). Fibroblasts and hECs were
2 Animals, materials and methods                                     cultured in the presence of 1% penicillin/streptomycin (P/S) after
                                                                     isolation until the first passaging was performed. PBMC for trispe-
Animals                                                              cific antibody treatment (delivered by PD G. Stuhler, HLA-A2
The matrices SISmuc and SISser (used for the leukemia mod-           negative, CMV positive) were frozen at -80°C and thawed over-
el with an endothelial barrier) were prepared from porcine jeju-     night prior to use in RPMI with 10% FCS and 1% P/S. PBMC
nal segments of young pigs (German landrace, local supplier).        were generated from buffy coats via Ficoll gradient isolation and
The animals used for organ removal were not bred specifical-         cultured in RPMI 1640 medium with GlutaMAX™ (Gibco/Life
ly for research purposes but obtained from a local supplier who      Technologies, USA) with 10% FCS.
breeds animals for food production. SISmuc consists of small in-        We applied the culture conditions recommended by the sup-
testine submucosa (SIS) and mucosa (muc). SISser consists of         plier to the respective cell lines and used the lowest quantity of
SIS and serosa (ser). All explantations were in compliance with      FCS that is feasible for the different cell types to reduce FCS
the German Animal Protection Laws (§4 Abs. 3), and all an-           consumption. So far, the used cells did not grow with defined
imals received humane care in compliance with the guidelines         FCS-free media. In case of co-culture models, equal parts of
of the FELASA, WHO and FDA (WHO-TRS978 Annex3 und                    cell-specific media were mixed. Cell lines were used in passag-
FDA-OCTGT Preclinical Guidance) after approval by our insti-         es up to 20, while primary cells were only used until passage 6.
tutional animal protection board (registration reference number      Tumor cell lines were passaged twice a week, and medium was
#2532-2-12, Ethics Committee of the District of Unterfranken,        changed every 2 to 3 days. Cells were checked for mycoplasma
Würzburg, Germany). Pigs were anesthetized and then eutha-           contaminations every 8 to 10 weeks by PCR (Minerva Biolabs,
nized prior to surgery, therefore not suffering from pain or dis-    Germany).
tress. To keep the number of sacrificed animals low, many differ-
ent organs were removed for various research projects.               Preparation of tumor models
                                                                     Single pieces of SISmuc or SISser matrix were fixed between two
Matrix preparation                                                   metal rings (cell crowns) and seeded with 100,000 tumor cells on
Chemical decellularization of jejunal segments was performed         the mucosal side or with 300,000 hECs on the submucosal side.
according to standardized protocols (Jannasch et al., 2015; Lin-     To create a tight endothelial barrier, hECs were seeded 3 to 5 days
ke et al., 2007; Schanz et al., 2010). The jejunum was explanted,    prior to seeding with tumor cells. Tumor models were placed in
rinsed and chemically decellularized with a sodium deoxycholate      12-well plates with 1 mL medium in the inner compartment and
monohydrate solution. Afterwards the vascular tree was manual-       1.5 mL in the outer compartment of the cell crown. For static cell
ly removed, and the product was sterilized (γ-sterilization).        culture, the models were cultured for 11 days before treatment
                                                                     with the test substance. During static cell culture, medium was
Primary cells and cell lines                                         changed every 2 to 3 days. For dynamic culture, the models were
Primary human cells were obtained with informed consent ac-          placed in bioreactor chambers after 3 days of static pre-culture.
cording to ethical approval granted by the Institutional Ethics      The customized bioreactors used, described in (Nietzer et al.,
Committee of the University Hospital Würzburg (approval num-         2016), were connected to a peristaltic pump and a medium reser-
ber 182/10).                                                         voir containing 45 mL cell-specific medium. The pump ensured a
  All cells were cultured under standard culture conditions (37°C,   constant medium flow of 3-4 mL/min, avoiding additional sheer
5% CO2 ). We used HROC24 and HROC87 cells (kindly provid-            stress to the cells. After 14 days of dynamic culture, the models
ed by Dr Michael Linnebacher, University Hospital Rostock)           were treated for 3-5 days with the test substance. During dynamic
(Mullins et al., 2019) cultured in DMEM/F12 medium with Glu-         cell culture, medium was changed every 7 days. All test substanc-
taMAX™ (Gibco/Life Technologies, USA) supplemented with              es were administered via the cell culture medium.
10% FCS. HCC827, MCF7 (both purchased from DSMZ), MDA-
MB-231 cells (purchased from ATCC), THP-1 (purchased from            Treatment of cells in 2D and 3D
DSMZ) and SW480 (purchased from DSMZ) were cultured in RP-           For 2D cell culture, cells were cultured in 12-well plates. Tipi-
MI 1640 medium with GlutaMAX™ (Gibco/Life Technologies,              farnib (Selleck Chemicals, USA) in DMSO was applied in dif-
USA) supplemented with 10% FCS, except for HCC827 cells,             ferent concentrations to the cell culture medium for 5 days with a
which were cultured with 20% FCS. Human dermal fibroblasts           medium change on the third day. For 3D cell culture, hECs were
were isolated from the dermis of foreskin biopsies and cultured in   seeded on SISser and cultured for 14 days prior to adding THP-

ALTEX 38(2), 2021                                                                                                                    291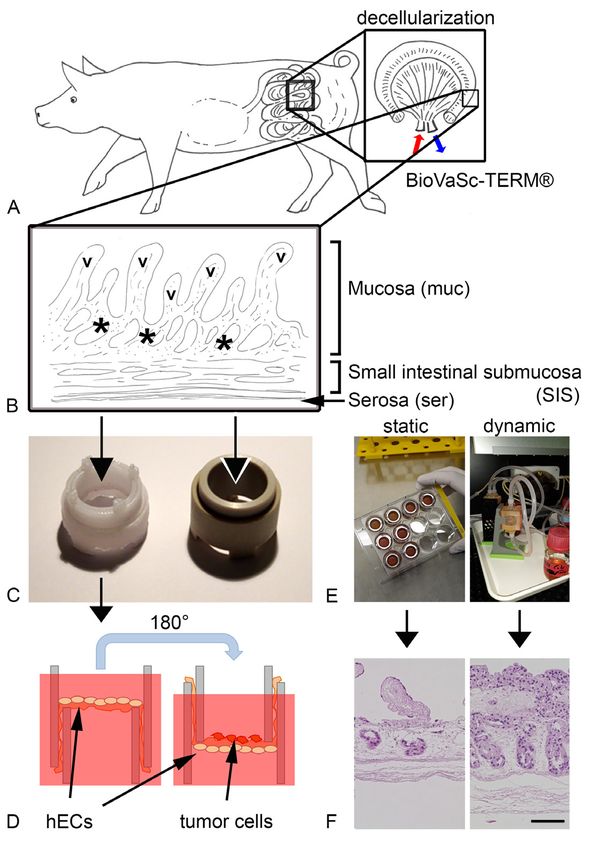
Kühnemundt et al.

1 cells to the medium on day 14, with or without tipifarnib, and     9000, Keyence, Japan). DAPI was counted automatically using
cultured for the next 5 days (with a complete medium change          the software BZ Analyzer (Keyence, Japan) to determine the to-
on day 17). In case of the trispecific antibody treatment (AB1:      tal cell number. Ki-67-positive cells were counted manually. For
VLαCD3-scFvαHLA-A2; AB2: VHαCD3-scFvαCD45; antibod-                  each image, the number of Ki-67-positive cells in percent of to-
ies provided by PD G. Stuhler), antibody 1 and/or 2 (each 30 nM)     tal cell number was calculated, and the mean of each sample was
and 200,000 PBMC as apoptosis inductors in THP-1 cells via           used for statistical analysis.
trispecific antibodies were added to 200,000 THP-1 cells in each
well of the 12-well plate (in Vasculife® medium with 1% P/S)         Statistical analysis
and incubated for 24 h. The setting in the 3D model was the same     All pairwise comparisons were assessed using a Student’s t-test
as in the 2D model with the difference that, where indicated, the    for unpaired samples. Results were corrected for multiple testing
cell + DMSO/trispecific antibodies mixture was added to each         using Bonferroni’s adjustment. P values < 0.05 were considered
cell crown onto the surface of the 3D endothelial monolayer.         significant. Presentation of the flow cytometry data in the coordi-
Treatment with 10 mM metformin (Merck, Germany) and 1 µM             nate system was realized by SigmaPlot Version 10.0 (Systat Soft-
gefitinib (Absource Diagnostics, Germany) of 3D models started       ware, Inc.). M30 and Ki-67 quantifications were analyzed and
on day 11 for 3 days until day 14 of 3D cell culture.                presented with R1.

Flow cytometry                                                       Histological and immunohistochemical staining
Cells in the supernatant were resuspended and transferred to a re-   As an endpoint measurement, the tumor models were fixed in
action tube. For cell death quantification, cells were centrifuged   a 4% paraformaldehyde solution for 2 h, embedded in paraffin,
(4°C, 300 x g, 5 min) and washed in sterile PBS with 0.5% BSA.       and cut in a microtome at 3-5 µm. Hematoxylin and eosin (H&E)
Cells were resuspended in 500 µL PBS with 0.5% BSA, and 5 µL         staining (Morphisto, Germany) was performed according to the
7-aminoactinomycin D (7-AAD) (Biozol, Germany) was added             manufacturer’s protocol. Non-immunofluorescent immunohisto-
per sample. 7-AAD intercalates into the DNA and is used to dis-      chemical staining was performed using the 3,3’-diaminobenzi-
tinguish apoptotic cells (7-AAD+) from viable cells (7-AAD-).        dine (DAB) system (DCS Innovative Diagnostik-Systeme, Ger-
After incubation in the dark on ice for 10 min, FACS measure-        many) according to the manufacturer’s protocol. Here, DAB is
ments were performed (FACSCalibur, BD, Germany). Data anal-          oxidized in the presence of a horseradish-peroxidase and hydro-
ysis was performed with the software FlowJo 6.0. For treatment       gen peroxide, resulting in the formation of a brown dye at areas
with trispecific antibodies, we confirmed that the primary hECs      of antibody binding.
we used for the model reacted with the anti-HLA-A2 antibody             The following primary antibodies were used: rabbit anti-CD44
(BD Pharmingen, Germany) in flow cytometry prior to reseed-          (Abcam, Cat# ab51037, RRID: AB_868936), mouse anti-CD133
ing the scaffold.                                                    (R&D systems, Cat# MAB 4399 RRID: AB_2100194), mouse
                                                                     anti-CD166 (Abcam, Cat# ab49496, RRID: AB_868825),
TUNEL Assay                                                          mouse anti-EpCAM (Abcam, Cat# ab8601, RRID:AB_306663).
To detect DNA damage in hECs, the in situ Cell Death Detection       For immunofluorescent staining, primary antibodies were used
Kit, POD (Roche, Switzerland) was used according to the manu-        against Col IV (Abcam Cat# ab6586, RRID: AB_305584),
facturer’s instructions. Staining was visualized using a BZ-9000     vimentin (Abcam Cat# ab92547, RRID: AB_10562134), Ki-67
microscope (Keyence, Japan).                                         (Abcam Cat# ab16667, RRID: AB_302459), CD45 (Dako Cat#
                                                                     M0701, RRID: AB_2314143) and pan-cytokeratin (Sigma-
Apoptosis measurements using M30 ELISA                               Aldrich Cat# C2562, RRID: AB_476839; this antibody was the
For quantification of epithelial apoptosis, the M30 CytoDeath™       only one derived from ascites fluid).
(PEVIVA®, TECOmedical, Germany) assay was used to mea-                  Primary antibodies were diluted 1:100 in antibody diluent
sure the caspase 9-cleaved product of cytokeratin 18 in the cell     (DCS Innovative Diagnostik-Systeme, Germany) and incu-
culture supernatant every 24 h during treatment. This neo-epi-       bated over night at 4°C. As secondary antibodies, donkey an-
tope is specifically expressed by apoptotic epithelial cells. The    ti-mouse IgG (Thermo Fisher Scientific Cat# A-31571, RRID:
M30 CytoDeath™ assay was performed according to the manu-            AB_162542) conjugated to Alexa-647 or donkey anti-rabbit IgG
facturer’s protocol. Supernatants of static cell cultures were ob-   (Thermo Fisher Scientific Cat# A-31572, RRID: AB_162543)
tained from the inside of the cell crowns. Supernatants of dynam-    conjugated to Alexa-555 were diluted 1:400 in antibody dilu-
ic cell cultures were obtained via a sampling port integrated into   ent and incubated for 1 hour at room temperature (RT). Cell nu-
the tubing of a flow bioreactor.                                     clei were counterstained using 4′,6-diamidino-2-phenylindole
                                                                     (DAPI), which binds to DNA. DAPI was diluted in the embed-
Quantification of proliferation                                      ding medium Fluoromount-G (Thermofisher Scientific, USA).
Ki-67 staining was quantified as follows: At least 6 images of       Images were taken using a digital microscope (BZ-9000, Key-
each sample were taken with a fluorescence microscope (BZ-           ence, Japan).

1 https://cran.r-project.org/

292                                                                                                                     ALTEX 38(2), 2021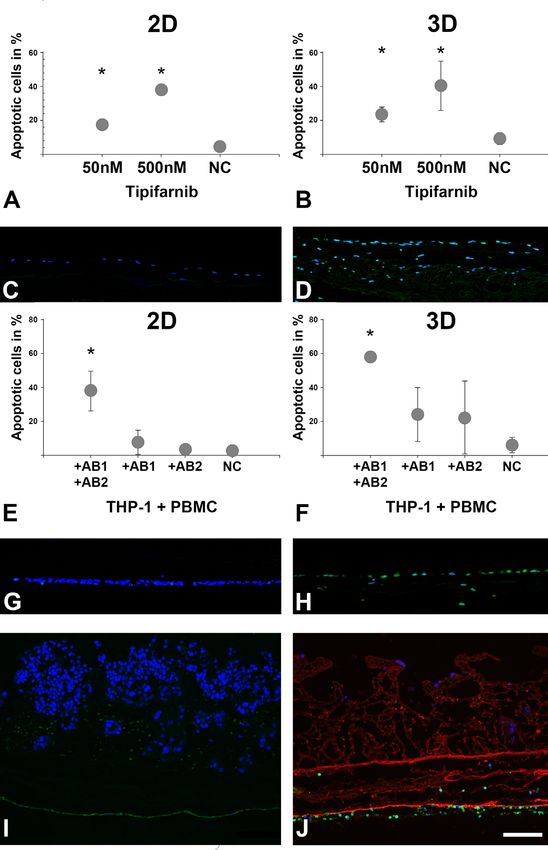
Kühnemundt et al.

Ultrastructural analysis                                              network reconstruction was combined with dynamic simula-
Samples were washed with pre-warmed PBS with calcium and              tions of cellular pathways: First, the network topology was cre-
magnesium, and cell-free edges were removed with a scalpel pri-       ated and edited in CellDesigner (version 3.5.1) (Matsuoka et al.,
or to fixation in a 6.25% or 2.5% solution of glutaraldehyde over-    2014) and exported as xml-file. Importantly, the Boolean logic of
night at 4°C. Further sample preparation was performed at the         the network was considered, i.e., activating and inhibitory inter-
Imaging Core Facility, Biocenter, University of Würzburg. For         actions between receptors, proteins and protein cascades. Mod-
ultrastructural analysis of the unseeded scaffold as well as the      ifying crosstalk was also implemented. Next, dynamic simula-
3D tumor models, scanning (SEM) electron microscopy images            tions were conducted applying the SQUAD tool (Di Cara et al.,
were also taken at the Imaging Core Facility, Biocenter, Univer-      2007). SQUAD reads the topology of the network using the xml
sity of Würzburg. To analyze changes in scaffold structure after      file generated from CellDesigner. The ON- and OFF-states of the
cell culture, the tumor models were decellularized after 14 days      network were also considered for dynamic modeling. SQUAD
of cell culture. To this aim, the samples were incubated twice in     automatically interpolates between the different network states
sodium deoxycholate (1 h at RT), washed twice for 10 min in           using exponential functions. To model signal propagation in the
PBS, incubated in DNase I solution for 2 h at 37°C and rinsed in      network, SQUAD further considers the Boolean network topolo-
PBS prior to fixation.                                                gy, concatenating the exponential functions accordingly. The tra-
                                                                      jectories of full or partial activation down to no inhibition were
Microarray data                                                       calculated for the whole network and for all included proteins.
For RNA isolation with the RNeasy Micro Kit (Qiagen, Germany)         Different mutational profiles and treatment were integrated into
from cells in 3D experiments, frozen SISmuc stored at -80°C was       the dynamic simulation via the SQUAD perturbation function.
used. Isolation was carried out according to the manufacturer’s       Protocols were saved in prt file format. Outcomes were assessed
protocol. While still frozen, tissue was cut into small pieces with   by readouts proliferation and apoptosis as basic markers and con-
a scalpel and transferred into 350 µL Buffer RLT in a 2 mL reac-      sidering all available data (in particular phosphorylation status of
tion tube. Heat-sterilized steel beads were added to the tubes, and   involved proteins and protein cascades).
the tissue was lysed at 50 Hz for 5 min with a tissue lyser device.      Module omics data analysis: Data from microarray experi-
Samples were centrifuged at full speed for 3 min, and supernatants    ments was preprocessed in the R v3.2.1 environment with Bio-
were transferred to a new 1.5 mL tube. One volume of RNAse-           conductor packages affy and vsn; VSN normalization and RMA
free 70% ethanol was added, and samples were mixed by pipetting.      probeset summary were performed with the vsnrma command
Following transfer, complete contents were centrifuged in RNeasy      using default parameter settings. Fold change values of treated
MinElute spin columns for 15 s at 8,000 x g. Further steps were       (test dataset) vs untreated (reference dataset) were calculated and
carried out according to the manufacturer’s protocol.                 log2-transformed for 2D and 3D samples individually. Cut-off
   Isolation of RNA from cells from 2D experiments was done           values for significance were set to ± 1.0 log2 fold change. Gene
according to the RNeasy Mini Kit protocol. RNA concentrations         transcripts that showed differential expression upon treatment in
were determined by absorbance measurements at 260 and 280 nm          HCC827 but not in A549 cells were selected for further analy-
using the NanoQuant Plate for the Infinite M200 plate reader          sis. Differentially expressed genes (DEGS) that showed up- or
(Tecan, Switzerland). Quality control of RNA samples using            downregulation in HCC827 in 3D but not in 2D in response to
the Agilent 2100 Bioanalyzer and related reagents as well as all      gefitinib were clustered into gene lists, respectively. The func-
microarray experiments and data analysis were performed by            tional enrichment analysis using the DEGS was performed using
Claus-Jürgen Scholz and colleagues from the Core Unit Systems         g:Profiler web tool (Raudvere et al., 2019), and relevant enriched
Medicine at the Interdisciplinary Centre for Clinical Research        terms (adj. p value < 0.05) were shown as table and plotted us-
(IZKF), University of Würzburg. In brief, 100 ng of RNA was first     ing ggplot2 package version 3.3.2 (Wickham, 2009) in R version
reverse-transcribed to cDNA, before cDNA was re-transcribed in-       4.0.2 (according to (Fuchs et al., 2020)).
to labeled cRNA using the Affymetrix IVT Plus Kit. Subsequent-
ly, 130 µL hybridization mix prepared from labeled cRNA frag-
ments was hybridized for 16 h at 45°C and 60 rpm to GeneChip          3 Results
PrimeView arrays. Microarrays were washed and stained in the
Affymetrix Fluidics Station 450. Microarrays were scanned using       3.1 Generation of micro-physiological human
a GeneChip Scanner 3000 7G (Affymetrix, USA). The data were           tumor models on a porcine tissue matrix
deposited with GEO database under accession number GSE79078.          In order to generate human tumor models representing the in vivo
                                                                      situation more closely than 2D cell cultures or simple spher-
Bioinformatics and in silico modeling                                 oids, we used pieces of the porcine intestinal jejunum deriving
Module 3D tissue simulations: Signaling network reconstruction        from the BioVaSc-TERM®. These comprise an intestinal loop
was based on available literature and on biochemical and human        (Fig. 1A) with an arterial entrance (red arrow) and a venous out-
interactome database sources such as KEGG and IMEx. To mod-           ward flow (blue arrow) and enable reseeding of the whole vas-
el individual drug actions as well as effects of combinations, dy-    cular tree with hECs. For the 3D tumor tissue models, only the
namic simulations of cellular pathways also considered known          former gut wall without the vessel system is used after decellu-
impacts of different drugs. For data-driven modeling, signaling       larization. The porcine matrix consists of three different main

ALTEX 38(2), 2021                                                                                                                     293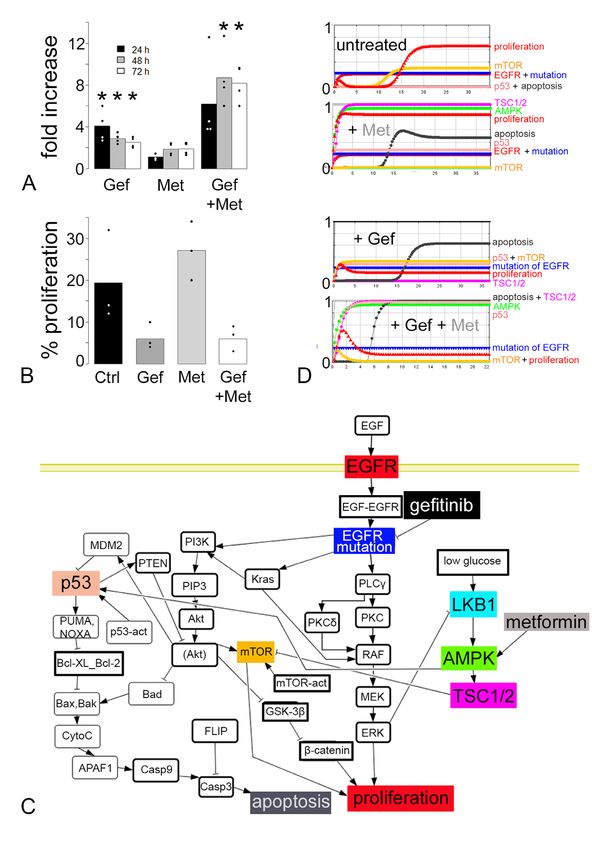
Kühnemundt et al.

                                                                                              Fig. 1: Generation of 3D tumor models
                                                                                              by seeding a decellularized porcine
                                                                                              jejunum with tumor cells
                                                                                              (A) The collagen-rich matrix derived
                                                                                              from porcine jejunum as a “Biological
                                                                                              Vascularized Scaffold for Tissue
                                                                                              Engineering and Regenerative Medicine”
                                                                                              (BioVaSc-TERM® ). (B) The wall of the
                                                                                              former gut consists of extracellular matrix
                                                                                              (ECM) components and maintains the
                                                                                              tissue architecture of the intestine with villi
                                                                                              (v) and crypt structures (*). Different layers
                                                                                              are preserved: mucosa, small intestinal
                                                                                              submucosa and serosa. Two different
                                                                                              matrices can be prepared: (i) the SISmuc
                                                                                              consists of the former small intestinal
                                                                                              submucosa (SIS) and the mucosa (muc),
                                                                                              while (ii) the SISser consists of the former
                                                                                              SIS and the serosa (ser). (C) The matrix
                                                                                              is fixed within two cell crowns, designed
                                                                                              for seeding with cells either on both sides
                                                                                              of the matrix (right, white crown in C) or
                                                                                              for seeding with cells only on one side of
                                                                                              the matrix (left, in brown). (D) Different cell
                                                                                              types like human endothelial cells (hECs)
                                                                                              and tumor cells can be seeded on the
                                                                                              matrix. (E) Generated matrix-inserts can be
                                                                                              placed in 12-well plates similar to transwells
                                                                                              or in custom-made bioreactors for
                                                                                              dynamic culture. (F) Cells (blue in the H&E
                                                                                              staining) can be seeded on the surface
                                                                                              of the collagen matrix, and cell growth is
                                                                                              enhanced in bioreactor cultures. Scale bar
                                                                                              in F (bottom right): 100 μm.

layers (Fig. 1B): (i) the mucosa, (ii) the small intestinal submu-       Cells grown in static cell culture reach a state similar to tissue
cosa (SIS) and (iii) the serosa. Subsequently, two different tissue   homeostasis after about 11 days of culture. In the absence of ma-
matrices can be derived: the SISmuc is composed of the former         jor changes in proliferation and apoptosis, cells can then be used
SIS and the mucosa, while the SISser contains the former SIS          for drug tests over a period of approximately 7 days (Fig. S12).
and the serosa. As a unique feature, structures of the basement       While dynamic models in bioreactors have a lower through-put,
membrane are preserved on top of the mucosa after the chemical        they benefit from better nutrient supply and waste disposal via the
decellularization process.                                            medium flow, thus mimicking in vivo conditions more closely. As
  Both matrices can be fixed between two cell crowns, resulting       dynamic culture improves cell growth and maintenance, the dura-
in inserts for 12-well plates similar to a transwell system (Fig.     tion of drug application can be extended for up to several weeks.
1C,D,E). They can also be fixed in flow bioreactors for dynamic
cell culture (Fig. 1E). Different designs of cell crowns are possi-   3.2 The tissue matrix
ble: either they can be used upside down for two-sided cell cul-      After the decellularization process as described before (Jannasch
ture (white cell crown in Fig. 1C) or upright for one-sided cell      et al., 2015; Linke et al., 2007; Schanz et al., 2010), the main part
culture (brown cell crown in Fig. 1C). Dynamic culture in biore-      of the SISmuc matrix is composed of collagen fibers covered with
actors enhances cell growth on the matrix (blue in Fig. 1F) com-      the structurally preserved basal lamina on the mucosal side of the
pared to static cell culture (Fig. 1F).                               matrix (Fig. 2A). The villi structures are intact (Fig. 2B). With-

2 doi.10.14573/altex.2008141s1

294                                                                                                                         ALTEX 38(2), 2021
Kühnemundt et al.
Fig. 2: The mucosal but not the serosal side of SISmuc
matrix shows a complete preserved basal lamina structure Fig. 3: Breast cancer cell lines invade the matrix differently
after the decellularization process (A,B) While MCF7 cells (A) grow on top of the scaffold and in some
(A) Ultrastructural raster electron microscopy analysis of the former crypts, MDA-MB-231 cells (B) invade the whole collagen
SISmuc matrix illustrates villi (v) and crypt structures (*), mucosa structure when cultured in a static 3D cell culture in cell crowns.
and small intestinal submucosa (SIS) in a cross section. (B) Top (C,D) This effect becomes more pronounced in dynamic cell
view with low magnification on former mucosa with preserved culture in bioreactors. (A-D) HE-staining of paraffin sections. (E,F)
villi structures covered with a layer of basement membrane (BM), Immunohistochemical staining of pan-cytokeratin (green)
in higher magnification in (C), displaying the presence of small and vimentin (red) on paraffin sections reveals the epithelial
holes with collagen fibers lying underneath. (D) The serosal side character of MCF7 cells (E) and the more mesenchymal character
of the submucosa consists primarily of fibrillar collagen fibers seen of MDA-MB-231 cells (F). Nuclei are stained with DAPI (blue)
in higher magnification in (E). Scale bars in A, B, D: 100 μm; scale in E and F. Scale bar in F: 100 μm (same scale for A to F),
bars in C, E: 1 μm; representative images of n = 1 experiment. representative images of n = 3.
in the basal membrane, pores ranging from 1 to 2 µm are visible muc. Different stages of cancer cell invasion can be mimicked
(Fig. 2C). These pores in the basement membrane have a sharp depending on culture condition and cell line. MCF7 breast can-
border and overall rounded shape, suggesting that they are nat- cer cells clearly grow on top of the matrix and inside the for-
urally occurring pores rather than damage deriving from the de- mer crypt structures under static (Fig. 3A) and dynamic culture
cellularization process. In contrast, the former serosal side of the conditions (Fig. 3C). In contrast, MDA-MB-231 breast cancer
matrix shows no intact basement membrane structure: Only sin- cells invade into the whole matrix under static (Fig. 3B) and dy-
gle collagen fibers can be observed clearly at higher magnifica- namic culture conditions (Fig. 3D) as shown before (Wallstabe
tion (Fig. 2D,E). et al., 2019). Immunohistochemical staining of pan-cytokeratin
(PCK, green in Fig. 3E,F) and vimentin (Vim, red in Fig. 3E,F)
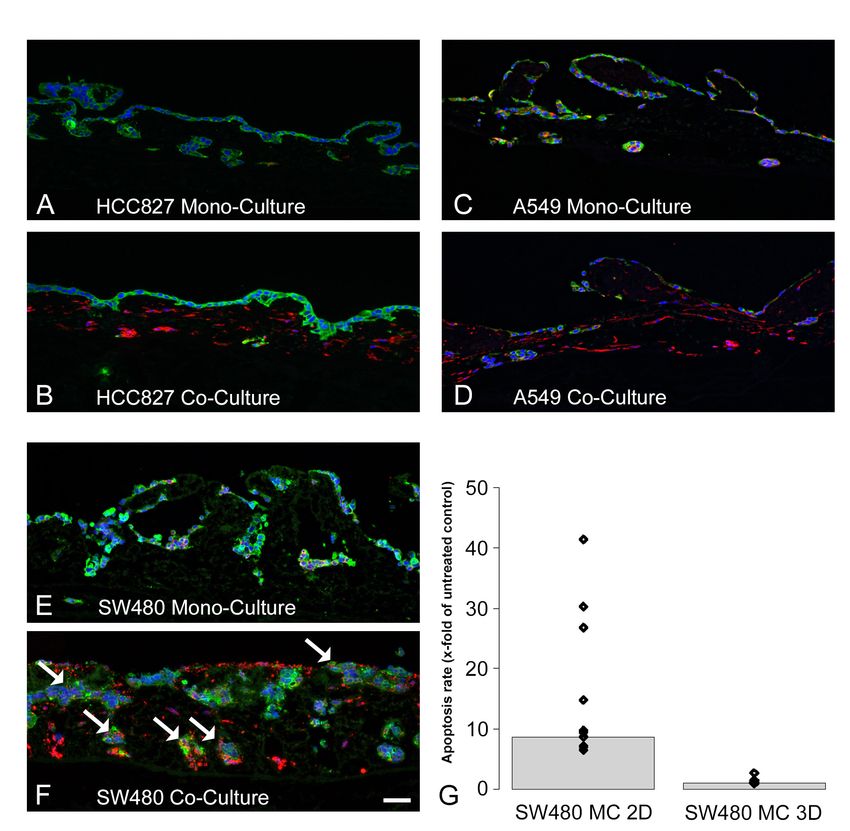
3.3 Differentiation between invasive and reveals their different epithelial-to-mesenchymal transition
non-invasive tumor cells (EMT) status. Dynamic conditions promote the invasive char-
The invasive behavior of cells can be classified by investigating acter of MDA-MB-231 cells, leading to an increased tumor cell
cell growth morphology when seeded on the surface of the SIS- mass within the mucosal part of the SISmuc (Fig. 3D) as well as
ALTEX 38(2), 2021 295Kühnemundt et al.
Tab. 1: Functional overrepresentation analysis of genes
showing significant deregulation upon treatment
with gefitinib in HCC827 cells not shared with A549 cellsa
No. of Adj.
genes p-value
changed
Downregulated in 3D but not in 2D
Cell cycle
Cell division 44 1.46∙10-8
Cell cycle checkpoint 15 2.64∙10-7
Regulation of cell cycle 33 6.33∙10-7
G1/S phase transition 11 2.46∙10-5
Metabolic process
Canonical glycolysis 8 3.75∙10-8
ADP metabolic process 14 1.78∙10-9
Fig. 4: 3D cell culture of colorectal cancer (CRC) cells
on the SISmuc matrix increases the expression of cancer Pyruvate metabolic process 15 1.81∙10-9
stem cell (CSC) markers
DNA replication
Glass slides from 2D and paraffin-embedded sections from
3D cultures were immunohistochemically stained for the stem cell Mitotic spindle organization 9 3.33∙10-4
markers CD44 (A to D), CD133 (E to F), CD166 (I to L) und Chromosome condensation 6 2.29∙10-3
EpCAM (M to P). While the CRC cell lines HROC24 and HROC87
Upregulated in 3D but not in 2D
are negative for CD44 (A, B) and CD166 (I, J) under conventional
2D conditions, both cell lines express these markers when Regulation of apoptosis
cultured on SISmuc (C, D, K, L). Scale bars given in M to Positive regulation of apoptotic process 9 2.22∙10-3
P: 100 μm (same scale for A to P), representative images of n = 3.
Cell proliferation
Negative regulation of cell proliferation 9 5.72∙10-3
increased Vim expression (red in Fig. 3F), whereas non-invasive a The table shows selected biological processes and pathways
MCF7 cells only show strong PCK expression (green in Fig. 3E). that are deregulated in 3D but not in 2D. Proliferative processes and
associated metabolism are down-regulated under 3D conditions.
3.4 Enhanced tumor stem cell marker The number of deregulated genes that are involved in each process
expression under 3D conditions is shown. Adjusted (multiple testing corrected) p-values
are given on the right. Analyses are based on microarray data from
Cancer stem cells are discussed to present the key subpopulation 1 experiment in each condition (n = 1).
that should be targeted efficiently for long-term therapeutic suc-
cess. For CRC model generation, we used two early passage cell
lines recently isolated from patients with different tumor stag-
es (HROC24: low grade, HROC87: high grade). HROC24 cells cer models based on the tissue matrix technology (Göttlich et
grow mostly as monolayers on top of the matrix and within crypt al., 2018; Stratmann et al., 2014). In order to reveal involved
structures, whereas the more malignant HROC87 form aggre- pathways and biological functions, we now performed mi-
gates on top and in former crypt structures of the intestinal matrix. croarray-based gene expression analyses of the two lung can-
In order to compare stem cell characteristics between 2D and 3D cer cell lines A549 and HCC827 in 2D and 3D and compared
culture conditions, we investigated the expression of the tumor the respective differences. To adjust for the qualitative differ-
stem cell markers CD44, CD133, CD166 and EpCAM (Willis et ence in RNA isolated from either 2D or 3D culture and to focus
al., 2008). In both cell lines, expression of all stem cell markers on genes relevant for drug response, we compared the ratios
was only found in 3D conditions, whereas in 2D conditions CD44 of samples treated or untreated with gefitinib, an EGFR tyro-
and CD166 were not detected in either cell line (Fig. 4). sine kinase inhibitor (TKI), under 2D or 3D culture conditions.
As HCC827 cells harbor an activating mutation in the EGFR
3.5 Differences in gene expression upon targeted gene, while A549 cells do not, only HCC827 were expected to
therapy under 2D conditions and in 3D tissue models respond to this drug. Gene transcripts with differential expres-
In previous studies, we have shown an improved correlation sion upon gefitinib treatment in HCC827 but not in A549 cells
of drug responses with clinical observations in 3D lung can- were selected for further gene ontology (GO) analysis (Tab. 1;
296 ALTEX 38(2), 2021Kühnemundt et al.
Fig. 5: Enhanced effects of gefitinib
and metformin are predicted and
validated by a combined in silico and
in vitro model
(A) In vitro, gefitinib (Gef) and metformin
(Met) improve induction of apoptosis
in HCC827 cells cultured in 3D. M30 ELISA
measurements were performed after
24 h (black bars), 48 h (grey bars) and
72 h (white bars) incubation with either
single drugs or the combination (n = 4).
(B) Gef alone or Gef + Met decrease
proliferation in HCC827 cells (% of
Ki-67-positive cells of total cell numbers)
compared to the untreated control (Ctrl)
(n = 3). (C) An in silico topology of HCC827
cells, which harbor an activating mutation
of the epidermal growth factor receptor
(EGFR) (blue node “mutation of EGFR”),
was computed in order to simulate
treatment responses in silico.
(D) Simulations by the software SQUAD
mirror the response of HCC827 cells
to different treatments and reflect in vitro
results. * in A: p < 0.05, Student’s t-test.
Bars in A and B: mean values, dots in
A and B: values of individual experiments
(n = 2 for A (2 technical replicates/
experiment) and n = 3 (1 technical
replicate/experiment) for B).
pathway enrichment with bubble-plots for pathways upregulat- metabolism and ADP metabolism, which are all linked to the
ed in 3D compared to 2D in Fig. S32 and downregulated path- Warburg effect) and downregulation of DNA replication (rep-
ways in Fig. S42 ). lication initiation, strand elongation, mitotic spindle organiza-
Gene lists that showed down- and upregulation in 3D mod- tion, chromosome condensation). These highly significant ob-
els compared to 2D conditions were subjected to an enrich- servations are in line with the previously observed reduced cell
ment analysis. A high number of downregulated genes in 3D proliferation under 3D conditions. Upregulated genes are, in
culture suggests more stringent cell cycle control (cell divi- contrast, linked to positive regulation of apoptotic processes,
sion, cell cycle checkpoint, G1/S phase transition, cell prolifer- to the extracellular matrix (ECM) (epithelium development,
ation), fewer cancer-like metabolic processes (less pronounced ECM organization, tissue morphogenesis), to cell differenti-
expression of pathways such as canonical glycolysis, pyruvate ation, migration and signal transduction. An increase of tran-
ALTEX 38(2), 2021 297Kühnemundt et al.
scripts related to inhibition of cell proliferation was observed. tions is of considerable interest. We thus generated models in-
All differentially expressed genes with fold-change values are cluding cell types from the tumor microenvironment such as
listed in the supplementary file (Tab. S13, raw data, and Tab. hECs, immune cells, and fibroblasts. This enables the analysis
S24, GO-term analysis results). of new substances and immune therapies. Toxic side effects on
non-cancerous cells also can be investigated.
3.6 Simulation module: in silico synergistic effect of In order to test recently described trispecific hemibodies
gefitinib and metformin validated including mutation which target CD45 positive tumor cells in HLA-A2 positive
constellation in 3D tissue lung cancer models leukemia patients, we seeded HLA-A2 positive hECs on the
To demonstrate the potential of our 3D model to support ex- serosal side of our biological matrix and co-cultured this ar-
ploratory pre-clinical research, bioinformatic simulations tificial endothelium with the human HLA-A2 and CD45 du-
were used to discover new targets and promising treatment al-positive leukemia cell line THP-1 (Bersi, 2017). In order
combinations for CRC and NSCLC (Baur et al., 2019; Göt- to assay efficacy and specificity of these hemibodies as an an-
tlich et al., 2018). The work of Göttlich et al. (2018) pointed tigen-specific immunotherapeutic approach (Banaszek et al.,
towards 5’ AMP-activated protein kinase (AMPK) activation 2019) in a tissue-like context, we analyzed the induction of
as a potential treatment strategy for lung cancer. As metformin apoptosis in THP-1 cells by flow cytometry and compared re-
acts (among other effects) also as an AMPK activator, we test- sults from 3D to conventional 2D cell culture. In addition, we
ed the combination of gefitinib and metformin on HCC827 compared the efficacy to treatment with the clinically investi-
cells. In line with our bioinformatic prediction, we observed gated farnesyltransferase inhibitor tipifarnib (Stieglitz et al.,
a significantly increased effect on apoptosis induction for the 2015). Hemibodies can only recruit T-cells towards dual-pos-
combination (Fig. 5A). In contrast, proliferation was only af- itive CD45 and HLA-A2 positive leukemic cells when both
fected by gefitinib, but not by metformin, and no enhanced ef- antibody parts (AB1 and AB2) bind their respective targets
fect on the inhibition of proliferation could be measured for in close proximity. They then assemble to form a function-
the combination (Fig. 5B). al antibody that also binds to CD3 on T-cells. After addition
These data were integrated into a signaling network topolo- of HLA-A2-negative PBMCs as effector cells, tumor cell ly-
gy of HCC827 cells (Fig. 5C). We then simulated the dynam- sis was induced (Fig. 6E,F). Importantly, after 5 days of tipi-
ics of the signaling network (Fig. 5D). All proteins and their farnib treatment, we observed the induction of apoptosis in a
activities change over time, and effector nodes for key cellular dose-dependent manner in THP-1 cells in the 3D model and
responses are calculated in this simulation. The change over severe damage of the endothelial monolayer confirmed by
time for key cellular responses (proliferation, apoptosis) and CD31 staining (Fig. 6D), which, in contrast, was not affected
central proteins (p53, mTOR, AMPK, etc.) is shown in Fig- by trispecific hemibody treatment (Fig. 6H). Furthermore, the
ure 5D. This allows an estimation of the cellular responses, hemibody treatment yielded a higher efficacy in the 3D mod-
for instance enhanced induction of the node “apoptosis” by el (60% apoptotic THP-1 cells after only 24 hours of treatment
the combination therapy compared to gefitinib monotherapy, compared to 40% apoptotic THP-1 cells in 2D) as shown in
whereas proliferation shows a similar profile in both treatment Figure 6E and F.
scenarios (Fig. 5D). Moreover, the endothelium can be investigated as a barrier for
Thus, comparing the pharmacological effects in our in vitro immune cells about to enter the tumor, which is an important is-
3D cell culture model (Fig. 5A,B) with the in silico predic- sue in immune therapies (Galon et al., 2006). While the endo-
tion shows concordant results. The combination of in vitro and thelial monolayer is shown in green by CD31 staining, tumor
in silico modeling allows to accurately relate the tumor muta- cells are stained only with DAPI (Fig. 6I ). With the help of flow
tion constellation with the most appropriate drug combination. bioreactors, the diapedesis of immune cells, in this case PBMCs
Moreover, as the modular in vitro test system as well as the (shown in green), was investigated under dynamic medium flow
in silico simulation module are generic, the approach can be conditions (Fig. 6J).
used for testing many other defined drug targets, drugs or drug Finally, by adding human dermal fibroblasts to different tu-
combinations beyond the example shown in this manuscript. mor cell lines cultured in our 3D models, we observed differ-
ent effects on tissue morphology. HCC827 lung tumor cells
3.7 Modular refinement of the 3D tissue and A549 cells (Fig. 7A,B in green) showed largely unaltered
models by adding different cell types of cell growth patterns compared to monocultured tumor cells.
the tumor microenvironment The added fibroblasts simply migrated to deeper matrix areas,
Further cellular components such as the tumor stroma impact while the tumor cells stayed on top of the matrix (Fig. 7C,D
drug responses. Given the strong immunosuppressive effects ex- in red). Astonishingly, in co-culture with colorectal SW480
erted by the tumor stroma, a targeting of tumor-stroma interac- cancer cells, non-cancerous fibroblasts induced tumor cell in-
3 doi:10.14573/altex.2008141s2
4 doi:10.14573/altex.2008141s3
298 ALTEX 38(2), 2021Kühnemundt et al.
Fig. 6: Endothelial cells grown on
the serosal side of the matrix allow
drug efficacy and toxicity testing
on THP-1 leukemia cells as well as
diapedesis studies with primary
immune cells
(A,B) In flow cytometry analysis of
THP-1 cells, the farnesyltransferase
inhibitor tipifarnib shows similar
induction of apoptosis in conventional
2D cell culture (A) as in the 3D model
(B). (C) Untreated DAPI-stained
endothelial cells show no DNA damage
by TUNEL assay. (D) Tipifarnib-
treated (500 nM) cells show a
destroyed endothelial layer structure
and apoptotic cells (green). (E) In 2D
cell culture, the 2 hemibodies, denoted
as antibody (AB) 1 and 2, reveal a
similar induction of apoptosis in THP-1
cells compared to treatment with 500
nM tipifarnib when given together (A).
(F) Increased apoptosis can be seen in
the 3D model with no evident damage
of the endothelium as demonstrated
by TUNEL assay (G). (H) Technical
positive control of the TUNEL assay
(n = 3, unpaired t-test, Bonferroni
corrected). (I) hECs seeded on
the former serosal side forming an
endothelial layer on the SISmuc. On
the mucosal side, the breast cancer
cells MCF7 were added. hECs are
shown in green in (I) by CD31 staining.
(J) A co-culture of hECs with immune
cells enables the investigation of
immune cell diapedesis as shown in
green by CD45 staining. Red in
J: Collagen IV is stained as a marker
of basal membrane structures within
the matrix. Scale bar in I: 100 μm. *,
p < 0.05 in comparison to negative
control (NC). All PBMCs used for
the experiments derived from the same
donor: n = 4 for 2D and n = 3 for 3D.
vasion into deeper matrix layers, which was accompanied by in mono- and co-cultures with the allogenic immune cell pop-
formation of tumor cell aggregates and by a partial destruction ulations. Under 3D culture conditions, the PBMC-mediated
of former crypt structures, indicating the generation of a des- apoptosis in SW480 mono-cultures was reduced in all sam-
moplastic reaction (Fig. 7E,F). To explore whether this model ples compared to 2D cultures (Fig. 7G), where variation was
can be applied for testing of immunotherapies, we added im- very high compared to 3D data. The same effects could be
mune cells (PBMCs) and measured the induction of apoptosis seen in SW480 co-cultures with fibroblasts (Fig. S22 ).
ALTEX 38(2), 2021 299Kühnemundt et al.
Fig. 7: The effect of cancer-associated fibroblasts (CAFs) on tumor cell morphology depends on tumor cell type. Compared to
2D culture, 3D conditions reduce allogenic tumor cell killing by immune cells
(A,B) In HCC827 lung tumor cells (green in A and B), which show a well-differentiated cellular morphology, co-culture (B) with dermal
fibroblasts (red in B) has no morphological effect on the growth pattern of these tumor cells. (C,D) Also, in A549 cells (green in C and D),
the co-culture with dermal fibroblasts (red in D) does not influence the growth pattern in 3D cell culture. (E,F) In contrast, when highly
malignant colorectal SW480 tumor cells (green in E and F) are co-cultured with dermal fibroblasts (red in F), the formation of tumor clusters
(white arrows in F) that overgrow former crypt structures is observed (n = 3). G: When allogenic PBMCs were added to SW480 tumor cells,
allogenic (and thus largely antigen-independent) tumor cell killing was assessed in order to evaluate the potential usefulness of the models as
test systems for MHCI-dependent immune-mediated tumor cell killing. In 2D (n = 6), the apoptosis induction was much higher (with a higher
variation) than in 3D (n = 6) in mono- as well as in co-culture with fibroblasts (see Fig. S22 ). A to F: immunohistochemical staining of PCK
(green) and vimentin (Vim). Nuclei are counterstained with DAPI (blue). Scale bar in F: 50 μm for A to F. All PBMCs derived from the same
donor: n = 2 (5 technical replicates/experiment) for 2D and n = 3 for 3D.
4 Discussion leukemia tissue model the matrix SISser in which the small intes-
tinal submucosa and the serosa are preserved.
We report here a modular 3D tissue culture system to generate Mina Bissel and others have stressed the huge importance
improved human tumor models with an in vivo-like microphys- of the microenvironment for physiological cell growth: isolat-
iology. To this aim, we use a decellularized tissue matrix from ed cells lose their functionality as cues from the microenviron-
porcine gut termed SISmuc in which the mucosa is preserved on ment critically determine the cell fate (Bissell et al., 2003; Bis-
top of the small intestinal submucosa. In addition, we used for a sell, 1981). Advances in 3D technologies, particularly organ-
300 ALTEX 38(2), 2021Kühnemundt et al. oids, provide new options in the field of more physiological Further aspects of the models should improve predictivity and and personalized models for drug testing and cancer research mode-of-action analysis: (i) The 3D tissue architecture, its com- (Drost and Clevers, 2018; Simian and Bissell, 2017). Never- position of ECM components, and the structure of the basement theless, organoids have significant disadvantages like their in- membrane and bioreactors lead to a more physiological growth side-out topology that hinders practical analyses, the very ex- of carcinoma cells according to their invasive traits, gene ex- pensive culture conditions due to the need of Matrigel® and pression/pathway activity (apoptosis, proliferation) and stem growth factors, and high donor variation5. Moreover, during cell markers. (ii) Semi-quantitative in silico simulations based on organoid formation, dedifferentiation processes are inevita- these gene expression data allow focused predictions of drug tar- ble. Stroma components are often not implemented into the or- gets and drug combinations. (iii) Addition of cells from the tumor ganoids (Baker et al., 2016; Fan et al., 2019) or even get lost microenvironment enables testing of antigen-specific and MHCI- (Kim et al., 2019). Immune components can, in contrast, easily independent immune therapy and toxicity, and transmigration be added from peripheral blood (Dijkstra et al., 2018). Animal studies across the endothelium, including assessment of the im- models such as patient-derived xenografts (PDX) present oth- pact of activated fibroblasts on invasion. Moreover, allogenic im- er challenges: Apart from ethical concerns, they are time-con- mune reactions are reduced in 3D tumor models. suming and generally show high variability, which calls for For model generation, tumor cells are seeded on the luminal high numbers of animals to achieve statistically meaningful re- side – the mucosal side – of the decellularized intestine. Similar sults. While these practical limitations may be overcome, oth- to epithelium-derived carcinomas, they are thus physiologically er problems caused by the species barrier are intrinsic to these anchored to the basement membrane. We could show by ultra- models. For example, host factors from mice or rats in some structural analysis that only on the mucosal, but not on the sero- cases fail to activate their corresponding receptors on human sal side, structures of the basement membrane are preserved as a cells as we have, next to others, demonstrated before (Baur et closed layer, showing small, supposedly natural holes at the bot- al., 2019; Francone et al., 2007; Jeffers et al., 1996; Anselmi et tom of the former crypts. These holes are too small for undirected al., 2020; Rongvaux et al., 2014). cell migration through them and were proposed to have functions Decellularized matrices provide complex cues that enhance in immune cell trafficking (McClugage and Low, 1984; Taka- cell growth, differentiation (Berger et al., 2020) and – as shown hashi-Iwanaga et al., 1999; Takeuchi and Gonda, 2004). Holes in here – also stemness potential. The main advantage of our 3D tis- the basement membrane are also reported in the human bronchus sue model system compared to organoids is its modular and stan- after decellularization (Howat et al., 2002). In our experiments, dardizable set-up with a distinct orientation in a transwell culture we observed that the basement membrane represents a strong plate. Thereby, transmigration of tumor and immune cells across barrier for tumor cell growth in all investigated cancer entities the preserved basement membrane or the added endothelial bar- when the tumor cells are non-invasive. Interestingly, the breast rier can be easily evaluated, as the monolayer integrity is visual- cancer cell line MDA-MB-231, which was formerly described to ized by CD31 staining. be highly invasive (Neve et al., 2006), overcomes this barrier and To generate in vitro models close to the in vivo situation suit- scatters over the whole mucosa in form of single cells as reported able for standardization and large-scale production, we use one before (Wallstabe et al., 2019). In line with hypotheses on EMT single pig for the generation of about 150 tumor models out of and invasion (Zhang and Weinberg, 2018), these MDA-MB-231 one single intestine and generate tumor models based on a stan- cells show a more mesenchymal marker expression, indicating a dardized operating protocol (Göttlich et al., 2016). We utilize the higher EMT status than the non-invasively growing MCF7 breast jejunum as in this part one intestinal loop is supplied with blood cancer cells, as shown here for the first time on our matrix in a via one artery and one vein. This enables complete cell remov- 3D tumor model. al by thoroughly flushing the vessels with detergent as published before (Jannasch et al., 2015; Linke et al., 2007; Schanz et al., 4.1 Exploiting the modular micro-physiological 2010). All investigated cell lines showed a stable proliferation 3D tissue models for testing immune therapies, index as well as apoptosis levels between day 11 and about day fibroblasts and immune cells 18 of a static 3D cell culture, which enables one week of drug Different cell types can also be used to study primary stromal testing in a kind of tissue homeostasis. The proliferation index components of tumors. As hECs do not only contribute to the tu- is generally reduced in 3D models in comparison to 2D models, mor stroma by building a physical barrier but also by secreting which is more representative of in vivo conditions. In investigat- soluble signaling molecules, they play an important role when ed cell lines, we find different indices by counting the percent- it comes to drug responses in tumor cells (Gubbiotti et al., 2020; age of Ki-67 positive cells as done in the clinic. Most cell lines Meurette and Mehlen, 2018). Endothelial cells can be seed- range between 20 and 40 percent, which reflects observations ed on the basolateral side of the matrix to investigate diapedes- from the clinic (Warth et al., 2014; Inwald et al., 2013). Thus, is of immune cells. For this purpose, specific cell crowns were these models should reduce the risk for false-positive results in developed to enable a 3-day upside-down pre-incubation with cytostatic drug testing (Cree et al., 2010). hECs. These cell crowns can also be manufactured by 3D print- 5 Lang, S. (2019). What are the pros and cons of using organoids? https://www.drugtargetreview.com/article/48244/what-are-the-pros-and- cons-of-using-organoids/ (accessed 08.12.2020) ALTEX 38(2), 2021 301
You can also read