Single-cell transcriptome analysis defines heterogeneity of the murine pancreatic ductal tree
←
→
Page content transcription
If your browser does not render page correctly, please read the page content below
RESEARCH ARTICLE

                                   Single-cell transcriptome analysis defines
                                   heterogeneity of the murine pancreatic
                                   ductal tree
                                   Audrey M Hendley1,2, Arjun A Rao3,4†, Laura Leonhardt1†, Sudipta Ashe1†,
                                   Jennifer A Smith1, Simone Giacometti1, Xianlu L Peng5,6, Honglin Jiang7,
                                   David I Berrios1, Mathias Pawlak8, Lucia Y Li1, Jonghyun Lee1, Eric A Collisson7,
                                   Mark S Anderson1, Gabriela K Fragiadakis3,4,9, Jen Jen Yeh5,6,10,
                                   Chun Jimmie Ye11, Grace E Kim12, Valerie M Weaver2, Matthias Hebrok1*
                                   1
                                    Diabetes Center, University of California, San Francisco, San Francisco, United
                                   States; 2Center for Bioengineering and Tissue Regeneration, University of California,
                                   San Francisco, San Francisco, United States; 3CoLabs, University of California, San
                                   Francisco, San Francisco, United States; 4Bakar ImmunoX Initiative, University of
                                   California, San Francisco, San Francisco, United States; 5Department of
                                   Pharmacology, University of North Carolina at Chapel Hill, Chapel Hill, United
                                   States; 6Lineberger Comprehensive Cancer Center, University of North Carolina at
                                   Chapel Hill, Chapel Hill, United States; 7Division of Hematology and Oncology,
                                   Department of Medicine and Helen Diller Family Comprehensive Cancer Center,
                                   University of California, San Francisco, San Francisco, United States; 8Evergrande
                                   Center for Immunologic Diseases, Harvard Medical School and Brigham and
                                   Women’s Hospital, Boston, United States; 9Department of Medicine, Division of
                                   Rheumatology, University of California, San Francisco, San Francisco, United States;
                                   10
                                     Department of Surgery, University of North Carolina at Chapel Hill, Chapel Hill,
                                   United States; 11Parker Institute for Cancer Immunotherapy, San Francisco, United
*For correspondence:               States; 12Department of Pathology, University of California, San Francisco, San
Matthias.Hebrok@ucsf.edu
                                   Francisco, United States
†
 These authors contributed
equally to this work

Competing interests: The
authors declare that no            Abstract To study disease development, an inventory of an organ’s cell types and
competing interests exist.         understanding of physiologic function is paramount. Here, we performed single-cell RNA-
                                   sequencing to examine heterogeneity of murine pancreatic duct cells, pancreatobiliary cells, and
Funding: See page 24
                                   intrapancreatic bile duct cells. We describe an epithelial-mesenchymal transitory axis in our three
Received: 23 February 2021         pancreatic duct subpopulations and identify osteopontin as a regulator of this fate decision as well
Accepted: 18 May 2021              as human duct cell dedifferentiation. Our results further identify functional heterogeneity within
Published: 19 May 2021             pancreatic duct subpopulations by elucidating a role for geminin in accumulation of DNA damage
Reviewing editor: Lori Sussel,     in the setting of chronic pancreatitis. Our findings implicate diverse functional roles for
University of Colorado Anschutz    subpopulations of pancreatic duct cells in maintenance of duct cell identity and disease progression
Medical Campus, United States      and establish a comprehensive road map of murine pancreatic duct cell, pancreatobiliary cell, and
   Copyright Hendley et al. This
                                   intrapancreatic bile duct cell homeostasis.
article is distributed under the
terms of the Creative Commons
Attribution License, which
permits unrestricted use and
                                   Introduction
redistribution provided that the   Pancreatic duct cells, while a minority of the composition of the pancreas, play an integral role in
original author and source are     secretion and transport of digestive fluid containing proenzymes synthesized by acinar cells, electro-
credited.                          lytes, mucins, and bicarbonate. They can serve as a cell of origin for pancreatic ductal

Hendley et al. eLife 2021;10:e67776. DOI: https://doi.org/10.7554/eLife.67776                                                     1 of 29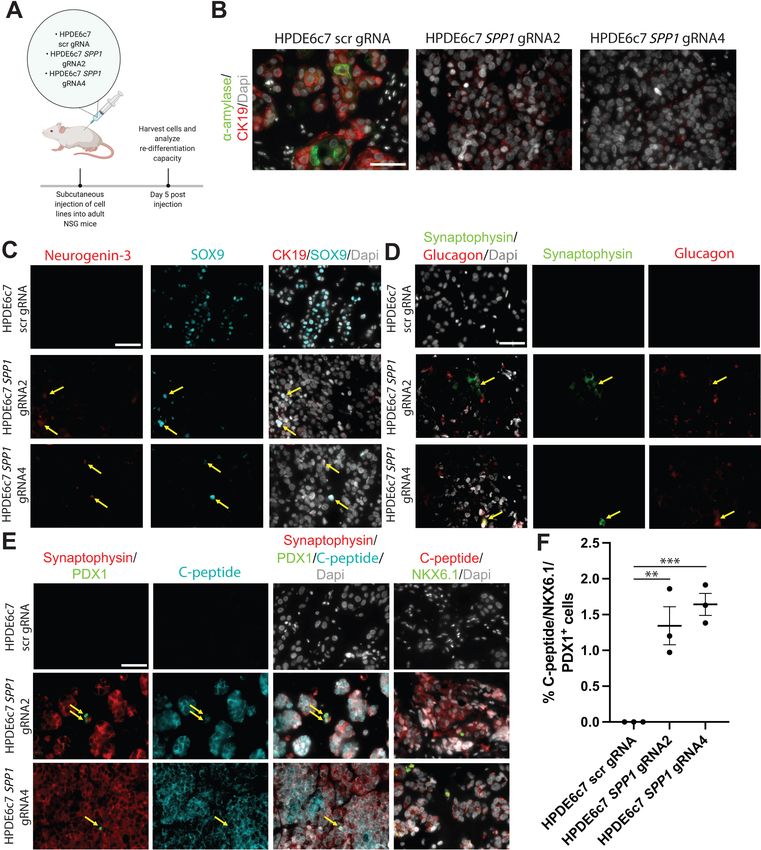
Research article                                                                              Cell Biology Developmental Biology

                                   adenocarcinoma (PDA) (Bailey et al., 2016; Lee et al., 2019) and have been implicated in the path-
                                   ophysiology of multiple other diseases including cystic fibrosis (Wilschanski and Novak, 2013) and
                                   pancreatitis (Apte et al., 1997).
                                       Heterogeneity of a cell type becomes increasingly important in the context of disease and regen-
                                   eration since different subpopulations can be the driving forces behind pathogenesis. The function
                                   of exocrine pancreatic cells is required for survival, yet these cells exhibit limited regenerative capa-
                                   bilities in response to injury. Chronic pancreatitis (CP) is a risk factor for pancreatic cancer. The
                                   underlying mechanisms for PDA progression in CP patients are incompletely understood and are
                                   likely multifactorial, including both genetic and environmental insults (Etemad and Whitcomb,
                                   2001). Studies have shown that cytokines and reactive oxygen species generated during chronic
                                   inflammation can cause DNA damage. It has been hypothesized that pancreatic cells might acquire
                                   DNA damage in the protooncogene KRAS or tumor suppressor genes TP53 or CDKN2A, thereby
                                   accelerating malignant transformation (Whitcomb and Greer, 2009; Dhar et al., 2015). Thus, it is
                                   imperative to understand the mechanisms by which DNA damage occurs in the setting of CP. Duct
                                   obstruction is one cause of CP, and the ability of ductal cells to acquire DNA damage in the setting
                                   of CP is incompletely understood.
                                       In this report, we conducted single-cell RNA-sequencing (scRNA-seq) on homeostatic murine pan-
                                   creatic duct, intrapancreatic bile duct, and pancreatobiliary cells using a DBA+ lectin sorting strat-
                                   egy, and present a high-resolution atlas of these murine duct cells. By extensively comparing our
                                   subpopulations to previously reported mouse and human pancreatic duct subpopulations
                                   (Qadir et al., 2020; Baron et al., 2016; Grün et al., 2016), we both corroborate several previous
                                   findings and identify and validate novel duct cell heterogeneity with unique functional properties
                                   including roles for subpopulation markers in CP. Our findings suggest that multiple duct subpopula-
                                   tions retain progenitor capacity, which is influenced by expression of markers driving subpopulation
                                   identity.

                                   Results
                                   scRNA-seq identifies multiple pancreas cell types with DBA lectin
                                   sorting
                                   Previously reported subpopulations of murine pancreatic duct cells were identified by single-cell
                                   analysis of pancreatic cells obtained using an islet isolation procedure; thus, exocrine duct cells were
                                   of low abundance (Baron et al., 2016). To circumvent this issue, we employed a DBA lectin sorting
                                   strategy that has been extensively used to isolate and characterize all murine pancreatic duct cell
                                   types (Beer et al., 2016; Reichert et al., 2013), to investigate murine duct heterogeneity. We iso-
                                   lated live DBA+ cells from the pancreata of four adult female C57BL/6J littermates and performed
                                   scRNA-seq on the pooled cells using the 10X Genomics platform (Figure 1A and Figure 1—figure
                                   supplement 1A). After filtering out doublets and low-quality cells (defined by low transcript counts),
                                   our dataset contained 6813 cells. Clustering analysis identified 16 distinct cell populations with an
                                   average of 5345 transcripts per cell and 1908 genes per cell (Figure 1B and Figure 1—source data
                                   1). Significantly differentially expressed genes (DEGs) when comparing a cluster to all other clusters
                                   are listed in Figure 1—source data 2. Annotation of these 16 clusters was accomplished by analysis
                                   of known markers (Figure 1B–D). Our dataset comprises 2 populations of ductal cells, a cluster of
                                   endothelial cells, 1 cluster of fibroblasts, and 12 immune cell clusters. As expected, murine endo-
                                   crine and acinar cells are not present in our dataset because they are not DBA+ cells. Gene and tran-
                                   script counts for each cluster are shown in Figure 1—figure supplement 1B. We identified
                                   DBA+Collagen I+ fibroblasts and DBA+CD45+ immune cells by immunofluorescence (IF). CD31+
                                   endothelial cells are not DBA+. Their presence in our dataset might be explained by the close juxta-
                                   position of pancreatic duct cells with endothelial cells throughout the murine pancreas (Figure 1—
                                   figure supplement 1C).

                                   Subpopulations of ductal cells are characterized by unique gene
                                   signatures and regulation of pathways
                                   To get a better understanding of duct cell heterogeneity, we generated an Uniform Manifold
                                   Approximation and Projection (UMAP) plot using all duct cells (clusters 0 and 8), which revealed six

Hendley et al. eLife 2021;10:e67776. DOI: https://doi.org/10.7554/eLife.67776                                                        2 of 29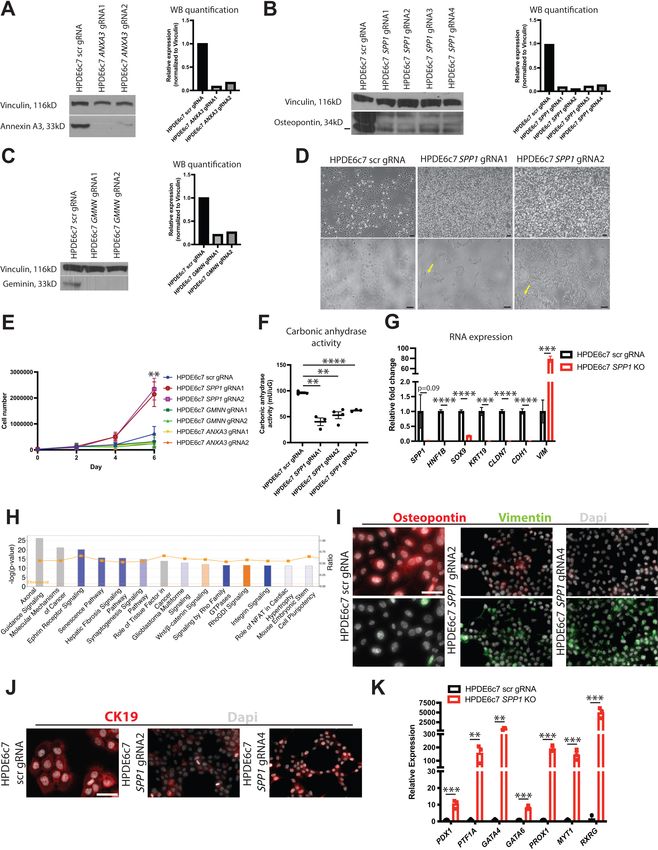
Research article                                                                                            Cell Biology Developmental Biology

Figure 1. Transcriptomic map of DBA+pancreatic cells. (A) Schematic of experiment workflow. (B) The Uniform Manifold Approximation and Projection
depicts murine pancreatic DBA+ cells obtained using the protocol. (C) A matrix plot shows average expression of ductal cell markers in all clusters,
identifying clusters 0 and 8 as ductal cells. (D) Feature plots illustrate markers of various cell types including epithelial (Epcam), ductal (Krt19 and Sox9),
CD45+ immune cells (Ptprc), endothelial cells (Pecam1), fibroblasts (Col1a1), endocrine cells (Chga), and acinar cells (Pnliprp1). We observed low-level
expression of acinar cell markers uniformly across all clusters that is likely contaminating acinar cell mRNA.
The online version of this article includes the following source data and figure supplement(s) for figure 1:
Source data 1. Number of cells and average number of genes and transcripts in all DBA+ clusters.
Source data 2. Differentially expressed genes in all DBA+ clusters.
Figure supplement 1. Features of DBA+ (clusters 0–15) and ductal (clusters 0–5) cells.

Hendley et al. eLife 2021;10:e67776. DOI: https://doi.org/10.7554/eLife.67776                                                                           3 of 29
Research article                                                                             Cell Biology Developmental Biology

                                   distinct ductal clusters. Annotation of each duct cluster was accomplished using DEGs, ingenuity
                                   pathways analysis (IPA) and upstream regulator analysis, and marker assessment in murine and
                                   human pancreas (Figure 2A–D, Figure 1—figure supplement 1D, E, Scheme 1, and Figure 2—
                                   source data 1–3). Gene and transcript counts for each cluster are shown in Figure 1—figure supple-
                                   ment 1F and Figure 2—source data 4. We observed variable expression of known ductal markers
                                   within clusters. Notably, fewer murine duct cells express the transcription factor Hnf1b when com-
                                   pared to Sox9. This observation is in contrast to a previous report demonstrating a similar preva-
                                   lence of adult murine HNF1B+ and SOX9+ duct cells, which might be explained by different ductal
                                   cell isolation methods (Figure 1—figure supplement 1G; Rezanejad et al., 2018).
                                       Cluster 0 contains the most cells of all duct clusters in the dataset (Figure 2—source data 4). A
                                   gene that positively regulates Ras signaling Mmd2, the voltage-gated potassium channel protein
                                   encoded by Kcne3, as well as the ATP-binding cassette (ABC) transporter chloride channel protein
                                   encoded by Cftr, were significantly upregulated in cluster 0 when compared to all other ductal clus-
                                   ters (Figure 2C and Figure 2—source data 1). Notably, cluster 0 shows upregulation or activation
                                   of multiple genes whose alteration play important roles in the pathophysiology of human pancreatic
                                   diseases such as CFTR for hereditary CP (Raphael and Willingham, 2016) and TGFB2 and CTNNB1
                                   for pancreatic cancer (Shen et al., 2017; Gordon et al., 2008; Heiser et al., 2008; Figure 2—
                                   source data 1 and 3).
                                       To validate gene expression patterns and determine the location of cluster 0 cells within the hier-
                                   archical pancreatic ductal tree (Reichert and Rustgi, 2011), we next examined expression of select
                                   significantly DEGs. Gmnn, an inhibitor of DNA replication, was expressed in both clusters 0 and 2,
                                   so we decided to examine histologically and were surprised to find rare GMNN protein expression,
                                   which was in contrast to the widespread RNA expression depicted by the feature plot (Figure 2—
                                   figure supplement 1A). After examining more than 1500 main pancreatic duct cells from five
                                   donors, we were unable to find a GMNN-positive cell, indicating very low or absent expression of
                                   GMNN in human main pancreatic ducts. Spp1, which encodes osteopontin, and Wfdc3, which are
                                   significantly DEGs in both clusters 0 and 2, show cytoplasmic protein expression in all mouse and
                                   human pancreatic duct types (Figure 2—figure supplement 1B, C and Supplementary file 1).
                                       Cells in cluster 1 have significantly upregulated expression of the exosome biogenesis gene
                                   Rab27b as well as Ppp1r1b that encodes for a molecule with kinase and phosphatase inhibition activ-
                                   ity (Figure 2A–C and Figure 2—source data 1). IPA results suggested an enrichment in molecules
                                   regulating Calcium Transport I (Figure 2D and Figure 2—source data 2). IPA upstream regulator
                                   analysis predicted an activated state for the transcriptional regulator Smarca4 and the two growth
                                   factors TGFB1 and GDF2 (Figure 2—source data 3). Intracellular calcium signaling in pancreatic
                                   duct cells is an important regulator of homeostatic bicarbonate secretion (Maléth and Hegyi, 2014).
                                   PPP1R1B, SMARCA4, and TGFB1 have well-described roles in the pathogenesis of pancreatic cancer
                                   (Roy et al., 2015; David et al., 2016; Tiwari et al., 2020). We observed expression of markers of
                                   cluster 1, Anxa3 and Pah, which are also DEGs in cluster 4, to have cytoplasmic protein expression in
                                   all mouse and human pancreatic duct types (Figure 2—figure supplement 2A, B and
                                   Supplementary file 1). Co-staining of CFTR, a marker of cluster 0, and ANXA3 shows both overlap-
                                   ping and non-overlapping patterns of expression in human intercalated ducts, validating the hetero-
                                   geneity observed in our murine pancreatic duct dataset in human pancreatic duct cells (Figure 2—
                                   figure supplement 2C).
                                       Cluster 2 is characterized by low level or lack of expression of multiple ductal cell markers (Cftr,
                                   Kcne3, Sparc, Mmd2, Krt7) found in other clusters (Figure 2B, C and Figure 1—figure supplement
                                   1G). Cluster 2 has the lowest average expression of total genes and transcripts (Figure 1—figure
                                   supplement 1F and Figure 2—source data 4). We therefore posit that cluster 2 represents a stable,
                                   fairly transcriptionally and metabolically inactive duct cell subpopulation when compared to other
                                   duct clusters. Cluster 3 cells are located almost entirely within cluster 8 of the UMAP containing 16
                                   DBA+ clusters (Figure 1—figure supplement 1E). This, along with high expression of genes regulat-
                                   ing cilia biogenesis (Foxj1, Cfap44, Tuba1a), led to the identification of cluster 3 as intrapancreatic
                                   bile duct cells (Figure 2A–C and Figure 2—source data 1). Expression of cilia biogenesis genes is
                                   more prominent in intrapancreatic bile duct cells when compared to pancreatic duct cells (Figure 2—
                                   figure supplement 2D, Figure 2—source data 1, and data not shown).
                                       Cells in cluster 4 have significantly higher expression of Tgfb3 and Dclk1 when compared to all
                                   other ductal clusters (Figure 2C and Figure 2—source data 1). DCLK1 labels tuft cells that are

Hendley et al. eLife 2021;10:e67776. DOI: https://doi.org/10.7554/eLife.67776                                                       4 of 29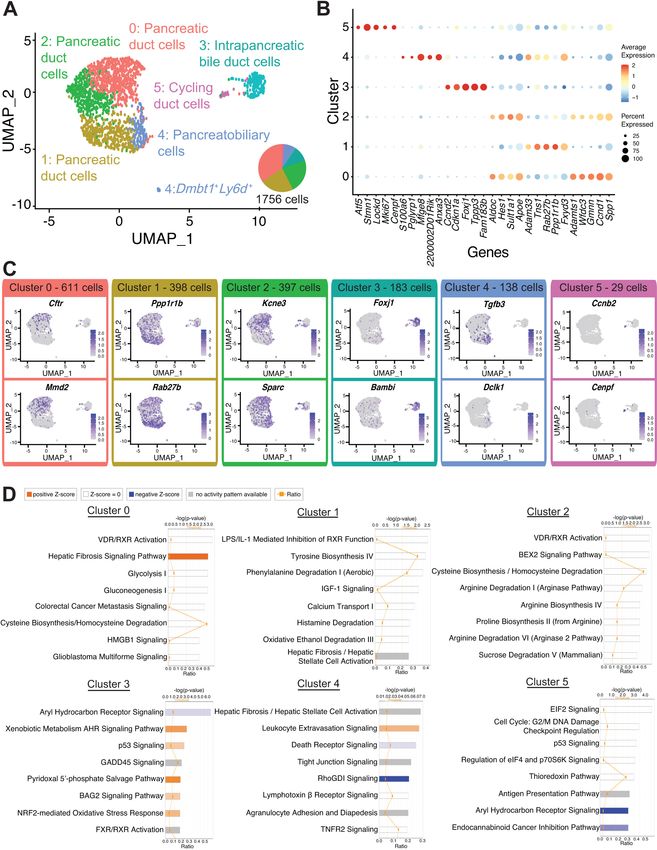
Research article                                                                                          Cell Biology Developmental Biology

Figure 2. Transcriptomic map of DBA+pancreatic duct cells. (A) Uniform Manifold Approximation and Projection (UMAP) depicts identity of clusters. (B)
The dot plot shows the top five significantly differentially expressed genes (DEGs) with the highest fold change for each cluster. (C) Feature plots show
expression of significantly DEGs for clusters 0, 1, 3, 4, and 5. Cluster 2 is characterized by lack of or low-level expression of significantly DEGs found in
other clusters. (D) Ingenuity pathways analysis (IPA) results show the top eight deregulated pathways when comparing a cluster to all other clusters. The
Figure 2 continued on next page

Hendley et al. eLife 2021;10:e67776. DOI: https://doi.org/10.7554/eLife.67776                                                                         5 of 29
Research article                                                                                                       Cell Biology Developmental Biology

Figure 2 continued
ratio line indicates the fraction of molecules significantly altered out of all molecules that map to the canonical pathway from within the IPA database. A
positive z-score represents upregulation, and a negative z-score indicates downregulation of a pathway in that cluster when compared to all other
clusters. A gray bar depicts significant overrepresentation of a pathway, the direction of which cannot yet be determined.
The online version of this article includes the following source data and figure supplement(s) for figure 2:
Source data 1. Differentially expressed genes in all DBA+ duct clusters.
Source data 2. Ingenuity pathways analysis results for all DBA+ duct clusters.
Source data 3. Ingenuity pathways analysis upstream regulator analysis results for all DBA+ duct clusters.
Source data 4. Number of cells and average number of genes and transcripts in all DBA+ duct clusters.
Figure supplement 1. IHC illustrates expression of markers in clusters 0 and 2 in the mouse and human ductal tree.
Figure supplement 2. IHC and IF depict expression of markers in clusters 1, 3, 4, and 5 in mouse and human pancreas duct cells.
Figure supplement 3. Characteristics of intrapancreatic bile duct and pancreatobiliary cells.
Figure supplement 3—source data 1. Differentially expressed genes comparing duct cluster 3 vs. 4.
Figure supplement 3—source data 2. Ingenuity pathways analysis results comparing duct cluster 3 vs. 4.
Figure supplement 3—source data 3. Ingenuity pathways analysis upstream regulator analysis comparing duct cluster 3 vs. 4.

                                                              present in normal murine intrapancreatic bile ducts, pancreatobiliary ductal epithelium
                                                              (DelGiorno et al., 2014), and rare normal murine pancreatic duct cells (Westphalen et al., 2016).
                                                              YAP1, a transcriptional regulator essential for homeostasis of biliary duct cells (Pepe-Mooney et al.,
                                                              2019), was predicted to be in an activated state by IPA upstream regulator analysis (Figure 2—
                                                                               Apoe

                                                                                      Kcne3
                                                     Ccnd1

                                                                   Aldoc
                                     1700049E15Rik

                                                                                      Adamts1

                                                             Wfdc18
                                                             Spp1

                                                                                                                                                           Fam183b
                            Ccnd1

                                                                                                                                                                 Dynlrb2
                                                                                                                                                                   Cyp2s1
               Oat
                                                             Wfdc3                                                                             Tppp3
                      Adamts1

                                                                                                                                                  Cfap44
              Aldoc

                                          Hes1
                                                              Gmnn                                                              Cenpf
                                                                           Spon1                                               Cenpe
                                Apoe
                                                                                            2200002D01Rik
                                                                                                  Cxcl16

                 Spp1Sult1a1
                                    Snhg18
                                                                                          Anxa3
                                                                       Anxa5
                                                               Timp3

                                                 Ly6e
                                Tns1          Adam33                       Pah
                                 Cp                   Rab27b
                                                                                Ppp1r1b

                                                                                                 Mfge8
                                    Fxyd3
                                        Igfbp7                                             Dclk1
                                                                                                 Sftpd

Scheme 1. A word cloud depicts the top differentially expressed genes in each duct cluster.

Hendley et al. eLife 2021;10:e67776. DOI: https://doi.org/10.7554/eLife.67776                                                                                               6 of 29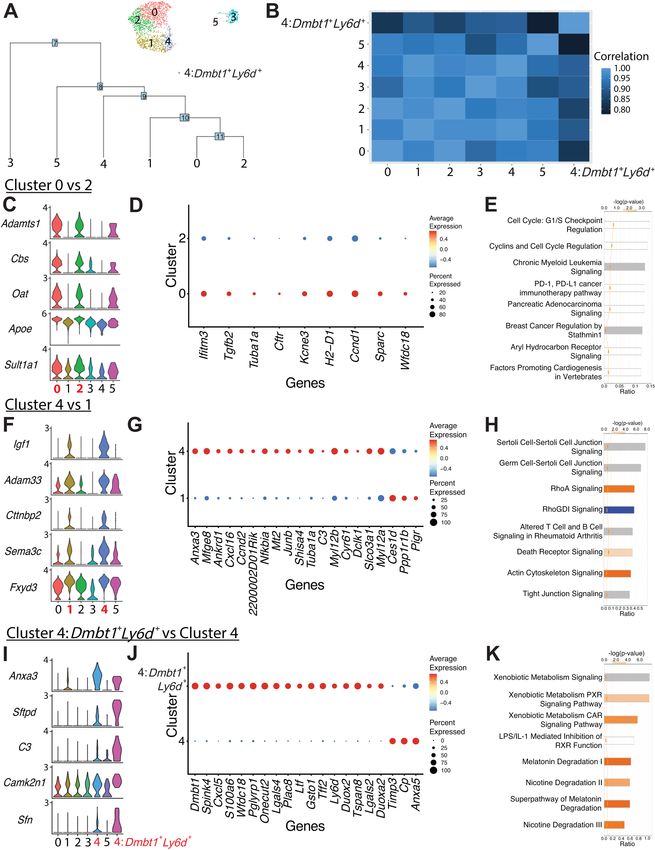
Research article                                                                               Cell Biology Developmental Biology

                                   source data 3). Cluster 4 also contained a small population (13 cells) of Dmbt1 and Ly6d-expressing
                                   cells previously identified in extrahepatic biliary epithelium (Pepe-Mooney et al., 2019; Figure 2—
                                   figure supplement 3A). These 13 cells appeared as a small population separate from other cells in
                                   cluster 4 in the UMAP (Figure 2A). Similar to the IF validation reported for extrahepatic biliary epi-
                                   thelial cells (BECs) (Pepe-Mooney et al., 2019), our IF assessment of CXCL5, another marker of the
                                   Dmbt1 and Ly6d-expressing subpopulation, showed a greater abundance of these cells than what
                                   would be expected given the number identified in the clustering analysis (Rezanejad et al., 2018). It
                                   is possible that this cell type is sensitive to single-cell dissociation. Cells in cluster 4 are juxtaposed
                                   to pancreatic duct cells (clusters 0, 1, and 2) in the UMAP, suggesting transcriptional commonalities
                                   with pancreatic duct cells. In addition, Dmbt1 and Ly6d-expressing cells are present in cluster 4, sug-
                                   gesting a bile duct identity. Based on these shared features of bile and pancreas ducts, we postulate
                                   that cluster 4 contains pancreatobiliary duct cells.
                                       Replicating duct cells are characterized by high expression of Mki67, Cenpf, and Cenpe and com-
                                   prise 1.65% of all duct cells in our dataset (Figure 2A–C, Figure 2—figure supplement 2D, and Fig-
                                   ure 2—source data 1). Consistent with previous reports (Moin et al., 2017; Butler et al., 2010),
                                   pancreatic duct cells are fairly mitotically inactive.
                                       Summarily, our high-resolution single-cell analysis has identified the substructure of murine pan-
                                   creatic duct cells and characterized pancreatobiliary and intrapancreatic bile duct cells.

                                   Comparison of clusters defines heterogeneity within duct
                                   subpopulations
                                   We next sought to determine the relationships between duct clusters by examining their similarities
                                   and differences. Dendrogram analysis, Pearson’s correlation, and DEGs revealed close relationships
                                   between clusters 0 and 2 as well as clusters 1 and 4 (Figure 3A, B and Figure 3—source data 1).
                                   Comparison of clusters 0 and 2 showed only nine significant DEGs, suggesting a shared core gene
                                   expression program (Figure 3C, D). Overrepresentation of molecules regulating the cell cycle was
                                   observed in cluster 0 when compared to cluster 2 (Figure 3E). The DEGs upregulated in cluster 0
                                   promote duct cell function (Cftr, Tuba1a, Kcne3), suggesting that cluster 0 comprises workhorse
                                   pancreatic duct cells (Hayashi and Novak, 2013).
                                       When comparing pancreatobiliary cells of cluster 4 to pancreatic duct cells in cluster 1, one of the
                                   most striking differences is the enrichment in expression of genes regulating assembly of cell junc-
                                   tions including tight junctions, epithelial adherens junction signaling, regulation of actin-based motil-
                                   ity by Rho, and actin cytoskeleton signaling. A strong network of stress fibers, comprising actin
                                   filaments, myosin II, and other proteins, that function in bearing tension, supporting cellular struc-
                                   ture, and force generation may be important for pancreatobiliary cell function and maintenance
                                   (Figure 3F–H and Figure 3—source data 2 and 3; Burridge and Wittchen, 2013; Tojkander et al.,
                                   2012). Cluster 4: Dmbt1+Ly6d+ cells are characterized by strong upregulation of pathways regulat-
                                   ing xenobiotic metabolism when compared to all other cluster 4 cells, suggesting a prominent role
                                   for these cells in the bile acid and xenobiotic system (BAXS) (Figure 3I–K and Figure 3—source
                                   data 2 and 3; Dubitzky et al., 2013). Comparison of intrapancreatic bile duct cells and pancreato-
                                   biliary cells showed many unique features of these populations including upregulation of EIF2 signal-
                                   ing in pancreatobiliary cells and upregulation of coronavirus pathogenesis pathway in intrapancreatic
                                   bile duct cells (Figure 2—figure supplement 3B–D and Figure 2—figure supplement 3—source
                                   data 1–3).

                                   Pancreatobiliary cells express a gene signature enriched in several
                                   targets of the Hippo signaling pathway YAP
                                   Two subpopulations of adult murine hepatic homeostatic BECs, A and B, have been previously
                                   described (Pepe-Mooney et al., 2019). To determine if these subpopulations are present in intra-
                                   pancreatic bile duct (cluster 3) and pancreatobiliary cells (cluster 4), we aligned our dataset with an
                                   adult hepatic murine BEC scRNA-seq dataset comprising 2344 homeostatic BECs (Pepe-
                                   Mooney et al., 2019). Intrapancreatic bile duct and pancreatobiliary cells aligned well with hepatic
                                   BECs, with no apparent batch effect (Figure 3—figure supplement 1A). Intrapancreatic bile duct
                                   cells primarily cluster together with hepatic BECs expressing subpopulation B genes, and pancreato-
                                   biliary cells primarily cluster together with hepatic BECs expressing subpopulation A genes

Hendley et al. eLife 2021;10:e67776. DOI: https://doi.org/10.7554/eLife.67776                                                          7 of 29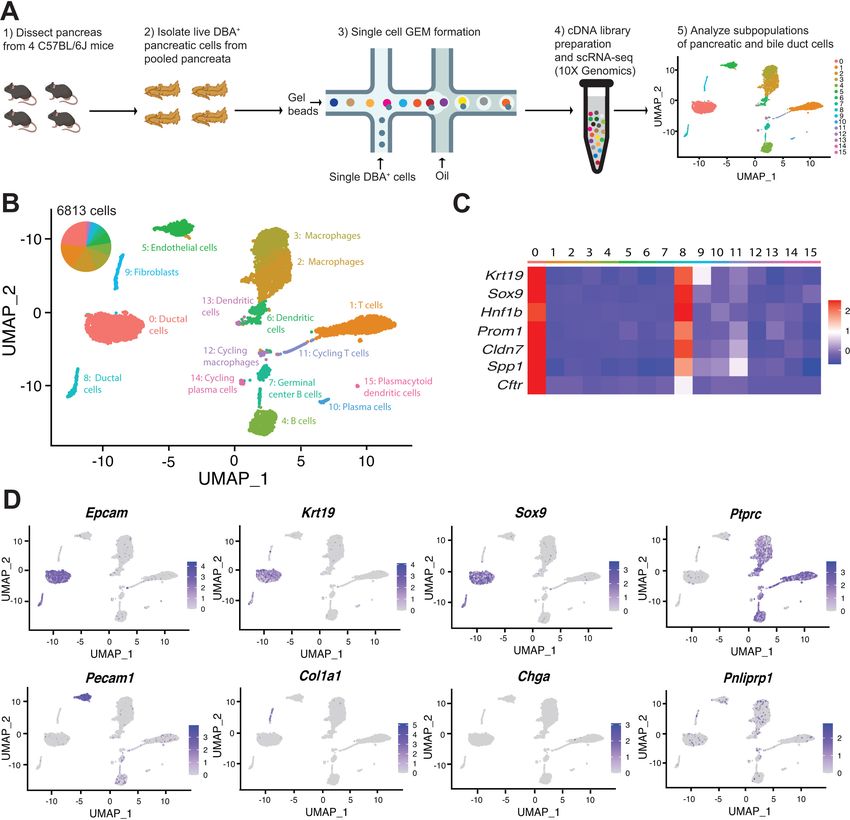
Research article                                                                                         Cell Biology Developmental Biology

Figure 3. Comparison of ductal clusters 0 vs. 2, 4 vs. 1, and 4 vs. 4:Dmbt1+Ly6d+. (A) The cluster dendrogram created using dims (used to define the
cluster) shows the Euclidean relationships between clusters. The tree is calculated in the principal component analysis space. The genes used to define
the tree were set as the variable features of the object. (B) Pearson’s correlation calculated using average gene expression is depicted. (C) Stacked
violin plots show five differentially expressed genes (DEGs) sharing similar expression patterns in clusters 0 and 2. (D) The dot plot shows all nine DEGs
Figure 3 continued on next page

Hendley et al. eLife 2021;10:e67776. DOI: https://doi.org/10.7554/eLife.67776                                                                      8 of 29
Research article                                                                                      Cell Biology Developmental Biology

Figure 3 continued
found when comparing cluster 0 vs. 2. (E) The top eight altered pathways from ingenuity pathways analysis (IPA) comparing cluster 0 vs. 2 are depicted.
(F) Stacked violin plots show five DEGs sharing similar expression patterns in clusters 4 and 1. (G) The dot plot shows the top 20 DEGs ranked by fold
change when comparing cluster 4 vs. 1. (H) The top eight deregulated pathways from IPA comparing cluster 4 vs. 1 are depicted. (I) Stacked violin plots
of five DEGs sharing similar expression patterns in clusters 4:Dmbt1+Ly6d+ and 4. (J) The dot plot shows the top 20 DEGs ranked by fold change when
comparing clusters 4:Dmbt1+Ly6d+ and 4. (K) The top eight changed pathways from IPA comparing clusters 4:Dmbt1+Ly6d+ and 4 are depicted.
The online version of this article includes the following source data and figure supplement(s) for figure 3:
Source data 1. Differentially expressed genes comparing duct cluster 0 vs. 2, duct cluster 4 vs. 1, and duct cluster 4-Dbmt1+Ly6d+ vs. 4.
Source data 2. Ingenuity pathways analysis results comparing duct cluster 0 vs. 2, duct cluster 4 vs. 1, and duct cluster 4-Dbmt1+Ly6d+ vs. 4.
Source data 3. Ingenuity pathways analysis upstream regulator analysis comparing duct cluster 0 vs. 2, duct cluster 4 vs. 1, and duct cluster 4-Dbmt1+-
Ly6d+ vs. 4.
Figure supplement 1. Alignment to an adult murine hepatic biliary epithelial cell (BEC) dataset.
Figure supplement 1—source data 1. Number of cells and average number of genes and transcripts for merged BEC–DBA+ duct clusters 3 and 4
dataset. BEC: biliary epithelial cell.
Figure supplement 1—source data 2. Differentially expressed genes in merged BEC–DBA+ duct clusters 3 and 4 dataset. BEC: biliary epithelial cell.
Figure supplement 2. Analysis of pancreas duct cells during development.
Figure supplement 3. Comparison of DBA+ lectin sorted mouse pancreas duct subpopulations to ALK3+ human pancreas duct subpopulations.

                                     (Figure 3—figure supplement 1B–G and Figure 3—figure supplement 1—source data
                                     1 and 2). The subpopulation A expression signature contains many genes significantly enriched as
                                     YAP targets, a signature that has been previously proposed to reflect a dynamic BEC state as
                                     opposed to defining a unique cell type (Pepe-Mooney et al., 2019).

                                     Ductal subpopulations are conserved and evident during pancreas
                                     development
                                     To investigate whether pancreas ductal subpopulations become evident during development, we
                                     analyzed 10X Genomics single-cell published datasets of epithelial-enriched pancreas cells at E12.5,
                                     E14.5, and E17.5 (Byrnes et al., 2018). We found distinct subpopulations of ductal cells that notably
                                     overlap in expression of key marker genes associated with adult pancreas ductal subpopulations
                                     (Figure 3—figure supplement 2A–L). As we expected, clear patterns of marker gene expression
                                     associated with adult clusters manifest at later stages of development (Figure 3—figure supple-
                                     ment 2D, H, L). Since the developmental biology samples were obtained from Swiss Webster mice,
                                     our results suggest the subpopulations of adult pancreas duct cells we describe in C57BL/6J mice
                                     are conserved.

                                     DBA+ lectin murine pancreas sorting identifies previously missed ductal
                                     subpopulations
                                     To determine the novelty of adult duct cell heterogeneity manifested using DBA+ lectin sorting of
                                     murine pancreas, we next compared our DBA+ murine pancreatic ductal clusters to previously
                                     reported subpopulations of mouse and human pancreas duct cells. Using inDrop and an islet isola-
                                     tion pancreas preparation, Baron et al., 2016 identified the substructure of mouse and human pan-
                                     creatic duct cells (Baron et al., 2016). Two subpopulations of mouse pancreatic duct cells
                                     characterized by expression of Muc1 and Tff2 (subpopulation 1) and Cftr and Plat (subpopulation 2)
                                     were described. While Cftr expression is characteristic of our cluster 0 (Figure 2C), Muc1, Tff2, and
                                     Plat expression did not typify any murine DBA+ pancreatic duct subpopulation (Figure 3—figure
                                     supplement 2M). Two subpopulations were similarly described for human pancreas duct cells char-
                                     acterized by expression of (1) TFF1, TFF2, MUC1, MUC20, and PLAT and (2) CFTR and CD44. Tff1 is
                                     not expressed in murine DBA+ ductal cells (clusters 0–5). Cd44 is significantly upregulated in pan-
                                     creatobiliary cells, and Muc20 as well as Tff2 are significantly upregulated in 4:Dmbt1+Lyd6+ cells
                                     (Figure 2—source data 1, Figure 3—source data 1, and Figure 3—figure supplement 2M, N).
                                     Dominic Grün et al., 2016 previously reported four subpopulations of human pancreatic duct cells
                                     characterized by expression of CEACAM6, FTH1, KRT19, and SPP1 using an islet isolation pancreas
                                     preparation and the CEL-seq protocol (Grün et al., 2016). While Spp1 is significantly upregulated in
                                     DBA+ pancreas duct clusters 0 and 2, Fth1 does not characterize any murine DBA+ pancreas duct
                                     population, and Krt19 is significantly upregulated in pancreatobiliary cells (Figure 2—source data 1,

Hendley et al. eLife 2021;10:e67776. DOI: https://doi.org/10.7554/eLife.67776                                                                   9 of 29
Research article Cell Biology Developmental Biology
Figure 1—figure supplement 1G, and Figure 3—figure supplement 2O). CEACAM6 has no mouse
homolog. The differences in pancreatic ductal subpopulation identification may be due to single-cell
methodology (inDrop, CEL-seq, and 10X Genomics), pancreas preparation method (islet isolation vs.
DBA+ lectin sorting), differences in ductal cell numbers analyzed, or potential differences between
mouse and human duct cells.
Six subpopulations of human pancreatic duct cells have been described using the 10X Genomics
platform based on sorting for BMPR1A/ALK3 (Qadir et al., 2020). Using AddModuleScore in Seurat,
we calculated a score comparing each of our murine duct clusters to the human ALK3+ clusters (Fig-
ure 3—figure supplement 3A–F; Alshetaiwi et al., 2020). Murine pancreatic duct clusters 0–2 had
the highest scores when compared to human ALK3+ clusters 1 (OPN+stress/harboring progenitor-
like cells) and 2 (TFF1+ activated/migrating progenitor cells). Murine pancreatobiliary cells (cluster 4)
scored the highest when compared to the human ALK3+ cluster 3 (AKAP12+ small ducts). The human
ALK3+ cluster 4 (WSB1+ centroacinar cells) did not distinguishably overlap with any DBA+ mouse
pancreas ductal clusters. DBA is expressed in murine centroacinar/terminal ducts as early as 3 weeks
of age (Stanger et al., 2005), thus these cells would be expected to be present in our dataset
(Beer et al., 2016). Examination of expression of centroacinar/terminal ductal cell markers Hes1
(Kopinke et al., 2011), Aldh1a1 (Rovira et al., 2010), and Aldh1b1 (Mameishvili et al., 2019) in our
dataset showed broad expression enriched in either clusters 0 and 2 (Hes1 and Aldh1b1) or clusters
1 and 4 (Aldh1a1), rather than a distinct subpopulation as is seen in the ALK3+ human scRNA-seq
pancreas duct dataset. Aldh1a7 is negligibly expressed in murine duct clusters 0–5 (Figure 3—figure
supplement 3G). Unlike in mouse DBA+ pancreas duct clusters, the human ALK3+ dataset contains
two ducto-acinar subpopulations characterized by expression of genes enriched in acinar cells. To
assess the presence of ducto-acinar cells in adult murine pancreas, we performed immunolabeling
for markers of the ALK3+ human ducto-acinar clusters 5 (CPA1) and 6 (AMY2A and AMY2B).
Although ducto-acinar cells, like centroacinar/terminal ductal cells, do not define a unique cluster in
our DBA+ murine duct subpopulations, we identified DBA+CPA1+ and DBA+a-amylase+ ducto-acinar
cells in adult murine pancreas (Figure 3—figure supplement 3H). Taken together, these data
suggest that murine centroacinar/terminal ductal and ducto-acinar cells are largely transcriptionally
homogenous with other murine duct cell types.
RaceID3/StemID2 suggest murine DBA+ duct cluster 0 and 2 cells are
the most progenitor-like
Given the close relationships observed between DBA+ duct clusters 0 and 2 as well as 1 and 4, we
next assessed differentiation potential using RaceID3/StemID2 to predict cell types, lineage trajecto-
ries, and stemness (Herman et al., 2018). Unsupervised clustering with RaceID3 generated 17 clus-
ters. RaceID3 clusters with 10 cells or less were removed from subsequent analyses, and Seurat duct
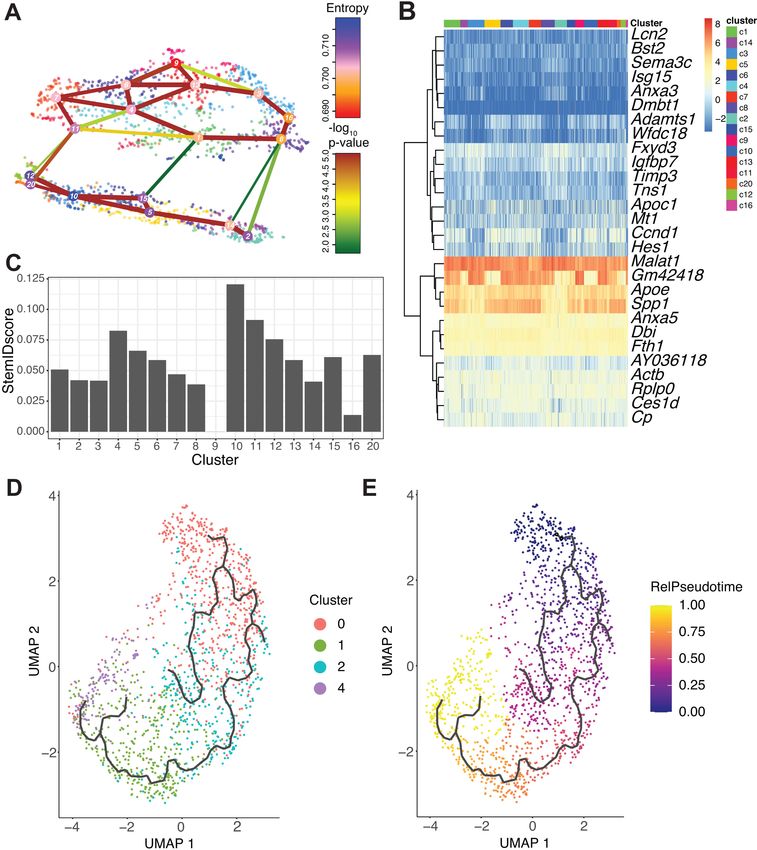
clusters 3 and 5 are not included in this analysis (Figure 4A, B). RaceID3 clusters with the highest
StemID2 score correlate to cells present in Seurat duct clusters 0 and 2 (Figure 4C and Figure 5—
figure supplement 1A, B). The variable StemID2 scores observed for cells within Seurat duct clus-
ters 0, 1, 2, and 4 suggest distinct stages of differentiation or maturation. Consistent with previous
literature, the pancreatic ductal cell progenitor niche is not restricted to a single cluster
(Qadir et al., 2020).
Pseudotime ordering identifies an epithelial-mesenchymal transition
(EMT) axis in pancreatic duct cells
To further examine the lineage relationships among pancreas duct subpopulations, we ordered cells
in pseudotime based on their transcriptional similarity (Cao et al., 2019). Monocle 3 analysis sug-
gested DBA+ duct clusters 3 and 5 were disconnected from the main pseudotime trajectory, so we
focused our analysis on DBA+ duct clusters 0, 1, 2, and 4 (Figure 5—figure supplement 1C).
Because RaceID3/StemID2 analysis suggested Seurat clusters 0 and 2 have the highest StemID
scores, we started the pseudotime ordering beginning with cluster 0 as Seurat clusters 0 and 2 are
juxtaposed in the Monocle 3 clustering (Figure 4D, E and Figure 5—figure supplement 1D).
In Monocle 3 analysis, genes with similar patterns of expression that vary over time across the
pseudotime trajectory are coalesced into modules (Figure 5A). We performed IPA and upstream
regulator analysis, a pairwise comparison, comparing select clusters within a module to analyze the
Hendley et al. eLife 2021;10:e67776. DOI: https://doi.org/10.7554/eLife.67776 10 of 29Research article Cell Biology Developmental Biology Figure 4. RaceID3/StemID2 predict clusters 0 and 2 have the highest progenitor potential. (A) The lineage tree inferred by StemID2 is shown in the RaceID3 clusters. Node color represents the level of transcriptome entropy, edge color describes the level of significance, and edge width describes link score. (B) Heat map depicts expression of top five differentially expressed genes in RaceID3 clusters with false discovery rate < 0.01 and fold change > 1.2. (C) StemID2 scores for RaceID3 clusters are graphed. (D) Monocle 3 clustering of murine DBA+ duct clusters 0, 1, 2, and 4 is depicted. (E) Figure 4 continued on next page Hendley et al. eLife 2021;10:e67776. DOI: https://doi.org/10.7554/eLife.67776 11 of 29
Research article Cell Biology Developmental Biology
Figure 4 continued
Each cell’s relative pseudotime value is depicted that is a measurement of the distance between its position along the trajectory and the starting point
(cluster 0).
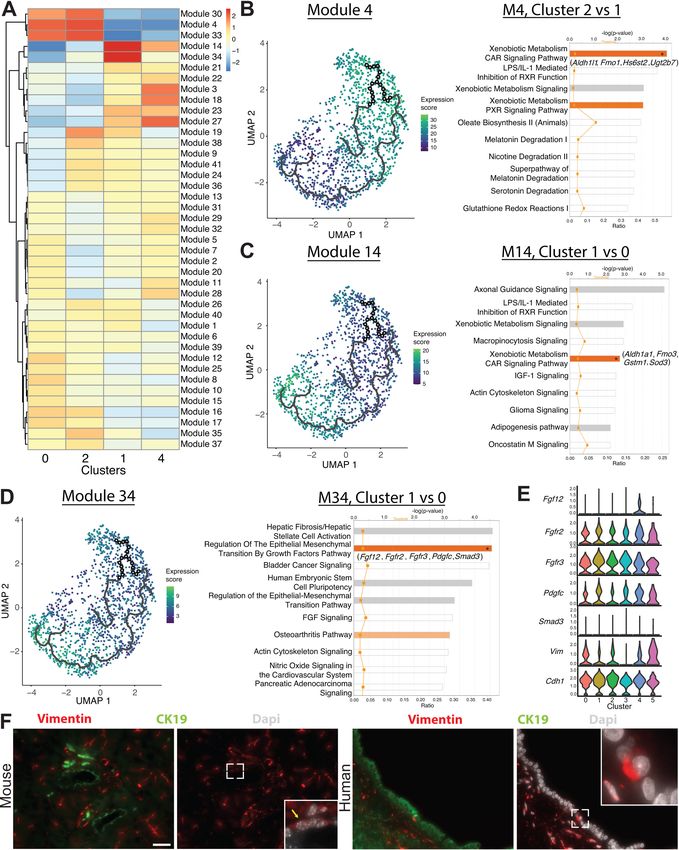
gene expression changes along the pseudotime trajectory (Figure 5B–D and Figure 5—source data
1–3). Examination of pathways deregulated in modules 4 and 14 showed a shift in the molecules
driving the xenobiotic metabolism CAR signaling pathway. The xenobiotic nuclear receptor CAR is
an important sensor of physiologic toxins and plays a role in their removal (Timsit and Negishi,
2007). The genes highlighted in the xenobiotic metabolism CAR signaling pathway were Aldh1b1,
Aldh1l1, Gstt2/Gstt2b, Hs6st2, and Ugt2b7 for clusters 0 and 2 and Aldh1a1, Fmo3, Gstm1, and
Sod3 for cluster 1, suggesting that these clusters might respond differently when exposed to toxins
or play heterogenous roles in endogenous toxin elimination (Figure 5B, C).
Regulation of the epithelial-mesenchymal transition by growth factors pathway was upregulated
in cluster 1 when compared to cluster 0 in module 34. Molecules altered in this pathway play variable
roles in promoting the epithelial or mesenchymal state and include Fgf12, Fgfr2, Fgfr3, Pdgfc, and
Smad3 (Figure 5D). When comparing clusters 0 and 1, examination of EMT markers Vim and Cdh1
showed a stronger probability of expression of Cdh1 in cluster 1 and a stronger probability of
expression of Vim in cluster 0 (Figure 5E). Using IF, we detected vimentin+, SNAI1+, and
fibronectin+ ductal cells in both mouse and human pancreas, providing evidence for this EMT axis
(Figure 5F, Figure 5—figure supplement 1E, and data not shown).
Osteopontin is required for mature human pancreas duct cell identity
Our analysis thus far reveals multiple transcriptional programs expressed by murine pancreatic duct
cells and predicts possible lineage relationships among them. Amidst the duct subpopulation
markers, Spp1 and Anxa3 caught our eye due to their known roles in pancreatic cancer progression
(Kolb et al., 2005; Adams et al., 2019; Wan et al., 2020); however, their functions in normal pan-
creatic duct epithelium have not been fully explored. Spp1, a marker of clusters 0 and 2, has been
shown by us and others to mark a pancreas duct cell type enriched in progenitor capacity
(Qadir et al., 2020; Kilic et al., 2006). Anxa3, a marker of clusters 1 and 4, inhibits phospholipase
A2 and cleaves inositol 1,2-cyclic phosphate-generating inositol 1-phosphate in a calcium-dependent
manner (Tait et al., 1993; Gerke and Moss, 2002). Gmnn expression is highly conserved and plays
crucial roles in development biology, yet its function in normal pancreatic duct cells is incompletely
understood (Kushwaha et al., 2016). Gmnn, a marker of cluster 0, acts to inhibit re-replication of
DNA during DNA synthesis by inhibiting the prereplication complex (McGarry and Kirschner, 1998;
Ballabeni et al., 2013). Understanding the function of a gene in normal physiology is central to dis-
secting its role in disease. To get a better understanding of the function of these subpopulation
markers in normal human pancreatic duct cells, we next examined the consequences of their loss in
the immortalized human pancreatic duct cell line HPDE6c7 (Ouyang et al., 2000). HPDE6c7 cells
demonstrate several features of normal pancreatic duct epithelium including gene expression of
MUC1, CA2, and KRT19 and have been used in many investigations as an in vitro model of ‘near nor-
mal’ human pancreatic duct cells (Ouyang et al., 2000; Furukawa et al., 1996; Qian et al., 2005;
Lee et al., 2017). We generated and validated SPP1, GMNN, and ANXA3 knockout (KO) HPDE6c7
lines using CRISPR/Cas9 (Figure 6A–C). Strong, consistent phenotypes were observed among differ-
ent KO lines for each gene despite some lines not demonstrating full loss of the protein (HPDE6c7
ANXA3 gRNA2 and HPDE6c7 SPP1 gRNAs 1–4). Cellular morphology was similar to the scrambled
(scr) gRNA control (Suzuki et al., 2016) for every KO line except HPDE6c7 SPP1 gRNAs 1–4, which
displayed a dramatic change in cellular morphology. HPDE6c7 SPP1 KO cells showed prominent fili-
podia and significantly increased proliferation when compared to the HPDE6c7 scr gRNA control, a
phenotype suggestive of increased progenitor function (Figure 6D, E). The change in cellular mor-
phology in HPDE6c7 SPP1 KO lines is accompanied by decreased duct function as measured by car-
bonic anhydrase activity (Figure 6F).
To assess the changes in HPDE6c7 SPP1 KO lines on a molecular scale, we performed bulk RNA-
sequencing on all four HPDE6c7 SPP1 KO lines and the HPDE6c7 scr gRNA control. A significant
increase in markers associated with EMT (VIM, ZEB1, TWIST1, MMP2) was observed in HPDE6c7
Hendley et al. eLife 2021;10:e67776. DOI: https://doi.org/10.7554/eLife.67776 12 of 29Research article Cell Biology Developmental Biology Figure 5. Monocle 3 analysis reveals an epithelial-mesenchymal axis in pancreatic duct cells. (A) Expression changes of the modules generated by Monocle 3 analysis are shown for each cluster. (B–D) Expression of modules 4, 14, and 34 along with select ingenuity pathways analysis results of the top 10 deregulated pathways are shown. Genes in parenthesis are altered in the pathway containing an asterisk in the bar. (E) Stacked violin plots show expression of genes in the regulation of the epithelial-mesenchymal transition by growth factors pathway in DBA+ duct clusters 0–5. (F) Figure 5 continued on next page Hendley et al. eLife 2021;10:e67776. DOI: https://doi.org/10.7554/eLife.67776 13 of 29
Research article Cell Biology Developmental Biology
Figure 5 continued
Immunofluorescence depicts CK19+ vimentin+ copositive pancreatic duct cells in mouse (yellow arrow) and human. The main pancreatic duct is shown
for humans. Scale bars are 50 mM.
The online version of this article includes the following source data and figure supplement(s) for figure 5:
Source data 1. Ingenuity pathways analysis results comparing select modules in Monocle 3 analysis.
Source data 2. Ingenuity pathways analysis upstream regulator analysis comparing select modules in Monocle 3 analysis.
Source data 3. Log fold change analysis comparing select modules in Monocle 3 analysis.
Figure supplement 1. RaceID3 clusters and Monocle 3 analysis.
SPP1 KO lines when compared to the control (Figure 6—source data 1–4, Figure 6G–H, and Fig-
ure 6—figure supplement 1A–C). Markers of mature duct cells (HNF1B, SOX9, KRT19) were signifi-
cantly downregulated in HPDE6c7 SPP1 KO lines when compared to the control (Figure 6G, I, J and
Figure 6—source data 1). Gene set enrichment analysis (GSEA) suggested positive enrichment of
pathways that regulate embryogenesis (Hox genes and Notch signaling) and cell cycle regulation in
HPDE6c7 SPP1 KO lines when compared to the HPDE6c7 scr gRNA control (Figure 6—figure sup-
plement 1D–F). Additionally, qPCR analysis demonstrated a significant increase in pancreatic pro-
genitor markers (Gu et al., 2004; Willmann et al., 2016) in HPDE6c7 SPP1 KO lines when compared
to the HPDE6c7 scr gRNA control, supporting the notion that loss of OPN leads to a more imma-
ture, progenitor-like state (Figure 6K). Taken together, these results define unique functional prop-
erties for markers that characterize murine DBA+ pancreas duct cells and suggest that SPP1 is an
essential regulator of human pancreatic duct cell maturation and function.
Transdifferentiation of pancreatic duct cells to endocrine cells at early postnatal stages and in
pancreatic injury models has been suggested by several studies (Bonner-Weir et al., 2008; Kim and
Lee, 2016). To query whether HPDE6c7 SPP1 KO progenitor-like, dedifferentiated duct cells harbor
the capacity to redifferentiate to endocrine cells in vivo, we injected HPDE6c7 SPP1 KO cell lines
and HPDE6c7 scr gRNA control cells subcutaneously into NSG mice (Figure 7A). After 5 days post-
injection, a-amylase+ CK19+ double-positive cells were evident in HPDE6c7 scr gRNA control cells,
but not in HPDE6c7 SPP1 KO cells (Figure 7B). This observation is consistent with the previously
described ducto-acinar axis characteristic of human pancreatic duct cells (Qadir et al., 2020). We
observed Neurogenin-3+SOX9+ copositive HPDE6c7 SPP1 KO cells, suggesting potential for differ-
entiation towards the endocrine lineage (Figure 7C). We detected Synaptophysin+ Glucagon+ as
well as Synaptophysin+ C-peptide+ double-positive HPDE6c7 SPP1 KO cells (Figure 7D, E). Expres-
sion of endocrine markers in subcutaneously injected HPDE6c7 scr gRNA cells was not observed at
day 5 post-injection. A small subset of C-peptide+ HPDE6c7 SPP1 KO cells express both PDX1 and
NKX6.1 (Figure 7E, F). Together, these data point to previously unappreciated roles for SPP1 in
maintaining duct cell properties and preventing changes in cell identity.
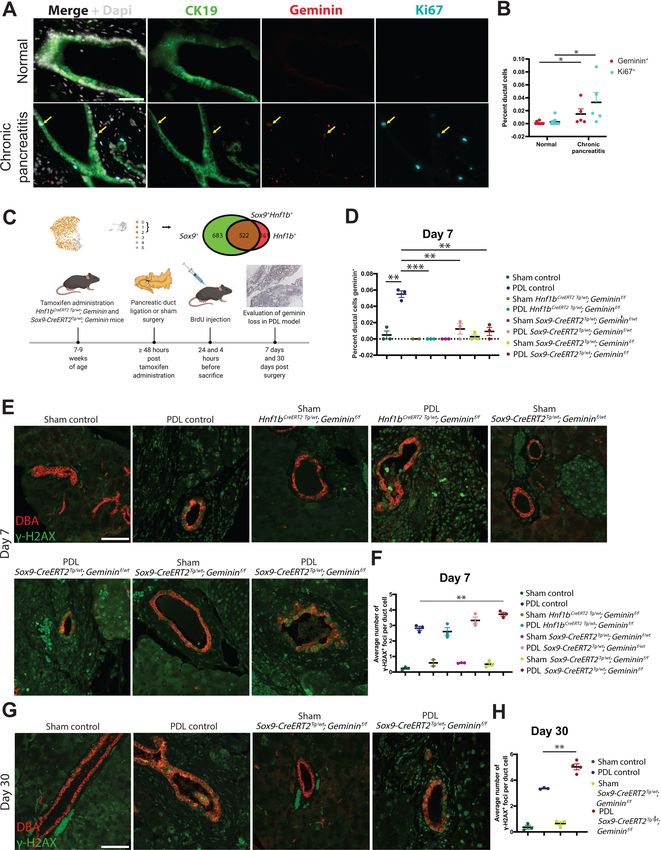
Geminin safeguards against accumulation of DNA damage in mouse
ductal cells in the setting of CP
One marker of the workhorse population of pancreatic duct cells Gmnn has previously been associ-
ated with chronic inflammatory diseases such as asthma (Garbacki et al., 2011). We therefore que-
ried its role in pancreas inflammatory disease. Gmnn binds to CDT1 and inhibits DNA replication
during the S phase. Geminin is a crucial regulator of genomic stability; its inhibition in multiple can-
cer cell lines leads to DNA re-replication and aneuploidy (Zhu and Depamphilis, 2009; Saxena and
Dutta, 2005). To determine the requirement for Gmnn in normal homeostatic pancreatic duct cells,
we generated a conditional Gmnn floxed allele and crossed the mouse to the Sox9-CreERT2
(Kopp et al., 2011) and Hnf1bCreERT2 (Solar et al., 2009) transgenic lines (Figure 8—figure supple-
ment 1). Adult mice, between the ages of 7–9 weeks, were injected with tamoxifen to ablate Gemi-
nin in mouse pancreatic duct cells. Tamoxifen-injected Sox9-CreERT2Tg/wt; Gemininf/f, Sox9-
CreERT2Tg/wt; Gemininf/wt, and Hnf1bCreERT2 Tg/wt; Gemininf/f mice displayed no histological abnor-
malities as assessed by hematoxylin and eosin (H&E) staining and no significant alterations in DNA
damage as assessed by ATR and g-H2AX IF up to 6 months post-tamoxifen injection (data not
shown). We were unsurprised by these findings, given the low proliferation rate of murine pancreatic
duct cells suggested by our single-cell data. Thus, Geminin may only be required in the context of
Hendley et al. eLife 2021;10:e67776. DOI: https://doi.org/10.7554/eLife.67776 14 of 29Research article Cell Biology Developmental Biology Figure 6. SPP1 loss promotes a progenitor-like state in human pancreatic duct cells. (A–C) Western blot and quantification of western blot images shows expression of Annexin A3, osteopontin, and geminin in knockout (KO) HPDE6c7 lines and the control. (D) Brightfield images show changes in cellular morphology of HPDE6c7 SPP1 KO lines. Yellow arrows point to filipodia. Scale bars are 100 mm. (E) Cell counting demonstrates a significant increase in cell number at day 6 in HPDE6c7 SPP1 KO cells when compared to the HPDE6c7 scrambled (scr) gRNA control (p=0.0089 for HPDE6c7 SPP1 Figure 6 continued on next page Hendley et al. eLife 2021;10:e67776. DOI: https://doi.org/10.7554/eLife.67776 15 of 29
Research article                                                                                           Cell Biology Developmental Biology

Figure 6 continued
gRNA1 and p=0.0042 for HPDE6c7 SPP1 gRNA2). (F) Significantly decreased carbonic anhydrase activity is observed in HPDE6c7 SPP1 KO lines when
compared to the control. (G) Relative fold changes calculated using rpm values of mesenchymal and duct markers are shown. Average counts
(normalized to library size) for SPP1 are 84.0 ± 47.3 (scr) and 2.1 ± 0.4 (KO), HNF1B are 434.9 ± 24.8 (scr) and 0.5 ± 0.3 (KO), SOX9 are 1,617.0 ± 87.2 (scr)
and 302.4 ± 35.3 (KO), KRT19 are 17,458.1 ± 2,367.2 (scr) and 60.7 ± 60.7 (KO), CLDN7 are 3,381.1 ± 222.9 (scr) and 17.6 ± 3.7 (KO), CDH1 are 8,995.8 ±
805.9 (scr) and 109.1 ± 29.0 (KO), and VIM are 84.1 ± 32.4 (scr) and 6,577.2 ± 513.7 (KO). (H) The top 14 deregulated pathways from ingenuity pathways
analysis are shown comparing HPDE6c7 SPP1 KO vs. HPDE6c7 scr gRNA control. (I) Immunocytochemistry (ICC) demonstrated reduced osteopontin
expression in HPDE6c7 gRNA2 and HPDE6c7 SPP1 gRNA4 when compared to HPDE6c7 scr gRNA. Vimentin ICC depicts organized intermediate
filaments in HPDE6c7 SPP1 gRNA2 and HPDE6c7 SPP1 gRNA4 while HPDE6c7 scr gRNA cells show diffuse, light labeling. Scale bar is 50 mm. (J) CK19
ICC shows organized intermediate filaments in HPDE6c7 scr gRNA cells while HPDE6c7 SPP1 gRNA2 and HPDE6c7 SPP1 gRNA4 cells display punctate
CK19 labeling, where present. Scale bar denotes 50 mm. (K) qPCR results of pancreatic progenitor markers are shown for HPDE6c7 scr gRNA control
and HPDE6c7 SPP1 KO lines.
The online version of this article includes the following source data and figure supplement(s) for figure 6:
Source data 1. Differentially expressed genes comparing HPDE6c7 SPP1 knockout vs. HPDE6c7 scrambled gRNA.
Source data 2. Ingenuity pathways analysis results comparing HPDE6c7 SPP1 knockout vs. HPDE6c7 scrambled gRNA.
Source data 3. Ingenuity pathways analysis upstream regulator analysis comparing HPDE6c7 SPP1 knockout vs. HPDE6c7 scrambled gRNA.
Source data 4. Filtered normalized (to library size) counts for RNA-seq of HPDE6c7 scr gRNA and HPDE6c7 SPP1 knockout cell lines.
Figure supplement 1. Characterization of DBA+ murine ductal markers.

                                      pathologies characterized by increased proliferation in the pancreas such as pancreatitis or PDA
                                      (Salabat et al., 2008).
                                          We examined proliferation in human pancreas duct cells in CP patients (N = 5 patients) and found
                                      a significant increase in geminin expression when compared to normal human pancreatic duct cells
                                      (N = 10 donors) (Figure 8A, B). Pancreatic duct ligation (PDL), an experimental technique that reca-
                                      pitulates features of human gallstone pancreatitis, results in an increase in proliferation of rat pancre-
                                      atic duct cells (Githens, 1988; Walker and Pound, 1983). To investigate the role of Geminin in
                                      mouse pancreatic duct cells in the setting of CP, we performed PDL on Sox9-CreERT2Tg/wt; Gemi-
                                      ninf/f, Sox9-CreERT2Tg/wt; Gemininf/wt, Hnf1bCreERT2 Tg/wt; Gemininf/f and littermate control mice
                                      (Figure 8C). As in the human setting, we also observed upregulation of Geminin in ductal epithelium
                                      in the control PDL mouse group (Figure 8D). Previously reported features of the PDL model were
                                      evident in our transgenic mice including replacement of parenchymal cells with adipose tissue,
                                      inflammation, and fibrosis (Aghdassi et al., 2011; Rastellini et al., 2015; Figure 8—figure supple-
                                      ment 2A, B). Significant attenuation of Geminin expression was observed in Sox9-CreERT2Tg/wt;
                                      Gemininf/f, Sox9-CreERT2Tg/wt; Gemininf/wt, and Hnf1bCreERT2 Tg/wt; Gemininf/f mouse pancreatic
                                      duct cells when compared to controls (Figure 8D and Figure 8—figure supplement 3A). Homozy-
                                      gous Gmnn loss in SOX9+ pancreatic ductal cells promoted an acute increase in proliferation, as
                                      assessed by BrdU incorporation, at day 7, which became insignificant at day 30 (Figure 8—figure
                                      supplement 3B-E). No changes were observed in apoptosis for any model or time point when com-
                                      pared to controls as assessed by cleaved caspase-3 IF (data not shown). Examination of duct cell
                                      DNA damage by g-H2AX IF showed significantly increased g-H2AX foci in Sox9-CreERT2Tg/wt; Gemi-
                                      ninf/f mice at day 7, an observation that was sustained at day 30 (Figure 8E–H). Assessment of DNA
                                      damage in Sox9-CreERT2Tg/wt; Gemininf/f, Sox9-CreERT2Tg/wt; Gemininf/wt, and Hnf1bCreERT2 Tg/wt;
                                      Gemininf/f mice by ATR IF showed no significant changes (data not shown). The lack of phenotypes
                                      observed in the Hnf1bCreERT2 Tg/wt; Gemininf/f model may be due to differences in recombination
                                      induced by the Sox9-CreERT2 and Hnf1bCreERT2 lines since fewer pancreatic duct cells express
                                      HNF1B (Figure 1—figure supplement 1G and Figure 8C). Taken together, these data suggest
                                      that Geminin is an important regulator of genomic stability in pancreatic ducta cells in the setting of
                                      CP.

                                      Discussion
                                      We present a single-cell transcriptional blueprint of murine pancreatic duct cells, intrapancreatic bile
                                      duct cells, and pancreatobiliary cells. Notably, our single-cell analysis indicated that endothelial cells,
                                      fibroblasts, and immune cells are also obtained using the DBA+ lectin sorting strategy
                                      (Reichert et al., 2013) and suggests that a subsequent ductal purification step is required to obtain

Hendley et al. eLife 2021;10:e67776. DOI: https://doi.org/10.7554/eLife.67776                                                                         16 of 29
Research article Cell Biology Developmental Biology Figure 7. HPDE SPP1 knockout (KO) cells are capable of differentiating into cells with endocrine appearance, including cells exhibiting a- and b-like appearance, but not duct-like or acinar-like cells in vivo. (A) Schematic of in vivo experiment. (B) Immunofluorescence (IF) shows CK19+ a-amylase+ double-positive HPDE6c7 scrambled (scr) gRNA cells. (C) IF depicts NGN3+ SOX9+ double-positive HPDE6c7 SPP1 KO cells (yellow arrows). (D) Synaptophysin+ Glucagon+ double-positive cells (yellow arrows) are detected in HPDE6c7 SPP1 KO cells. (E) C-peptide, synaptophysin, NKX6.1, and Figure 7 continued on next page Hendley et al. eLife 2021;10:e67776. DOI: https://doi.org/10.7554/eLife.67776 17 of 29
Research article                                                                                     Cell Biology Developmental Biology

Figure 7 continued
PDX1 expression are evident in HPDE6c7 SPP1 KO cells. C-peptide, synaptophysin, and PDX1 triple-positive cells are highlighted with yellow arrows. (F)
The percentage of C-peptide+, NKX6.1+, and PDX1+ triple-positive cells for HPDE6c7 scr gRNA cells is 0, HPDE6c7 SPP1 gRNA2 is 1.343 ± 0.266, and
HPDE6c7 SPP1 gRNA 4 cells is 1.642 ± 0.153. All scale bars in this figure are 50 mm.

                                    pure pancreatic duct cells using this protocol. A static transcriptional picture in time has highlighted
                                    a very dynamic view of pancreas duct cell heterogeneity. Our study provokes reinterpretation of sev-
                                    eral previously published lineage tracing reports using ductal-specific Cre mouse lines and will help
                                    plan future lineage tracing studies.
                                        Cluster 0 workhorse pancreatic duct cells comprise the largest pancreatic duct subpopulation
                                    identified. Although clusters 0 and 2 share many markers, we found compelling differences in meta-
                                    bolic states as manifested in part by an overall lower gene and transcript count for cluster 2. IPA sug-
                                    gested that subpopulations of pancreatic duct cells may use different predominant mechanisms for
                                    bicarbonate secretion such as CFTR (Ishiguro et al., 2009) for cluster 0 and calcium signaling for
                                    cluster 1 (Ishiguro et al., 2012). One notable difference between clusters 0 and 2 vs. 1 is the mole-
                                    cules that regulate the xenobiotic metabolism CAR signaling pathway. We observed expression of
                                    several genes, whose alteration contributes to PDA progression including Tgfb2 and Ctnnb1 in clus-
                                    ter 0 and Ppp1r1b, Smarca4, and Tgfb1 in cluster 1. IPA upstream regulator analysis of Monocle 3
                                    module 14 predicted significant inhibition of Kras in cluster 1 when compared to cluster 0. Addition-
                                    ally, IPA upstream regulator analysis comparing cluster 2 vs. 0 in module 19 predicted activation of
                                    Myc and Mycn in cluster 2. These genes play central roles in homeostasis of pancreatic duct cells,
                                    and it is possible that distinct ductal cell subpopulations that are actively expressing these pathways
                                    may have different predispositions to PDA with mutations in these genes, heterogeneity which may
                                    also contribute to the development of different subtypes of PDA.
                                        The role of Spp1 in homeostatic pancreatic duct cells has been elusive since Spp1 KO mice have
                                    no apparent pancreatic duct phenotypes (Kilic et al., 2006). We identified an EMT axis in pancreatic
                                    duct cells using Monocle 3 and validated this observation in mouse and human duct cells. Spp1 is
                                    one gatekeeper of this epithelial to mesenchymal transitory duct phenotype as manifested by loss of
                                    ductal markers, reduced duct function, and upregulation of EMT genes in HPDE6c7 SPP1 KO cells
                                    when compared to controls. Clusters 0 and 2, characterized by strong expression of Spp1, show the
                                    highest StemID2 scores. SPP1 KO HPDE6c7 cells display prominent filipodia and the highest prolifer-
                                    ative capacity of all markers examined when compared to the control. Taken together, these pheno-
                                    types, along with upregulation of pathways regulating mammalian development (Notch signaling
                                    and Hox genes) manifested by GSEA, suggest that SPP1 loss promotes human duct cell
                                    dedifferentiation.
                                        During pancreas development, the multipotent epithelial progenitors become increasingly com-
                                    partmentalized into tip and trunk progenitors that give rise to acinar and endocrine/ductal cells,
                                    respectively (Zhou et al., 2007). Our data suggest that OPN-deficient HPDE6c7 cells dedifferentiate
                                    into a trunk, and not tip, progenitor-like cell and that redifferentiation of HPDE6c7 SPP1 KO cells to
                                    a human pancreatic duct or acinar cell lineage is not favored in vivo. These data underscore the
                                    requirement for OPN expression for mature human pancreas duct cell identity. It has been hypothe-
                                    sized that SPP1’s role in mature pancreatic duct cells is evident during pathogenesis. Several groups
                                    have already nicely shown that Spp1 plays important roles in pancreatic pathologies including PDA
                                    (Adams et al., 2019; Zhao et al., 2018). In human pancreas duct cells, the subpopulation character-
                                    ized by SPP1 expression is described as ‘stress/harboring progenitor-like cells’ (Qadir et al., 2020).
                                    We observed significant deregulation of 14 cancer-related IPA pathways for which pathway direc-
                                    tionality was known in HPDE6c7 SPP1 KO lines vs. HPDE6c7 scr gRNA controls. 13/14 of these can-
                                    cer-related pathways, including pancreatic adenocarcinoma signaling, were in a direction suggestive
                                    that SPP1 loss protects against tumor progression in human pancreatic duct cells. These findings are
                                    in agreement with published studies suggesting that SPP1 loss ameliorates aggressiveness of pan-
                                    creatic cancer cells (Kolb et al., 2005; Adams et al., 2019) and colon cancer cells (Zhao et al.,
                                    2018; Ishigamori et al., 2017).
                                        The requirement for Geminin in the prevention of DNA re-replication initiation has been postu-
                                    lated to be when cells are stressed to divide quickly (Barry et al., 2012). We were unable to detect
                                    DNA damage with Geminin loss in homeostatic pancreatic duct cells, which may be due to the low

Hendley et al. eLife 2021;10:e67776. DOI: https://doi.org/10.7554/eLife.67776                                                                 18 of 29
You can also read