Sensitivities to biological aerosol particle properties and ageing processes: potential implications for aerosol-cloud interactions and optical ...
←
→
Page content transcription
If your browser does not render page correctly, please read the page content below
Atmos. Chem. Phys., 21, 3699–3724, 2021
https://doi.org/10.5194/acp-21-3699-2021
© Author(s) 2021. This work is distributed under
the Creative Commons Attribution 4.0 License.

Sensitivities to biological aerosol particle properties
and ageing processes: potential implications for
aerosol–cloud interactions and optical properties
Minghui Zhang, Amina Khaled, Pierre Amato, Anne-Marie Delort, and Barbara Ervens
Université Clermont Auvergne, CNRS, SIGMA Clermont, Institut de Chimie de Clermont-Ferrand,
63000 Clermont-Ferrand, France

Correspondence: Minghui Zhang (minghui.zhang@uca.fr) and Barbara Ervens (barbara.ervens@uca.fr)

Received: 27 July 2020 – Discussion started: 13 August 2020
Revised: 22 December 2020 – Accepted: 1 February 2021 – Published: 11 March 2021

Abstract. Primary biological aerosol particles (PBAPs),            1   Introduction
such as bacteria, viruses, fungi, and pollen, represent a small
fraction of the total aerosol burden. Based on process model       Although primary biological aerosol particles (PBAPs) con-
studies, we identify trends in the relative importance of          tribute a small fraction (50 Tg yr−1 , with an upper limit of
PBAP properties, e.g., number concentration, diameter, hy-         1000 Tg yr−1 ) to the total natural global aerosol emissions of
groscopicity, surface tension, and contact angle, for their        ∼ 2900–13 000 Tg yr−1 (Stocker et al., 2013), they have at-
aerosol–cloud interactions and optical properties. While the       tracted great interest in the atmospheric science and public
number concentration of PBAPs likely does not affect to-           health communities as they might affect the climate and be
tal cloud condensation nuclei (CCN) concentrations globally,       responsible for spreading diseases (Asadi et al., 2020; Be-
small changes in the hygroscopicity of submicron PBAPs             hzad et al., 2018; Khaled et al., 2021). They consist of bac-
might affect their CCN ability and thus their inclusion into       teria, proteins, viruses, fungi, pollen, and other biologically
clouds. Given that PBAPs are highly efficient atmospheric          derived materials with potentially infectious, allergenic, or
ice nuclei (IN) at T > −10 ◦ C, we suggest that small changes      toxic properties (Fröhlich-Nowoisky et al., 2016).
in their sizes or surface properties due to chemical, physical,       Their mass (Graham et al., 2003; Heald and Spracklen,
or biological processing might translate into large impacts        2009), number concentrations (Huffman et al., 2013;
on ice initiation in clouds. Predicted differences in the direct   Matthias-Maser et al., 1999; Forde et al., 2019a), and frac-
interaction of PBAPs with radiation can be equally large be-       tions (Jaenicke, 2005) can greatly vary depending on lo-
tween different species of the same PBAP type and among            cation (Schumacher et al., 2013; Shen et al., 2019; Wei
different PBAP types. Our study shows that not only vari-          et al., 2016; Yu et al., 2016), time of day (Kang et al.,
ability of PBAP types but also their physical, chemical, and       2012), and other conditions (Chow et al., 2015; Jiaxian et al.,
biological ageing processes might alter their CCN and IN ac-       2019; Wu et al., 2016; Forde et al., 2019b). For example,
tivities to affect their aerosol–cloud interactions and optical    in the Amazonian rainforest, PBAPs contribute ∼ 20 % to
properties. While these properties and processes likely affect     the mass of submicron organic aerosol (Schneider et al.,
radiative forcing only on small spatial and temporal scales,       2011). In the semirural area of Mainz in central Europe,
we highlight their potential importance for PBAP survival,         the number fraction was 1 %–50 % for particles with diame-
dispersion, and transport in the atmosphere.                       ter (D) > 0.4 µm (Jaenicke, 2005). Above the ocean, 1 % of
                                                                   particles with 0.2 µm < D < 0.7 µm contain biological ma-
                                                                   terials (Pósfai et al., 1998). Temporal variability of PBAPs
                                                                   was observed exhibiting peaks in the morning and during
                                                                   and after rain (Huffman et al., 2013; Zhang et al., 2019).
                                                                   To the total global PBAP emissions, bacteria contribute

Published by Copernicus Publications on behalf of the European Geosciences Union.
3700                              M. Zhang et al.: Sensitivities to biological aerosol particle properties and ageing processes

Figure 1. Schematic of the influence of PBAP properties and ageing processes on direct and indirect radiative effects. (a) The direct radiative
forcing might be influenced by PBAP concentration (NPBAP ), diameter (DPBAP ), refractive index (mPBAP = n+ik), surface tension (σPBAP ),
and hygroscopicity (κPBAP ) at RH < 100 %. (b) NPBAP , DPBAP , σPBAP , and κPBAP might affect CCN activity and properties of warm clouds.
(c) NPBAP , DPBAP , and contact angle of ice germ on the particle (θPBAP ) might affect the evolution of mixed-phase clouds.

0.4–1.8 Tg yr−1 , which is less than 25–31 Tg yr−1 by fun-                diative properties. Their hygroscopicity shows a large range
gal spores (Heald and Spracklen, 2009; Hoose et al., 2010)                (0.03 ≤ κPBAP ≤ 0.25), which is explained by variation of
and 47 Tg yr−1 by pollen (Burrows et al., 2009a, b). Although             surface composition due to different types of PBAPs and/or
the mass fraction of bacteria is small, their number con-                 ageing processes (Bauer et al., 2003; Haddrell and Thomas,
centration (∼ 0.001–1 cm−3 ) (Lighthart and Shaffer, 1995;                2017; Šantl-Temkiv et al., 2020; Sun and Ariya, 2006).
Tong and Lighthart, 2000) is larger than that of fungal spores               Convective and precipitating clouds lead to efficient par-
(∼ 0.001–0.01 cm−3 ) and pollen (∼ 0.001 cm−3 ) (Huffman                  ticle redistribution by vertical transport and removal of par-
et al., 2010). The concentration of viruses can reach up to               ticles by wet deposition. Therefore, cloud-related physico-
∼ 0.1 cm−3 in indoor air (Prussin et al., 2015) and decreases             chemical properties need to be constrained to determine the
to ∼ 0.01 cm−3 outdoors (Després et al., 2012; Weesendorp                 distribution and residence time of PBAPs in the atmosphere.
et al., 2008). The comparably small size of viruses and bac-              Since PBAPs often have supermicron sizes, they may act as
teria (Dviruses ∼ 0.1 µm, Dbacteria ∼ 1 µm) enables relatively            “giant CCN” and thus induce early precipitation (Barahona
long residence times of several days in the atmosphere (Bur-              et al., 2010; DeLeon-Rodriguez et al., 2013; Feingold et al.,
rows et al., 2009a; Verreault et al., 2008).                              1999). Based on a global model study, it was concluded that
   In numerous recent review articles, it has been suggested              CCN-relevant properties need to be refined in order to fur-
that PBAPs can affect radiative forcing in multiple ways                  ther probe their role in the climate system (Konstantinidis,
(Fig. 1) (Coluzza et al., 2017; Després et al., 2012; Haddrell            2014). In particular pollen rupture leads to a huge increase in
and Thomas, 2017; Hu et al., 2018; Šantl-Temkiv et al., 2020;             the number of subpollen particles (SPPs) (Bacsi et al., 2006;
Smets et al., 2016): PBAPs might directly interact with radi-             Suphioglu et al., 1992; Taylor et al., 2002, 2004; Wozniak
ation by scattering or absorbing light (Fig. 1a). While their             et al., 2018). By assuming that one pollen grain releases up
aerosol direct effect is likely globally small due to low PBAP            to 106 SPPs, regional model studies suggested that the re-
number concentration (Löndahl, 2014), it may be of greater                sulting SPPs can significantly suppress seasonal precipitation
interest locally and for specific wavelength ranges due to                (Wozniak et al., 2018). Several experimental studies have ex-
the large size of PBAPs (Myhre et al., 2014). The optical                 plored the CCN properties of PBAPs and determined their
properties of PBAPs (Arakawa et al., 2003; Hu et al., 2019;               hygroscopicity (κ) (Ariya et al., 2009; Sun and Ariya, 2006).
Thrush et al., 2010) resemble those of other organic parti-               The role of biosurfactant production by bacteria and fungi
cles as PBAPs are largely composed of proteins and other                  has been also discussed in the context of their CCN activity
macromolecules. Accordingly, PBAP optical properties can                  since a lower surface tension (σPBAP ) enhances water uptake
be ascribed to specific organic functional entities such as               (Renard et al., 2016). In addition, biosurfactant molecules
amino groups or aromatic structures (Hill et al., 2015; Hu                that are produced by bacteria and fungi, while they reside
et al., 2019). At subsaturated relative humidity (RH) con-                on leaves or other surfaces, might attach to other particles,
ditions, the hygroscopicity (κPBAP ) determines their ability             thus increasing their CCN ability as well.
to take up water (Petters and Kreidenweis, 2007) and thus                    In addition to acting as CCN, some species of bacte-
their equilibrium size, which might affect their direct ra-               ria, fungi, and pollen can nucleate ice at high temperatures

Atmos. Chem. Phys., 21, 3699–3724, 2021                                                      https://doi.org/10.5194/acp-21-3699-2021
M. Zhang et al.: Sensitivities to biological aerosol particle properties and ageing processes                                3701

(Hoose and Möhler, 2012; Morris et al., 2004, 2008; Pouzet              Horneck et al., 1994; Joly et al., 2015; Setlow, 2007)
et al., 2017; Diehl et al., 2001, 2002), which makes them               or to limit their atmospheric residence time by ini-
unique in terms of ice nucleation to affect the evolution of            tiating precipitation (Hernandez and Lindow, 2019).
mixed-phase clouds at these temperatures (Fig. 1c). Above               These processes include nutrient uptake by biodegra-
vegetated forests (Tobo et al., 2013) and near the surface of           dation (Khaled et al., 2021); bacteria cell generation
the Southern Ocean (Burrows et al., 2013), PBAPs have been              that enhances particle size and surface area (Ervens
shown to contribute significantly to the total abundance of ice         and Amato, 2020); formation of biofilms (extracellular
nuclei (IN). In a high-altitude mountain region of the United           polymeric substances), which enables PBAPs to form
States, ambient measurements suggest that 16 % to 76 % of               aggregates (Monier and Lindow, 2003, 2005; Morris
IN at −30 ◦ C consist of primary biological material (Prenni            et al., 2008; Sheng et al., 2010); expression of ice-
et al., 2009); a similar proportion (33 %) was reported at −31          nucleating proteins (Joly et al., 2013; Kjelleberg and
to −34 ◦ C in the Amazon basin (Pratt et al., 2009).                    Hermansson, 1984); formation of biosurfactants that
   The radiative impacts of PBAPs, influenced by the                    enhances water uptake (Hernandez and Lindow, 2019;
physicochemical properties (NPBAP , DPBAP , κPBAP , σPBAP ,             Neu, 1996); desiccation that decreases size of PBAPs
mPBAP , θPBAP ), summarized in Fig. 1, can largely differ on            (Barnard et al., 2013); formation of pigments (Pšenčík
spatial and temporal scales, leading to different conclusions           et al., 2004; Fong et al., 2001) enhancing light absorp-
regarding the climatic impacts of PBAPs (Burrows et al.,                tion and fungal spore germination (Ayerst, 1969); for-
2009a, b; Hoose et al., 2010; Junge and Swanson, 2008; Kon-             mation of bacteria endospores (Enguita et al., 2003) that
stantinidis, 2014; Sahyoun et al., 2017; Sesartic et al., 2012).        increases NPBAP ; and the metabolism of cellular com-
These properties are even more variable than represented in             ponents (membranes, proteins, saccharides, osmolytes,
current models as PBAPs undergo chemical, physical, and bi-             etc.) (Fox and Howlett, 2008; Xie et al., 2010). To date,
ological ageing processes (Coluzza et al., 2017; Deguillaume            the uncertainties introduced by these PBAP ageing pro-
et al., 2008; Pöschl, 2005; Vaïtilingom et al., 2010).                  cesses in the estimate of PBAP radiative effects, their at-
                                                                        mospheric residence time, and distribution can only be
  – Physical transformations include agglomeration and/or               assessed qualitatively due to the lack of comprehensive
    fragmentation of cells (Coluzza et al., 2017; Lighthart,            data. However, it may be expected that some of these
    1997; Zhang et al., 2019), coating with organic or in-              ageing processes lead to similar differences in PBAP
    organic components (Pöschl and Shiraiwa, 2015; Joly                 properties than to differences between PBAP types.
    et al., 2015), or coating with solid ice or liquid water
    (Joly et al., 2013). These processes might alter various       In our study, we give a brief overview of the PBAP proper-
    physicochemical properties listed in Fig. 1. For exam-         ties in Fig. 1 and summarize which chemical, physical and
    ple, the breakup of pollen or fungi due to rupture can         biological processes may alter these properties (Sect. 2). By
    lead to higher number concentrations by several orders         means of process models (Sect. 3), we explore in a simplis-
    of magnitude (Suphioglu et al., 1992; Wozniak et al.,          tic way the relative importance of these PBAP properties and
    2018).                                                         ageing processes for the effects depicted in Fig. 1 (Sect. 4).
                                                                   Our model sensitivity studies are set up such that we iden-
  – Chemical transformations include oxidation (Jayara-            tify trends and their relative importance to show the sensi-
    man et al., 2008; Vaïtilingom et al., 2010), nitration         tivities to individual properties and ageing processes that im-
    (Franze et al., 2005), oligomerization (Tolocka et al.,        pact PBAP properties in the atmosphere. The results of our
    2004), degradation of macromolecules (Estillore et al.,        sensitivity studies allow for a ranking of the importance of
    2016), and changes of the protein conformations due to         the various PBAP properties and processes in terms of their
    exposure to different pH (Kristinsson and Hultin, 2004).       aerosol–cloud interactions and optical properties (Sect. 5).
    These processes lead to the modification of the pro-           Finally, we give some guidance on the need of future labo-
    tein structures and other macromolecules and thus af-          ratory, field, and model studies to more accurately describe
    fect PBAP optical properties (Myhre et al., 2014), CCN         potential radiative effects, distribution, and residence time of
    activity (Sun and Ariya, 2006), and IN ability (Attard         PBAPs in the atmosphere.
    et al., 2012; Kunert et al., 2019).
  – Biological processes might be initiated by living mi-          2   Physicochemical properties and processes of PBAPs
    croorganisms in PBAPs, unlike in other aerosol par-
    ticles in the atmosphere (Amato et al., 2017; Delort           Literature data on physicochemical parameters of PBAPs are
    et al., 2017; Joly et al., 2015). Such processes are gen-      summarized in Table 1. It is not our goal to repeat exhaus-
    erally driven by strategies to adapt to the harsh con-         tive reviews on these individual properties; for this, we re-
    ditions in the atmosphere (e.g., rapid temperature and         fer to previous overview articles (Bauer et al., 2003; Coluzza
    RH changes, thaw–freeze cycles, humidification and             et al., 2017; Deguillaume et al., 2008; Després et al., 2012;
    desiccation, UV exposure) (Hamilton and Lenton, 1998;          Fröhlich-Nowoisky et al., 2016; Hoose and Möhler, 2012;

https://doi.org/10.5194/acp-21-3699-2021                                            Atmos. Chem. Phys., 21, 3699–3724, 2021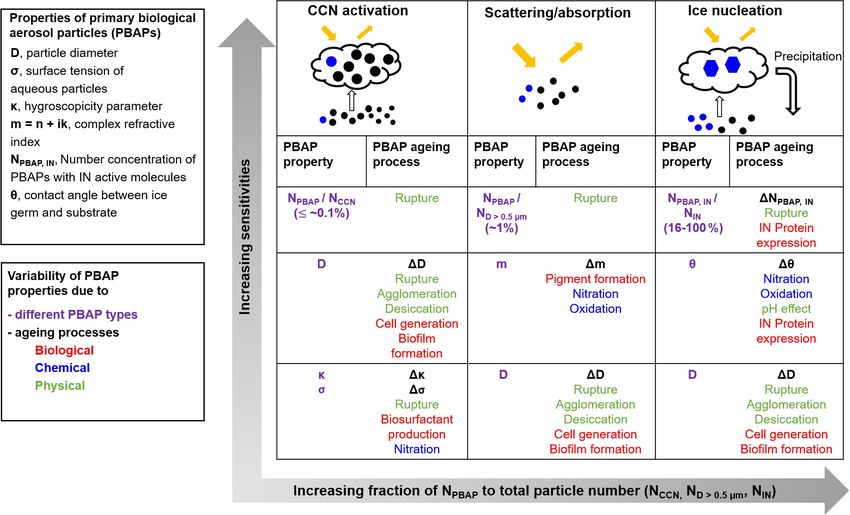
3702                                                  M. Zhang et al.: Sensitivities to biological aerosol particle properties and ageing processes

Table 1. Physicochemical properties of various types of PBAPs and their changes due to physical, chemical, and biological ageing processes
based on literature data.

 PBAP                                                                                                     Physicochemical properties
 types
                    Concentration N                Diameter D               Complex refractive                         Hygroscopicity κ            Surface tension σ              Number fraction               Contact
                    (cm−3 )                        (µm)                     index m(λ) = n + ik                                                    (mN m−1 )                      of PBAPs with IN              angle θ (◦ )
                                                                                                                                                                                  active molecules
 Bacteria           0.001–1 (1)                    1 (17)                   n: 1.5–1.56,                               0.11–0.25 (27)              25, 30, 55, 72 (35)            ∼ 0.1 %,                      32–34 (39);
                                                   0.6–7 (18)               k: 3 × 10⁻⁵ –6 × 10⁻⁴ (24);                                                                           ∼ 1 %,                        4–20 (40);
                                                                            n: 1.5–1.56,                                                                                          ∼ 10 % (36)                   28, 33, 44 (41)
                                                                            k: 0–0.04 (25);
                                                                            n: 1.25–1.87,
                                                                            k: 0–0.5 (26)
 Fungal             0.001–0.01 (2)                 3–5 (4);                 n: 1.25–1.75,                                                                                                                       30–33 (42)
 spores                                            1–30 (5)                 k: 0–0.32 (26)
 Subfungi           150–455 (3)                    0.01–0.1 (3);
 particles                                         0.02–0.05 (3);
 (SFPs)                                            0.03–0.9 (19)
 Fern spores        10−5 (4)                       1–30 (4)
 Pollen             0.001 (5)                      5–100 (20)               n:1.3–1.75,                                0.03–0.073 (28);                                           ∼ 100 % (37, 38)              14–30 (40);
                                                                            k: 0.01–0.2 (26)                           0.036–0.048 (29);                                                                        15, 16.3 (43)
                                                                                                                       0.05–0.1 (30);
                                                                                                                       0.08–0.17 (31)
 Subpollen          0.1 (6)                        1–4 (6);                                                            0.14–0.24 (32);
 particles                                         0.03–4 (21);                                                        0.12–0.13 (33);
 (SPPs)                                            0.12–4.67 (22)                                                      0.1–0.2 (34)
 Viruses            0.01 (4)                       0.01–0.3 (4);
                                                   0.04–0.2 (23)
 Ambient            0.1–1 (7);                     > 0.4 (7, 8)
 PBAPs              1–8 (8)
 Ambient            0.2–1.2 (9);                   > 1 (9–16)
 PBAPs              0.04–0.13 (10);
                    0.012–0.095 (11);
                    0.01–1.4 (12);
                    0.57–3.3 (13);
                    0.1–0.43 (14);
                    0.02–0.09 (15);
                    0.005–0.5 (16)
                                                                                                          Ageing processes of PBAPs
                                   Physical ageing                                                Chemical ageing                                                               Biological ageing
 Bacteria           Agglomeration: 1D > 0, 1N < 0                           Nitration: 1n > 0, 1k > 0 (44);                                        Biosurfactant production: σ < 0 (35);
                    (18)                                                    Nitration: 1θ ∼ 1◦ (41);                                               Biofilm formation: 1D > 0 (45);
                                                                            pH changes:                                                            Endospore formation: 1N > 0 (46);
                                                                            1θ ∼ 1.5◦ (41)                                                         Cell generation: 1D > 0 (47);
                                                                                                                                                   Desiccation: 1D < 0 (48);
                                                                                                                                                   Pigment formation : 1k > 0 (49, 50);
                                                                                                                                                   IN protein expression: 1θ < 0 (no data yet)
 Fungi              Rupture: 1D < 0, 1N > 0 (3, 19)                                                                                                Biosurfactant production: σ < 0 (35);
                                                                                                                                                   Germination: 1N > 0 (49);
                                                                                                                                                   Desiccation: 1D < 0 (48)
 Pollen             Rupture: 1D < 0,                                        Oxidation: 0.5◦ ≤ 1θ ≤ 0.8◦ (43)
                    1N > 0 (6, 21, 22)

(1) Total bacteria, Tong and Lighthart (1999); (2) Elbert et al. (2007); (3) after rainfall, Lawler et al. (2020); (4) Després et al. (2012); (5) blooming times, Huffman et al. (2010); (6) thunderstorm times, Zhang et al. (2019);
(7) based on protein dyes, Lake Baikal, Russia, Jaenicke (2005); (8) based on protein dyes, Mainz, Germany, Jaenicke (2005); (9) in the Amazon, Whitehead et al. (2016); (10) in the Amazon, Huffman et al. (2012); (11) Puy de
Dôme, Gabey et al. (2013); (12) in megacity Beijing, China, Wei et al. (2016); (13) in megacity Nanjing, China, Yu et al. (2016); (14) high altitude, Ziemba et al. (2016); (15) high altitude, Perring et al. (2015); (16) high
concentration observed during and after rain, Huffman et al. (2013); (9) to (16) are based on autofluorescence of PBAPs; (17) Burrows et al. (2009a); (18) Lighthart 1997; (19) China et al. (2016); (20) Pöhlker et al. (2013);
(21) Taylor et al. (2004); (22) Taylor et al. (2002); (23) Verreault et al. (2008); (24) Arakawa et al. (2003); (25) Thrush et al. (2010); (26) Hu et al. (2019); (27) Lee et al. (2002); (28) Pope (2010); (29) Tang et al. (2019);
(30) Chen et al. (2019); (31) Griffiths et al. (2012); (32) pollenkitt, Prisle et al. (2019); (33) Mikhailov et al. (2019); (34) Mikhailov et al. (2020); (35) Renard et al. (2016); (36) T ∼ −10 ◦ C, immersion freezing, Pseudomonas
syringae bacteria, Pseudoxanthomonas sp., Xanthomonas sp., Joly et al. (2013); (37) deposition freezing for pollen, Diehl et al. (2001); (38) immersion and contact freezing for pollen, Diehl et al. (2002); (39) Hoose and Möhler
(2012); (40) Chen et al. (2008); (41) immersion freezing for Pseudomonas syringae and Pseudomonas fluorescens, Attard et al. (2012); (42) immersion freezing for fungi, Kunert et al. (2019); (43) deposition freezing of silver
birch and grey alder pollen, Gute and Abbatt (2018); (44) nitrated SOA (toluene as precursor) to represent nitrated PBAPs, Liu et al. (2015); (45) Morris et al. (2008); (46) Enguita et al. (2003); (47) Ervens and Amato (2020);
(48) Barnard et al. (2013); (49) Pšenčík et al. (2004); (50) Fong et al. (2001)

Atmos. Chem. Phys., 21, 3699–3724, 2021                                                                                                                https://doi.org/10.5194/acp-21-3699-2021
M. Zhang et al.: Sensitivities to biological aerosol particle properties and ageing processes                              3703

Huffman et al., 2020; Šantl-Temkiv et al., 2020). We rather        in fragments with diameter of 1–4 µm and number concentra-
aim at using characteristic orders of magnitude of these prop-     tions of NSPP ∼ 0.1 cm−3 during thunderstorms (Zhang et al.,
erties as input data to our process models (Sect. 3). There-       2019). These concentrations correspond to ∼ 1 to 25 ng m−3
fore, we only give a brief overview on the ranges and vari-        (DSPP < 2 µm) (Miguel et al., 2006). Laboratory chamber
ability of these properties for different PBAP types and due       measurements have shown that SPPs from rupture of fresh
to various ageing processes.                                       birch pollen or grass pollen have diameters in the range of
                                                                   0.03 to 4.7 µm (Taylor et al., 2002, 2004). Recent labora-
2.1   PBAP number size distribution parameters (NPBAP              tory measurements suggest that also fungal spores can rup-
      and DPBAP )                                                  ture, resulting in subfungi particles (SFPs) with DSFP of 0.03
                                                                   to 0.9 µm after exposure to high relative humidity (China
The number concentration (NPBAP ) of most PBAP types is            et al., 2016). Ambient measurements suggest NSFP of 150 to
in the range of 0.001 cm−3 ≤ NPBAP ≤ 0.1 cm−3 (Table 1).           455 cm−3 (10 nm < DSFP < 100 nm) after rainfall; observed
The number concentration of bacteria is higher than that           peaks in aerosol size distributions at 20 nm < DSFP < 50 nm
of fungal spores and pollen, although the mass concentra-          which frequently appeared 1.5 d after rain events were as-
tion of bacteria is lower (Burrows et al., 2009a; Heald and        cribed to such rupture events (Lawler et al., 2020).
Spracklen, 2009; Hoose et al., 2010). NPBAP can vary by
about 3 orders of magnitude among different ecosystems, lo-        2.2     Optical properties of PBAPs: complex refractive
cations, seasons, and time of the day (Huffman et al., 2010,               index (mPBAP = n + ik)
2020; Matthias-Maser et al., 2000a, b; Schumacher et al.,
2013). The PBAP diameter (DPBAP ) covers a broad range             The scattering and absorption of particles are commonly
of 0.01 µm ≤ DPBAP ≤ 100 µm. This parameter usually refers         described by the refractive index mPBAP with real part
to the mass equivalent diameter, which is the diameter of a        (nPBAP ) and imaginary parts (kPBAP ) that depend on
sphere with the same mass as a nonspherical PBAP. The size         the chemical composition and wavelength of irradiation.
depends on the type of PBAPs and on changes due to biolog-         Arakawa et al. (2003) reported 1.5 ≤ nPBAP ≤ 1.56 and
ical and physical processing. Viruses are reported to be the       3 × 10⁻⁵ ≤ kPBAP ≤ 6 × 10⁻⁴ for bacteria (Erwinia her-
smallest PBAPs (0.01 µm ≤ Dviruses ≤ 0.3 µm), while pollen         bicola) in the wavelength range of 0.3–2.5 µm. Other groups
is the largest (5 µm ≤ Dpollen ≤ 100 µm) (Table 1). Biologi-       found a broader range of n and k (Table 1) for different
cal processing, such as cell generation, might increase the        PBAPs and irradiation wavelengths (Hu et al., 2019; Thrush
size of particles by producing secondary biological aerosol        et al., 2010). The imaginary part can vary by 3 orders of mag-
mass (Ervens and Amato, 2020; Sattler et al., 2001). Typ-          nitude for different PBAP types (Hu et al., 2019). Hill et al.
ical bacterial cell generation rates are in the range of 0.1       (2015) showed that the refractive index of PBAPs can be es-
to 0.9 h−1 (Ervens and Amato, 2020). Efficient generation          timated based on the chemical composition. They reported
in the atmosphere is assumed to be largely restricted to the       1.59 + i0.045 for Bacillus vegetative cells at 0.266 µm. Also
time of cell exposure to liquid water (i.e., in cloud). With       PBAP shape (e.g., core-shell structure, hexagonal grids, and
an average atmospheric residence time of ∼ 1 week (Bur-            barbs), as has been demonstrated for pollen, influences the
rows et al., 2009b) and an average in-cloud time fraction of       optical properties (Liu and Yin, 2016). Due to the similar-
∼ 15 % (Lelieveld and Crutzen, 1990), it can be estimated          ity of the molecular structure of organic macromolecules
that the generation timescale of bacteria cells in the atmo-       (e.g., proteins) and secondary organic aerosols (SOAs), it
sphere is on the order of ∼ 20 h. Thus, for example, Dbacteria     can be likely assumed that nitration might alter the PBAP
may increase from 1 to 2 µm after 1 week in the atmosphere         refractive index similar to that of SOA. Experimental results
assuming a generation rate of 0.3 h−1 . Other rates, such as       show 1.528 ≤ n ≤ 1.576 and 0 ≤ k ≤ 0.02 for fresh SOA in
the cell growth, are usually much smaller (Marr, 1991; Mid-        the wavelength range of 0.3–0.56 µm; after nitration, the real
delboe, 2000; Price and Sowers, 2004; Sattler et al., 2001;        part increases to 1.549 ≤ n ≤ 1.594 and the imaginary part
Vrede et al., 2002) and thus contribute less efficiently to        increases to 0.0002 ≤ k ≤ 0.04 (Liu et al., 2015).
a change in DPBAP . In addition, the formation of extracel-
lular polymeric substances might lead to the formation of          2.3     PBAP properties relevant for CCN activation
biofilms, which increase PBAP size by forming agglomerates
(Monier and Lindow, 2003, 2005). Agglomerate formation             2.3.1    Hygroscopicity (κPBAP ) of PBAPs
might be also described as a physical process, when PBAPs
(e.g., bacteria) attach to other particles (e.g., dust) (Després   The hygroscopicity determines the PBAP hygroscopic
et al., 2012; Lighthart, 1997), which can result in particle       growth factor (gf, as the ratio of wet to dry particle diam-
sizes on the order of ∼ 10 µm. At high RH and during precip-       eter) at subsaturated RH conditions and their CCN activ-
itation or thunderstorms, pollen absorb water and one pollen       ity; it is usually expressed as the hygroscopicity parame-
grain can release ∼ 103 SPPs due to osmotic pressure (Grote        ter κ (Petters and Kreidenweis, 2007). Lee et al. (2002) re-
et al., 2001; Suphioglu et al., 1992). This process can result     ported gf = 1.16 for Bacillus subtilis and gf = 1.34 for Es-

https://doi.org/10.5194/acp-21-3699-2021                                            Atmos. Chem. Phys., 21, 3699–3724, 2021
3704                            M. Zhang et al.: Sensitivities to biological aerosol particle properties and ageing processes

cherichia coli at RH ∼ 85 %. Based on these growth fac-           concentration depends both on the dilution (amount of wa-
tors, κbacteria = 0.11 and κbacteria = 0.25 for these bacteria    ter) and on the mass fraction of biosurfactants in the parti-
can be calculated. The hygroscopicity of pollen is similar        cle. The mass fraction has not been determined for biosur-
to that of bacteria: the κ value of intact pollen grains falls    factants; however, other surfactants have been shown to con-
into the range of 0.03 ≤ κpollen ≤ 0.17 (Chen et al., 2019;       tribute ∼ 0.1 % to the total particle mass (Gérard et al., 2019).
Pope, 2010; Tang et al., 2019), pollenkitts (which are parts
of pollen surface) and SPPs (which are fragments after rup-       2.4     PBAP properties relevant for ice nucleation
ture) are slightly more hygroscopic (0.14 ≤ κpollenkitt ≤ 0.24,
0.1 ≤ κSPP ≤ 0.2) (Mikhailov et al., 2019, 2020; Prisle et al.,   2.4.1    Number fraction of PBAPs with IN-active
2019) than intact pollen grains, which can be explained by                 macromolecules
the nonuniform composition of pollen (Campos et al., 2008).
                                                                  In freezing experiments of pollen, it has been demonstrated
2.3.2   Surface tension (σPBAP ) of PBAPs                         that all particles freeze at sufficiently low temperatures, i.e.,
                                                                  the number fraction of PBAPs that have IN-active molecules
In most model studies that explore CCN activation, it is as-      can be assumed as ∼ 100 %. Both condensation and immer-
sumed that particles have a surface tension close to that of      sion or contact freezing led to frozen fractions of 100 %
water (σwater = 72 mN m−1 ). This assumption is likely justi-     at T = −18 ◦ C (Diehl et al., 2001) and T = −20 ◦ C (Diehl
fied under many conditions due to the strong dilution of in-      et al., 2002), respectively. However, it has been shown that
ternally mixed aerosol particles near droplet activation. There   bacteria of the same species and within the same popula-
are numerous studies that postulate that surfactants in aerosol   tion often exhibit different ice nucleation behaviors (Bow-
particles might influence the surface tension sufficiently to     ers et al., 2009; Failor et al., 2017; Fall and Fall, 1998; Lin-
change their CCN activity (Bzdek et al., 2020; Facchini et al.,   dow et al., 1978; Morris et al., 2004). This behavior has been
1999; Lowe et al., 2019; Nozière et al., 2014). These sur-        explained by various expression levels of IN-active macro-
factants are usually assumed to have natural sources such as      molecules that are located at the cell surface. Under condi-
the ocean surface (Gérard et al., 2019; Ovadnevaite et al.,       tions such as phosphate starvation, the expression level might
2017). Another source of surfactants might be living mi-          be higher, which is a strategy to reach nutrients after destroy-
croorganisms that produce biosurfactants which enhance sur-       ing the cells of plants by freezing (Fall and Fall, 1998). For
face hygroscopicity and decrease surface tension (Akbari          example, only 0.1 % to 10 % of Pseudomonas syringae cells
et al., 2018). These biosurfactants might not only be asso-       express IN-active macromolecules (Joly et al., 2013). Bac-
ciated with PBAPs themselves as they are deposited on sur-        teria from the same population without expression of such
faces (e.g., leaves) where they can be taken up by other parti-   molecules did not freeze under the experimental conditions.
cles. Renard et al. (2016) reported that 41 % of tested strains
actively produce surfactant with σPBAP < 55 mN m−1 , and          2.4.2    Contact angle between substrate and ice (θPBAP )
7 % of tested strains can produce extremely efficient biosur-
factants with σPBAP < 30 mN m−1 . All of these tested strains     In agreement with previous studies, we base our discussion
were collected and isolated in cloud water samples. The most      on the contact angle as a fitting parameter in the classical
efficient biosurfactants (σPBAP < 45 mN m−1 ) are produced        nucleation theory (CNT) to parametrize the frozen fraction
by Pseudomonas and Xanthomonas bacteria (78 %) and Ude-           observed in experiments. If not reported in the respective ex-
niomyces fungi (11 %). For these biosurfactants, we fit the       perimental studies, we assumed a freezing time of 10 s to de-
following linear approximation based on the experimental          rive θ from experimental data, in agreement with many ex-
data:                                                             perimental conditions (Attard et al., 2012; Gute and Abbatt,
σPBAP = 89.6 − 2.9 · Cbiosurf                                     2018; Kunert et al., 2019). All CNT model equations and pa-
                                                                  rameters are identical to those as described by Ervens and
         if 6 mg L−1 ≤ Cbiosurf ≤ 22 mg L−1 ,               (1)
                                                                  Feingold (2012); Hoose and Möhler (2012) discussed dif-
where σPBAP is PBAP surface tension             (mN m−1 ) and     ferent assumptions made for the various variables in CNT
Cbiosurf is the biosurfactant concentration (mg L−1 ). Higher     in previous ice nucleation studies. Chen et al. (2008) re-
and lower biosurfactant concentrations may be approximated        ported 4◦ ≤ θbacteria ≤ 20◦ and 14◦ ≤ θpollen ≤ 30◦ . Based on
with 25 and 72 mN m−1 for simplicity. Equation (1) implies        the measurements by Attard et al. (2012), we derived values
that the concentration of biosurfactant on the surface is the     of 28, 33, and 44◦ for different species of bacteria. θ values
same as in the bulk. Recent studies suggest that the surface      for fungi based on the measurements by Kunert et al. (2019)
concentration of surfactants is higher than the bulk concen-      are similar (30◦ ≤ θfungi ≤ 33◦ ). Gute and Abbatt (2018) per-
tration (Bzdek et al., 2020; Lowe et al., 2019; Ruehl et al.,     formed deposition freezing experiments of pollen; based on
2016). Thus, a smaller amount of biosurfactants (“critical        their experiments, we fitted θpollen = 15◦ for silver birch and
micelle concentration”) than suggested by Eq. (1) might be        θpollen = 16.3◦ for grey alder. Hoose and Möhler (2012) re-
sufficient to significantly decrease σPBAP . The biosurfactant    ported the ice nucleation active surface site (INAS) density

Atmos. Chem. Phys., 21, 3699–3724, 2021                                             https://doi.org/10.5194/acp-21-3699-2021
M. Zhang et al.: Sensitivities to biological aerosol particle properties and ageing processes 3705
of various bacteria at −5 ◦ C (102.5 to 1010 m−2 ). Using CNT, (e.g., viruses, SFPs, or SPPs) and larger (e.g., pollen grains)
we fitted a contact angle to their data, resulting in the range particles. We consider one additional PBAP size class in
of 32◦ ≤ θbacteria ≤ 34◦ . the model with specific parameters (NPBAP , DPBAP , mPBAP ,
Chemical processes (e.g., nitration) can change the molec- κPBAP , σPBAP ).
ular surface of PBAPs by, for example, adding nitro groups Calculations are performed for RH of 10 % and 90 %, i.e.,
to tyrosine residues of proteins (Estillore et al., 2016), which for different PBAP growth factors. In a series of sensitivity
can alter the IN activity. Attard et al. (2012) measured the studies of optical simulations (Sopt1 to Sopt13 , Table 2), we
cumulative fraction of IN among a population of bacteria be- explore the sensitivity of scattering and absorption to NPBAP ,
fore and after nitration for 16–18 h. The residence time of DPBAP , κPBAP , and mPBAP (mPBAP = n + ik). We not only
aerosol particles in the atmosphere is from hours to weeks, compare model results for properties representing different
which means that the experimental nitration times might be PBAP types (e.g., Dbacteria vs. Dfungi ) but also explore the
a realistic timescale. Based on these data, we calculated that ranges of property variation due to ageing processes of in-
the contact angle increased by ∼ 1◦ after nitration for some dividual PBAP types e.g., the potential increase of bacteria
bacteria. In contrast, Kunert et al. (2019) reported that pro- diameter (1D) due to cell generation.
tein nitration does not influence the cumulative fraction of
IN for 65 species of fungi investigated. In order to study the 3.2 Adiabatic parcel model
oxidation effect, Gute and Abbatt (2018) exposed pollen to
OH radicals and measured the cumulative frozen fraction of 3.2.1 CCN activation in warm clouds
pollen in terms of deposition freezing. We calculated that the
An adiabatic parcel model was applied to simulate the for-
contact angle increased by ∼ 0.5◦ ≤ 1θpollen ≤ 0.8◦ after ox-
mation of warm clouds (Ervens et al., 2005, 2010; Fein-
idation. While experimental conditions are often optimized
gold and Heymsfield, 1992). The activation of an aerosol
so that a large fraction of particles become nitrated or ox-
population to cloud droplets is described as a function
idized, only a small fraction of ambient proteins (∼ 0.1 %)
of N, D, κ, and σ . The dry aerosol size distribution
have been found to be nitrated (Franze et al., 2005). In ad-
covers a size range of 5 nm < Dother, S(CCN) < 7.7 µm with
dition, Attard et al. (2012) showed that a decrease of pH
Nother, S(CCN) = 902 cm−3 , as being typical for moderately
from 7.0 to 4.1 led to a decrease of the cumulative frac-
polluted continental conditions. Similar to the studies on op-
tion of IN of P. syringae (32b-74) from 10−2 to 10−8 at
tical properties (Sect. 3.1), we assume that one aerosol size
T = −4 ◦ C. This change can be described by an increase of θ
class is composed of biological material, for which we vary
from 28.7 to 30.3◦ (1θbacteria ∼ 1.6◦ ). P. syringae (CC0242),
DPBAP , κPBAP , and σPBAP to explore the role of differences in
Snomax® , and P. fluorescens exhibited similar increases of
PBAP types and ageing processes on cloud droplet activation
1θbacteria ∼ 1.5◦ for the same change in pH.
with CCN simulations (SCCN1 to SCCN9 , Table 2).
3.2.2 Ice nucleation in mixed-phase clouds
3 Model description
The adiabatic parcel model as used for the CCN calcula-
3.1 Box model: scattering and absorption of wet tions was extended by the description of immersion freezing
particles at RH < 100 % calculated by Mie theory based on classical nucleation theory (Ervens et al., 2011).
At each model time step (1 s), the frozen fraction of PBAPs
A box model was used to calculate total scattering and ab- is calculated; if 1 % or more of the IN size class is pre-
sorption based on Mie theory (Bohren and Huffman, 1983) dicted to freeze in a given time step, a new size class
for a constant aerosol distribution at different RH. Water up- of ice particles is generated in the model, for which ice
take by particles is calculated based on Köhler theory. Mie growth is described. We consider an aerosol size distribu-
theory is applied to calculate total scattering and absorp- tion with 46 nm < Dother, S(IN) < 2.48 µm in nine size classes
tion of the wet aerosol population as a function of D, N, and Nother, S(IN) = 100 cm−3 , as found in Arctic mixed-phase
and m at different wavelengths (λ). The input aerosol size clouds. The aerosol population includes one additional PBAP
distribution is based on ambient measurements by an ultra- size class, which is the only one that includes potentially
violet aerodynamic particle sizer (UV-APS) in central Eu- freezing IN under the model conditions. Similar to the anal-
rope (Zhang et al., 2019) that cannot detect particles with ysis by Ervens et al. (2011), we compare the evolution of
D < 0.5 µm. At λ ≥ 300 nm, the particles with D > 3 µm in- the ice and liquid water contents (IWC and LWC) expressed
teract with light by geometric scattering, rather than Mie in mass fractions (%), where 100 % corresponds to the total
scattering. Therefore, we only consider particles with di- water (ice + liquid + vapor) mixing ratio that is constant un-
ameters of 0.5 µm < D < 2.8 µm in 24 size classes to repre- der the adiabatic model conditions. Input values of DPBAP ,
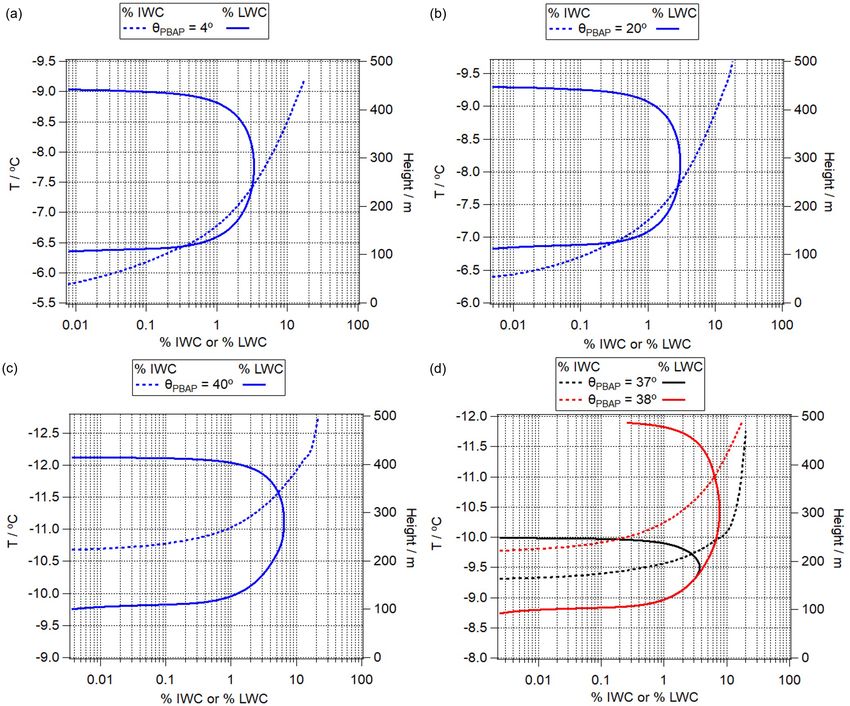
sent ambient aerosol particles relevant for our study with a NPBAP , and θPBAP are varied in IN simulations (SIN1 to SIN9 )
concentration of Nother, S(opt) = 1.4 cm−3 . Thus, the simula- (Table 2).
tions focus on PBAPs in this size range and exclude smaller
https://doi.org/10.5194/acp-21-3699-2021 Atmos. Chem. Phys., 21, 3699–3724, 2021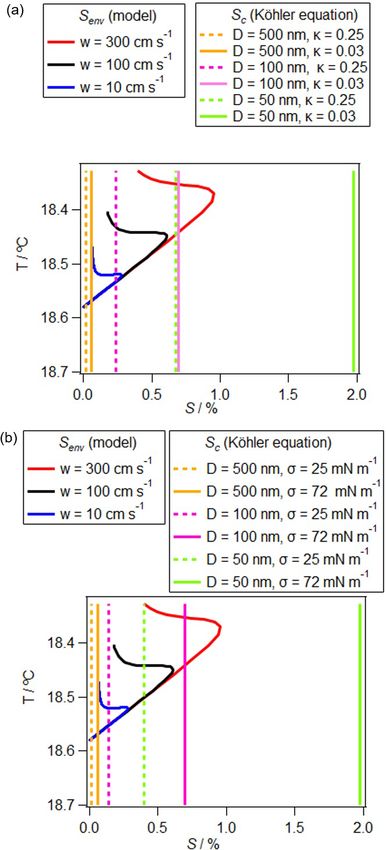
3706                              M. Zhang et al.: Sensitivities to biological aerosol particle properties and ageing processes

Table 2. Model sensitivity studies assume different physicochemical PBAP parameters to investigate their effect on the optical properties
(Sect. 3.1), CCN activation (Sect. 3.2), and ice nucleation (Sect. 3.3).

    Scattering and absorption:
    0.5 µm < Dother, S(opt) < 2.8 µm; Nother, S(opt) = 1.4 cm−3 ; κother, S(opt) : 0.3. σPBAP = σother, S(opt) = 72 mN m−1
    Composition of other particles: 90 % ammonium sulfate + 10 % soot
    Simulation    NPBAP (cm−3 )       DPBAP (µm)       n(λ)PBAP ; k(λ)PBAP                              RH                          κPBAP
    Sopt1                        0                –    –                                                10 %                             –
    Sopt2                     0.01                1    E. herbicola: 1.5–1.56; 3 × 10⁻⁵ –6 × 10⁻⁴                                     0.25
    Sopt3                      0.1
    Sopt4                        1
    Sopt5                      0.1                2
    Sopt6                                         3
    Sopt7                        1                2                                                                                   0.03
    Sopt8                                                                                                                             0.25
    Sopt9                                                                                               90 %                          0.03
    Sopt10                                                                                                                            0.25
    Sopt11                                             B. subtilis: 1.25–1.6; 0.001–0.1                 10 %
    Sopt12                                             Fresh PBAPs: 1.528–1.576; 0–0.02
    Sopt13                                             Nitrated PBAPs: 1.549–1.594; 0.0002–0.04
    Cloud condensation nuclei (CCN):
    5 nm < Dother, S(CCN) < 7.7 µm; Nother, S(CCN) = 902 cm−3
                                      DPBAP (µm)       Hygroscopicity κPBAP                             Surface tension σPBAP (mN m−1 )
    SCCN1                                       0.5    0.25                                                                             72
    SCCN2                                              0.03
    SCCN3                                       0.1    0.25
    SCCN4                                              0.03
    SCCN5                                      0.05    0.25
    SCCN6                                              0.03
    SCCN7                                       0.5    0.03                                                                             25
    SCCN8                                       0.1
    SCCN9                                      0.05
    Ice nuclei (IN):
    46nm < Dother, S(IN) < 2.5 µm; Nother, S(IN) = 100 cm−3
    NPBAP, IN /NPBAP = 10 %
    θother, S(IN) : 80◦
                  NPBAP (cm−3 )       DPBAP (µm)       Contact angle (θPBAP ) of ice germ                      Cloud base temperature (◦ C)
    SIN1                         1                1    37◦                                                                             −8
    SIN2                      0.01
    SIN3                     0.001
    SIN4                      0.01                2
    SIN5                                          5
    SIN6                                          1    4◦                                                                             −5.5
    SIN7                                               20◦                                                                             −6
    SIN8                                               40◦                                                                             −9
    SIN9                                               38◦                                                                             −8

Atmos. Chem. Phys., 21, 3699–3724, 2021                                                       https://doi.org/10.5194/acp-21-3699-2021
M. Zhang et al.: Sensitivities to biological aerosol particle properties and ageing processes                                      3707

Figure 2. Total scattering coefficient for different PBAP number     Figure 3. Total scattering coefficient for different PBAP diameters.
concentrations. The detailed input parameters can be found in Ta-    The detailed input parameters can be found in Table 2. The black,
ble 2. The black, red, blue, and brown lines correspond to Sopt1 ,   red, blue, and brown lines correspond to Sopt1 , Sopt3 , Sopt5 , and
Sopt2 , Sopt3 , and Sopt4 in Table 2, respectively.                  Sopt6 , respectively.

                                                                     with the largest changes of 73 % to 100 % at λ > l.5 µm
4     Results and discussion
                                                                     when DPBAP increases from 1 to 2 µm (Sopt5 ). Larger PBAPs
                                                                     (DPBAP = 3 µm, Sopt6 ) such as SPPs and fungal spores lead to
4.1     Sensitivity of optical properties at subsaturated
                                                                     an increase in the scattering coefficient by a factor of 1.4 to
        conditions (RH < 100 %) to PBAP properties
                                                                     4.7 depending on λ. The absorption coefficient of the aerosol
                                                                     population remains nearly the same (Fig. S2).
4.1.1    Influence of concentration (NPBAP ) and diameter
                                                                        The results in Fig. 3 clearly show that the size of PBAPs
         (DPBAP ) on scattering and absorption
                                                                     needs to be known in order to assess their optical properties.
                                                                     Even a relatively small variation in particle diameter from
As explained in Sect. 3.1, in the sensitivity studies of op-
                                                                     1 to 2 µm due to different types or to cell diameter changes
tical properties, we consider only particles with D in the
                                                                     (1DPBAP ) might lead to change in scattering coefficient by
same range as λ, so scattering and absorption can be calcu-
                                                                     8 %–100 % depending on λ. Given that the diameter (DPBAP )
lated by Mie theory. In Fig. 2, we compare the total scat-
                                                                     might vary by 4 orders of magnitude among different PBAP
tering coefficient for a case without PBAPs (Sopt1 ) to that
                                                                     types, our analysis shows that different sizes for the various
predicted for NPBAP = 0.01 cm−3 (Sopt2 ), NPBAP = 0.1 cm−3
                                                                     PBAP types need to be taken into account when their optical
(Sopt3 ), and NPBAP = 1 cm−3 (Sopt4 ). At NPBAP = 0.01 cm−3 ,
                                                                     properties are evaluated.
the effect on total scattering coefficient is negligible. At
                                                                        In our model studies, we make the simplistic assumption
NPBAP = 0.1 cm−3 , the total scattering coefficient increases
                                                                     of spherical PBAPs. Microscopic imaging has shown that
by 15 % to 18 % in the range of 0.3 µm ≤ λ ≤ 1.5 µm, al-
                                                                     aerosol particles are not spherical but exhibit a variety of dif-
though the number fraction of PBAPs is only 6 %. At a
                                                                     ferent shapes (Valsan et al., 2015; Wittmaack et al., 2005;
higher concentration (NPBAP = 1 cm−3 ), the total scattering
                                                                     O’Shea et al., 2019). The consequences of the assumptions of
coefficient changes by a factor of 0.5 to 2 depending on λ.
                                                                     spherical vs. nonspherical pollen on the derivation of optical
Note that the atmospheric concentration of other particles
                                                                     properties at a wavelength of 0.65 µm have been recently dis-
(Nother, S(opt) ) might be higher than used in the above model
                                                                     cussed (Liu and Yin, 2016). The extinction efficiency (sum
(1.4 cm−3 ); therefore, the predicted increase of scattering co-
                                                                     of scattering efficiency and absorption efficiency) can vary
efficient is likely an overestimate. The absorption coefficient
                                                                     by a factor of 1 to 3 for small pollen with D < 4 µm. For
of the total aerosol population does not change (Fig. S1 in
                                                                     larger pollen with D > 5 µm, the extinction efficiency varies
the Supplement).
                                                                     by ∼ 25 % (Liu and Yin, 2016). Nonsphericity of particles
   DPBAP also affects the scattering coefficient of the aerosol
                                                                     might translate into the same changes as caused by differ-
population significantly (Fig. 3). DPBAP = 1 µm (Sopt3 ) and
                                                                     ent particles sizes, which might induce uncertainties includ-
DPBAP = 2 µm (Sopt5 ) can be considered to represent differ-
                                                                     ing optical depth and surface albedo (Kahnert et al., 2007).
ent PBAP types such as bacteria and fungi, respectively, or
                                                                     These uncertainties on scattering and absorption caused by
an aged bacteria cell that has undergone processing by cell
                                                                     nonspherical shape might be of comparable magnitude to that
generation (Ervens and Amato, 2020). For these assump-
                                                                     caused by the complex refractive index (Yi et al., 2011).
tions, the scattering coefficient increases depending on λ,

https://doi.org/10.5194/acp-21-3699-2021                                               Atmos. Chem. Phys., 21, 3699–3724, 2021
3708                                M. Zhang et al.: Sensitivities to biological aerosol particle properties and ageing processes

Figure 4. The effect of PBAP hygroscopicity (κ) on (a) scattering coefficient, (b) absorption coefficient of total particles at RH = 10 %
(Sopt7 , Sopt8 ), (c) scattering coefficient, and (d) absorption coefficient of total particles at RH = 90 % (Sopt9 , Sopt10 ). The black lines indicate
κ = 0.03 and the red lines indicate κ = 0.25 for all panels.

4.1.2    Influence of hygroscopicity (κPBAP ) and surface
         tension (σPBAP ) on scattering and absorption                                 A(σ ) B(κ)
                                                                               s = exp      − 3     ,                                               (2)
                                                                                       Dwet  Dwet
As discussed in Sect. 2.3, the growth factor (gfPBAP ) might
vary depending on PBAP hygroscopicity (κPBAP ) and surface                     where s is the equilibrium water vapor saturation ratio,
tension (σPBAP ). Figure 4 shows the influence of κ on scat-                   Dwet the wet particle diameter, the first term in the parenthe-
tering and absorption at RH of 10 % (Sopt7 , Sopt8 ) and 90 %                  ses is the Kelvin (curvature) term which is a function of sur-
(Sopt9 , Sopt10 ). At RH = 10 % (Sopt7 , Sopt8 ), the influence                face tension (σPBAP ) following Eq. (3), and the second term
of PBAPs on scattering coefficient of total particles is small                 is the Raoult (solute) term which can be parameterized by
( 2 µm. This trend can be explained as the
imaginary part of water is higher by 3 orders of magnitude                     where σsol is surface tension of solution droplet
at λ ∼ 2 µm compared to that at λ ∼ 1 µm (Kou et al., 1993).                   (72 mN m−1 ); Mω is molar mass of water (18 g mol−1 );
It can be concluded that the importance of κPBAP increases                     ρω is density of water (1 g cm−3 ); R is the universal gas
at higher RH, as under these conditions PBAP hygroscopic                       constant (8.31 × 10⁷ g cm2 s−2 K−1 mol−1 ); T is the absolute
growth is most efficient.                                                      temperature (K); Dwet is droplet diameter (cm); and Ds is
   In addition to hygroscopicity (κPBAP ), we explore the im-                  the diameter of the dry particle (cm).
portance of biosurfactants which decrease surface tension of                      The comparison of the two dimensionless terms shows that
particles (σPBAP ). A lower surface tension leads to a reduced                 in most of the cases the Raoult term exceeds the Kelvin term
particle curvature which, in turn, enhances the water uptake.                  by at least 1 order of magnitude. Only for very small PBAPs,
Numerically, this is expressed in the Köhler equation:                         i.e., representative for viruses, SPPs, or SFPs (Sect. 2.1), does
                                                                               the curvature term significantly influence s (Fig. 5). Based

Atmos. Chem. Phys., 21, 3699–3724, 2021                                                            https://doi.org/10.5194/acp-21-3699-2021
M. Zhang et al.: Sensitivities to biological aerosol particle properties and ageing processes 3709
Figure 5. Kelvin term as a function of surface tension (σPBAP ) for
the σ range as found for PBAPs (left axis; solid lines). Raoult term
as a function of hygroscopicity (κPBAP ) for the range of κ as found
for PBAPs (right axis; dashed lines).
on this analysis, we can conclude that (bio)surfactants likely
do not have a significant impact on the hygroscopic growth
of PBAPs. A coating with surfactants might slow down the
kinetics of the water uptake by particles (Davidovits et al.,
2006). However, since the growth timescales of particles at
RH < 100 % are usually relatively long, the impact of sur-
factants on the timescale to reach equilibrium sizes is likely
small, leading to a small importance of the effect of surfac-
tant on water uptake and the corresponding optical proper-
ties.
4.1.3 Influence of complex refractive index
(mPBAP = n + ik) on scattering and absorption
The complex refractive index of PBAPs can be explained
by their building blocks of various functional groups (Hill Figure 6. The influence of different PBAPs on (a) the scattering co-
et al., 2015). Here the complex refractive indices of PBAPs efficient and (b) absorption coefficient of total particles. The refrac-
tive indices are based on the measurements by Arakawa et al. (2003)
are based on the measurements of Erwinia herbicola by
and Hu et al. (2019).
Arakawa et al. (2003) and 12 other PBAPs by Hu et al.
(2019); the complex refractive indices of “other particles”
in the model are the averaged values based on the volume In addition to the variability in refractive index due to
fractions of ammonium sulfate, soot, and water (Table 2). PBAP types, chemical processing of the molecules at the
The calculated scattering and absorption coefficients of the PBAP surface might modify the refractive index. It has been
total particle population are shown in Fig. 6. Scattering coef- shown that nitration of SOA, i.e., the addition of a nitro
ficients for different PBAPs vary by a factor of up to 4 and group, leads to the formation of brown carbon (Moise et al.,
the absorption coefficients by a factor of up to 6. 2015). Qualitatively, it has been demonstrated that proteins
The difference of optical properties between bacteria can be nitrated, similar to SOA compounds (Shiraiwa et al.,
species or fungi species can be larger than that between 2012). Due to the lack of data on the change of complex re-
these two types of PBAPs. Therefore, detailed information fractive index (1m) for nitrated proteins in PBAPs, we as-
on PBAP species is important in order to estimate their di- sume that PBAPs have a similar change in the refractive in-
rect interaction with radiation (Sect. 4.1.4). dex to that of SOA (Sopt12 and Sopt13 ). After nitration, the
scattering coefficient decreases by ∼ 20 % in the range of
https://doi.org/10.5194/acp-21-3699-2021 Atmos. Chem. Phys., 21, 3699–3724, 20213710 M. Zhang et al.: Sensitivities to biological aerosol particle properties and ageing processes
levels (Shiraiwa et al., 2012); and (3) a rather high concen-
tration of NPBAP = 1 cm−3 is considered.
While generally light-absorbing organics (“brown car-
bon”) might contribute to the aerosol semidirect effect
(Brown et al., 2018; Hansen et al., 1997), i.e., the impact of
aerosol heating on clouds, it seems unlikely that PBAPs have
a significant contribution to it. Given the supermicron sizes
of most PBAPs, their concentration decreases strongly as a
function of altitude (Ziemba et al., 2016); thus, their concen-
tration near cloud tops is likely negligible.
4.1.4 Estimate of change of radiative forcing
introduced by PBAPs
The direct radiative effect of particles can be expressed in
terms of the single scattering albedo (SSA, i.e., the ratio of
scattering coefficient to extinction coefficient) and radiative
forcing efficiency (RFE, i.e., radiative forcing per unit optical
depth) (Dinar et al., 2007; Randles et al., 2004). The RFE at
390 and 532 nm can be calculated as (Dinar et al., 2007):
2
RFE = Scon Dlen (1 − Acld )Tatm (1 − Rsfc )2
1−ω
· 2Rsfc − βω , (5)
(1 − Rsfc )2
where Scon is the solar constant (1370 W m−2 ); Dlen is
the fractional day length (0.5); Acld is the fractional cloud
cover (0.6); Tatm is the solar atmospheric transmittance
(0.76); Rsfc is surface albedo (0.15); ω is the single scatter-
ing albedo (SSA), which is the ratio of scattering coefficient
Figure 7. The influence of nitration on (a) the scattering coefficient to extinction coefficient; and β is average upscatter fraction,
and (b) absorption coefficient of total particles. The blue and brown which can be calculated as
lines indicate fresh PBAPs (Sopt12 ) and nitrated PBAPs (Sopt13 ),
β = 0.082 + 1.85b − 2.97b2 , (6)
respectively. " #
1 − g2 1 1
b= p − , (7)
2g 1 + g2 1 + g
300 nm < λ < 450 nm and is nearly constant in the range of where b is the ratio of backscattering to scattering coeffi-
460 nm < λ < 560 nm (Fig. 7a). The scattering coefficient de- cient, g is the asymmetry factor which is assumed as 0.65 as
pends nonlinearly on the real and the imaginary parts. The an average of ambient measurements (∼ 0.59–0.72; Andrews
absorption coefficient of nitrated PBAPs is higher by 14 % et al., 2006). The calculated RFE values are listed in Table 3
to 160 % in the range of 300 nm < λ < 540 nm (Fig. 7b) and for some of the simulations (input parameters are listed in
is nearly constant in the range of 550 nm < λ < 560 nm. The Table 2). The first row is the reference with internally mixed
largest difference (∼ 160 %) for absorption coefficient is ob- ammonium sulfate/soot particles, while PBAPs are absent.
served at 440 nm, and the smallest difference (∼ 6 %) is ob- As expected, when λ increases from 390 to 532 nm, SSA in-
served at 560 nm, which can be attributed to the wavelength- creases due to less efficient absorption in the visible wave-
dependent change of the imaginary part (1k) (Liu et al., length range (Kirchstetter et al., 2004).
2015). The assumptions on 1m made for the simulations The RFE values in Table 3 only represent radiative forc-
shown in Fig. 7 are likely an overestimate of the chemical ing of a small range of particle sizes and a constant com-
processing of PBAP constituents since (1) experimental con- position and number concentration of other particles; how-
ditions are often optimized so that a large fraction of parti- ever, the differences (1RFE) allow for evaluating the rel-
cles is nitrated (Liu et al., 2015), as opposed to ∼ 0.1 % of ative importance of the various PBAP parameters (NPBAP ,
nitrated proteins observed in the atmosphere (Franze et al., DPBAP , mPBAP ) in terms of their direct interaction with radi-
2005); (2) we assume nitration to occur over the whole resi- ation. A negative 1RFE implies more scattering, and a pos-
dence time of particles in the atmosphere, while proteins can itive 1RFE implies more absorption due to the presence of
be nitrated only under conditions of sufficiently high-NOx PBAPs.
Atmos. Chem. Phys., 21, 3699–3724, 2021 https://doi.org/10.5194/acp-21-3699-2021M. Zhang et al.: Sensitivities to biological aerosol particle properties and ageing processes 3711
Table 3. Radiative forcing efficiency (RFE) at 390 and 532 nm calculated based on Eqs. (5)–(7) (Dinar et al., 2007). Some typical conditions
are shown here to demonstrate the influence of various PBAP properties such as concentration, size, and complex refractive index.
Simulation SSA RFE (W m−2 ) 1RFE(W m−2 ) SSA RFE (W m−2 ) 1RFE(W m−2 )
390 nm (ultraviolet) 532 nm (visible)
Sopt1 (without PBAPs, reference) 0.643 −0.5 – 0.728 −6.84 –
Sopt2 N = 0.01 cm−3 , D = 1 µm, mE. herbicola
0.646 −0.72 −0.22 0.73 −6.99 −0.15
Sopt3 N = 0.1 cm−3 , D = 1 µm, mE. herbicola
0.668 −2.36 −1.86 0.747 −8.26 −1.42
Sopt5 N = 0.1 cm−3 , D = 2 µm, mE. herbicola
0.738 −7.59 −7.09 0.791 −11.54 −4.68
Sopt8 N = 1 cm−3 , D = 2 µm, mE. herbicola
0.917 −20.94 −20.44 0.927 −21.68 −14.84
Sopt11 N = 1 cm−3 , D = 2 µm, mB. subtilis
0.539 7.26 7.76 0.56 5.7 12.54
Sopt12 N = 1 cm−3 , D = 2 µm, mFresh PBAP
0.868 −17.29 −16.79 0.927 −21.69 −14.85
Sopt13 N = 1 cm−3 , D = 2 µm, mNitrated PBAP
0.692 −4.15 −3.65 0.909 −20.34 −13.5
With a typical concentration of generally small, the direct radiative effect of PBAPs is likely
NErwinia herbicola = 0.01 cm−3 (Sopt2 ), the SSA increases, restricted to small spatial scales.
and the RFE is more negative by 44 % and 2 % at λ = 390 nm
and λ = 532 nm, respectively, as compared to the reference 4.2 Sensitivity of CCN activity to PBAP properties
case (Sopt1 without PBAPs). With a higher number con-
centration of NErwinia herbicola = 0.1 cm−3 (Sopt3 ), the 4.2.1 Influence of PBAP diameter (DPBAP ) on CCN
RFE becomes more negative by 228 % and 18 % at 390 activation
and 532 nm, respectively, as compared to the low number
The critical saturation sc can be used as a measure to estimate
concentration NErwinia herbicola = 0.01 cm−3 (Sopt2 ). When
whether a particle will be activated into a cloud droplet (Rose
the diameter increases to D = 2 µm (Sopt5 ), the RFE is more
et al., 2008):
negative by 221 % and 40 % at 390 and 532 nm, respectively,
as compared to the D = 1 µm (Sopt3 ). The above results
s
4A 3
suggest that (1) both the concentration and the size of sc = exp , (8)
PBAPs can enhance the RFE significantly, and (2) PBAPs 27κDs3
affect the optical properties more at the UV wavelength of
390 nm than at the visible wavelength of 532 nm. where A can be found in Eq. (3), κ is hygroscopicity, and
All PBAPs, for which refractive indices are listed in Ta- Ds (cm) is mass equivalent diameter of dry solute par-
ble 1, show a wavelength dependence on scattering and ab- ticle. Applying this equation, one finds that for particles
sorption. The imaginary part (k) varies by 3 orders of magni- with DPBAP of 0.01 to 10 µm, the critical supersaturations
tude between different PBAPs (Table 1), which makes both (Sc = (sc −1)· 100 %) are in a broad range of 0.0007 %–24 %
the sign and the absolute value of the direct radiative effects (assuming κ = 0.03; σ = 72 mN m−1 ). For large PBAPs with
of PBAPs uncertain. For example, both Erwinia herbicola DPBAP > 0.5 µm, the critical supersaturations Sc is smaller
and Bacillus subtilis have been found in the atmosphere (De- than 0.062 %. Typical environmental supersaturations (Senv )
sprés et al., 2012). E. herbicola is expected to induce more in stratocumulus and convective cumulus clouds are in
scattering (Sopt8 ), whereas B. subtilis is expected to induce the range of ∼ 0.1 %–0.5 % and ∼ 0.5 %–1 %, respectively
more absorption (Sopt11 ). Due to the lack of data of nitrated (Pruppacher and Klett, 1997). Comparison to Sc,PBAP shows
PBAPs, we used the refractive index of nitrated SOA and that most PBAPs (DPBAP > 0.5 µm) are likely activated to
fresh SOA (Liu et al., 2015) to represent nitrated PBAPs and droplets as their Sc values are significantly smaller than Senv
fresh PBAPs. Compared to the fresh PBAPs (Sopt12 ), the ni- in clouds.
trated PBAPs (Sopt13 ) cause less change of RFE, which can
be explained by the increase of k for nitrated PBAPs due to 4.2.2 Influence of the hygroscopicity (κPBAP ) and
the formation of brown carbon. surface tension (σPBAP ) on CCN activation
Note that in the above simulations relatively high concen-
Figure 8a shows the range of critical supersaturation (Sc )
trations of PBAPs were assumed and should only be used to
for the κ values shown in Table 2 for the small PBAPs
compare the relative importance of PBAP size and complex
with DPBAP = 500, 100, and 50 nm. For DPBAP = 500 nm,
refractive index for their optical properties. The properties of
Sc is 0.02 % (κPBAP = 0.25, SCCN1 ) or 0.06 % (κPBAP = 0.03,
PBAPs can vary depending on species of PBAPs and ageing
SCCN2 ), which are both below typical environmental super-
processes. Given that the number concentration of PBAPs is
saturation (Senv ) in clouds. Only for smaller PBAPs such
as viruses, SPPs, or SFPs with DPBAP = 100 nm (SCCN3 ,
https://doi.org/10.5194/acp-21-3699-2021 Atmos. Chem. Phys., 21, 3699–3724, 2021You can also read