Lagrangian matches between observations from aircraft, lidar and radar in a warm conveyor belt crossing orography
←
→
Page content transcription
If your browser does not render page correctly, please read the page content below
Atmos. Chem. Phys., 21, 5477–5498, 2021
https://doi.org/10.5194/acp-21-5477-2021
© Author(s) 2021. This work is distributed under
the Creative Commons Attribution 4.0 License.

Lagrangian matches between observations from aircraft, lidar and
radar in a warm conveyor belt crossing orography
Maxi Boettcher1 , Andreas Schäfler2 , Michael Sprenger1 , Harald Sodemann3 , Stefan Kaufmann2 , Christiane Voigt2,4 ,
Hans Schlager2 , Donato Summa5,6 , Paolo Di Girolamo6 , Daniele Nerini7 , Urs Germann7 , and Heini Wernli1
1 Institute for Atmospheric and Climate Science, ETH Zurich, Zürich, Switzerland
2 Institute of Atmospheric Physics, German Aerospace Center, Oberpfaffenhofen, Germany
3 Geophysical Institute, University of Bergen, and Bjerknes Centre for Climate Research, Bergen, Norway
4 Institute for Atmospheric Physics, Johannes Gutenberg University Mainz, Mainz, Germany
5 Consiglio Nazionale delle Ricerche, Istituto di Metodologie per l’Analisi Ambientale (CNR-IMAA), Tito, Italy
6 Scuola di Ingegneria, Universita degli Studi della Basilicata, Potenza, Italy
7 Federal Office of Meteorology and Climatology MeteoSwiss, Locarno-Monti, Switzerland

Correspondence: Maxi Boettcher (maxi.boettcher@env.ethz.ch)

Received: 30 September 2020 – Discussion started: 28 October 2020
Revised: 18 February 2021 – Accepted: 22 February 2021 – Published: 8 April 2021

Abstract. Warm conveyor belts (WCBs) are important               branches passed across the Alps, and for both branches La-
airstreams in extratropical cyclones, often leading to the       grangian matches coincidentally occurred between lidar wa-
formation of intense precipitation and the amplification of      ter vapour measurements in the inflow of the WCB south of
upper-level ridges. This study presents a case study that in-    the Alps, radar measurements during the ascent at the Alps
volves aircraft, lidar and radar observations in a WCB as-       and in situ aircraft measurements by Falcon in the WCB out-
cending from western Europe towards the Baltic Sea dur-          flow north of the Alps. An airborne release experiment with
ing the Hydrological Cycle in the Mediterranean Experi-          an inert tracer could confirm the long pathway of the WCB
ment (HyMeX) and T-NAWDEX-Falcon in October 2012,                from the inflow in the Mediterranean boundary layer to the
a preparatory campaign for the THORPEX North At-                 outflow in the upper troposphere near the Baltic Sea several
lantic Waveguide and Downstream Impact Experiment (T-            hours later.
NAWDEX).                                                            The comparison of observations and ensemble analyses re-
   Trajectories were used to link different observations along   veals a moist bias in the analyses in parts of the WCB inflow
the WCB, that is, to establish so-called Lagrangian matches      but a good agreement of cloud water species in the WCB
between observations. To this aim, an ensemble of wind           during ascent. In between these two observations, a precipi-
fields from the global analyses produced by the European         tation radar measured strongly precipitating WCB air located
Centre for Medium-Range Weather Forecasts (ECMWF) En-            directly above the melting layer while ascending at the south-
semble of Data Assimilations (EDA) system were used,             ern slopes of the Alps. The trajectories illustrate the com-
which allowed for a probabilistic quantification of the WCB      plexity of a continental and orographically influenced WCB,
occurrence and the Lagrangian matches. Despite severe air        which leads to (i) WCB moisture sources from both the At-
traffic limitations for performing research flights over Eu-     lantic and Mediterranean, (ii) different pathways of WCB as-
rope, the German Aerospace Center (DLR) Falcon success-          cent affected by orography, and (iii) locally steep WCB as-
fully sampled WCB air masses during different phases of the      cent with high radar reflectivity values that might result in
WCB ascent. The WCB trajectories revealed measurements           enhanced precipitation where the WCB flows over the Alps.
in two distinct WCB branches: one branch ascended from           The linkage of observational data by ensemble-based WCB
the eastern North Atlantic over southwestern France, while       trajectory calculations, the confirmation of the WCB trans-
the other had its inflow in the western Mediterranean. Both      port by an inert tracer and the model evaluation using the

Published by Copernicus Publications on behalf of the European Geosciences Union.
5478                                                        M. Boettcher et al.: Lagrangian matches in an orographic WCB

multi-platform observations are the central elements of this      grangian matches between ground-based and aircraft obser-
study and reveal important aspects of orographically modi-        vations in a WCB, confirmed by a tracer release experiment
fied WCBs.                                                        with a large horizontal and vertical separation between re-
                                                                  lease and intercept. The unique airborne tracer release exper-
                                                                  iment was performed as part of T-NAWDEX-Falcon to pro-
                                                                  vide direct experimental evidence for the long-range trans-
1   Introduction                                                  port by the WCB. The measurements mainly portray the evo-
                                                                  lution of moisture along the WCB ascent, which is, on the
The warm conveyor belt (WCB) is one of the three coher-           one hand, one of the most important characteristics of the
ent airstreams described by, e.g., Carlson (1980) and Brown-      WCB and, on the other hand, still seen as an obstacle for
ing (1990) in the so-called conveyor belt model of extrat-        accurate weather forecasts (e.g. Joos and Forbes, 2016; Rod-
ropical cyclones. The WCB is the airstream that ascends the       well et al., 2018). The following paragraphs will further dis-
most, rising from the boundary layer in the cyclone’s warm        cuss (i) why moisture in the WCB inflow is critical for the
sector to the upper troposphere downstream of the cyclone         WCB ascent, (ii) why the evolution of moisture and related
within about 1 d (e.g. Browning, 1986; Wernli, 1997). Cli-        diabatic processes along the WCB ascent is important, and
matologically, WCBs are most frequent in the winter season        (iii) why observations of moisture in WCBs are a valuable
and they preferentially occur in the main oceanic storm track     supplement to model studies.
regions in both hemispheres (Madonna et al., 2014b). WCBs            Moisture and moist processes, which we address by our
transport heat, moisture and atmospheric pollutants typically     measurements, are essential characteristics of the WCB. The
poleward (e.g. Methven et al., 2006; Sinclair et al., 2008).      cloud formation in the WCB can modify the dynamics of the
They are, due to the intense formation of clouds in the as-       governing weather system, and the associated latent heat re-
cending airstream, among the strongest precipitating weather      lease is essential to achieve the troposphere-deep moist isen-
systems at the mid-latitudes (Eckhardt et al., 2004; Pfahl        tropic ascent of WCBs (Wernli, 1997; Schemm et al., 2013).
et al., 2014; Catto et al., 2015). Early studies about WCBs fo-   In addition, latent heat release feeds back on the flow dy-
cused on clouds and precipitation structure (Browning, 1971;      namics by modifying potential vorticity (PV) (e.g. Hoskins
Harrold, 1973). They mainly relied on cyclone-relative isen-      et al., 1985; Wernli and Davies, 1997). To first order, latent
tropic flow analysis, satellite images and radar observations     heat release due to condensation of water vapour in the as-
to identify the WCB, which appear as hammer-shaped cloud          cending WCB leads to positive and negative PV changes be-
bands that are characteristic for extratropical cyclones (e.g.    low and above the level of maximum condensation, respec-
Carlson, 1980; Browning, 1986; Young et al., 1987). The           tively (Wernli and Davies, 1997). For instance, the diabati-
recent study by Joos (2019) investigated the substantial ra-      cally produced low-level positive PV anomaly during WCB
diative forcing exerted by the extended cloud shields asso-       ascent can have an impact on the intensity of the surface
ciated with WCBs. Observational studies (e.g. Muhlbauer           cyclone (Binder et al., 2016; Attinger et al., 2019), while
et al., 2014; Krämer et al., 2016; Luebke et al., 2016; Voigt     the negative PV anomaly in the WCB outflow can inter-
et al., 2017) revealed the differing microphysical properties     act with the upper-tropospheric waveguide, leading to wave
of WCB cirrus compared to other types of cirrus and high-         amplification, Rossby wave breaking and the formation of
lighted their potential importance for radiation and climate.     PV streamers (e.g. Stoelinga, 1996; Massacand et al., 2001;
   This brief summary of general characteristics of WCBs          Grams et al., 2011; Davies and Didone, 2013; Madonna et al.,
emphasises their importance for mid-latitude weather includ-      2014a).
ing heavy precipitation (e.g. Pfahl et al., 2014). For numer-        The simple concept of a diabatically produced PV dipole
ical weather prediction (NWP), WCBs still constitute one          during the WCB ascent introduced by Wernli and Davies
of the most challenging weather elements (Rodwell et al.,         (1997) has been refined in the last decade in at least two
2018) due to their troposphere-deep motion accompanied            important ways. First, it became clear that the microphysi-
by cloud thermodynamical processes from typically +20             cal processes within WCBs are more complex, and, second,
to −50 ◦ C. The presented study investigates a special case       convection was found to potentially occur embedded within
of an orographically influenced WCB over central Europe           the large-scale cloud band of the WCB. Considering micro-
in autumn 2012 using a sequence of measurements taken             physics, Joos and Wernli (2012) were the first to study the
during the Hydrological Cycle in the Mediterranean Ex-            detailed cloud structure of a WCB in a regional NWP model.
periment (HyMeX) and T-NAWDEX-Falcon, a preparatory               The water species in a WCB evolve along the ascent from
field campaign for the THORPEX North Atlantic Waveguide           low-level water vapour via condensation to liquid clouds and
and Downstream Impact Experiment (T-NAWDEX). This se-             via freezing to mixed-phase clouds and then cirrus near the
quence of measurements that are physically related to each        tropopause. Phase transitions also occur beneath the strongly
other by air parcel trajectories is referred to as Lagrangian     ascending WCB air parcels due to sedimenting and poten-
matches (Methven et al., 2006). To the best of our knowl-         tially sublimating or melting hydrometeors (e.g. Crezee et al.,
edge, this is the first successful study that describes La-       2017). Governed by such a variety of microphysical pro-

Atmos. Chem. Phys., 21, 5477–5498, 2021                                            https://doi.org/10.5194/acp-21-5477-2021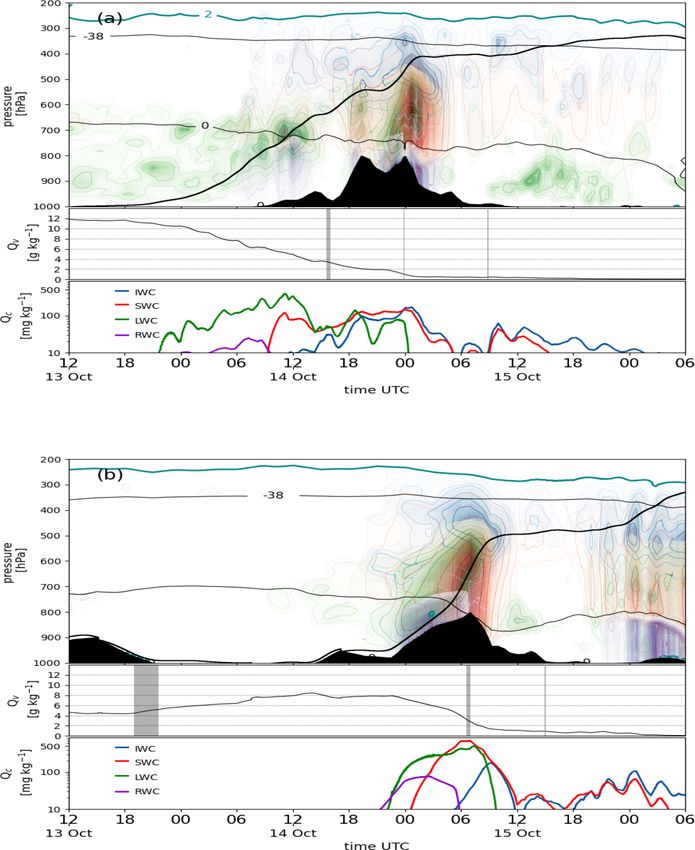
M. Boettcher et al.: Lagrangian matches in an orographic WCB                                                                5479

cesses, this leads to a complex pattern of latent heating in       boundary layer ventilation (Boutle et al., 2011; Pfahl et al.,
the WCB and regions with latent cooling beneath. The mod-          2014). It can also be affected by a recycling of moisture
elling study by Joos and Forbes (2016) showed that the verti-      within the WCB, which occurs, e.g., when raindrops from
cal cloud structure of a WCB is affected by seemingly small        an elevated layer of the WCB fall into a sub-saturated lower
changes in the implementation of the microphysics, with di-        layer of the WCB inflow where they evaporate (Crezee et al.,
rect implications for the detailed shape and amplitude of          2017; Attinger et al., 2019; Spreitzer, 2020).
the upper-tropospheric ridge influenced by the WCB out-               Most observational studies of WCBs so far, e.g. based
flow. More recently, Binder et al. (2020) systematically com-      on surface radar measurements (Browning, 1971) or more
pared the vertical structure of WCB-related clouds in the lat-     recently on aircraft and satellite data (Oertel et al., 2019;
est European Centre for Medium-Range Weather Forecasts             Binder et al., 2020), provide limited information about the
(ECMWF) reanalysis dataset, ERA5 (Hersbach et al., 2020),          variability of the WCB characteristics along the ascent,
with profiles derived from satellite-based lidar and radar ob-     which typically covers spatial and temporal dimensions of
servations and concluded that the model reproduces the over-       > 1000 km and 1 d, respectively. To better address the La-
all cloud structure quite well but underestimates ice and snow     grangian nature of these airstreams, a few pioneering field
water content in the mixed-phase layer in WCBs above the           campaign studies attempted to follow the pathway of a WCB
melting layer. Such weaknesses in models might arise from          with an aircraft and to measure the same WCB air parcels
various assumptions made in microphysical parameterisa-            multiple times (e.g. Stohl et al., 2003; Methven et al., 2006).
tions that account for the subgrid-scale nature of the cloud       In principle, such Lagrangian matches enable investigating
processes and often lead to uncertainties in NWP (Illing-          the material evolution of thermodynamic variables along a
worth et al., 2007; Rodwell et al., 2018). The phenomenon          WCB. A major challenge of such experiments is the planning
of WCB-embedded convection was already pointed out in              of the Lagrangian matches realised by aircraft. In contrast
very early observational WCB studies (e.g. Browning, 1971)         to the boundary layer experiment ASTEX in 1992, where
and then brought up again by Neiman et al. (1993). Recently,       additional balloons were used to follow the mainly two-
Flaounas et al. (2016) and Oertel et al. (2019) confirmed          dimensional movement of trade wind clouds (e.g. Bretherton
the presence of convection embedded in WCBs with radar             and Pincus, 1995; Sigg and Svensson, 2004), the prediction
observations. Oertel et al. (2020) and Oertel et al. (2021)        of the ascending WCB relies on air parcel trajectories us-
showed that WCB-embedded convection can result in locally          ing three-dimensional wind fields from forecasts, which are
enhanced precipitation and that diabatic heating by convec-        inherently uncertain. To cope with this uncertainty, the plan-
tion can influence the upper-level jet by the formation of PV      ning of Lagrangian matches is best done with data from en-
dipole bands.                                                      semble forecasts (Schäfler et al., 2014, 2018). An interesting
   This brief summary reveals the importance of WCBs for           observational approach to identifying Lagrangian matches
understanding precipitation in and the dynamics of extratrop-      is the use of a physical tracer that is measured at consecu-
ical cyclones, but it also indicates the complexity of their as-   tive times to experimentally corroborate the pathway of air
cent behaviour and the involved microphysical processes. It        parcels. Former experiments have proven that naturally oc-
is conceivable that the detailed properties of a WCB strongly      curring boundary layer trace gases and pollutants can effec-
depend on the humidity in its inflow. For numerical weather        tively be transported by the WCB to upper levels of the free
prediction, the correct representation of humidity, particu-       troposphere (Bethan et al., 1998; Purvis et al., 2003). Using
larly in strongly cloudy situations as in WCBs, is still one of    this property, an experiment in 2004 described in Methven
the main challenges (Rodwell et al., 2018). However, most of       et al. (2006) aimed at realising Lagrangian matches between
the climatological investigations (e.g. Eckhardt et al., 2004;     airborne measurements in the free troposphere to study in-
Madonna et al., 2014b) and case studies of WCBs (e.g. Joos         tercontinental transport of pollutants. One case of the cam-
and Wernli, 2012; Martínez-Alvarado et al., 2016) have been        paign involved a WCB, for which the natural occurrence of
based on reanalyses or model simulations only. Compara-            a physical tracer was used to mark air parcels. Another ex-
tively few studies used observations to evaluate the humid-        tensive experiment over Europe in 1994 simulated an emer-
ity in WCBs. Schäfler et al. (2011) investigated airborne li-      gency situation by the release of perfluorocarbon (PFC) trac-
dar measurements of humidity in the low-level inflow of a          ers in the planetary boundary layer (Van Dop et al., 1998).
WCB over Spain and found an overestimation of humidity             Their second tracer release, lasting 12 h, involved a WCB-
in ECMWF analyses. A similar result was found by Schäfler          like situation of a cold front passage, and it was reported
and Harnisch (2015) for the inflow of a marine WCB over            that an aircraft sampled the tracer 700–800 km away from
the eastern North Pacific. Their sensitivity experiments with      the source (Nodop et al., 1998). The results of these up-
the ECMWF forecast model revealed that with the corrected          per air samples, however, do not appear in the literature and
low-level moisture in the initial conditions the WCB outflow       most likely failed. The approach in our study is, for the first
would have occurred at a lower potential temperature level         time, to specifically focus on studying the transport along
and produced a less developed upper-level ridge. The humid-        a WCB by the release and re-sampling of a synthetic in-
ity in the WCB inflow, however, is not only determined by          ert tracer (Ren et al., 2015). For completeness, we briefly

https://doi.org/10.5194/acp-21-5477-2021                                            Atmos. Chem. Phys., 21, 5477–5498, 2021
5480                                                         M. Boettcher et al.: Lagrangian matches in an orographic WCB

note that Lagrangian matches have also been applied in re-         and (iv) if the flight planning method is appropriate such that
search on stratospheric chemistry, for instance, by Rex et al.     the tracer is indeed released in the WCB inflow and that the
(1998) to infer ozone loss rates in the Arctic stratosphere        subsequent Falcon flights targeting the ascending WCB air
from ozonesonde measurements and by Fueglistaler et al.            have a chance of sampling the tracer. In this study we report
(2002) to study the Lagrangian evolution of polar strato-          to what degree we were successful with this challenging ex-
spheric clouds from consecutive airborne lidar observations.       periment.
   Since the majority of the WCBs occur over ocean (e.g.              As shown in detail below, the campaign successfully col-
Madonna et al., 2014b), not many studies exist about conti-        lected valuable observations in the WCB and benefited from
nental WCBs and the potential effects when they rise over          overall good ECMWF forecasts and from the sophisticated
mountains. In their climatological study, Pfahl et al. (2014)      multi-stage flight planning procedure (Schäfler et al., 2014).
found precipitation maxima in regions with orographically          This set of observations will enable us to address the follow-
enhanced WCB ascent. For the European area, a hotspot for          ing specific questions related to this orographic WCB case
WCB ascent and increased precipitation is found along the          study:
Mediterranean side of the Alps. There, over 10 % of total pre-
cipitation is related to WCBs, and they contribute up to 60 %          1. How can ensemble analyses be used to provide prob-
of extreme precipitation events (Pfahl et al., 2014). In a case           abilistic information about the location of WCBs and
study, Buzzi et al. (1998) investigated the flood in the Pied-            about Lagrangian matches between observations?
mont region south of the Alps in November 1994, which was              2. How well do the humidity and cloud structure of the
associated with a WCB. Using numerical experiments with                   WCB in the ECMWF analyses agree with observations
flattened orography, they could show that the WCB-related                 from aircraft, lidar and radar?
precipitation was distinctly enhanced by orography. But so
far, no study has investigated how the pathway of WCB tra-             3. How closely does the transport in WCBs as given by tra-
jectories is affected by the interaction with orography.                  jectory calculations with ECMWF analyses correspond
   In October 2012, a team from the German Aerospace Cen-                 to the dispersion of an actually emitted passive tracer?
ter (DLR) in Oberpfaffenhofen and ETH Zurich organised
                                                                       4. How does the orography of the Alps modify the charac-
a small aircraft research campaign, devoted to obtaining in
                                                                          teristics of the investigated central European WCB?
situ measurements of moisture and thermodynamic parame-
ters in different phases of WCBs over Europe (Schäfler et al.,         5. What is the overall novel insight about WCBs that can
2014). This campaign was termed T-NAWDEX-Falcon and                       be obtained from such a multi-faceted and observation-
occurred in parallel to the comprehensive HyMeX Special                   based case study?
Observation Period 1 (SOP1) (Ducrocq et al., 2014). The
WCB presented in this study occurred during T-NAWDEX-              The paper will continue by introducing the measurements
Falcon’s Intensive Observation Period 2 (IOP2), and it as-         and the analysis products, as well as the procedure to iden-
cended from the western Mediterranean across the Alps to-          tify Lagrangian matches in Sect. 2. The synoptic situation is
wards the Baltic Sea. The WCB was successfully sampled by          described in Sect. 3 before the results from airborne observa-
two Falcon flights. The analysis of the airborne observations      tions are first discussed in Sect. 4.1. Lagrangian matches with
benefits from additional surface lidar observations made in        further observations are described in Sect. 4.2, and the tracer
the framework of HyMeX and from operational radar obser-           experiment in Sect. 4.3. Conclusions, including (partial) an-
vations by MeteoSwiss.                                             swers to the questions posed above, are given in Sect. 5.
   In addition, a tracer experiment with the physical release
of a passive tracer by a small aircraft in the inflow of the
                                                                   2     Data and method
WCB was conducted as part of the T-NAWDEX-Falcon
IOP2. The main objective was to “label” WCB air in the in-         This study uses observations from in situ aircraft measure-
flow and then later “catch” the same air during its ascent by      ments, from ground-based lidar and radar, and from a tracer
the Falcon aircraft. However, such an experiment can only          release experiment. The observational datasets are briefly in-
be successful (i) if a tracer gas is released that otherwise       troduced in the following subsections. Then a special diag-
does not exist in the atmosphere or has a very low atmo-           nostic method, based on ECMWF ensemble analysis data,
spheric background concentration like PFCs, such that any          is introduced that serves to identify WCBs and Lagrangian
observation of the tracer can be uniquely associated with          matches between measurements.
the release experiment; (ii) if a suitable and highly sensi-
tive airborne sampling and analysis technique is available,        2.1    T-NAWDEX-Falcon humidity measurements
which allows measuring potentially low concentrations after
long-range transport and dilution; (iii) if the forecast is ex-    For the T-NAWDEX-Falcon campaign in October 2012 the
act enough to reproduce a fairly realistic picture of the actual   German DLR Falcon aircraft was operated from the base
flow situation that serves as the basis for the flight planning;   at DLR in Oberpfaffenhofen, near Munich (Schäfler et al.,

Atmos. Chem. Phys., 21, 5477–5498, 2021                                               https://doi.org/10.5194/acp-21-5477-2021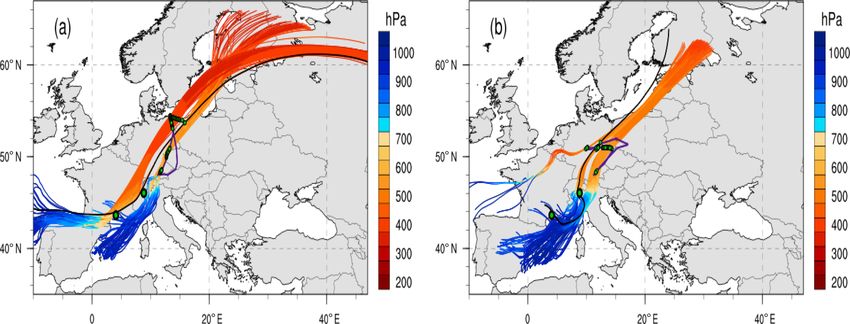
M. Boettcher et al.: Lagrangian matches in an orographic WCB                                                                5481

2014). The Falcon flights on 15 October 2012 were con-              0.035 g kg−1 (or 7 %) at 10 km. The procedure applied to
ducted from 07:34 to 10:52 UTC for flight IOP2b and from            calibrate water vapour mixing ratio profile measurements by
13:04 to 16:03 UTC for flight IOP2c. In this study in situ          BASIL was described in detail by Di Girolamo et al. (2016).
measurements of specific humidity are used that were taken          During HyMeX SOP1, BASIL was calibrated based on the
from the basic instrumentation of the aircraft and from the         comparison with radiosondes launched from the lidar site,
tuneable diode laser system WARAN (WAter vapoR ANa-                 with the launching facility being approximately 100–150 m
lyzer; Kaufmann et al., 2014, 2018). The Falcon basic mea-          away from the lidar system (Di Girolamo et al., 2016). More
surements for water vapour result from a composite of three         specifically, the mean calibration coefficients were estimated
instruments, where emphasis is placed on the Lyman-alpha            by comparing BASIL with the radiosonde data at all times
absorption instrument1 . For flight IOP2b, WARAN was in-            when both systems were simultaneously operated (for a total
stalled with a forward-facing inlet so that it collected wa-        of approximately 50 comparisons). The uncertainty affect-
ter of all phases and hence resulted in observations of to-         ing the calibration constant is estimated to be 3 %. Only data
tal water. For flight IOP2c, the inlet was reversed such that       outgoing from the instrument upward until a relative error of
no total water measurements were possible during this flight        100 % is reached are used, that is, up to 5–6 km in daytime
(Voigt et al., 2014; Kaufmann et al., 2016). For IOP2b,             and up to the tropopause at night. For the purpose of this re-
the cloud water content was calculated assuming saturation          search effort, profiles up to an altitude of about 3000 m, or
with respect to liquid water for T > −30 ◦ C and ice for            700 hPa, are considered. BASIL measured continuously be-
T ≤ −30 ◦ C. Particle enhancement at the inlet is corrected         tween 21:44 UTC on 13 October until 19:03 UTC on 14 Oc-
assuming a mean particle radius of 20 µm (Krämer and Af-            tober (Di Girolamo et al., 2016).
chine, 2004). The sampling efficiency of much larger parti-
cles like raindrops or snow cannot be quantified directly and       2.3   Monte Lema radar
thus imposes an additional uncertainty on the measured cloud
water content. The 2 s in situ measurements of WARAN are            The Monte Lema radar is part of the Swiss network of C-
smoothed with a 5 min running mean, which corresponds to            band (5.5 GHz) Doppler weather radars operated by Me-
about the time the aircraft needs to intersect a horizontal grid    teoSwiss, and it is located on the southern slopes of the Alps
box of 0.5◦ (about 50 km) in the model. The same is applied         at 46.04◦ N, 8.83◦ E, and 1626 m altitude. Monte Lema was
to the 1 s water vapour observations. Since the measurements        upgraded in 2011 to dual polarisation, which, together with
are taken as water vapour mixing ratio and total water mix-         other technical enhancements, provided increased data qual-
ing ratio per volume, they are converted to specific humidity       ity (Germann et al., 2015; Gabella et al., 2017). The volume
Qv and cloud water content Qc , respectively, for comparison        scan geometry comprises 20 elevations from −0.2 to 40◦
with model data.                                                    with a maximum range of about 18 km vertically and 246 km
                                                                    horizontally, while the interleaved scan strategy provides a
2.2   HyMeX Raman lidar                                             new full volume scan every 5 min. The methods for reading
                                                                    and processing of the raw polar data from Monte Lema radar
Data collected during HyMeX SOP1 (Ducrocq et al., 2014)             can be read in Figueras i Ventura et al. (2020).
by the Raman lidar system BASIL (University of BASILi-
cata Raman lidar system; Di Girolamo et al., 2009) are used.        2.4   Tracer experiment
The instrument was positioned at the HyMeX “supersite” in
Candillargues, near Montpellier (43.61◦ N, 4.07◦ E) on the          A tracer experiment was performed using the perfluo-
French Mediterranean coast. BASIL provides profiles of wa-          rocarbon tracer system PERTRAS. This instrument was
ter vapour starting from 60 m above the ground up to the            newly designed for studying Lagrangian long-range trans-
lower stratosphere in steps of 30 m. A vertical 300 m running       port and related dispersion of chemical species, e.g. in
average is applied to each profile as well as a 1-hourly time       the Asian monsoon system (Ren et al., 2015). Perfluo-
running mean to account for comparison with the coarser re-         romethylcyclopentane (PMCP C6F12) has very low back-
solved model data. Considering an integration time of 1 h and       ground concentrations in the atmosphere of 6–7 ppqv in
a vertical resolution of 300 m, the statistical uncertainty af-     Europe (Watson et al., 2007) and is thus very well suited
fecting daytime water vapour mixing ratio measurements is           for a tracer experiment. For the T-NAWDEX-Falcon cam-
found to be smaller than 0.5 g kg−1 (or 10 %) up to 2.5 km          paign, the release unit of PERTRAS for the inert tracer
and smaller than 3 g kg−1 (or 40 %) up to 4 km. Night-time          gas was installed on board the light aircraft Partenavia P68
performance is characterised by much smaller uncertainties,         operated by enviscope (http://www.enviscope.de/enviscope_
with a random error affecting vapour mixing ratio measure-          new/operation/airborne-platforms/partenavia-p68, last ac-
ments not exceeding 0.01 g kg−1 (or 0.5 %) at 4 km and of           cess: 30 March 2021). The sampling unit of PERTRAS, on
   1 Information     obtained    at     https://www.dlr.de/fb/en/   the other hand, was installed on board the Falcon. The in-
desktopdefault.aspx/tabid-3718/5796_read-8410/, last access:        tention to separate the release unit from the sampling unit
19 June 2020.                                                       was to exclude possible contamination throughout the re-

https://doi.org/10.5194/acp-21-5477-2021                                            Atmos. Chem. Phys., 21, 5477–5498, 2021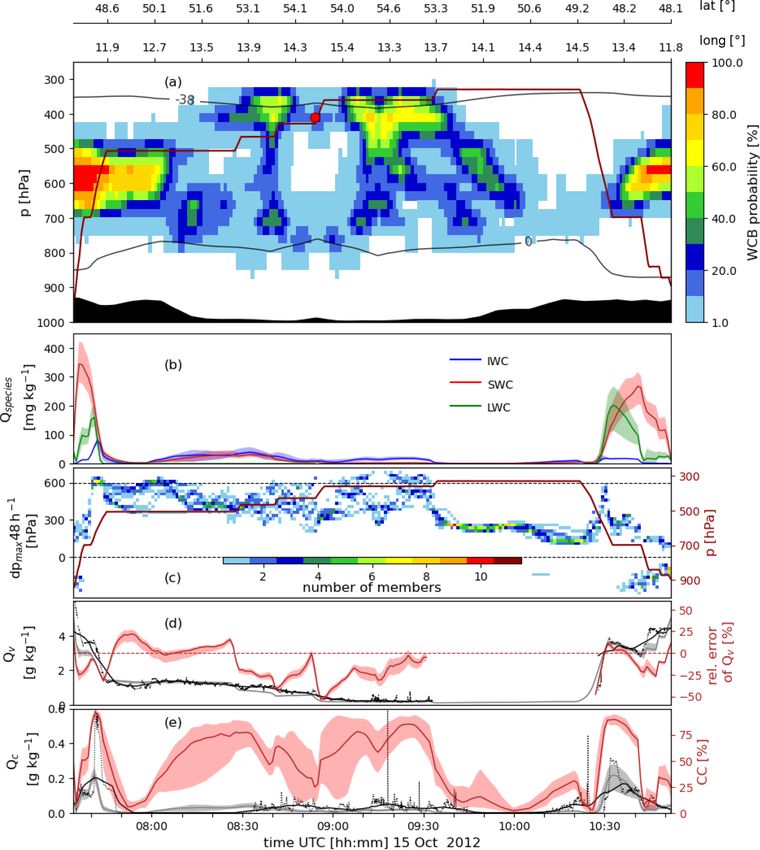
5482                                                        M. Boettcher et al.: Lagrangian matches in an orographic WCB

sampling of the tracer and to meet the logistic demands given        To know where WCB air masses ascend during the IOP,
by the relatively fast transport of air masses between the        trajectories are started from the grid points between 1025
WCB inflow and outflow stage. The Falcon installation al-         and 700 hPa with vertical steps of 25 hPa between 1000 and
lowed probes of air to be collected at an interval of about       100 hPa. They are initialised every 3 h over several days
5 min, yielding a spatial resolution of 50 km. Such an experi-    and calculated 48 h forward in time with trajectory positions
ment could be conducted only once during the T-NAWDEX-            saved every 1 h. To identify WCB trajectories, only the ones
Falcon campaign and had to be carefully planned based on          are selected that ascend at least 600 hPa in 48 h (Madonna
the operational ECMWF forecasts (Schäfler et al., 2014).          et al., 2014b). WCB probabilities are calculated using the
During IOP2 on 14 October 2012 suitable conditions were           WCB trajectories calculated for all 11 EDA members based
given; the Partenavia was therefore transferred to southern       on the method that has been adopted from Schäfler et al.
France and released in the morning hours between 09:09 and        (2014) and Rautenhaus et al. (2015). More specifically, the
09:39 UTC 9.2 L of the tracer in the target region. The liquid    trajectories are disassembled into individual air parcel posi-
PMCP tracer was dispersed using a spray nozzle connected          tions and then, for a given time, sorted into grid boxes with
to the tracer reservoir and mounted outside the window of the     a horizontal dimension of 0.5◦ in the horizontal and 50 hPa
Partenavia. PMCP droplets with diameters less than 20 mm          in the vertical. For each grid box, the WCB probability (in
were released, which evaporated readily. A day later, on          per cent) then corresponds to the relative number of EDA
15 October, two Falcon flights (24 and 30 h after the release)    members that have at least one WCB trajectory in the box.
above Germany were devoted to re-sampling the tracer in the       The method results in a time sequence of Eulerian three-
ascending air masses. For the tracer sampling, 64 adsorption      dimensional fields of WCB probabilities.
tubes were used where the PMCP molecules were trapped                EDA-based trajectories are also used to identify La-
and concentrated. The samples were analysed after the flights     grangian matches between aircraft measurements at one time
in the laboratory using a gas-chromatic method described in       and any type of measurements at an earlier or later time. To
Ren et al. (2014). Unfortunately, a technical issue concerning    this end, forward and backward trajectories are calculated in
the manual time adjustment of the device may have occurred        each member of the EDA, starting every minute from the re-
during the first sampling flight, IOP2b.                          spective flight route (coloured example trajectories in Fig. 1).
                                                                  The time range of the trajectories is backward to 12:00 UTC
2.5    Model data                                                 on 13 October and forward to 12:00 UTC on 16 October to
                                                                  cover all measurements and the entire WCB ascent. In this
For the calculation of WCB trajectories, we use the En-           set of trajectories, those that fulfil the ascent criterion de-
semble of Data Assimilations (EDA) dataset from the Eu-           scribed above are labelled as WCB trajectories. Similar to
ropean Centre for Medium-Range Weather Forecasts. The             the method to obtain WCB probabilities, the positions of the
EDA represents the best possible estimate of the state of the     EDA trajectories at a time of interest are assigned to grid
atmosphere considering uncertainties associated with obser-       boxes (grey boxes in Fig. 1). Trajectory positions are hence
vations and the ECMWF data assimilation system. It became         available as a time sequence of Eulerian three-dimensional
operational in 2010, and in 2012 it became available as a         probability fields (number of contributing EDA members;
set of 11 analyses that primarily serves to improve the initial   boxes with different grey shadings in Fig. 1). Matches be-
conditions of the ensemble prediction system (Isaksen et al.,     tween measurements along the aircraft track from which the
2010), with 1 control analysis (CTL) and 10 perturbed mem-        trajectories were started and any other measurements occur
bers. The slightly differing analyses are obtained by perturb-    when the trajectory probability (calculated with trajectories
ing atmospheric observations, sea surface temperature fields      that started from the flight track) in the grid box that corre-
and model physics in the 4D-Var data assimilation cycle. The      sponds to the time and location of the other measurement is
original resolution of the EDA of T399L91 in 2012 is inter-       larger than zero (the observing instrument in Fig. 1 which, in
polated to a 0.5◦ horizontal grid on the original 91 model        the example shown, diagnoses differing matching probabili-
levels. In addition to the 6-hourly standard EDA times, the       ties with altitude). Hence, this procedure to identify matches
intermediate products at 03:00, 09:00, 15:00 and 21:00 UTC        accounts for the exact time (of the measurement) but with a
are also used to increase the time resolution.                    tolerance in space, represented by the 0.5◦ grid box around
                                                                  the exact trajectory position. If the trajectory probability is
2.6    Trajectories and WCB probabilities                         high, then the Lagrangian match between the measurements
                                                                  can be regarded as more “certain”. If a matching trajectory
Kinematic offline trajectories are calculated using the La-       also fulfils the WCB criterion, then we refer to this as a WCB
grangian analysis tool LAGRANTO (Wernli and Davies,               match, i.e. then we know that two measurements at different
1997; Sprenger and Wernli, 2015). Here, we use trajectories       times and locations were sampling the same air parcel and
to detect WCBs as well as matches between measurements            that this air parcel was actually part of a WCB. These WCB
in each member of the EDA, and they are therefore a central       matches are of particular interest for our study.
part of this study.

Atmos. Chem. Phys., 21, 5477–5498, 2021                                             https://doi.org/10.5194/acp-21-5477-2021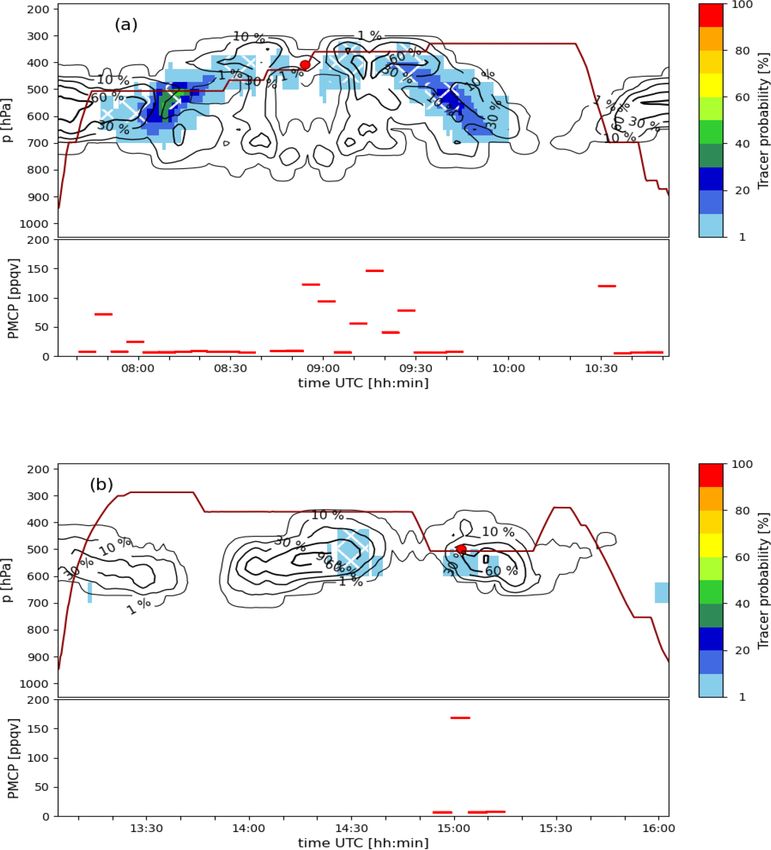
M. Boettcher et al.: Lagrangian matches in an orographic WCB 5483
image (Fig. 2d and black dots at 12:00 UTC on 14 October
in Fig. 2b).
The cold front of the cyclone is located over the north-
western part of the Iberian Peninsula and western France
at 12:00 UTC on 14 October, when the wind direction over
the northwestern Mediterranean turned to a moist southwest-
erly flow onshore (Fig. 2c). In this flow, ahead of the surface
cold front, another WCB branch is discernible at low levels
(Fig. 2b) while this region is covered by heavy convective
clouds in the satellite image (Fig. 2b, d; see also Duffourg
et al., 2018, about the associated heavy convective precipi-
tation event). The inflow of this Mediterranean WCB branch
passes the HyMeX lidar just southeast (Fig. 2b). On a smaller
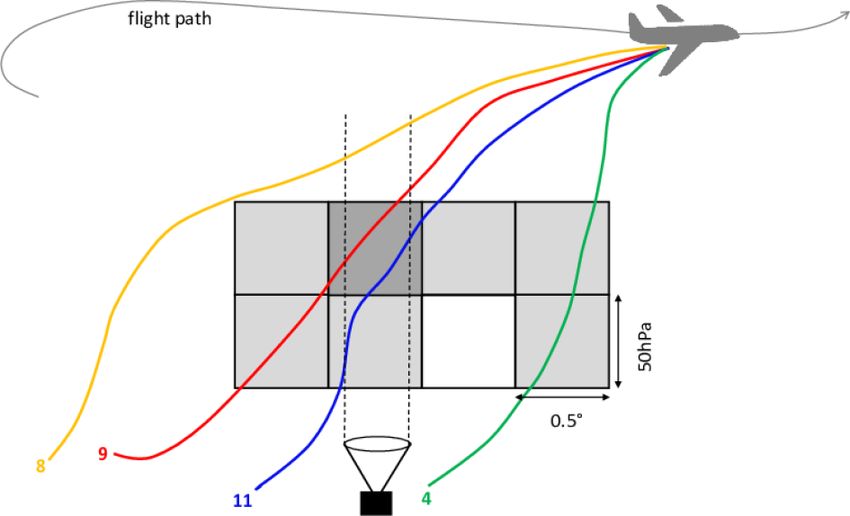
Figure 1. Schematic of the matching method: backward trajectories scale, after 15:00 UTC on 14 October a secondary lee cy-
from the aircraft calculated in different EDA members (coloured clone occurs east of the Maritime Alps in the Italian Pied-
trajectories), grid boxes with contributions from different numbers mont region (red “L2 ” for the mature lee cyclone in Fig. 3b).
of EDA members (grey boxes; corresponding to match probabili- The preceding upper-level PV cutoff forms a streamer-like
ties of 0–18 % in this example, 18 % because 2 out of 11 ensemble structure during the development of the main cyclone L and
members indicate a match) and a remote sensing instrument observ- subsequently extends southward over the western Mediter-
ing the match probability at that certain time step (black icon at the ranean (Fig. 3b). The low-level lee cyclone L2 intensifies
bottom). due to the interaction with the upper-level PV streamer.
The Mediterranean WCB branch shown in Fig. 2b moves
northeastward ahead of the PV streamer. Between 00:00 and
3 Synoptic situation 06:00 UTC on 15 October, the WCB branch passes cyclone
L2 (Fig. 3b) and impinges upon the Alps, where it is forced to
The 2 d IOP2 of the T-NAWDEX-Falcon campaign was ascend. There the WCB air stream crosses the Monte Lema
planned to take measurements along a WCB ascending from radar in the early phase of the ascent (red marker in Fig. 3b).
the western Mediterranean over the Alps towards the Baltic Within the next 6 h, the Mediterranean WCB air parcels reach
Sea. The WCB was induced by a low-pressure system that the middle troposphere and proceed with a moderate as-
originated in the central North Atlantic before 13 Octo- cent rate over Germany towards the Baltic Sea, where it ap-
ber 2012. WCB air masses start from the warm sector al- proaches the Atlantic WCB branch. Along with the WCB,
ready during this earlier phase of the cyclone while it moves the cold front of the main cyclone L proceeds into central Eu-
eastward, steered at the southern flank of a complex upper- rope. Together they form the stratiform and scattered cloud
level PV cutoff (Fig. 2a, b; the cyclone is marked by a red band that is visible in the satellite image at 06:00 UTC on
“L” in a). Downstream of the cyclone a zonal wind direction 15 October (Fig. 3a). The research flight IOP2b was designed
prevails at low levels over France at 18:00 UTC on 13 Oc- to climb stepwise along the WCB ascent towards northeast
tober (Fig. 2a). North of the Pyrenees and further east over Germany and then to cross the outflow in the area of north-
the Mediterranean, the low-level flow is orographically in- ern Germany, Poland and the Baltic Sea approximately in
fluenced and arrives with increased wind speed and reduced an east–west direction (red/violet flight route in Fig. 3b). In
humidity at the northwestern Mediterranean, as reflected the northernmost part, the flight route traverses the centre of
by low equivalent potential temperature values. This local the surface cyclone. As with flight IOP2b, flight IOP2c (blue
wind, called “Tramontane”, is the subject of a case study flight route in Fig. 3b) also occurs in the region of the WCB
by Di Girolamo et al. (2016) as part of the HyMeX cam- and the cold front, which is crossed several times.
paign. They use observations of the HyMeX lidar that started South of the Alps the upper-level PV streamer cuts off, and
operating at 21:44 UTC on 13 October (see westernmost red the former lee cyclone L2 evolves into a wide cyclone below
marker for the lidar in Fig. 2). Within the westerly flow, WCB the PV cutoff (not shown). The initial cyclone L, however,
trajectories originating over the Atlantic are embedded and weakens over the Baltic Sea and re-intensifies later below a
start to ascend prior to passing the lidar (Fig. 2b). At the same newly formed short-wave trough in the hours after the re-
time, another WCB branch north of the one from the Atlantic search flights. In the upper levels, the WCB outflow is di-
starts to rise over France. These two northern WCB branches rected northeastward by the short-wave trough (not shown).
with inflow from the Atlantic are directly steered by the sur-
face cyclone that enters France from the Bay of Biscay at
06:00 UTC on 14 October (not shown). The cloud band re-
lated to this ascending part of the WCB is visible east and
north of the cyclone centre a few hours later in the satellite
https://doi.org/10.5194/acp-21-5477-2021 Atmos. Chem. Phys., 21, 5477–5498, 2021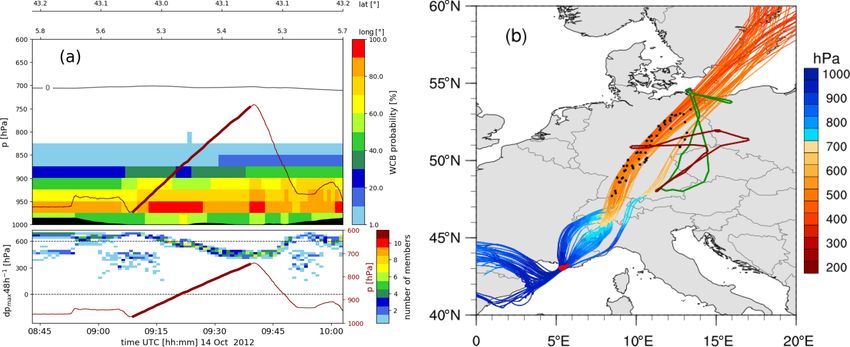
5484 M. Boettcher et al.: Lagrangian matches in an orographic WCB
Figure 2. Synoptic development during the T-NAWDEX-Falcon IOP2: (a) EDA mean equivalent potential temperature at 850 hPa (colours,
K), sea level pressure (SLP, black contours every 1 hPa), wind arrows at 850 hPa (black) and PV at 315 K (white line of 1.5 and 2 PVU) at
18:00 UTC on 13 October 2012. Red asterisks mark the measurement stations of the HyMeX lidar, the Monte Lema radar and the airbase of
Falcon. (b) WCB trajectories of the EDA’s CTL starting at 00:00 UTC on 14 October 2012 (coloured by pressure, hPa) and SLP (black lines
every 2 hPa valid at 12:00 UTC on 14 October), with trajectory markers (black dots) for 12:00 UTC on 14 October. Panel (c) shows the same
as panel (a) but for 12:00 UTC on 14 October. (d) Meteosat infrared image at 12:00 UTC on 14 October. The red “L” in panels (a), (c) and
(d) marks the location of the surface cyclone.
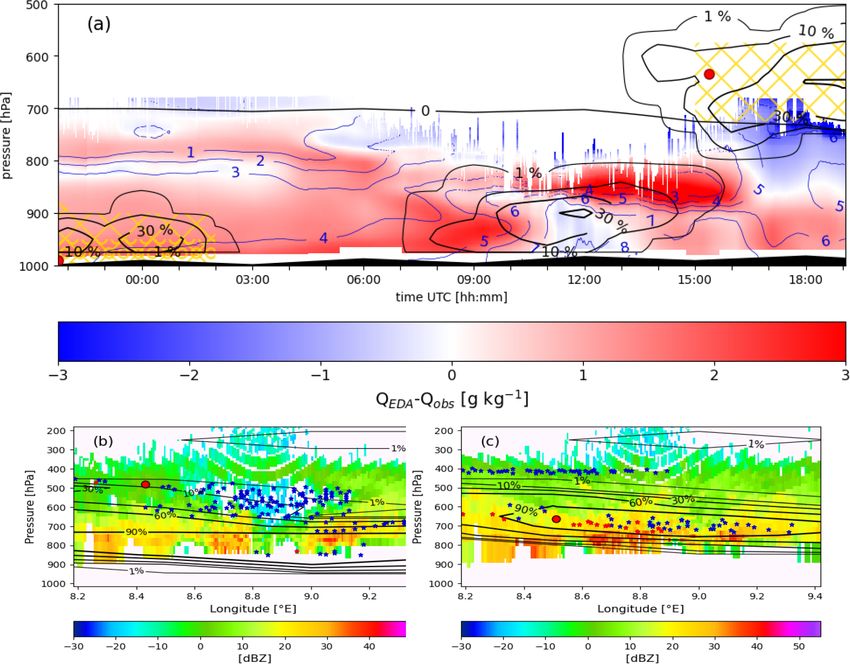
4 Results 07:36 UTC (Fig. 4b, red curve in e), which indicates snow
falling from the WCB into a subsaturated region (not shown),
4.1 Aircraft measurements where it likely sublimates. Exactly there, water vapour in the
EDA is distinctly lower than the measured value, as shown
The two Falcon flights of the T-NAWDEX-Falcon IOP2 by a downward deflection of the relative error of the EDA’s
north of the Alps on 15 October 2012 are presented in the fol- moisture with respect to the measured values (Fig. 4d, red
lowing two subsections. They form the starting points for in- curve).
vestigating Lagrangian matches with further observations of Subsequently, where the aircraft intersected the WCB with
this WCB in a later section. Here we elaborate where WCB the maximum probability at 07:42 UTC at an altitude of
air was transected by the flights, and we compare the airborne 560 hPa, the EDA consistently shows a peak of 100 % cloud
in situ observations of water vapour and cloud condensate cover (Fig. 4a, c, red line in e). The EDA cloud condensate
with the EDA. along the WCB consists of high values of SWC, LWC and
also ice water content (IWC, Fig. 4b). LWC and IWC peak
4.1.1 Flight IOP2b at the time of 100 % cloud cover. The in situ measurements
of water vapour and cloud condensate Qc confirm the moist
The morning flight IOP2b on 15 October was intended to fol- and cloudy conditions in this early flight period, with mean
low the gradual mid-level to upper-level ascent of the WCB observations in the range of the interpolated values from the
from southern Germany towards the Baltic Sea as indicated EDA (compare black and grey lines in Fig. 4d, e). A dis-
by the WCB’s cloud band in Fig. 3a. The aircraft took off in tinctly greater peak of Qc is visible at the native resolution
overcast conditions and ascended immediately towards mid- of measured Qc that coincided with the highest WCB proba-
level WCB air between 700 and 500 hPa. Before entering this bility and the peak in cloud cover. Note that, for fair compari-
layer, where WCB probabilities reaches values up to 100 % son, cloud condensate Qc in the EDA is here calculated from
(Fig. 4a), snow water content (SWC) peaks with negligible the non-sedimenting cloud species LWC and IWC alone (i.e.
liquid water content (LWC) and cloud cover in the EDA at
Atmos. Chem. Phys., 21, 5477–5498, 2021 https://doi.org/10.5194/acp-21-5477-2021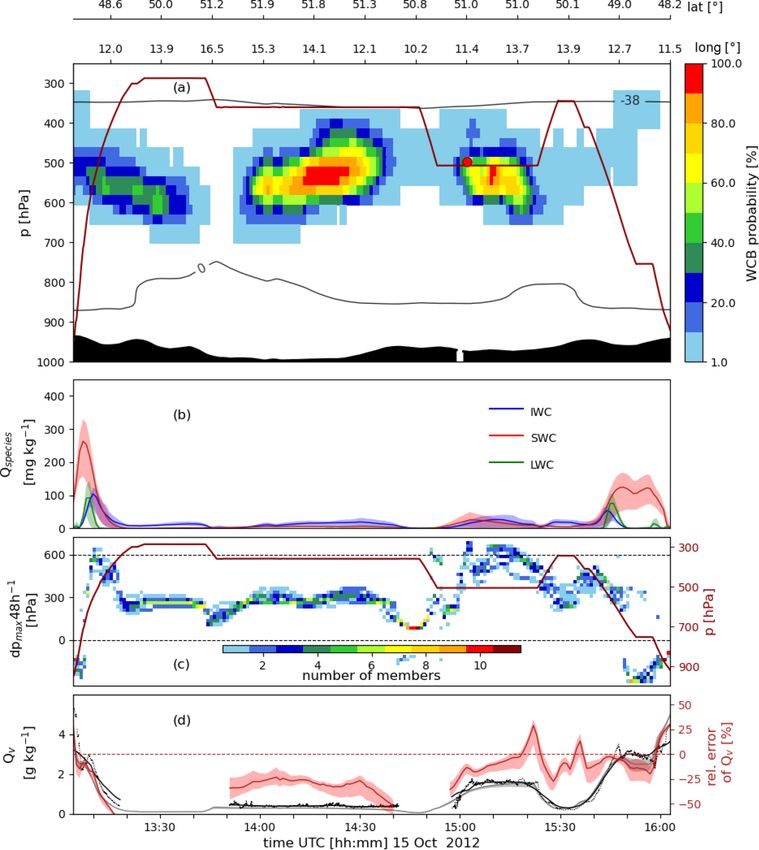
M. Boettcher et al.: Lagrangian matches in an orographic WCB                                                                  5485

without SWC) since the Waran instrument most likely did             of the WCB as they were slightly too high and too low,
not efficiently collect sedimenting snow particles. According       respectively. In all clouds within or near the WCB the ob-
to the slope of the 0 ◦ C isotherm (black line in Fig. 4a), the     served cloud condensate agrees well with the EDA values.
aircraft ascends from behind the surface cold front into the        According to the EDA, the lower part of the WCB con-
warm sector of the cyclone in the mid-troposphere, which is         tains supercooled liquid water at temperatures between −5
a typical region for WCB ascent.                                    and −10 ◦ C. As found by radar observations in Gehring
   After the initial climb, the aircraft continued with a           et al. (2020), the formation of supercooled liquid water in
35 min quasi-horizontal leg at 500 hPa (from about 07:45            the phase of strongest WCB ascent facilitates riming, which,
to 08:30 UTC). According to most of the EDA members,                together with aggregation due to strong wind shear and tur-
the flight is first located along the upper edge of the WCB         bulence below the WCB, would provide ideal conditions for
and then outside (Fig. 4a). For these air masses, the maxi-         rapid precipitation growth.
mum 48 h ascent varies between more than 600 and 300 hPa
(Fig. 4c). Specific humidity agrees fairly well between EDA         4.1.2   Flight IOP2c
and observations in this period (Fig. 4d). The concentration
of the cloud species in the EDA are much lower than before          The flight in the afternoon of 15 October again went towards
when crossing the WCB (Fig. 4b). The measurements reveal            the Baltic Sea (see blue line in Fig. 3b) and crossed the cold
that Qc goes down to (near) zero during this period, while          front with WCB probabilities up to 40 % at around 550 hPa
the EDA values show small but elevated condensate of IWC            (Fig. 5a). As for the previous flight, the ascent across the
and some SWC (Fig. 4b, e).                                          WCB leads to peaks of first SWC (at the lower edge of the
   The subsequent stepwise ascent of the aircraft leads to in-      WCB) and then LWC and IWC (within the WCB) according
tersections with the WCB outflow between 450 and 350 hPa,           to the EDA (Fig. 5b). Here, water vapour is underestimated
where WCB probabilities reach up to 70 % at 08:40 UTC and           in EDA compared with the measurements and shows a local
from 09:00 to 09:45 UTC (Fig. 4a). There, the aircraft is on        minimum (Fig. 5d) where snow is likely to sublimate below
its northernmost leg and crosses the WCB first eastward and         the WCB as already seen in the flight before.
later westward (Fig. 3b) with the turning point at 09:15 UTC.          The subsequent flight leg at 350 hPa is located just above
Near that time, increased WCB probabilities extend verti-           an extended region with high WCB probabilities. The ob-
cally from 850 to 350 hPa. At the level of the aircraft the         served air ascended by 300 hPa within 48 h according to
maximum ascent of the observed air mass is highly uncertain         Fig. 5c. The measured specific humidity in EDA is again too
and varies between 300 and 700 hPa in 48 h (Fig. 4c). There,        low (Fig. 5d). Given the moderate ascent of this air and its lo-
the flight crosses the cold front once again, and deep convec-      cation just above the WCB, it is plausible that this cloud layer
tion just ahead of the cold frontal cloud band near the Baltic      corresponds to a so-called in situ cirrus, which often tops the
Sea coast is visible in the satellite image (Fig. 3a). Cloud con-   liquid-origin cirrus produced by the strongly ascending WCB
densate values in EDA are rather low (Fig. 4b) and smaller          (Wernli et al., 2016).
than those measured. This is similar for water vapour, where           Shortly before 15:00 UTC, the aircraft descended to
EDA values are also lower than the ones observed (Fig. 4d,          500 hPa and, according to the EDA, intersected a region with
e).                                                                 WCB probabilities up to 100 % (Fig. 5a). Along this flight leg
   After a high-altitude southward transfer, the aircraft           between 15:00 and 15:25 UTC, SWC and IWC are elevated
started to descend at about 10:25 UTC to 700 hPa while              in EDA (Fig. 5b). The observed water vapour is still higher
crossing again to the cold side of the surface front at             than in the EDA, but with a smaller deviation than before.
10:30 UTC. Thereafter, WCB probabilities reach up to 30 %           The bump of the 0 ◦ C isotherm below the aircraft in Fig. 5a
and EDA show high values of LWC and SWC, indicating su-             indicates that the aircraft crossed the surface cold front and
percooled liquid water in the mixed-phase cloud at the lower        entered the warm sector at 15:20 UTC before crossing the
edge of the WCB (Fig. 4a, b). This is very similar to the in-       cold front again in the reverse direction at 15:35 UTC.
tersection of the lower edge of the WCB in the beginning               Taking both flights (IOP2b and 2c) together, the aircraft
of the flight at around the same pressure level. Again, the         sampled WCB air with high probability during the ascent and
EDA values of cloud condensate are larger than in any other         outflow of the WCB on several legs of the flights. Whenever
flight period, but here they are slightly higher than the ob-       high WCB probability was intersected, specific humidity and
servations (Fig. 4e). For water vapour the agreement is better      cloud condensate in EDA are increased. The magnitude and
(Fig. 4d) but again shows reduced values in the EDA, where          structure of cloud condensate are well represented in the
high SWC coincides with low LWC and cloud cover below               EDA compared with the observations. Water vapour is often
the WCB between 10:43 and 10:47 UTC.                                underestimated, in particular below increased WCB proba-
   In summary, Falcon flight IOP2b intersected the WCB              bility, where precipitation is likely to sublimate or evaporate.
with a high probability in the mid-troposphere during the as-       Short periods with overestimated water vapour in EDA oc-
cent and at its outflow level. However, two horizontal legs         curred near regions with large gradients of WCB probabil-
(before 08:00 and after 10:30 UTC) just missed the centre           ities, i.e. where the aircraft encountered regions with lower

https://doi.org/10.5194/acp-21-5477-2021                                             Atmos. Chem. Phys., 21, 5477–5498, 2021
5486 M. Boettcher et al.: Lagrangian matches in an orographic WCB
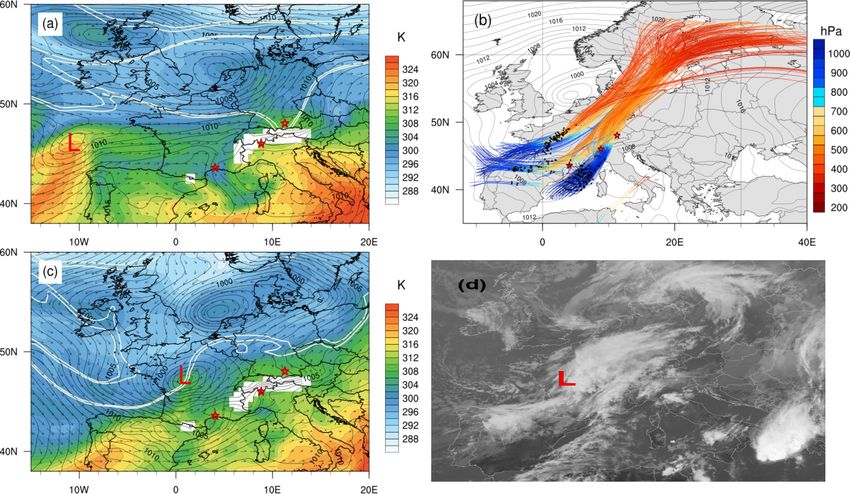
Figure 3. Continuation of the synoptic situation: (a) Meteosat IR image at 06:00 UTC on 15 October 2012, (b) same as in Fig. 2a but for
09:00 UTC on 15 October. In panel (b) flight IOP2b is shown in red with the violet part from 08:30 to 09:30 UTC, flight IOP2c is shown in
blue and the red “L2 ” marks the position of the secondary cyclone.
probability of WCB occurrence in the EDA and where, in The WCB observations during IOP2c are dominated by
reality, most likely large gradients in humidity occurred. the Mediterranean branch (Fig. 6b) with an ascent com-
parable to the one described before. Also this branch was
(partially) observed by both ground-based instruments be-
4.2 Lagrangian matches of the aircraft-probed WCB
fore being sampled by the Falcon between 600 and 500 hPa
air masses with ground-based measurements
(Figs. 6b, 5a). During this flight, only few WCB trajectories
with inflow from the Bay of Biscay were observed by the
In this section, the pathway of the aircraft-observed WCB Falcon. However, a small bundle of WCB trajectories from
air, i.e. of WCB trajectories that intersected the flight route, this region ascended much further northwest compared to the
is considered in more detail. In addition, where possible, rest of the WCB, presumably mainly lifted by the cold front
ground-based water vapour lidar and precipitation radar mea- and without an orographic influence. These trajectories were
surements south of the Alps are considered, which, un- measured by the aircraft at the westernmost tip of the flight
planned, sampled some of the WCB air masses during the at 500 hPa at 14:50 UTC.
inflow and ascent phase. From the WCB trajectories that “matched” with the li-
Both Falcon flights presented in the previous section en- dar and radar, i.e. intersected the vertical column above both
countered different WCB branches, which originated either ground-based instruments before being sampled by the air-
from the North Atlantic or the Mediterranean (Fig. 6). The craft, two are selected as exemplary WCB trajectories and
two WCB intersections during IOP2b in the mid and upper referred to as trajectory T1 and T2. T1 represents the WCB
troposphere, respectively, are related to these two branches, branch with inflow from the North Atlantic that was sampled
as shown in Fig. 6a, for the WCB trajectories that were sam- during flight IOP2b, and T2 the WCB branch with inflow
pled by the Falcon flight. The branch with inflow from the from the Mediterranean sampled during flight IOP2c (black
North Atlantic starts ascending towards the east over the trajectories in Fig. 6a and b, respectively). We emphasise that
Pyrenees, passes the HyMeX lidar station at the Mediter- these triple Lagrangian matches along the WCB trajectories
ranean coast (southernmost green dot in Fig. 6a), enters the between lidar water vapour, radar reflectivity and aircraft in
domain of the Monte Lema radar at the southern slope of the situ measurements provide a rare opportunity to compare the
Alps (green dot further northeast in Fig. 6a), and is eventu- evolution of humidity and clouds along a WCB in analy-
ally observed by the Falcon during the northernmost leg of sis data with independent observations. In the following two
flight IOP2b from 08:30 to 09:30 UTC at 350 hPa (northern- subsections, the ascent behaviour and cloud evolution along
most green dots in Figs. 6a, 4a). The Mediterranean WCB the selected North Atlantic and Mediterranean trajectories T1
branch, however, crosses the HyMeX lidar at very low levels and T2 are discussed.
during its inflow period (at least some of its trajectories) and
then starts ascending south of the Alps where it is observed 4.2.1 WCB ascent from the North Atlantic
by the Monte Lema radar. After crossing the Alps, this WCB
branch is then sampled by the Falcon in the mid-troposphere Trajectory T1 with inflow over the North Atlantic started to
at 650–500 hPa (see green dots in Fig. 6a over southern Ger- ascend gradually in the late hours of 13 October to the west
many). The ascent of this branch occurred more steadily and of continental Europe (Fig. 7a). The initial ascent goes along
the outflow reached further north, compared to the North At- with the formation of liquid cloud water and later rain as the
lantic branch. lifting continues north of the Pyrenees at about 06:00 UTC
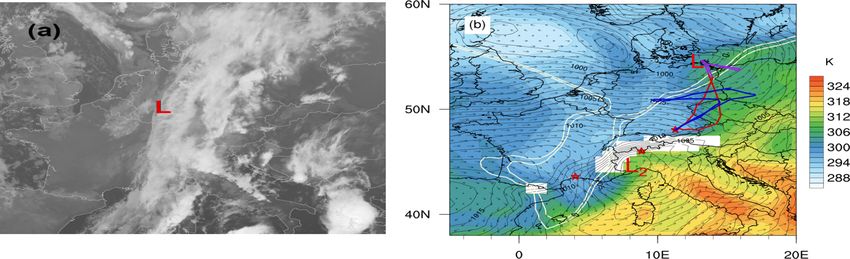
Atmos. Chem. Phys., 21, 5477–5498, 2021 https://doi.org/10.5194/acp-21-5477-2021M. Boettcher et al.: Lagrangian matches in an orographic WCB 5487 Figure 4. Time series of measurements and interpolated EDA fields along the Falcon flight IOP2b from 07:34 to 10:52 UTC on 15 Octo- ber 2012. (a) WCB probabilities (colours, in %) in the vertical column along the flight track, pressure of the aircraft altitude (dark red line, in hPa) and EDA mean temperature (0 and −38 ◦ C, black lines); (b) EDA cloud species (see legend, in mg kg−1 ); (c) maximum pressure decrease (ascent) within 48 h of the air parcels that were measured during the flight, calculated for each EDA member (left y axis) and, as in panel (a), flight altitude (in hPa, right y axis); (d) specific humidity Qv (in g kg−1 ) from in situ measurements (black line for 5 min running mean and native resolution as dots) and from EDA (grey line for mean and shading between minimum and maximum EDA values), with relative error of the EDA members compared to the measurements 100 · (QEDA − Qv )Q−1 v (red line and shading, right y axis); and (e) cloud condensate Qc (in g kg−1 ) from in situ measurements (black line and dots as in panel d) and EDA consisting of liquid and ice water content (grey), and EDA cloud cover (red, right y axis). on 14 October (Fig. 7a). After 09:00 UTC on 14 October, southern France at 16:00 UTC (left grey bar in the middle when the trajectory rises from 800 to 700 hPa, snow falls panel of Fig. 7a). Until that time, the trajectory has lost about from the vertically deep cloud to the height of the trajec- 75 % of its initial water vapour of 12 g kg−1 due to cloud con- tory, which still experiences temperatures above the freezing densation. Because of the clouds associated with the ascend- level. Just after 12:00 UTC, the trajectory crosses the 0 ◦ C ing WCB trajectory, the lidar could only provide reliable wa- isotherm, and melting of snow leads to intense rain beneath ter vapour profiles below the level of the WCB. In this layer the WCB, which at that time crosses the western part of the from the surface to about 700 hPa, characterised by southerly French Cévennes mountains. The trajectory T1 is at 630 hPa flow, the lidar reveals a relatively uniform moist layer with when it passes the location of the lidar near Montpellier in specific humidities of 5–6 g kg−1 (Fig. 8a, between 16:00– https://doi.org/10.5194/acp-21-5477-2021 Atmos. Chem. Phys., 21, 5477–5498, 2021
5488                                                            M. Boettcher et al.: Lagrangian matches in an orographic WCB

Figure 5. Same as Fig. 4 without panel (e) but for the Falcon flight IOP2c.

19:00 UTC). The comparison with EDA shows that the anal-                 tion of T1 at 470 hPa still contains some supercooled liquid
yses are too moist in the lower part of this layer and too dry           water, ice and snow (lower panel in Fig. 7a). In the radar mea-
in the upper part, each by about 1 g kg−1 . In fact, during this         surements, the intersection point of the trajectory is shown
period with the overrunning WCB (shown by black contours                 by the red dot at about 8.4◦ E in Fig. 8b at the upper edge of
for WCB probability and yellow hatching for matches with                 the layer with increased WCB probabilities (the layer above
IOP2b in Fig. 8a), most likely the humidity profile in this              700 hPa is mainly composed of WCB trajectories with in-
layer is strongly influenced by below-cloud evaporation of               flow from the Atlantic; not shown). Near the location of T1,
rain. Underestimation of evaporation of the precipitation in             i.e. where the cloud consists mainly of snow and ice accord-
the model could explain the negative humidity bias in the                ing to EDA, radar reflectivities are between 0–10 dBZ. Ac-
150 hPa thick layer just beneath the WCB.                                cording to the radar, the precipitating cloud extends up to
   In the evening of 14 October, T1 further ascends over the             about 400 hPa. This uppermost part of the precipitating cloud
western Alpine range and, after a short break of the continu-            is likely produced by air that is lifted on top of the WCB and
ous ascent, rises even more steeply above southern Switzer-              does not meet the WCB ascent criterion. Below the position
land, where it is observed by the Mont Lema radar at about               of T1, reflectivities increase markedly in the layer with high
00:00 UTC on 15 October (green dot in Fig. 6a, middle grey               WCB probabilities between 900–600 hPa caused by WCB
bar in Fig. 7a). According to the EDA, the WCB at the posi-              with inflow over the Mediterranean. There is an indication

Atmos. Chem. Phys., 21, 5477–5498, 2021                                                   https://doi.org/10.5194/acp-21-5477-2021
You can also read