Determining the hierarchical order by which the variables of sampling period, dust outbreak occurrence, and sampling location can shape the ...
←
→
Page content transcription
If your browser does not render page correctly, please read the page content below
Biogeosciences, 18, 4351–4367, 2021
https://doi.org/10.5194/bg-18-4351-2021
© Author(s) 2021. This work is distributed under
the Creative Commons Attribution 4.0 License.

Determining the hierarchical order by which the variables of
sampling period, dust outbreak occurrence, and sampling
location can shape the airborne bacterial communities
in the Mediterranean basin
Riccardo Rosselli1 , Maura Fiamma2 , Massimo Deligios2 , Gabriella Pintus3 , Grazia Pellizzaro3 , Annalisa Canu3 ,
Pierpaolo Duce3 , Andrea Squartini4 , Rosella Muresu5 , and Pietro Cappuccinelli2
1 Department    of Biology, University of Padua, Via Ugo Bassi 58/b, 35131 Padua, Italy
2 Department    of Biomedical Sciences, University of Sassari, Viale San Pietro 43/B, 07100 Sassari, Italy
3 Institute of Bioeconomy – National Research Council (IBE-CNR), Traversa La Crucca, 3, 07100 Li Punti (SS), Italy
4 Department of Agronomy, Food, Natural Resources, Animals and Environment (DAFNAE), University of Padua,

Viale dell’Università 16, 35020 Legnaro (Padua), Italy
5 Institute for the Animal Production System in the Mediterranean Environment – National Research Council

(ISPAAM-CNR), Traversa La Crucca, 3, 07100 Li Punti (SS), Italy

Correspondence: Andrea Squartini (squart@unipd.it)

Received: 28 August 2020 – Discussion started: 22 December 2020
Revised: 22 May 2021 – Accepted: 10 June 2021 – Published: 27 July 2021

Abstract. A next-generation sequencing (NGS)-based taxo-          have occurred; (c) changes in wind provenance could tran-
nomic analysis was carried out on airborne bacteria sampled       siently change community composition in the locality placed
at ground level in two periods (May and September) and two        on the coast facing the incoming wind but not in the one lo-
opposite locations on the north–south axis of the island of       cated at the opposite side of the island, and for this reason the
Sardinia. Located in a central position of the Mediterranean      community changes brought from dust outbreaks of African
basin, Sardinia constitutes a suitable outpost for revealing      origin are observed only in the sampling station exposed to
possible immigration of bacterial taxa during transcontinen-      the south; (d) the same winds, once proceeding over land,
tal particle discharge between Africa and Europe. With the        appear to uplift bacteria belonging to a common core already
aim of verifying relative effects of dust outbreaks, sampling     present over the region, which dilute or replace those that
period, and sampling site on the airborne bacterial commu-        were associated with the air coming from the sea or conveyed
nity composition, we compared air collected during dust-          by the dust particulates, explaining the two prior points; and
carrying meteorological events to that coming from wind           (e) the hierarchy of the variables tested in determining bac-
regimes not associated with long-distance particle lifting. Re-   terial assemblages composition results is as follows: sam-
sults indicated that (a) higher microbial diversity and rich-     pling period  ongoing meteorological events > sampling
ness (118 vs. 65 orders) and increased community even-            location within the island.
ness were observed in the campaign carried out in Septem-
ber in comparison to the one in May, irrespective of the
place of collection and of the presence or absence of dust        1   Introduction
outbreaks; (b) during the period of standard wind regimes
without transcontinental outbreaks, a synchronous concerted       With a total volume evaluated of 4.5 × 10¹⁸ m3 , the terres-
turnover of bacterial communities across distant locations of     trial lower atmosphere represents the most extended poten-
the same island, accompanied as mentioned by a parallel rise      tial biome, followed by water, 1.3 × 10¹⁸ m3 (Gleick, 1993),
in bacterial diversity and community evenness, appears to         and by soil with 6.2 × 10¹⁶ m3 (estimated on the basis of

Published by Copernicus Publications on behalf of the European Geosciences Union.
4352                                                                   R. Rosselli et al.: Determining the hierarchical order

the deeper subsurface-living bacteria currently described by
Szewzyk et al., 1993). Concerning atmosphere, microbial
cells and propagules embody a particularly suitable confor-
mation to take advantage of air utilization as an environment
for survival and dispersal. Their movement can be favored
by a natural mobile reservoir of physical solid carriers rep-
resented by the air-dispersed particulate matter. Such parti-
cles range between 0.2 and 100 µm in size (Bernstein et al.,
2004; Ryder et al., 2018) and average loads of 1–100 µg m−3
(Williams et al., 2002; Van Dingenen et al., 2004). It has been
estimated that more than 5000 Tg of sea salt (Tegen et al.,
1997) and 1000–2000 Tg of soil particles, passively uplifting
and transporting live cells, are released every year in the at-
mosphere giving rise to a widely heterogeneous material con-
veyed from different sources (Guang et al., 2004; McTainsh,
1989; Knippertz et al., 2009).                                     Figure 1. Mediterranean area with Sardinia detail and sampling lo-
                                                                   cations Sassari and Cagliari.
   The tropical African and Asiatic belts represent two of the
major airlifted dust sources (Prospero, 2002; Schepansky et
al., 2007). Several studies underline that the phenomenon of
dust airlift strongly contributes to a cosmopolitan microbial
distribution (Favet et al., 2013; Griffin, 2008; Yang et al.,      in which biological components and weather conditions are
2008; Wainwright et al., 2003; Smith et al., 2010).                closely related (Lelived et al., 2002).
   Moreover, the correlation between specific bacterial clades        Extending for more than 30◦ of latitude above the subtrop-
and particle size (Polymenakou et al., 2008) has given rise        ical belt, Europe is crossed by middle-latitude and equato-
to new hypotheses on differential dispersal of taxa in rela-       rial atmospheric systems. Mathematical models suggest that
tion to the dust features. A high number of bacterial “new-        a considerable part of the air mass movements has a Northern
comers” have been pointed out in air samples collected             Atlantic source in response to the pressure generated by the
on occasions of foreign dust outbreaks (Maki et al., 2014;         Azores high (Littmann, 2000). Southern winds from Africa,
Rosselli et al., 2015). Immigrant microorganisms’ classifi-        prone to carrying desert sand and potentially microbes, can
cation (Sànchez de la Campa et al., 2013) and their effects        be determined by specific climate conditions (Kostopoulou
on an autochthonous ecosystem have also been reported (Pe-         and Jones, 2007; Benkhalifa et al., 2019). It has been esti-
ter et al., 2014; Shine et al., 2000). Evidence of a correla-      mated that, as a consequence, 80–120 Tg dust yr−1 is trans-
tion between aerosol-related biodiversity and seasons (Gan-        ported across the Mediterranean towards Europe (d’Almeida,
dolfi et al., 2015) underlines the natural complexity related      1986; Dulac et al., 1996), reaching the higher troposphere
to this process, suggesting that effects may also vary depend-     layers (Alpert et al., 2004) and spilling over up to the far
ing on climatic periodicity. The impact of desert dust in tran-    northern sides of the continent (Franzén et al., 1991).
siently changing the airborne microbiota in cities has been           In order to track the biodiversity of these airways, the Ital-
described (Mazar et al., 2016). In other works, the origin of      ian island of Sardinia was chosen as an ideal observatory
dust has been compared and storms from different origins           point to collect airborne bacteria moving inside and outside
have been shown to exhibit distinct bacterial communities,         Europe. Located in the middle of the Mediterranean Sea, this
with signature bacterial taxa (Gat et al., 2017). Marked sea-      landmass is separated from Italy, France, Spain, and Africa
sonal patterns in airborne microbiota have also been reported      coastal baselines by distances of 120, 150, 230, and 100
in long-term studies (Cáliz et al., 2018). Fungal taxa have        nautical miles (NM; 1 NM is equal to 1852 m), respectively
also been analyzed along with their relationships with the         (Fig. 1). Its geographical position facilitates the displacement
chemical composition of the particulates (Lang-Yona et al.,        of western high- and low-pressure air masses coming from
2020). The genes whose presence has been suggested to en-          Gibraltar and becoming the first and the last frontier for mi-
able bacterial survival in the atmosphere, referred to as eolian   crobes entering or leaving Europe, respectively. In a prior
lifestyle, have been studied by metagenomic approaches, and        study (Rosselli et al., 2015), we described a core microbiome
their effects include UV-induced DNA damage repair, cell           in the bacteria cast upon the island of Sardinia under different
aerosolization, aerotaxis, and thermal resistance (Aalismail       wind regimes through analyses of DNA from deposited parti-
et al., 2019).                                                     cles. The analysis compared the trans-Mediterranean airflow
   European Mediterranean air circulation routes offer an          with that of winds from Europe and pinpointed a number of
interesting case study when focusing on airborne bacteria.         taxa which have records in clinical infections. In that inves-
The system can be represented as a multidirectional network        tigation the sampling dates were all concentrated in a single
                                                                   period of 6 d (in February) and some variations in the air-

Biogeosciences, 18, 4351–4367, 2021                                                   https://doi.org/10.5194/bg-18-4351-2021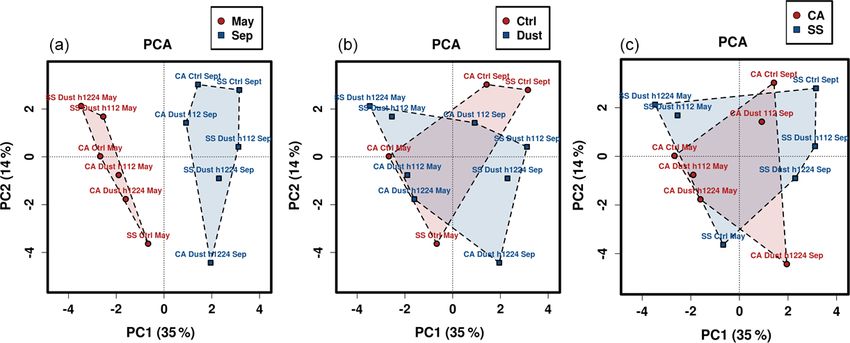
R. Rosselli et al.: Determining the hierarchical order                                                                       4353

borne biota were observed in response to the opposite wind       month time lapse, from March to September 2014, in order to
directions.                                                      obtain a nearly annual view to focus within the main weather
   However, the most remarkable evidence was a prevailing        instability period.
constancy of the microbial composition in spite of the chang-
ing wind provenances. In the present study instead we ana-       2.2   Sampling
lyzed a series of events featuring a starting dust outbreak, a
109 d long period devoid of dust-carrying winds, and a sec-      The experimental design involved two sampling sites at
ond dust outbreak. The analyses were performed in two op-        the opposite corners of the island of Sardinia (Sassari vs.
positely located stations: Cagliari, on the southeast side of    Cagliari), two sampling periods (May vs. September), and
Sardinia, facing the African side, and Sassari in the north-     two meteorological conditions (absence vs. presence of a
west, i.e., farthest from the dust-carrying winds. The sam-      dust outbreak). In each of these situations, two replicate
pled particulates were analyzed by next-generation sequenc-      samples were taken and processed independently through-
ing (NGS) of the amplified 16S rRNA genes. The main goal         out the DNA extraction step to be pooled before sequenc-
of the project was to verify in which hierarchical order the     ing. Samples were collected on Teflon filters (Sartorius Ste-
different variables of (a) sampling period, (b) occurrence of    dim Biotech) by using Skypost Tecora apparatus (compli-
dust-carrying outbreaks, and (c) sampling location could act     ant with the European legislation 96/62/gmeCE) processing
in determining airborne bacterial community composition.         39 L air min−1 . To constitute “a sample” a continuous 24 h
                                                                 long air intake through the filters was performed.
                                                                    In the case of the dust outbreaks the 24 h sampling was fur-
2     Materials and methods                                      ther divided into two periods, by considering independently
                                                                 the first 12 h and the second 12 h. The number of resulting
2.1    Meteorological monitoring                                 samples was therefore 12, namely the module of three condi-
                                                                 tions – (a) control, (b) dust hours 1–12, (c) dust hours 12–24
Surveillance of the weather trends and conditions for an-        – multiplied by two sampling periods and by the two sam-
ticipating dust outbreaks from Africa towards Sardinia and       pling places, resulting in 12 samples (3 × 2 × 2).
winds of interest was performed by routine checking of              As a technical note, the scope and meaning of controls
MODIS satellite data (https://modis.gsfc.nasa.gov/data/, last    here was that of samples that could allow us to individuate
access: 20 September 2014) and Meteosat imagery combined         the shift between one condition and its adjacent one. In our
with the SKIRON (https://forecast.uoa.gr/en/forecast-maps/       cases, that meant catching the sudden change in wind regime
skiron, last access: 20 September 2014) forecasting model        by sampling immediately before or after a dust outbreak.
(Nickovic et al., 2001). European daily synoptic condi-          Therefore, the controls were thus defined as single 24 h time
tions were analyzed on the weather charts available from         points preceding or following the key dust events.
http://www.eurometeo.com, last access: 20 September 2014            For each sample, dates and atmospheric conditions are re-
and https://www.metoffice.gov.uk, last access: 20 Septem-        ported and fully described in the Results section and Supple-
ber 2014. The origin and the trajectory of the dust carried      ment.
by winds towards Italy were inferred by the NOAA HYS-
PLIT model (Hybrid Single-Particle Lagrangian Integrated         2.3   DNA extraction and sequencing
Trajectory model) (Draxler and Rolph, 2014; Rolph, 2014).
   Monitoring was aimed at predicting two distinct condi-        DNA was extracted using the E.Z.N.A.® Soil DNA Kit
tions: (i) north African high-pressure nuclei favoring south-    (Omega Bio-tek Inc.) as described by the manufacturer. The
ern winds suitable for carrying and depositing dust over Sar-    quality and quantity of the extracted nucleic acid were mea-
dinia (dust-enriched events) and (ii) north European high-       sured using a NanoDrop 2000 spectrophotometer (Thermo
pressure nuclei, determining northern winds referred to as       Fisher Scientific Inc.).
“controls” (dust-negative events).                                  Amplification of the 16S rRNA genes for sequenc-
   In addition, PM10 concentration (particulate matter with      ing was performed using the universal primers 27F and
a diameter of less than 10 µm) and meteorological data reg-      1492R (AGAGTTTGATYMTGGCTCAG and TACGGY-
istered by the ARPAS (Regional Environmental Protection          TACCTTGTTACGACTT, respectively). PCR was carried
Agency of Sardinia) monitoring stations were taken into con-     out using Platinum® Taq DNA Polymerase High Fidelity
sideration in relation to the arrival of African air masses.     (Life Technologies) in a PTC-200 Thermal Cycler (MJ Re-
   Information about wind direction and intensity (every         search Inc.) set as follows: 95 ◦ C for 5 min (95 ◦ C for 0.5 min,
10 min) and temperature and humidity (once per hour)             51 ◦ C for 0.5 min, 72 ◦ C for 2 min for 30 cycles), 72 ◦ C
was downloaded via the ISPRA website (http://www.                for 10 min, and 4 ◦ C on hold. The amplification of the
mareografico.it/, last access: 20 September 2014) and two        no template control (NTC) was negative. Next-generation
sampling stations located in Cagliari (39.21◦ N, 9.11◦ E) and    sequencing was carried out at the facilities of the Porto
Sassari–Porto Torres (40.84◦ N, 8.40◦ E). Data covered a 7-      Conte Ricerche Srl (Alghero, Italy). Briefly, amplicons were

https://doi.org/10.5194/bg-18-4351-2021                                                  Biogeosciences, 18, 4351–4367, 2021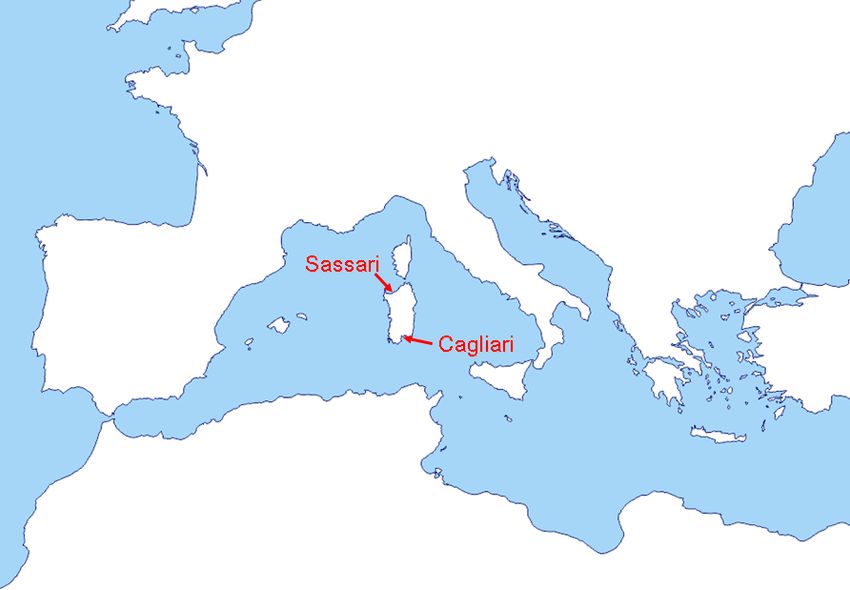
4354 R. Rosselli et al.: Determining the hierarchical order
quality-checked on an agarose gel and purified using the as opposed to calm air or slow flows from the opposite quad-
Agencourt® AMPure® XP PCR purification kit. Using the rant. This allowed us to integrate boundary conditions and
Nextera XT DNA Sample Preparation Kit (Illumina Inc.), environmental variables to assess possible correlations be-
1 ng of DNA was processed, and it was sequenced using HiS- tween these and microbial community fluctuations (Fiamma,
canSQ (Illumina Inc.) with 93 bp × 2 paired-end reads. Se- 2016).
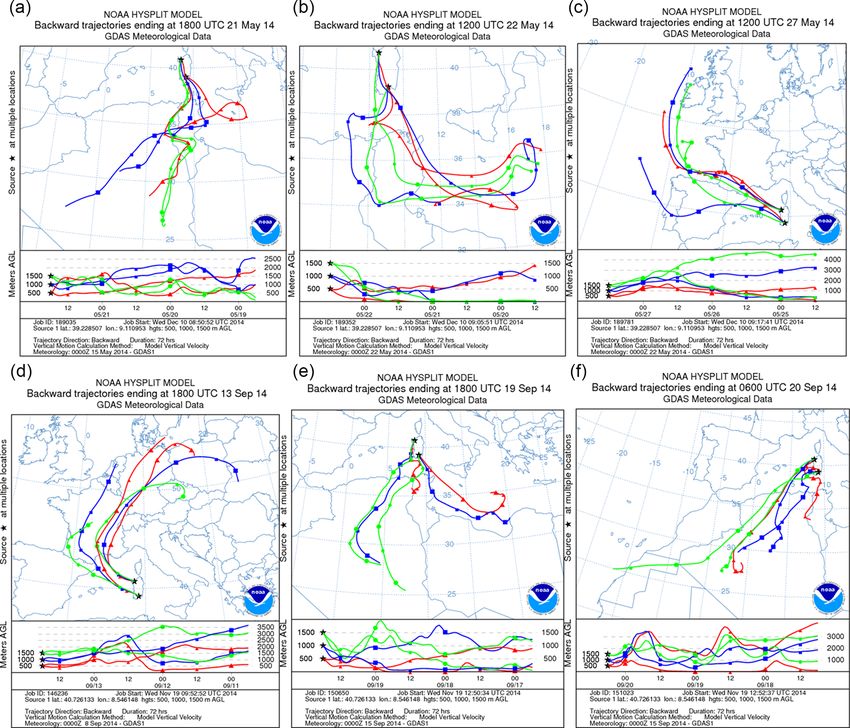
quences were submitted to the European Nucleotide Archive Dust-carrying air masses moved over the Mediterranean
(ENA) inside the Dust Metagenome BioProject with the ac- on 21 through 22 May 2014 towards the northeast, covering
cession number ERX836645-56. the entire island of Sardinia. PM10 concentrations throughout
the second half of May at both the north and the south collec-
2.4 Data analysis tion sites displayed increases in correspondence of the dust
event (Fig. S1 in the Supplement). Incoming dust of African
Reads were cleaned on the basis of quality, and fragments of origin was equally evidenced by charts reporting wind fronts
Nextera adapters were removed by Trimmomatic (Bolger et and pressure (Fig. S2 in the Supplement) and images from
al., 2014) set at the value of 3 for leading and trailing trim- satellite (Fig. S3 in the Supplement). The itinerary of par-
ming and with bases lower than 20 on a four-base wide slid- ticles was reconstructed by plotting 3 d backward trajecto-
ing window. Quality was confirmed by FastQC (http://www. ries of the air mass using a NOAA HYSPLIT model (Fig. 2)
bioinformatics.babraham.ac.uk/projects/fastqc/, last access: which tracked the north African zone as the source of the
3 July 2016), and reads were analyzed with QIIME 1.9.0 (Ca- convective motion responsible for the dust discharge on Italy
poraso et al., 2010). The operational taxonomic unit (OTU) observed on 21 and 22 May.
table was created using the pick_otus script with the closed- The date of 27 May was selected as a “clear day” featuring
reference OTU picking strategy with the Greengenes refer- weather no longer conducive to air convection from Africa
ence OTU database clustered at 97 % (ver. gg_13_8). The to Sardinia. Such conditions consisted in overall European
same script checked chimeric sequences using the Broad low pressures as opposed to high pressures over Mauritania,
Institute Microbiome Utilities 16S Gold reference database Mali, Libya, and Algeria (Figs. S2 and S3). Particle back-
(version microbiomeutil-r20110519). The OTU table was fil- tracking supported the evidence of a slow flow of air masses
tered based on the total observation count of an OTU of at only from northwestern corners on 27 May (Fig. 2c).
least 3 and low-abundance filtering of 0.005 %. Finally, the An outbreak of dust on Sardinia was recorded again in
OTU table was rarefied (subsampled) at 1 109 571 counts 2014 during the second fortnight of September. Low pres-
(equal to the sample with a lowest depth) for all the sam- sure from the northwestern coast of Spain to Morocco was
ples. Perl and the R package vegan were subsequently used opposed to a parallel high-pressure system that extended
for cladograms and distance-based clustering analyses; gg- over north Africa (Libya, Algeria, and Tunisia) through
plot, plotrix, and windRose provided graphic support. Sicily. This circumstance caused the flow of dust-carrying
Molecular data regarding bacterial species compositional air masses over the Mediterranean basin, reaching in par-
differences across different treatments were analyzed by ticular southern Italy and Sardinia. Air movement from the
multivariate analyses (principal coordinate analysis, PCoA; African continent made air temperature rise to values above
principal component analysis, PCA; discriminant analysis of the usual September means, with a peak on 20 September
principal components, DAPC) and ecological index calcula- in Sassari (northern sampling site) and on 21 September in
tion, using the Calypso online software tool (Zakrzewski et Cagliari (southern sampling site) (Fig. S4a and b). In rela-
al., 2017). Prior to the analyses, the relative abundances of tion to this condition, from 19 through 21 September a dust
OTUs were equalized by applying the total sum of squares outbreak from the Sahara flew over the Mediterranean and
scaling (TSS) normalization followed by square root trans- entirely covered Sardinia. The relative wind fronts and pres-
formation. The resulting ordination results were also com- sure values are shown in Fig. S5 in the Supplement. Pat-
pared with those yielded by the alternative centered log ratio terns of PM10 from daily records taken at both Sardinian
(CLR) data transformation. sampling stations also displayed a rise during the dust out-
break (Fig. S4c). Satellite imagery confirmed again the oc-
3 Results currence of incoming dust-loaded air masses from northern
Africa (Fig. S6 in the Supplement) consistent with their 3 d
3.1 Meteorological events back trajectories (Fig. 2d–f). Those confirmed that on 19 and
20 September airflows were of north African origin. In con-
To capture the air microbiota of Sardinia and to put in ev- trast, about a week earlier, 13 September had featured low
idence taxa that could be associated with specific events, pressures over Italy while high pressures were recorded over
weather forecasts and other data on air circulation were reg- the southern part of Morocco, Algeria, and Mauritania. This
ularly browsed to select suitable dates for the sampling. Such picture was not permissive for any transport of air loads from
events were intended to be winds in the northbound direction Africa to Sardinia, and the day was therefore considered the
prone to carrying dust from shores across the Mediterranean clear-day reference of the period. Air representative of the
Biogeosciences, 18, 4351–4367, 2021 https://doi.org/10.5194/bg-18-4351-2021R. Rosselli et al.: Determining the hierarchical order 4355
Figure 2. (a–c) The 3 d air mass backward trajectories calculated by the NOAA HYSPLIT model ending at 18:00 UTC 21 May, 12:00 UTC
22 May, and 12:00 UTC 27 May 2014 at both sampling sites. (d–f) The 3 d air mass backward trajectories calculated as above, ending at
18:00 UTC 13 September, 18:00 UTC 19 September, and 06:00 UTC 20 September 2014 at both sampling sites (credit to https://www.ready.
arl.noaa.gov/HYSPLIT.php).
dust outbreak condition was thence sampled from 19 through ima were seen in the May samples where they reached per-
20 September, while the corresponding control air was col- centages above 90 %, while their minima appeared in the
lected on 13 September. Sassari controls in September with values around 50 %.
The Actinomycetales order was found in all samples;
3.2 Bacterial community composition in particular it was featured in the south-facing station
(Cagliari), and its numbers tended to double in relation to the
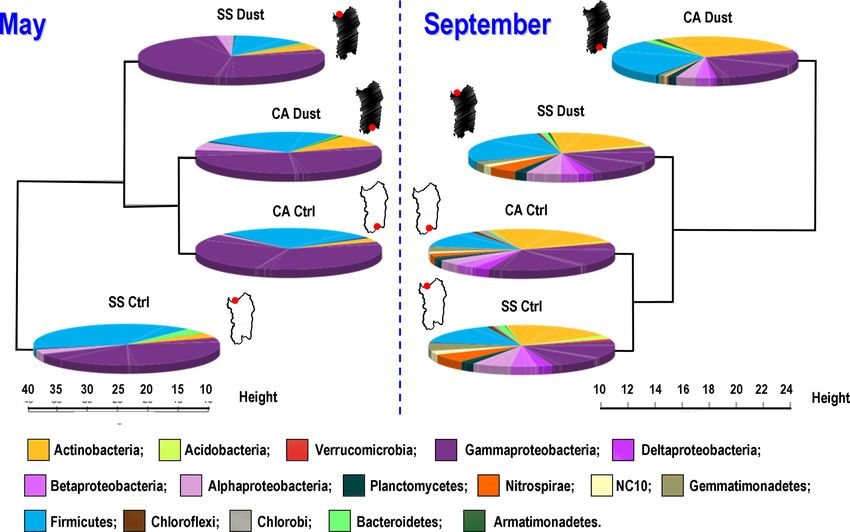
A synoptic view of the results at the phylum/class level is dust events. The overall levels of relative abundance as well
shown in Fig. 3. Details on orders are shown in Table 1. Com- as richness within members of the Actinobacteria phylum in-
plete data are available in Datasheet S1 in the Supplement. creased from 5.66 %, observed in May, to 13 % in September.
In terms of conserved taxa the core of those observed more Particularly enriched were the Gaiellales and Solirubrobac-
regularly included classes such as Gammaproteobacteria and terales orders within the Thermoleophilia class. The orders
Bacilli (Firmicutes phylum) and orders such as Actinomyc- within the Firmicutes phylum, which dominated the May
etales (Actinobacteria phylum); for each of these their max-
https://doi.org/10.5194/bg-18-4351-2021 Biogeosciences, 18, 4351–4367, 20214356 R. Rosselli et al.: Determining the hierarchical order
Figure 3. Pie charts of percent relative abundance and cluster analysis dendrograms (Euclidean distance method, complete linkage) con-
structed on the identified bacteria grouped at the phylum/class rank level, as stemming from the OTU annotation of the DNA sequencing
from the filtered atmosphere sampling. SS: Sassari station, northern Sardinia; CA: Cagliari station, southern Sardinia; Dust: collection dur-
ing dust outbreaks brought by winds from Africa; Ctrl: control, collection upon opposite wind front change, following (May) or preceding
(September) the dust outbreak. The data available from the two 12 h sub-periods (hours 0–12 and hours 12–24) collected during the dust
events were merged together in the corresponding pie charts to be compared at an equal sampling duration with the 24 h control samples.
The Sardinia contour map in white (control) or black (dust) and the red dot, pointing at the sampling site, are shown. The squares providing
a color legend to the taxa names follow a corresponding clockwise order of their possible presence on each pie chart.
Table 1. Percent frequency of sequences belonging to the indicated orders in the averaged data of all samplings (dust and control) of each
sampling period (May or September). Data in which frequencies were higher than 1 % in at least one of the two seasons are reported. These
represent 91.1 % of the total sequences for the May sampling (on a total of 65 orders found) and 79.4 % of the September sampling (on a
total of 118 orders found). Means ± standard deviation are shown.
Phylum Class Order Mean percentage May Mean percentage September
Proteobacteria Gammaproteobacteria Enterobacteriales 27.40 ± 10.7 11.55 ± 4.5
Proteobacteria Gammaproteobacteria Pseudomonadales 26.67 ± 2.8 9.90 ± 7.7
Firmicutes Bacilli Lactobacillales 18.67 ± 9.8 15.96 ± 5.1
Actinobacteria Actinobacteria Actinomycetales 5.66 ± 3.0 13.36 ± 7.7
Firmicutes Bacilli Bacillales 4.46 ± 2.0 6.56 ± 5.2
Proteobacteria Gammaproteobacteria Alteromonadales 2.77 ± 0.8 0.76 ± 0.3
Proteobacteria Gammaproteobacteria Xanthomonadales 1.51 ± 0.4 2.63 ± 1.5
Proteobacteria Gammaproteobacteria Aeromonadales 1.51 ± 0.5 0.96 ± 0.7
Proteobacteria Alphaproteobacteria Rhizobiales 1.35 ± 1.5 1.59 ± 0.9
Bacteroidetes Sphingobacteria Sphingobacteriales 1.00 ± 1.5 1.04 ± 0.8
Proteobacteria Alphaproteobacteria Rhodospirillales 0.06 ± 0.1 2.02 ± 1.1
Actinobacteria Acidimicrobiia Acidimicrobiales 0.05 ± 0.1 2.01 ± 0.8
Nitrospirae Nitrospira Nitrospirales 0.01 ± 0,01 3.38 ± 2.8
Actinobacteria Thermoleophilia Gaiellales 0.00 ± 0.00 2.81 ± 2.1
Actinobacteria Thermoleophilia Solirubrobacterales 0.00 ± 0.00 2.37 ± 1.7
Gemmatimonadetes Gemm-1 Gemm-1 0.00 ± 0.00 2.52 ± 1.9
Biogeosciences, 18, 4351–4367, 2021 https://doi.org/10.5194/bg-18-4351-2021R. Rosselli et al.: Determining the hierarchical order 4357 samples, were Lactobacillales and Bacillales. Their relative second lapse (hours 12 to 24). Thus the availability of two abundances were higher in the Sassari (northern Sardinia) timeframes, both within the dust event, allowed us to verify control samples than in those collected at the southern point which OTUs would be incrementally enriched along with the of Cagliari, with values of 37 % vs. 12 %, respectively. At progression of the stormy condition. the same time an unchanging level of 25 % was recorded in This allowed us to better refine the bacterial deposition dy- both control and dust samples in the south-facing location. In namics during the outbreaks. From the visual and physical the September samples the situation was different as in both points of view, an increase in the inflow of air particulates controls those orders were below 15 %, while during the dust was observed for the 12–24 h period, confirming the differ- outbreak it was 25 % in both Cagliari and Sassari stations. ential level of deposition occurring in the maturity stage of The May sampling was also characterized by a large the meteorological phenomenon. share of Gammaproteobacteria, a class reaching 75 % of This within-outbreak setup was essentially aiming at indi- the dust-related spring samples in Sassari. In particular, viduating OTUs that would display high variation in relation Pseudomonadales and Enterobacteriales were constantly ob- to dust events in comparison to those that would not. The lat- served. Some taxa appearing as spring-signature cases were ter were considered to represent the common core of bacte- detected in the Alteromonadales with Marinimicrobium, ria that were constantly present in samples, irrespective of the Marinobacter, and taxon OM-60. For the fall period instead, changing meteorological events. To apply this distinction, the Xanthomonadales recurred with some genera in the Sinobac- criterion was to set a cutoff value with respect to the percent teraceae family, amounting to 1.2 % and 2 % in the dust-free of variation occurring between the first 12 h of the collection controls of Cagliari and Sassari, respectively. Within the Al- time and the second half of it. The choice of this threshold phaproteobacteria class, Caulobacterales, with genera related was considered critical, and, in order to ensure robust con- to Brevundimonas, were at a 1 % relative abundance level clusions, we deemed it necessary to require a considerable in the Cagliari samples collected during the dust episode consistency of variation. Pointing at this objective, only the of May. The Rhizobiales order was present in both seasons taxa which displayed a mean variation higher than one-half with a 3 % peak in spring (Cagliari, dust-related), dropping of the corresponding standard deviation were taken into ac- to 1.5 % in all fall analyses. In the same period Rhodospiril- count. The resulting level of variation in the two sampling lales showed a relative increase, particularly in the controls in stations is reported in Table 2, and the corresponding number Sassari where they reached 3.4 %. The Burkholderiales (class of orders is displayed in Table 3. The Sassari (north-facing) Betaproteobacteria) of the population were found at 1 % in collection site was the one that in both seasons resulted in May within the dust-related sequences and at higher values, featuring the highest number of significantly changing taxa. reaching 2.7 % in Cagliari and 4 % in Sassari, in the controls The identities of these are shown in Fig. S7 (May event) and of September. Some groups appeared rather period-specific Fig. S8 in the Supplement (September event). In the graphs, such as the Mollicutes for May, while the Pirellulales order the first 12 h lapse is plotted above the baseline, and the sec- (in the Planctomycetes phylum) and the classes of Nitrospira ond (12–24 h) is in the specular position below. and Gemmatimonadetes characterized the September sam- As regards the ecological indexes characterizing the com- pling. munities, species diversity and evenness values were calcu- The numerical effect of the different sampling period on lated, and results are shown in Table 4. The difference that bacterial communities is visible in Table 1, comparing in can be appreciated is mainly relative to the series of Septem- this case the mean relative abundances of the main orders ber samples, in which all had higher values for each of the in the 2 sampling months, grouped independently from site indexes when compared to the May ones. Conversely, nei- and meteorology events. Among the most evident phenom- ther the presence of dust events nor the sampling location ena confirmed by this single-variable grouping, the Septem- appeared to confer relevant differences in this respect. ber campaign shows the enrichment in the Actinomycetales The patterns of conservation and diversity involving the order and in a number of others that were below detection bacterial communities analyzed were subsequently inspected in the May sampling. In parallel, the diminution of the for- by multivariate approaches. Principal component analysis merly dominant Enterobacteriales and Pseudomonadales and yielded an output (Fig. 4) that confirms how a separation of the substantial stability of the Bacilli across the compared communities can be viewed only when considering the tem- times were observed. poral factor (Fig. 4a), while the variables of dust vs. calm air Besides the comparisons that included all OTUs to put in or the sampling location led to plots with heavily overlapping evidence community variations,we exploited in parallel an patterns. The May vs. September divide occurs along the hor- additional opportunity to detect possible dust-specific taxa. izontal axis, i.e., the one explaining the highest fraction of The rationale was to seek differential enrichment within the variation (35 %). The same phenomenon is reproduced with dust storm, by dissecting the process, during its progression, higher support (54 %) in a parallel ordination approach, the splitting its onset from its fully established stage. To this aim, principal coordinate analysis (Fig. S9a in the Supplement). we collected separately the filters of the first 12 h of the event In the same figure the main differences occurring in com- and replaced them with new ones that collected air during the munity structure between the two sampling periods are fur- https://doi.org/10.5194/bg-18-4351-2021 Biogeosciences, 18, 4351–4367, 2021
4358                                                                          R. Rosselli et al.: Determining the hierarchical order

Table 2. Extent of OTU change across cell harvesting time during the same dust outbreak sampling. The percent variation (either increase or
decrease) of a given OTU’s abundance between the values found in the community obtained by the first 12 h sampling and the ones resulting
from the following 12 h lapse was computed. The average, minimum, and maximum percent variations between counts are shown. Only taxa
displaying a difference in percentages higher than half of their standard deviation were selected for the present comparison.

                           Sample                       Avg. variation %     Min variation %     Max variation %
                           Sassari May – dust                          1.4                0.05                  6.7
                           Sassari September – dust                    1.3                 0.4                  5.4
                           Cagliari May – dust                         2.1                 0.5                  5.0
                           Cagliari September – dust                   4.7                 1.1                 11.4

Table 3. Community richness at order level of taxa occurring during dust events and of those displaying variations higher than half the
standard deviation between the first 12 h and the second 12 h sampling period (selected orders). The orders selected upon this criterion as a
percentage of the total of the orders observed in samples collected during the dust events is indicated.

                                 Site and period        Total orders    Selected orders    % of total orders
                                 Sassari May                     56                 16                28 %
                                 Sassari September              103                 28                28 %
                                 Cagliari May                    52                 11                21 %
                                 Cagliari September              87                 14                16 %

ther explored by reporting the ecological indexes of Shan-               Wilcoxon rank test verification of the ranking. The two tools
non species diversity (Fig. S9b) and community evenness                  gave coherent scores, and the results of the ANOVA out-
(Fig. S9c) resulting from grouping the data and separating               put are shown in Table S1 in the Supplement. A total of
them only in relation to the sampling period variable, irre-             76 taxa were found featuring p values < 0.05, of which,
spective of meteorology events and collection sites. The su-             upon applying a stringent Bonferroni-adjusted p-value cor-
periority of the September values in both indexes, particu-              rection, 6 stood above the significance cutoff and all were
larly for the taxa diversity, is supported by the significance of        within minimal false discovery rate values (FDR < 0.005).
the p values of discrimination between samples thereby re-               All of them were cases which were highly reduced in
ported (p = 0.00584 for species diversity, and p = 0.026 for             September in comparison to May. The taxon included as
community evenness).                                                     the most effective in explaining the differences (p value =
   The higher strength of clustering of the sampling date                0.000019) is the order Oceanospirillales, known as marine
groups with respect to the alternative ones (meteorological or           oil-spill-associated bacteria (Cao et al., 2013), followed by
geographical) was verified by running a discriminant analy-              known animal parasites such as the Coxiellaceae family
sis on the principal component ordination (DAPC) in which                (Lory, 2014); marine extremophiles such as Thiohalorhab-
the data are first transformed by PCA, from which clus-                  dales (Tian et al., 2017); and three species of Pseudomonas,
ters are subsequently identified using discriminant analysis,            including the pathogenic P. viridiflava (Hu et al., 1998), the
thus partitioning sample variance into the between-group and             decontamination-associated P. nitritireducens (Wang et al.,
within-group components. Results are shown in Fig. 5. Be-                2012), and P. alcaligenes which is also reported to be a hu-
sides confirming the sampling period as the strongest driver             man pathogen (Suzuki et al., 2013). The two corresponding
of community change, the analysis further shows that the                 analyses of differentially represented taxa by meteorology or
dust vs. control clustering is acting more efficiently than the          by geography, i.e., grouping dust vs. calm air or Cagliari
Sassari vs. Cagliari sampling site comparison. This allows               vs. Sassari sites, did not yield any significantly supported
us to draw a hierarchical ranking of the three variables in              cases under the Bonferroni-adjusted p-value stringent con-
shaping the bacterial airborne communities, in which, noting             dition (data not shown).
also the different scale of the horizontal axis (discriminant               In order to compare all communities with each other and
function 1) adopted for the three graphs, the following order            extract further information on their degrees of divergence, the
results: time  meteorology > geography.                                 sequencing data were analyzed by individual comparisons
   In order to determine which bacterial taxa were mostly ac-            across sites and dates. The results of each of the 66 pair-
companying/causing those changes in a statistically signifi-             wise combinations are shown in Fig. 6, displaying the Bray–
cant manner and to rank their individual importance in this              Curtis similarity values between each couple of communi-
phenomenon, we run an analysis of the differentially fea-                ties. Color-based conditional formatting applied to the val-
tured taxa, testing both an ANOVA and a non-parametric                   ues allows us to appreciate how all the comparisons involving

Biogeosciences, 18, 4351–4367, 2021                                                          https://doi.org/10.5194/bg-18-4351-2021
R. Rosselli et al.: Determining the hierarchical order 4359
Table 4. Ecological diversity and evenness indexes resulting from the sequence checklist analysis in the different samplings.
Month Event Place Simpson 1-D Shannon H Evenness
May Dust SS h 1–12 0.771 2.062 0.151
May Dust SS h 12–24 0.740 1.902 0.156
May Dust CA h 1–12 0.833 2.175 0.183
May Dust CA h 12–24 0.833 2.205 0.197
May Ctrl SS 0.794 2.064 0.164
May Ctrl CA 0.778 1.900 0.142
Sep Dust SS h 1–12 0.928 3.187 0.260
Sep Dust SS h 12–24 0.914 3.015 0.240
Sep Dust CA h 1–12 0.887 2.792 0.212
Sep Dust CA h 12-24 0.838 2.339 0.176
Sep Ctrl SS 0.948 3.438 0.311
Sep Ctrl CA 0.936 3.292 0.286
May: mean ± SD 0.79 ± 0.04 2.05 ± 0.13 0.17 ± 0.02
September: mean ± SD 0.91 ± 0.04 3.01 ± 0.40 0.25 ± 0.05
Figure 4. Principal component analysis (PCA) ordination plot of the bacterial community compositional data. Polygons encompassing the
positions of three different variables are drawn to visualize sampling month (a), ongoing meteorological event (b), or sampling location (c).
different seasons show the most divergent scores (red shades) which takes into account the variations that occur during all
in comparison to those within the same season, which show those hours, inclusive of the day–night shifts. One sample
much more similarity, with a few exceptions related to dust is therefore not a “point” but a built-in averaged replication
events and depending on the aspect faced by the collecting protocol for the chosen window of events.
site with respect to the incoming wind direction. Second, as regards the definition of control in our study,
it is not meant to represent a supposedly stable community
that could apply to a hypothetical average dust-free local sce-
4 Discussion nario. As several studies cited in the introduction showed,
even in the absence of dust outbreaks, the ambient state of
Two technical aspects to be defined beforehand are the def-
the atmosphere is not stable either. Our goal therefore was
initions of “sample” and “control” that apply to this type of
not to compare a hypothetical status quo with an altered one.
study. An atmospheric sampling is not to be regarded with
Since the airborne community composition changes daily
the same conceptual metrics that would apply if one were to
even during periods that do not feature the dust-carrying
study water or soil environments, in whose cases, a sample
episodes, there is not a stable condition that could be con-
could correspond to 1 L or 1 g, respectively, taken from those
sidered a durable control community. Even the evening and
milieus. In air filtering the operation is carried out continu-
morning opposite breeze regimes that occur daily in coastal
ously for days, and one sample, in our tests, accumulated the
locations impart modifications in local airborne communi-
content of 56 160 L of continuously changing atmosphere,
https://doi.org/10.5194/bg-18-4351-2021 Biogeosciences, 18, 4351–4367, 20214360 R. Rosselli et al.: Determining the hierarchical order Figure 5. Discriminant analysis of principal components analysis. Group partitioning involved (a) sampling month, (b) ongoing meteoro- logical event, and (c) sampling location. ties. The meaning of the control here was instead meant to the constrained 100 % format of results (probability-ruled). catch (1) the first possible timeframe after the stopping of This caveat was put forward as early as statistics itself was a northbound dusty wind outbreak (it occurred in May) or born as a discipline (Pearson, 1897). There is in this respect a (2) the latest possible timeframe of a situation before the on- general problem in comparing communities at different time set of a dust-carrying change in wind regime (it occurred in points (and even more with DNA-based methods with fixed September). Hence, in the latter event the control is not in- total DNA amount processed) whose results are based on per- tended as a situation of calm that could represent a period of cent values (relative abundance of taxa). In that condition the unknown length but rather as the time-zero sample of the dust multiplication of any taxon obviously determines a reduc- event itself. In contrast for the former case in May, the con- tion in the relative abundance of others, when those do not trol was symmetrically defined as the earliest stage of quiet grow at an equal or higher rate. Therefore, one given group after the storm. could have been increasing, but its share in the sum could In the present study the filtered air particulates were appear as if it had instead decreased if a different group has analyzed in different seasons and under different wind increased faster. This consideration applies inevitably for all regimes, using culture-independent DNA-sequencing-based metagenomic/metabarcoding surveys and should be kept in approaches targeting the species-diagnostic 16S rRNA genes mind for all kinds of interpretation about increases and de- from the air-carried bacterial community and an Illumina creases, which could be either real or apparent (when driven next-generation sequencing platform. Sites were also se- by a stronger change in a different group). As a consequence, lected because of their opposite positions facing Africa comparing different sampling points through time is linked (Cagliari) or continental Europe (Sassari). The whole anal- to this inevitable constraint: the compositional nature of the ysis was performed within a 7-month time lapse, March to datasets binds all relative frequencies to each other (Gloor et September, also chosen as it offers higher probabilities of al., 2017). Therefore, since, as mentioned, the sum of them is weather shifts favoring both northern and southern winds (Is- bound to always give 100 %, the decrease in a given species raelevich et al., 2012). This timeframe proved suitable to the could be either apparent (driven by the increase in another) scope as it was possible to exploit two episodes in which dust or real (due to its actual negative population dynamics). The outbreaks carried by winds of African origin occurred and problem is that the two causes can not be uncoupled by just were preceded and followed by inversions of the air circu- comparing species frequencies at the two sampling periods. lation, offering control sampling periods with opposite fea- Moreover, as mentioned, even an actual increase in a given tures. species could be masked by the parallel increase in another Commenting on the taxonomical abundance shifts ob- at a faster pace (or by its net immigration into the scene). For served between May and September and trying to interpret this reason, we consider with caution the possibility of look- the rise of some phyla and the drop of others (Fig. 3; Table 1), ing at taxa fluctuations as indicative of their actual ecological a preliminary consideration needs to be recalled. The issue outcomes. In order to explore the extent of this possible bias, has to do with the distinction between actual population dy- we compared the results of the ordination plots yielded by namics (ecologically ruled) and mathematical effects of sam- two data transformation procedures; in addition to the TSS pling from a “ballot box” of objects, all of which compete for square root transformation, we also checked Aitchison’s cen- Biogeosciences, 18, 4351–4367, 2021 https://doi.org/10.5194/bg-18-4351-2021
R. Rosselli et al.: Determining the hierarchical order                                                                                 4361

Figure 6. Bray–Curtis similarity values between the bacterial community composition resulting from pairwise comparisons of all samples.
SS: Sassari; CA: Cagliari; D1–12: dust event, first 12 h period; D12–24: dust event, second 12 h period; Ctrl: control conditions (absence of
dust events); Sep: September.

https://doi.org/10.5194/bg-18-4351-2021                                                           Biogeosciences, 18, 4351–4367, 2021
4362                                                                   R. Rosselli et al.: Determining the hierarchical order

tered log ratio (CLR) transformation. Notwithstanding some         account for less variation over its reference control sampling
slight changes in the shape of the ordination plots, observed      than the choice of sampling that site 4 months apart.
phenomena and ensuing trends that we point out and de-                In our prior work (Rosselli et al., 2015) we had studied
scribe in this report were found to be the same. The reasons       community composition in the same Sardinian stations in a
for which we opted for showing the former transformation           short period of winter (in late February) during and after a
procedure (TSS) is that the combination of total sum scaling       single dust-carrying event. In that study the main feature ev-
with square root transformation is the renowned “Hellinger         idenced was the existence of a conserved core microbiome,
transformation”. This has been praised as a preferable choice      encompassing 86 %–95 % of the taxa, to which the incom-
in ecological community comparisons, (Legendre and Leg-            ing dust would cause some detectable diversity variation but
endre, 1998), as it offers the best trade-off between linearity    on a rather limited proportional scale. Such a minor effect of
and resolution in comparison to chi-square metrics and other       the dust-lifting storms observed in winter is in fact confirmed
approaches. It is also recognized as more balanced for the         in the present work in which the time of the year factor ap-
weight given to rare species.                                      pears as the variable of major order in shaping community
   Having clarified the risks in comparing metabarcoding sur-      structure and richness. In that prior analysis of ours the exis-
veys across time, we will therefore limit ourselves to com-        tence of a common core microbiome of the investigated area
menting on only the major phenomena that stand out from the        was one of the suggested pieces of evidence. That concept
comparison. The largest taxa trade-off that is apparent when       stemmed from the analysis run in February and therefore to-
comparing the two periods is the decline in Proteobacteria         wards the end of a winter period throughout which Europe
and the parallel rise in Actinobacteria. Trying to frame this      experiences its minima in terms of temperature-driven air tur-
within possibly seasonal parameters, we can consider that the      bulence events and as a consequence receives more limited
latter typically rely on profuse spore formation from colo-        influxes of air traveling from seas to land. In the present anal-
nial growth, while the former are non-spore-forming bacteria       ysis, we observe that, in spite of the major changes brought
that are motile via either flagella or gliding/swarming mech-      about by the temporal factor, the two sampling stations at
anisms. The basic life forms of the two groups predict there-      opposite corners of the 270 km long island shared the closest
fore that Proteobacteria would be more suited to wet seasons       level of community composition when they were compared
and vice versa for the soil-dwelling Actinobacteria. This phy-     at the same time (see CA Ctrl vs. SS Ctrl in Figs. 3, 4, S9,
lum has been reported by other authors to reach its peaks in       and 6). Moreover, this similarity was maintained in May even
fall (Glöckner et al., 2000). Being also a group of major litter   though the two control stations were compared after the dust
decomposers, its rise along with the end of the plants’ vege-      outbreak. Foremost, those two distant sites achieved the max-
tative season can be seen as compliant with its landscape and      imum of community overlap in September, when controls
ecosystem cycles.                                                  were compared immediately before the next outbreak, after a
   A further ecological aspect that can be commented on is         109 d long period without such events. During that time the
the higher diversity of the communities during the September       air microbiome of the whole area appears to have changed
sampling in comparison to May, independently from the dust         profoundly but in a concerted fashion, leading to high uni-
events and from the sampling station location.                     formity across the island. These data confirm the view of the
   This phenomenon, besides the ecological value differences       prevalence of a core microbiome, as emerged in our 2015 re-
(Tables 2, 4 and S1, Fig. S9), can be also appreciated visu-       port and add the evidence that such an extended core commu-
ally, by comparing the left and the right pie charts in Fig. 3     nity also undergoes a temporally related concerted turnover.
(featuring community composition at order-rank level and           Whether or not this could be also a seasonal (regularly recur-
the corresponding cluster analysis based on their relative per-    rent) phenomenon will have to be demonstrated by further
centages) and noticing the more complex color-coded pattern        research on this subject.
of the latter sampling, also showing a consistent similarity of       Literature reports have in this sense pointed out differences
most color sectors’ presence and proportions. It is not pos-       in airborne microbial composition between seasons; peaks of
sible from these single-year data to deduce whether such an        fungi causing invasive infections in humans were signaled in
increase could be part of a recurring seasonal phenomenon          spring, whereas higher proportions of allergenic fungi were
causing, cyclically, higher species richness after summer pe-      observed in fall (Yamamoto et al., 2012).
riods or if what we observe could be part of a different pattern      Consistent with the present data, a higher diversity of both
of stochastic variability.                                         fungal and bacterial airborne cells in late summer and early
   Nevertheless, the overall partitions of systematic groups       fall has been observed in United States-based surveys (Bow-
observed in a given sampling time, irrespective of dust out-       ers et al., 2012, 2013).
breaks or sampling corner of Sardinia, share much more sim-           Hypotheses to explain the increase in circulating taxa
ilarity within the samples of that period than with any of         widely observed in the fall sampling campaign can be for-
those collected in the other season. It appears that in general,   mulated. In the first instance one should consider whether
air collected during dust discharge from a Saharan wind can        there could have been a change in the prevailing wind origin
                                                                   or direction across the period that encompasses the two sam-

Biogeosciences, 18, 4351–4367, 2021                                                   https://doi.org/10.5194/bg-18-4351-2021
R. Rosselli et al.: Determining the hierarchical order 4363 pling seasons. This can be evaluated upon inspecting publicly resulting in lighter cell weights more prone to being advan- available meteorology records showing the wind roses for the tageously lifted by the local low-layer air turbulence. two sampled localities. These data, from March to Novem- A further factor that can be hypothesized to have played a ber, for the Cagliari and Sassari weather stations, are shown role in reducing the diversity of airborne community samples in Figs. S10 and S13 in the Supplement, respectively. In the in May comes from the analysis of the differentially featured Cagliari plots (southern Sardinia) it can be observed that be- taxa between the spring and the fall samplings (Table S1) tween May and September there was basically no variation in where the strongest statistically significant differences were the wind patterns, with the prevailing ones blowing towards six taxa that were highly enriched in the former period and the northwest with stable intensities. Likewise in the Sassari that, as cited above, included marine bacteria associated with area (Fig. S13), although some fluctuations in the strength of oil-spill-related oleovorous phenotypes, extremophiles, and the westbound winds can be seen, the dominant air motion potential pathogens. These occurrences can be interpreted as throughout the period remained the one heading south. In possible clues to a transient event of water pollution around essence these data allow us to rule out that the change in com- the sampled areas that could have also impacted on the over- munity patterns could be due to major air-driven events of all airlifted microbial diversity. taxa immigration from other insular or continental sources. In addition to the above, a series of considerations can be In addition to the wind orientation and force, data from drawn upon by inspecting the pairwise community differ- the two stations regarding temperature and humidity of the ence analysis, whose similarity values are shown in Fig. 6. same winds can be analyzed (Figs. S11, S12, S14, and S15 It also needs to be recalled that, in order to examine the in the Supplement). Humidity values from May to Septem- effect of a dust-free period, in May the control (27 May) ber winds tend to be rather similar, whereas air temperatures was sampled after the dust event (21 and 22 May), while increase in line with the summer progression. These data do in September the control (13 September) was taken before not account by themselves for events of species enrichment the new dust outbreak (19 and 20 September). Therefore, either. the summer, within which communities could undergo dust- Another aspect that can be verified is to compare the two independent changes, is in fact framed between the two con- periods in terms of PM10 particulate concentration; these pe- trol points, chosen as representative of dust-free atmosphere riods are reported in Figs. S1c (May) and S4c (September). following a wind direction reversal. Within those months Although there are obvious peaks of PM10 in correspondence there were no dust-carrying wind outbreaks from the African with the dust outbreaks dates, the basal levels of PM10 con- land. This also enabled us to verify whether a relatively long centrations before and after those peaks are rather similar in period without dust intrusions could have allowed an overall the spring and fall period. This rules out the possibility of a homogenization of the bacterial airborne communities over diversity rise linked to a general increase in such small parti- the island of Sardinia. Regarding Fig. 6, we can point out cles traveling over the areas. the main message that this color table is meant to convey, The observed data reveal that, while dust-associated winds which is just the fact that the low-similarity pairwise com- can account for some specific limited ingression of taxa, a parisons (conditionally formatted as red- and yellow-shaded far more noticeable pattern appears consisting in a succes- cells) are almost all observed in the upper table, i.e., the sional rise in taxa diversity. It is not yet possible to establish between-season comparisons, while the green ones (higher whether this occurrence could be linked to late summer in similarities) are all distributed in the two same-period com- relation to the climatic conditions of the season. The second parisons. The first consideration that stems from the global part of the summer, especially in the Mediterranean regions, view of these data is once again that the most distant com- is characterized by prolonged drought alternated with irregu- munities are those compared from different seasons (Fig. 6, lar thunderstorms. The incoming of a thunderstorm is accom- upper section). It is worth noticing in this respect that no par- panied by convective instability of the atmosphere, and this ticular difference appears when comparing communities be- phenomenon has already been pointed out as conducive to tween those collected from the same site (right panel in the the emission and transport of fungal spore plumes (Burch and upper section) or between the two different places. More- Levetin, 2002). A possible explanation for a richer pattern of over, in these samplings from different seasons, the effects airborne microbes after several weeks of a prevailingly dry of the dust events in comparison to calm air with dust-free climate can be sought in the acknowledged fact that those wind regimes are not apparent, being diluted in the major seasonal conditions enhance the daytime height of the plan- time-related divergence of the communities. etary boundary layer over Europe and the continental USA When inspecting cases of the same season, the situation in (Seidel et al., 2012) and that the ensuing low pressures foster May represents a comparison picturing the recovery after the the turbulence near the ground and the overall convection, re- dust event, as the control follows the outbreak. One evident sulting in a frequent uplift of particles from land surfaces. In aspect in that is how the juxtapositions within the same place addition, it could also be postulated that the drier and warmer feature the most similar cases (darkest shades of green) with summer conditions can eventually lead to partial cell dehy- the notable exceptions linked to the dust outbreak in Sas- dration in microbes lying at the soil or vegetation surface, sari, which is the north-facing station (notice the two yellow- https://doi.org/10.5194/bg-18-4351-2021 Biogeosciences, 18, 4351–4367, 2021
You can also read