HOVERCAT: a novel aerial system for evaluation of aerosol-cloud interactions - Atmos. Meas. Tech
←
→
Page content transcription
If your browser does not render page correctly, please read the page content below
Atmos. Meas. Tech., 11, 3969–3985, 2018
https://doi.org/10.5194/amt-11-3969-2018
© Author(s) 2018. This work is distributed under
the Creative Commons Attribution 4.0 License.

HOVERCAT: a novel aerial system for evaluation of
aerosol–cloud interactions
Jessie M. Creamean1,2 , Katherine M. Primm1 , Margaret A. Tolbert1 , Emrys G. Hall1,3 , Jim Wendell3 , Allen Jordan1,3 ,
Patrick J. Sheridan3 , Jedediah Smith4 , and Russell C. Schnell3
1 CooperativeInstitute for Research in Environmental Sciences, University of Colorado, Boulder, CO 80309, USA
2 PhysicalSciences Division, National Oceanic and Atmospheric Administration, Boulder, CO 80305, USA
3 Global Monitoring Division, National Oceanic and Atmospheric Administration, Boulder, CO 80305, USA
4 Smith & Williamson, Corvallis, OR 97330, USA

Correspondence: Jessie M. Creamean (jessie.creamean@noaa.gov)

Received: 13 February 2018 – Discussion started: 23 February 2018
Revised: 23 May 2018 – Accepted: 18 June 2018 – Published: 6 July 2018

Abstract. Aerosols have a profound impact on cloud mi-            inverse correlation with increasing altitude. HOVERCAT is
crophysics through their ability to serve as ice nucleating       a prototype that can be further modified for other airborne
particles (INPs). As a result, cloud radiative properties and     platforms, including tethered balloon and unmanned aircraft
precipitation processes can be modulated by such aerosol–         systems. The versatility of HOVERCAT affords future op-
cloud interactions. However, one of the largest uncertainties     portunities to profile the atmospheric column for more com-
associated with atmospheric processes is the indirect effect      prehensive evaluations of aerosol–cloud interactions. Based
of aerosols on clouds. The need for more advanced obser-          on our test flight experiences, we provide a set of recom-
vations of INPs in the atmospheric vertical profile is appar-     mendations for future deployments of similar measurement
ent, yet most ice nucleation measurements are conducted on        systems and platforms.
the ground or during infrequent and intensive airborne field
campaigns. Here, we describe a novel measurement plat-
form that is less expensive and smaller (< 5 kg) when com-
pared to traditional aircraft and tethered balloon platforms      1   Introduction
and that can be used for evaluating two modes of ice nucle-
ation (i.e., immersion and deposition). HOVERCAT (Honing          Some of the least understood atmospheric processes are
On VERtical Cloud and Aerosol properTies) flew during a           aerosol–cloud interactions and, specifically, those with
pilot study in Colorado, USA, up to 2.6 km above mean sea         aerosols that serve as ice nucleating particles (INPs)
level (1.1 km above ground level) and consists of an aerosol      (Boucher et al., 2013). Formation and microphysical mod-
module that includes an optical particle counter for size dis-    ulation of cloud droplets and ice crystals is highly dependent
tributions (0.38–17 µm in diameter) and a new sampler that        upon the types and number of aerosols that serve as cloud
collects up to 10 filter samples for offline ice nucleation and   condensation nuclei (CCN) and INPs. In the absence of CCN
aerosol analyses on a launched balloon platform. During the       and INPs, clouds would in theory require > 400 % humidity
May 2017 test flight, total particle concentrations were high-    and < −36 ◦ C to form droplets and ice crystals, respectively;
est closest to the ground (up to 50 cm−3 at < 50 m above          conditions atypical of mixed-phase clouds (Pruppacher and
ground level) and up to 2 in 102 particles were ice nucleation    Klett, 1997). Aerosol-induced microphysical modifications
active in the immersion mode (at −23 ◦ C). The warmest tem-       influence cloud lifetime and albedo (Morrison et al., 2005)
perature immersion and deposition mode INPs (observed up          as well as the production of more or less precipitation, par-
to −6 and −40.4 ◦ C, respectively) were observed closest to       ticularly in mixed-phase cloud systems. INPs nucleate ice
the ground, but overall INP concentrations did not exhibit an     through pathways dependent upon temperature, saturation
                                                                  with respect to ice, and the INP type (Hoose and Möhler,

Published by Copernicus Publications on behalf of the European Geosciences Union.
3970                                                                                       J. M. Creamean et al.: HOVERCAT

2012). The modes of heterogeneous ice nucleation include            ing the assumption that the INPs in precipitation are what
(1) condensation freezing, whereby ice is formed concur-            initiated ice formation in the clouds above; however, there
rently with the initial formation of liquid on CCN at su-           are caveats associated with artifacts from scavenging during
percooled temperatures; (2) immersion freezing, whereby an          raindrop or snowflake descent, aerosolization methods, and
INP is immersed in an aqueous solution or water droplet via         redistribution of residue particles in collected liquid precip-
activation of CCN during liquid cloud formation; (3) con-           itation samples (Creamean et al., 2014; Hanlon et al., 2017;
tact freezing, whereby an INP approaches the air–water inter-       Petters and Wright, 2015).
face of a droplet (e.g., via a collision) and initiates freezing;      Although observations on the ground afford detailed infor-
(4) deposition nucleation, whereby ice is formed from super-        mation regarding the characterization of INP sources, they
saturated vapor with respect to ice (RHi > 100 %) on an INP         may not be representative of INPs in the atmospheric col-
directly; and (5) pore condensation and freezing, whereby           umn, where they have the direct ability to impact cloud ice
water vapor is condensed into voids and cavities followed by        formation processes and may originate from a range of local
glaciation (Coluzza et al., 2017; Cziczo et al., 2017; Hoose        to long-range transported sources. As a result, several INP
and Möhler, 2012; Kanji et al., 2017; Marcolli, 2014; Vali et       quantification and characterization studies have been con-
al., 2015).                                                         ducted in clouds at mountaintop atmospheric research facil-
   Immersion freezing is the most relevant to primary ice for-      ities, such as Storm Peak Laboratory in the United States
mation in mixed-phase clouds and requires that INPs initially       (Baustian et al., 2012; Cziczo et al., 2004; Richardson et al.,
serve as, or in conjunction with, CCN, whereas deposition           2007), Puy-de-Dôme in France (Joly et al., 2014, 2013), and
nucleation is prevalent in mixed-phase and dominant in cir-         Jungfraujoch in Switzerland (Chou et al., 2011; Conen et al.,
rus cloud ice formation (Kanji et al., 2017). Aerosols such         2015; Stopelli et al., 2017, 2016). Such studies provide rou-
as mineral dust, soil dust, sea salt, volcanic ash, black car-      tine or long-term measurements of INPs in clouds, yet one
bon from wildfires, and primary biological aerosol particles        disadvantage is that profiling is not possible. Vertical profil-
(PBAPs) have been shown to serve as INPs (Conen et al.,             ing of INPs can serve as a connection between the ground and
2011; Cziczo et al., 2017; DeMott et al., 1999; Hoose and           various altitudes below, in, and above cloud. Targeted air-
Möhler, 2012; McCluskey et al., 2014; Murray et al., 2012;          craft campaigns have helped explain the role of INPs in cloud
Petters et al., 2009). Among these, dust and PBAPs are the          ice formation at all levels from below cloud, cloud base, in-
most efficient INPs found in the atmosphere (Cziczo et al.,         cloud, and cloud top (e.g., Avramov et al., 2011; Creamean
2017; Murray et al., 2012). Dust is the most atmospherically        et al., 2013; Curry et al., 2000; DeMott et al., 2010, 2003;
abundant INP, forming ice as warm as −10 ◦ C, but primarily         Pratt et al., 2009; Prenni et al., 2009a; Rogers et al., 2001,
at temperatures < −15 ◦ C (Hoose and Möhler, 2012; Mur-             1998; Schnell, 1982). Although such campaigns yield results
ray et al., 2012). In contrast, PBAPs are relatively rare in the    crucial for understanding the vertical distribution of INPs in
atmosphere, but can form ice as warm as −1 ◦ C (Despres             cloudy environments, they are intensive with regard to per-
et al., 2012; Schnell and Vali, 1976; Vali et al., 1976; Vali       sonnel, cost, and time.
and Schnell, 1975). However, constraining aerosol–cloud im-            Overall, a key gap in ice nucleation research is routine
pacts in models ranging from the cloud-resolving to climate         vertical profiling of INP abundance, efficiency, and chemical
scales, specifically when parameterizing INPs, remains a sig-       and physical characterization (Coluzza et al., 2017). Tropo-
nificant challenge due to limited observations (Coluzza et al.,     spheric measurements via balloon-based systems have been a
2017; Cziczo et al., 2017; DeMott et al., 2010).                    desirable means of measuring aerosol properties on an inex-
   A number of previous ground-based field measurements             pensive and, thus, more frequent basis. However, such mea-
dating back to the 1950s have provided noteworthy advance-          surements can be limited in terms of time, measurements
ments in understanding the sources and efficiencies of INPs         made, or location. For example, long-term records of tropo-
(e.g., Bigg, 2011; Durant et al., 2008; Garcia et al., 2012;        spheric aerosol particle size distributions have been reported
Huffman et al., 2013; Jayaweera and Flanagan, 1982; Mason           in Wyoming, United States (i.e., 20 years) (Hofmann, 1993).
et al., 2015; McCluskey et al., 2014; Mossop, 1963; Murray          The same launched balloon system was deployed in Antarc-
et al., 2012; Petters et al., 2009; Prenni et al., 2009b, 2013).    tica, demonstrating the utility of this platform in multiple en-
Further, previous work has evaluated INP concentrations and         vironments (Hofmann et al., 1989). Particle size distributions
at times composition in detritus, soil, water from lakes and        have also been measured via launched balloons in several lo-
oceans, surface microlayers, and precipitation samples to as-       cations in China using optical particle counters (Iwasaka et
sess INP sources (e.g., Conen et al., 2016; Creamean et al.,        al., 2003; Kim et al., 2003; Tobo et al., 2007). One major
2014; DeMott et al., 2016; Hill et al., 2016; Irish et al., 2017;   caveat with these studies is that it is not clear if the balloon
Moffett, 2016; O’Sullivan et al., 2014; Petters and Wright,         systems were retrievable, given that their maximum flight
2015; Pietsch et al., 2017; Pouzet et al., 2017; Schnell, 1977;     ceilings were located well into the stratosphere. In addition,
Schnell and Vali, 1972, 1973, 1975; Stopelli et al., 2015;          the launched balloon platforms provide information on one to
Tobo et al., 2014). Analysis of INPs in precipitation samples       two aerosol profiles (i.e., ascent and sometimes descent) and
takes a step in the direction of vertical profiling of INPs, mak-   are limited by payload weight. Particle spectrometers have

Atmos. Meas. Tech., 11, 3969–3985, 2018                                               www.atmos-meas-tech.net/11/3969/2018/
J. M. Creamean et al.: HOVERCAT                                                                                                 3971

also been deployed and retrieved on tethered balloon systems          development and described it herein. As discussed later, we
(de Boer et al., 2018; Greenberg et al., 2009; Maletto et al.,        provide future directions for modification and improvement
2003; Renard et al., 2016; Siebert et al., 2004; Wehner et            of HOVERCAT and recommendations for non-tethered bal-
al., 2007), affording information on aerosol layer locations          loon systems in general for future deployments.
and evolution by means of multiple profiles. A few studies
have deployed miniature aerosol filter samplers on launched           2.1   HOVERCAT: the aerosol instrumentation package
or tethered balloon systems, yielding information on aerosol
chemistry (Hara et al., 2011; Rankin and Wolff, 2002); how-           The aerosol module package contains (1) an optical parti-
ever, such samplers contained one filter per flight, thus pro-        cle counter (Alphasense OPC-N2) for particle size distri-
viding information on aerosol properties at only one altitude         butions (16 size bins for 0.38–17 µm in diameter) and es-
(i.e., not a profile). A noteworthy study by Ardon-Dryer et           timated particle mass concentrations with optical diameters
al. (2011) consisted of measurements of immersion mode                of ≤ 1, 2.5, and 10 µm (PM1 , PM2.5 , and PM10 , respec-
INP concentrations from a tethered balloon flight in Antarc-          tively) and (2) the miniaturized Time-Resolved Aerosol Par-
tica, although only at temperatures below −18 ◦ C from three          ticle Sampler (TRAPS) built by the National Oceanic and
filters collected below 200 m above ground level (a.g.l.). In         Atmospheric Administration (NOAA) for collection of up to
general, tethered balloons can handle much larger payloads            10 samples. The time resolution can be set at the desired
than launched systems, but are limited to lower altitudes (i.e.,      rate but was set for 30 min in the current study. The OPC-
up to approximately 2 km a.g.l. anywhere), have wind condi-           N2 operates at 175 mA in operation mode and weighs 105 g.
tion limitations, and involve more complicated logistics (e.g.,       Flow rates are adjusted based on ambient pressure to main-
use of a winch and personnel required to operate a winch),            tain a 1.2 L min−1 flow using a patented “pump-less” design.
and thus may not be ideal for sampling INPs in all conditions.        Data are stored on a microprocessor within the OPC during
Schrod et al. (2017) present INP measurements from sev-               collection. A default density of 1.65 g mL−1 and refractive
eral flights using unmanned aircraft systems (UASs) over the          index of 1.5 were used to estimate particle mass concen-
Eastern Mediterranean, but only in the deposition nucleation          trations. The TRAPS design is based on the filter compo-
mode. To our knowledge, the results from Ardon-Dryer et               nents of the NOAA Continuous Light Absorption Photome-
al. (2011) and Schrod et al. (2017) are the only reported ver-        ter (CLAP), without the optical components and measure-
tical INP measurements using smaller, unmanned systems.               ments (Ogren et al., 2017) (Fig. 1a). It is connected to a
The fact that only two published studies exist, in addition to        small 12 V DC vacuum pump (Brailsford & Co., Inc., TD-
the limitations of such studies (and our limitations as dis-          4X2N), which nominally enables a flow rate of approxi-
cussed in more detail herein), demonstrates the challenges            mately 1.2 ± 0.1 L min−1 through the TRAPS when a 47 mm
associated with obtaining INP measurements aloft.                     diameter filter with 0.2 µm pore size is in place. A Honeywell
    Both launched and tethered balloon platforms, as well as          AWM43600V mass flow meter measures sample flow rate.
UASs, have their advantages and disadvantages in terms of             Ten miniature solenoid valves select the active sample spot
flight ceiling, profiling, retrievability, cost, operational logis-   and are controlled by an onboard microprocessor preselected
tics, and payload restrictions. A solution to reduce the limita-      for the desired time resolution, which was 30 min per sam-
tions of these methods is a launched balloon system that can          ple spot for the HOVERCAT test flights. The TRAPS flow
be controlled in terms of ascent and descent, affords multi-          rate at 30 min provides approximately 40 total liters of air
ple profiling and payload retrieval capabilities, and collects        through each spot, which is ideal for measuring more realistic
aerosol loadings sufficient for altitude-resolved offline ice         INP concentrations (Mossop and Thorndike, 1966). Sample
nucleation measurements. Here, we present a measurement               loaded spots average to a coverage area of 19.9 mm2 (equates
system called HOVERCAT (Honing On VERtical Cloud and                  to a spot diameter of approximately 4.46 mm). The TRAPS
Aerosol properTies) deployed on an experimental launched              has the highest collection efficiency for particles in the 1 nm–
balloon system that possesses such capabilities.                      10 µm aerodynamic diameter range – with particle losses of
                                                                      less than 10 % for 5 nm–7 µm particles and less than 1 % for
                                                                      30 nm–2.5 µm particles at 1.0 L min−1 – but can collect par-
2   Methods                                                           ticles with larger diameters (Ogren et al., 2017).
                                                                         The TRAPS, micropump, and OPC are all operated by bat-
The first prototype of HOVERCAT was recently built and                tery: the TRAPS and micropump run off a battery pack con-
tested in Colorado, United States, consisting of an aerosol           taining three 18 650 rechargeable Li-ion batteries (Panasonic
module for measuring real-time particle size distributions            NCR18650B, 12 V output, 3400 mAh) and the OPC runs off
and a miniaturized filter sampler for aerosol collection for of-      one rechargeable battery (Anker PowerCore 5000, 5 V out-
fline ice nucleation analyses. The balloon platform, called the       put, 5000 mAh). The OPC can operate for several days on
Boomerang Balloon Flight Control System (BBFCS), was                  its portable battery, while the TRAPS and pump can oper-
used to fly HOVERCAT. The current version of HOVER-                   ate for up to 5 h on its battery pack. Both the TRAPS and
CAT is experimental; thus we consider it as Phase I of its            OPC are connected to inlets composed of an 8 in. segment of

www.atmos-meas-tech.net/11/3969/2018/                                                   Atmos. Meas. Tech., 11, 3969–3985, 2018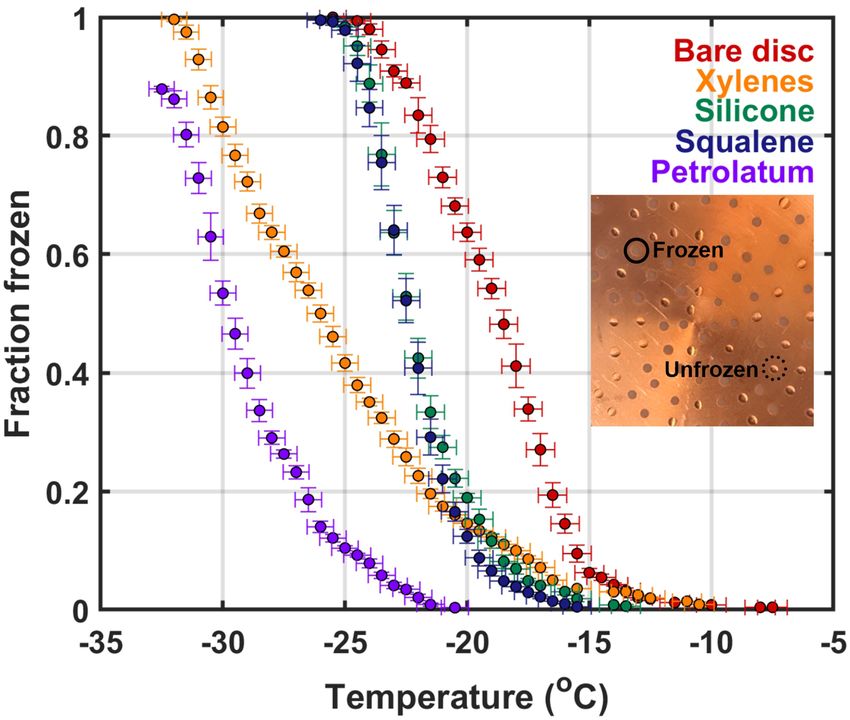
3972                                                                                            J. M. Creamean et al.: HOVERCAT

Figure 1. Components of the complete flight system, including (a) schematic of the TRAPS, (b) picture of the aerosol module, (c) schematic
of the BBFCS, and (d) flight train for test flights. Note that the service module on the BBFCS was separated approximately 1 m from the
ballast module with the aerosol module (i.e., payload) in between. The ballast module was controlled by the onboard computer in the control
module via an extended cable that ran down the tether string. The separated BBFCS modules were housed in foam for flights.

0.25 in. ID black conductive tubing connected to a stainless-           a longer and faster venting is applied. Due to the ability to
steel funnel (5 cm in diameter) with the opening covered with           slow down the fall speed by a combination of the appropriate
stainless steel mesh. All components are seated in a foam en-           amount of venting and dropping ballast, if needed, landing
closure with removable lid and inlets extending out of the              the system is relatively gentle and did not result in instru-
bottom (Fig. 1b).                                                       mental damage during the test flights. It is possible the bal-
                                                                        loon itself can be reused (i.e., we used the same balloon for
2.2    BBFCS: the balloon platform                                      two flights).
                                                                           Two-way communication is achieved through a 70 cm
The BBFCS is a real-time remote device that allows the user             line-of-sight LoRa radio link. The system features a 1 / 4 W
to control the ascent and descent of standard latex weather             transceiver that uses a low baud rate and a slow 4 s time-
balloons (Fig. 1c). The primary features are a lift-gas vent            division multiple access (TDMA) cycle to achieve ranges in
valve in the control module that permits negative buoyancy              excess of 300 km. The system also features redundant termi-
adjustments and a sand ballaster (i.e., ballast module) that            nation methods, anti-collision strobes, positioning, and flight
permits positive buoyancy adjustments. Buoyancy adjust-                 sensors. A recovery parachute is included for emergency ter-
ments as small as 5 g of lift are possible. For example, if             mination and faster fall speeds than slow balloon deflation.
a faster or slower ascent is desired, ballast can be dropped            The BBFCS was manually controlled for this project. We
or venting can be done, respectively. If descent is desired,

Atmos. Meas. Tech., 11, 3969–3985, 2018                                                    www.atmos-meas-tech.net/11/3969/2018/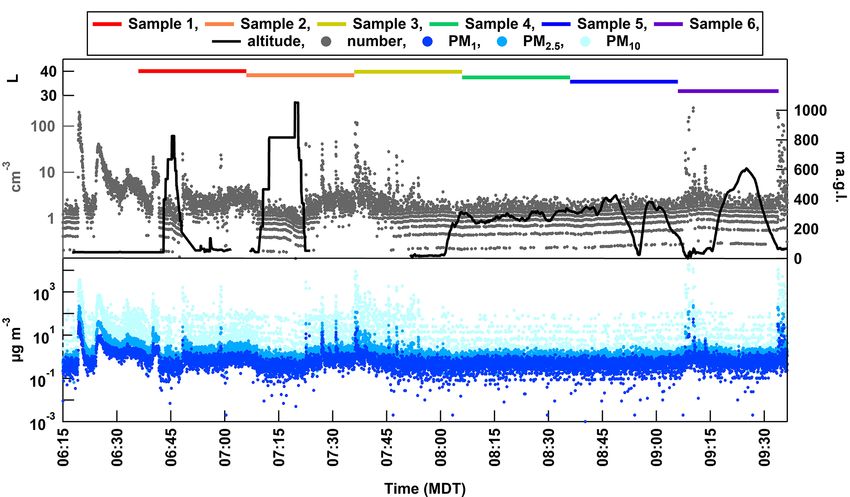
J. M. Creamean et al.: HOVERCAT                                                                                               3973

utilized a software interface on a ground-based computer           ling the valve and ballast modules was not possible. The sys-
to analyze the real-time flight conditions and send the nec-       tem reached 8.1 km a.g.l. and ambient pressure was too low
essary buoyancy control commands to achieve the desired            for the TRAPS pump to operate. The 26 May flight reached
flight profile. We drove in the approximate trajectory of the      > 2 km a.m.s.l. (> 500 m a.g.l.), in which the TRAPS pump
balloon in order to stay within the 300 km communications          also did not operate correctly. For both the 24 and 26 May
range; thus we were able to physically retrieve it when it         flights, the total volume of air pulled through the filters was
ultimately landed. Early morning launches were conducted           1–12 L above 2.5 km a.m.s.l. (1.1 km ), equating to loadings
to maximize the calm low-troposphere atmospheric condi-            too low for offline analyses (i.e., calculated INP concentra-
tions as flight control is much easier in such conditions. Be-     tions were below detection limits). Based on the successful
cause this project entailed low-altitude flights that did not      25 May flight and unsuccessful flights on 24 and 26 May,
exceed 9.6 km above mean sea level (a.m.s.l.) or approxi-          we have concluded that in its current configuration, HOVER-
mately 8.1 km a.g.l., 300 g latex balloons were used. These        CAT can operate below 2.5 km a.m.s.l., otherwise at the low
relatively small balloons, for a 3.9 kg payload, ensured that      pressures, the current micropump cannot generate sufficient
the envelope was always under tension and would expel lift-        flow. New, higher volume pumps are being tested.
gas whenever the vent valve was opened, while ensuring that           The three-dimensional flight path for 25 May is shown
the burst altitude was above the expected operational alti-        in Fig. 2. The horizontal distance between launch and land-
tude. Burst altitude was calculated to be 13–14 km a.m.s.l.        ing was 16.8 km directly. Conditions were partly cloudy with
(11.5–12.5 km a.g.l.) depending on how much lift gas had           surface air temperatures ranging from 16 to 21 ◦ C, relative
been vented. The BBFCS is designed to allow Federal Avi-           humidity from 35 to 47 %, and wind speeds from 2 to 3 m
ation Administration (FAA) part 101 exempt flights, even           s−1 from the north and south (hourly meteorological data
when carrying a reasonably sized payload (i.e., total payload      during flight times obtained from the Colorado Department
weight of less than 5.5 kg and no one module greater than          of Public Health and Environment (CDPHE) at the Boulder
2.7 kg).                                                           Reservoir ground site; 40.07◦ N, 105.22◦ W; https://www.
                                                                   colorado.gov/pacific/cdphe/data, last access: May 2017).
2.3   Test flight details                                          HOVERCAT did not fly through the clouds present that day,
                                                                   but remained below cloud base, based on visual identifica-
The overall launch mass was 4250 g with 450 g of free lift         tion of the system while tracking in real time (i.e., the system
to achieve an initial 3 m s−1 ascent rate. System masses were      was always in the line of sight).
350 g for the balloon and connection spindle, 900 g for the
control module and parachute, 2300 g for HOVERCAT, and             2.4     Offline ice nucleation analyses
700 g of ballast. Initial flight planning called for a five-step
flight profile with 500 m altitude steps. This allocated 100 g     2.4.1    Drop freezing assay for immersion mode ice
of ballast per step, 1.5 m s−1 anticipated ascent rate between              nucleation
steps, and a 200 g reserve for the flight to help maintain
the desired altitude. However, this plan was ultimately not        For the 25 May flight, aerosol samples were collected on
executed due to flight complications discussed herein. The         47 mm filters (Pallflex® EmFab™ ). Pre-treatment of the fil-
flight train for this project consisted, from top to bottom:       ters by means of a 6 N nitric acid bath (Certified ACS Plus,
latex balloon, valve and flight computer modules, 500 mm           Fisher Scientific), three rinses with ultrapure water (UPW;
of line, aerosol module, 500 mm of line, and ballast module        Barnstead™ Smart2Pure™ 6 UV/UF), and baking at 150 ◦ C
(Fig. 1d). The recovery parachute was attached to the bottom       for 30 min was conducted to remove possible filter INP arti-
of the flight computer module and hung off to the side. The        facts. Out of the filters tested, EmFab™ possessed the lowest
parachute’s apex was attached to the termination clamp and         contribution from artifacts compared to cellulose nitrate and
was released by this clamp during termination or by aerody-        polytetrafluoroethylene and survived the pre-treatment pro-
namic drag if the balloon had prematurely burst. The OPC           cess.
was started during balloon inflation and the TRAPS and mi-             Immersion mode freezing was tested using a drop freezing
cropump were started via Bluetooth just prior to takeoff. Two      assay (DFA) cold plate apparatus. This cold plate technique
miniature cameras (Mobius Basic ActionCam with wide an-            was based on previous but slightly modified apparatuses (Hill
gle lens) were mounted to and facing the BBFCS valve mod-          et al., 2016; Stopelli et al., 2014; Tobo, 2016; Wright and
ule and HOVERCAT for time lapse photos during takeoff,             Petters, 2013). For brevity, we call this system the NOAA
flight, and landing.                                               drop freezing cold plate (DFCP). Following collection and
   Three test flights were conducted in central Colorado dur-      prior to analysis, sample filters were stored frozen for ap-
ing 24–26 May 2017. Two of the three flights had instrument        proximately 6 months. After removing from the freezer, each
operational issues (i.e., 24 and 26 May), so only data from the    sample spot was carefully cut and separated from the 25 May
25 May flight are presented herein. Briefly, communications        filter; six spots (i.e., samples) were successfully collected be-
were lost during the 24 May flight and, as a result, control-      fore the battery died. Each spot was placed is a 29 mL ster-

www.atmos-meas-tech.net/11/3969/2018/                                                 Atmos. Meas. Tech., 11, 3969–3985, 2018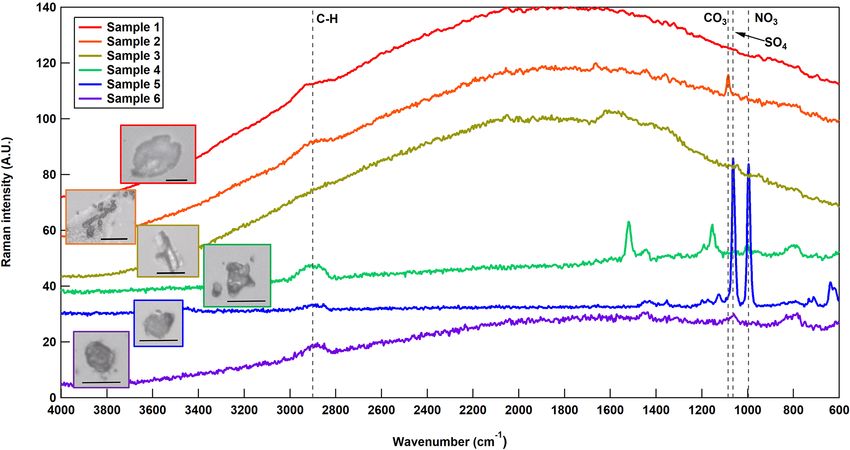
3974                                                                                        J. M. Creamean et al.: HOVERCAT

                                                                     works (Vali and Stansbury, 1966; Wright and Petters, 2013).
                                                                     Frozen drops were detected visually, but recorded through
                                                                     software written in-house, providing the freezing tempera-
                                                                     ture and cooling rate of each drop frozen. For the control ex-
                                                                     periments with UPW, some experiments resulted in unfrozen
                                                                     drops at the DFCP lower temperature limit; thus, the fraction
                                                                     frozen was calculated from the number of drops detected, in-
                                                                     cluding the unfrozen remaining, which is the reason why not
                                                                     all fractions frozen equal 1. However, all drops froze for tests
                                                                     with blanks for the sample handling and the samples them-
                                                                     selves. Each sample was tested three times with 100 new
                                                                     drops for each test. From each test, the fraction frozen and
                                                                     percentage of detected frozen drops were calculated. The re-
                                                                     sults from the triplicate tests are then binned every 0.5 ◦ C to
                                                                     produce one spectrum per sample.
Figure 2. Four-dimensional flight path of HOVERCAT during the           Although the methodology behind DFA is well estab-
25 May 2017 test flight, colored by time in mountain daylight time
                                                                     lished, control experiments were conducted with UPW for
(MDT). Black lines between data points indicate missing GPS data,
                                                                     full system characterization of the DFCP. First, temperature
which occurred between 07:01–07:07 and 07:23–07:51 MDT. Me-
ters a.g.l. were calculated by subtracting 1490 from m a.m.s.l. to   differences were measured within the range of cooling rates
roughly show the altitude above ground.                              using UPW on petrolatum-coated copper discs between the
                                                                     center of the disc (thermocouple inserted in a small diameter
                                                                     hole in the side of the disk) and a drop on top of the plate
                                                                     with a thermocouple inserted into the drop (Fig. 3). As ex-
ile Whirlpak® bag with 2 mL of UPW to resuspend particles            pected based on previous work (Vali and Stansbury, 1966;
deposited on the filter. The bags were sealed and shaken at          Wright and Petters, 2013), there was no dependence of the
500 rpm for 2 h (Bowers et al., 2009). Copper discs (76 mm in        temperature difference on cooling rate, but on average the
diameter, 3.2 mm thick) were prepared by cleaning with iso-          drop temperature was 0.33 ± 0.15 ◦ C warmer than the center
propanol (99.5 % ACS Grade, LabChem. Inc.), then coated              of the plate. Thus, a +0.33 ◦ C correction factor was added
with a thin layer of petrolatum (100 %, Vaseline® ) (Bowers          to any temperature herein and an uncertainty of 0.15 ◦ C was
et al., 2009; Tobo, 2016). Three of the spots on the filter had      added to the probe accuracy uncertainty.
visible aerosol deposits that were successfully transferred to          Second, various hydrophobic coatings with UPW were
the UPW (i.e., based on visual identification).                      tested for the best combination of materials to use with the
   Following sample preparation, a sterile, single-use syringe       least influence from artifacts (Fig. 4). Materials tested were
was used to draw 0.25 mL of the suspension and 100 drops             chosen based on those used in previous work and included
were pipetted onto the petrolatum-coated copper disc, cre-           (1) direct petrolatum (Tobo, 2016), (2) 15 % w/v petrola-
ating an array of ∼ 2.5 µL aliquots. Drops were visually in-         tum in xylenes (Certified ACS Reagent Grade, Ricca Chem-
spected for size; however, it is possible not all drops were         ical) (Bowers et al., 2009), (3) silicone fluid (710 fluid, Dow
the same exact volume, which could lead to a small level of          Corning® ) (Polen et al., 2016), and (4) squalene (≥ 98 %,
indeterminable uncertainty. However, previous studies have           Sigma-Aldrich® ) (Hader et al., 2014; Wright and Petters,
elucidated that drops need to be orders of magnitude dif-            2013; Wright et al., 2013). The silicone fluid was difficult
ferent in volume to significantly perturb the freezing tem-          to use for cold plate experimentation because droplets would
perature from drop size alone (Bigg, 1953; Hader et al.,             coalesce during the experiment and freezing detection by eye
2014; Langham and Mason, 1958). The copper disc was then             was difficult due to the glare of the substance. Squalene was
placed on a thermoelectric cold plate (Aldrich® ) and cov-           less viscous than the silicone fluid, inducing more drop co-
ered with a transparent plastic dome. Small holes in the side        alescence but freezing detection was easier than the silicone
of the dome and copper disc permitted placement of up to             fluid. Both materials remained in the fluid state and thus are
four temperature probes using an Omega™ thermometer/data             not ideal for direct cold plate use, but have been proven suit-
logger (RDXL4SD). The Omega™ meter has a 0.1 ◦ C reso-               able for cold stages that use covered sample dishes or trays
lution and accuracy of ±(0.4 % + 0.5 ◦ C) for the K sensor           and smaller drop sizes (Hader et al., 2014; Polen et al., 2016;
types used. During the test, the cold plate was cooled at 1–         Wright and Petters, 2013; Wright et al., 2013). The petrola-
10 ◦ C min−1 from room temperature until all drops on the            tum and xylenes solution creates a thin layer of petrolatum
plate were frozen or until the DFCP detection limit of ap-           after drying to evaporate the xylenes and alleviate the coales-
proximately −32 to −33 ◦ C. Control experiments with UPW             cence problem; however, as evidenced by the freezing spec-
at various cooling rates within this range show no discernible       tra in Fig. 4, this is not the best option in terms of limiting
dependency of drop freezing on cooling rate, akin to previous        artifacts. To summarize, a hydrophobic coating is needed on

Atmos. Meas. Tech., 11, 3969–3985, 2018                                                www.atmos-meas-tech.net/11/3969/2018/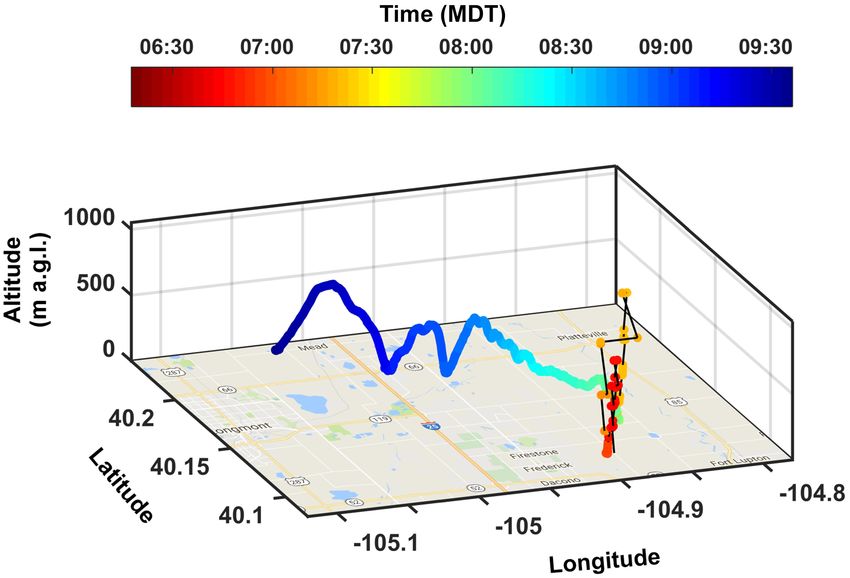
J. M. Creamean et al.: HOVERCAT 3975
Figure 3. Histogram of temperature differences between measure- Figure 4. Freezing spectra for the control experiments conducted to
ments from a probe at the center of the copper plate and drop on top characterize the DFCP system. Results included here are tests eval-
of the plate coated with petrolatum colored by cooling rate. The 1 s uating the most proficient hydrophobic coating with blank UPW
data are from three different tests. The average difference used for drops. Error bars for the y and x axes correspond to standard devi-
the temperature correction was 0.33 ± 0.15 ◦ C. ation per 0.5 ◦ C bin and temperature probe–plate versus drop vari-
ability standard deviation, respectively. Spectra that do not reach a
frozen fraction of 1 indicates not all drops froze at the lower limit of
the DFCP. The inset shows an example of the appearance of frozen
the copper plate and the option with the least influence from versus unfrozen 2.5 µL drops on the copper disc.
contaminants is direct petrolatum smeared onto the plate us-
ing UPW.
Lastly, the effect of drop size was tested using UPW and
petrolatum-coated copper plates (Fig. 5). Normally, 2.5 µL
drops are created by hand using a sterile syringe. Because
such drops are created without the use of a pipette, possible
small variations in drop volume may occur. The same vol-
ume drops were created with a pipette and sterile tips and
tested against syringe drops. Additionally, tests with 1.5 and
5.0 µL drops were conducted to evaluate the effects of larger
changes in volume. One major caveat with the pipette tech-
nique is that it takes substantially more time to create the
arrays of 100 drops (approximately 5 times slower than the
syringe method). Overall, the best method in terms of on-
set freezing temperatures and fraction frozen was the 2.5 µL
drops created via syringe. This test was comparable in terms Figure 5. Freezing spectra for the control experiments conducted
to characterize the drop size chosen for DFCP analysis. Results in-
of fraction frozen to the 1.5 µL drops colder than −21 ◦ C.
cluded here are tests evaluating pipetted versus syringe-aliquoted
One possible explanation for the higher onset temperature
drops and at different volumes. Error bars for the y and x axes cor-
and higher concentrations of impurities in the 2.5 µL pipetted respond to standard deviation per 0.5 ◦ C bin and temperature probe–
drops as compared to the 2.5 µL syringed drops is contam- plate versus drop variability standard deviation, respectively. Spec-
ination from the pipette tips. The 5.0 µL test demonstrated tra that do not reach a frozen fraction of 1 indicates not all drops
that drops of this size are too large such that they induce froze at the lower limit of the DFCP.
freezing at warmer temperatures and are subject to large vari-
ability – in theory, the larger the drop volume, the larger the
abundance of impurities within a single drop that may facil- cur due to (1) detection of rarer INPs at specific tempera-
itate ice formation (Bigg, 1953). Overall, our drop size tests tures during 1–2 of the tests or (2) uncertainties arising from
demonstrate the efficiency and reliability of 2.5 µL drops cre- instrumental artifacts, such as contamination between tests.
ated via syringe. These results demonstrate the importance of running tripli-
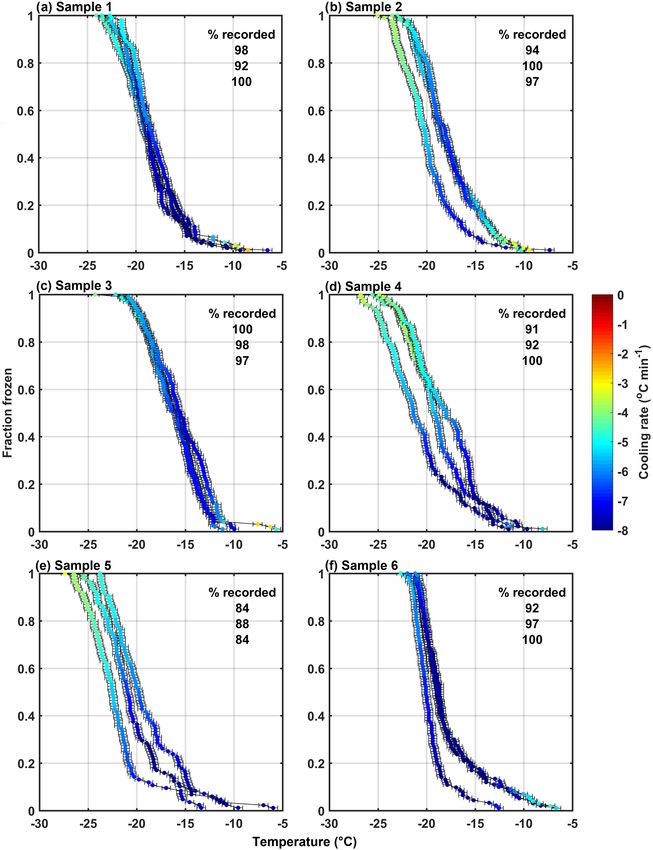
Out of the 100 drops for each test, 95 ± 5 % on average cate (or more) tests for DFA techniques – to capture some of
(ranging between 84 and 100 %) were detected as frozen and the rarer INPs that may exist in the samples or account for
recorded from all tests (Fig. 6). Some of the tests within the test-to-test variabilities. Such rarer INPs may be missed or
same sample were reproducible within error, demonstrating over accounted for if only one test is conducted. The cooling
the reliability of the method (e.g., samples 1 and 3). However, rate was variable during each test but maintained within the
variability from test to test within the same sample could oc- 1–10 ◦ C min−1 range and the fraction frozen did not show
www.atmos-meas-tech.net/11/3969/2018/ Atmos. Meas. Tech., 11, 3969–3985, 2018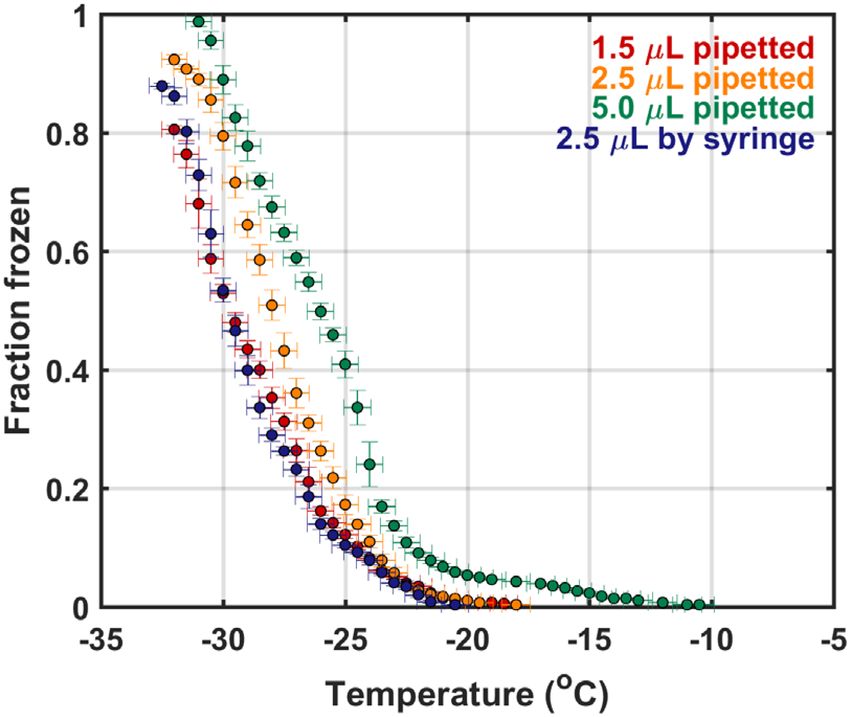
3976                                                                                           J. M. Creamean et al.: HOVERCAT

Figure 6. Freezing spectra for the three tests of each of the samples collected from HOVERCAT during the 25 May 2017 test flight. Each
data point is colored by cooling rate and has error bars associated with Omega™ temperature probe uncertainty. The percentage of recorded
frozen drops is provided for each sample.

a noticeable dependence on the cooling rate, as discussed              six field samples collected and applied that to the equation to
above.                                                                 calculate INP concentrations for the blanks in order to con-
  From the fraction of drops frozen and the known total vol-           duct a direct comparison and evaluate the INP concentrations
ume of air per sample, we calculated the estimated INP con-            in the samples relative to the blanks.
centration (L−1 of air) with the universally applied equation
by Vali (1971):                                                        2.4.2   Raman microscopy for deposition mode ice
                                                                               nucleation
                 ln(1 − f ) Vsuspension
[INP] (L−1 ) =             ×            ,                     (1)
                   Vdrop       Vair                                    Depositional ice nucleation was measured using a Nicolet
                                                                       Almega XR Dispersive Raman Spectrometer outfitted with a
where f is the proportion of droplets frozen, Vdrop is the vol-        Linkham THMS600 environmental cell and a Buck Research
ume of each drop, Vsuspension is the volume of the suspension          CR-1A chilled-mirror hygrometer. The Raman spectrometer
(i.e., 2.5 mL for the sample tests), and Vair is the volume of         was coupled with an Olympus BX51 research-grade optical
air per sample. We averaged the total volume of air from the           microscope with 10×, 20×, and 50× magnification abili-

Atmos. Meas. Tech., 11, 3969–3985, 2018                                                   www.atmos-meas-tech.net/11/3969/2018/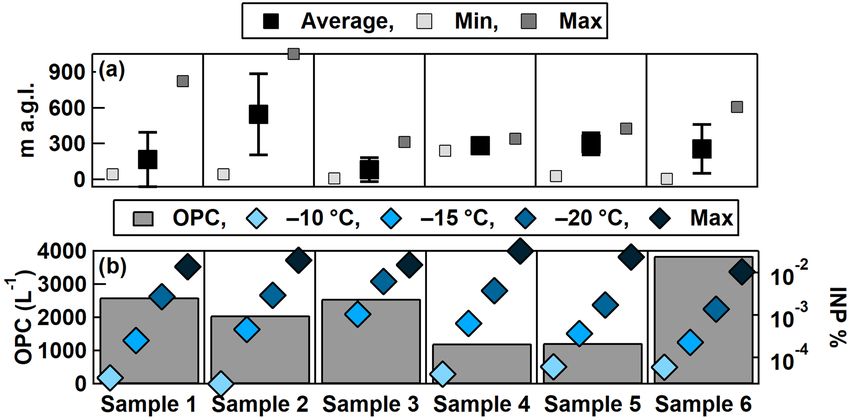
J. M. Creamean et al.: HOVERCAT                                                                                                 3977

ties. The environmental cell and CR-1A hygrometer allow             and descent and sample at altitudes from the ground level
for temperature control and dew–frost point measurements            up to 2543 m a.m.s.l. (approximately 1053 m a.g.l.) for 3 h
to back calculate saturation ice ratios, Sice . The environmen-     (Fig. 7). The ability to control the BBFCS to execute the
tal cell was connected to two UHP-grade N2 tanks: one is            step-wise flight plan was difficult given the winds and the
humidified and the other is a “dry” tank that is not humidi-        several-second delay in time when venting or dropping bal-
fied. These two were then mixed and fed through the envi-           last to decrease or increase in altitude, respectively. Mi-
ronmental cell; lastly, the CR-1A measures the dew and frost        nor fluctuations in BBFCS control to maintain altitude was
point. In these experiments, the water vapor was kept con-          not possible during 25 May conditions, but may be on a
stant while the temperature was decreased, which resulted           calmer day aloft. Because of such issues, the first two pro-
in an increase in Sice . This experimental setup, calibration,      files (i.e., ascent followed by descent to ground) during the
and calculation are explained in more in detail in Baustian et      first hour of flight (up to 2316 and 2543 m a.m.s.l.) were
al. (2010), Schill and Tolbert (2013), and Primm et al. (2017).     abrupt and parking at desired altitudes was not achieved.
   An aliquot of the solutions from the previous immersion          We were able to maintain altitude at 1771 ± 80 m a.m.s.l.
mode experiments was used for deposition mode ice nucle-            (281 m a.g.l.) during the third profile (08:00–09:00 MDT),
ation experiments (i.e., untested sample solution). The solu-       with a short drop in altitude around 08:50 MDT. Starting at
tion derived from each spot on the collected filter sample was      09:07 MDT, we were able to maintain altitude just above the
nebulized onto a fused silica disc, which was then placed into      ground at 1536 ± 20 m a.m.s.l. (46 m a.g.l.) until 09:15 MDT,
the environmental cell at ∼ 0 % RH to allow for evaporation         with a final profile up to 2098 m a.m.s.l. (608 m a.g.l.) at
of water from the particles. The temperature was then de-           09:25 MDT. Ultimately, the balloon deflated and ended the
creased at a rate of 0.1 K min−1 , while water vapor was held       flight at 09:36 MDT.
constant. Temperature and dew point were recorded during               While controlling the exact altitude of the BBFCS was dif-
the entire experiment. Sice was determined from the temper-         ficult, the aerosol measurements were fruitful. The OPC mea-
ature and dew point where ice was first visually identified.        sured particle concentrations up to 250 cm−3 while on the
The different Sice values at different temperatures were de-        ground (average of 6 cm−3 ), with the lowest concentrations
termined by performing the same procedure, but changing             occurring at the highest altitudes (< 1 to 2 cm−3 ; average
the starting water vapor pressure. This difference in water         of 1 cm−3 ). However, episodic spikes in number occurred
vapor pressure changes the Sice value at different temper-          when stable on the ground, indicating localized sources of
atures. Temperatures which were analyzed for depositional           high concentrations of particles. PM concentrations followed
ice nucleation were chosen to cover a wide range of those           a similar inverse relationship with altitude (Fig. 7). The to-
previously reported and relevant for several cloud regimes          tal flow though the filter in TRAPS was fairly consistent
(Hoose and Möhler, 2012). Nebulization onto the disc re-            throughout the flight, starting at 40 L for Sample 1 and de-
sulted in 5000–10 000 particles, with a range of 1 to 50 µm         creasing to 32 L for Sample 6. The slight decrease possibly
in diameter, deposited on the surface depending on the spot         resulted from (1) inconsistent power supply by the battery
from the filter paper. Of the particles that nucleated ice, three   pack to the micropump or (2) strain on the micropump with
to five particles were analyzed for composition using Ra-           altitude, although the latter is less likely given the variability
man spectrometry for each sample. Because the purpose of            in altitude throughout the flight.
the analysis was to prove that particles could be analyzed
for depositional ice nucleation using samples collected by          3.2   Immersion freezing ice nucleation
HOVERCAT, only the first few particles that formed ice at
each temperature regime were recorded. A more statistical           From the six filter sample spots that were collected, aerosol
approach (i.e., analyzing more particles) to characterize the       loading was sufficient to conduct INP measurements using
depositional INP population during the flight is outside the        the DFCP system. Cumulative INP spectra show relatively
scope of this paper.                                                low concentrations (i.e., 10−2 –10−1 L−1 ) of warm temper-
                                                                    ature INPs (> −10 ◦ C, likely of biological origin; Murray
                                                                    et al., 2012) for all samples, while reaching up to 101 L−1
3     Results and discussion                                        at temperatures below −20 ◦ C (Fig. 8). Such concentrations
                                                                    are within range of those previously reported in Colorado:
3.1    Operation of HOVERCAT instruments during test                Prenni et al. (2013) reported 1–102 L−1 at −25 ◦ C. The high-
       flight                                                       est INP concentrations were observed from Sample 3, which
                                                                    corresponded to the time where HOVERCAT was closest to
Although the ability to control the exact altitude of the sys-      the ground (i.e., 69 % of sample time was < 50 m a.g.l.), on
tem was difficult due to vertical winds – which was de-             average (Fig. 9a). Sample 6 had the highest concentrations
termined by abrupt ascent or descent and horizontal trans-          of INPs active between −8 and −12.5 ◦ C, which also cor-
port while tracking in real time – we were able to con-             responds to when HOVERCAT hovered just above ground
trol gas venting and dropping ballast to slow down ascent           level (19 % of the time; Fig. 7). It is important to note that all

www.atmos-meas-tech.net/11/3969/2018/                                                 Atmos. Meas. Tech., 11, 3969–3985, 2018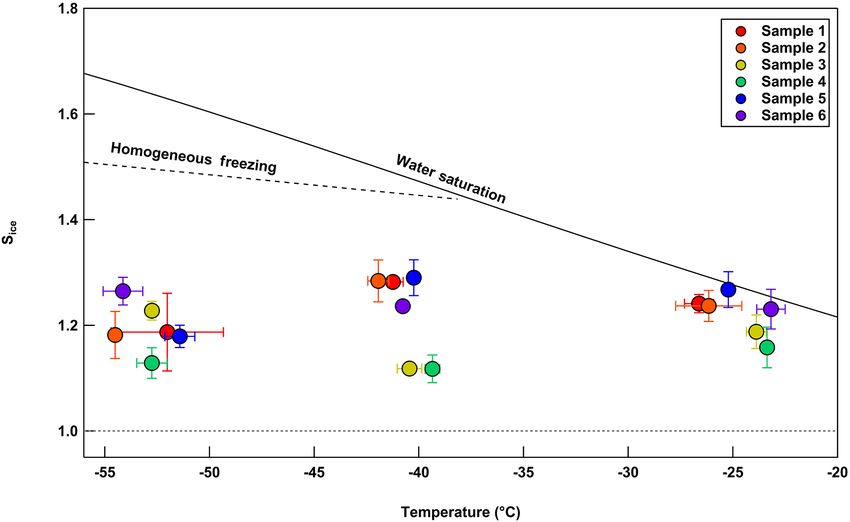
3978                                                                                            J. M. Creamean et al.: HOVERCAT

Figure 7. Time series of TRAPS total volume per sample (L; of air), OPC number concentrations (cm−3 ), altitude (m a.g.l.), and estimated
particulate mass (PM) concentrations from the OPC (µg m−3 ). The width of the TRAPS total volumes corresponds to the collection time per
sample (i.e., 30 min).

                                                                       Figure 9. (a) Average, minimum, and maximum altitudes HOVER-
                                                                       CAT flew during each sample collection time period. Error bars rep-
Figure 8. Cumulative INP spectra from the samples collected dur-       resent one standard deviation. (b) The average number concentra-
ing the 25 May 2017 HOVERCAT test flight. Triplicate tests are         tions of total particles from 380 nm to 17 µm in diameter measured
binned every 0.5 ◦ C. The blanks indicate a triplicate test from       by the OPC (left axis) and fraction of INPs out of total OPC num-
UPW mixed alone in a beaker for 2 h (Blank 1), UPW mixed in            ber at −10, −15, and −20 ◦ C, and the maximum INP concentration
a WhirlPak® bag for 2 h (Blank 2), and an EmFab® filter mixed          measured at the temperature in which the last drop froze (right axis).
in UPW in a WhirlPak® bag for 2 h (Blank 3). The latter is clos-
est to how the samples were prepared. Error bars for the y and x
axes correspond to standard deviation per 0.5 ◦ C bin and tempera-     number concentrations, there was not always a clear decrease
ture probe–plate versus drop variability standard deviation, respec-   of aerosol concentrations with altitude (e.g., Sample 5). Ad-
tively.                                                                ditionally, concentrations were calculated and based on total
                                                                       volume of air, indicating that the altitude in which the sam-
                                                                       ple was collected at for the most amount of time is represen-
samples aside from Sample 4 hovered near the ground: sam-              tative of the overall sample INP population. Combined, the
ples 1, 2, and 5 were close to the ground 40, 9, and 2 % of the        immersion INP, OPC, and BBFCS results indicate that (1) to-
time, respectively. Thus, altitude-dependent results could be          tal particle number concentrations and INP concentrations
skewed by collection nearest to the local source of aerosol.           were highest when HOVERCAT sampled near the ground
It is important to note that the samples that spend little to          and (2) INPs of likely biological origin remained close to the
no time on the ground corresponded to the lowest INP con-              surface, which is predominantly agricultural soils in this re-
centrations (i.e., samples 4 and 5). However, based on OPC             gion (Hill et al., 2016). The relative abundance of INPs to to-

Atmos. Meas. Tech., 11, 3969–3985, 2018                                                    www.atmos-meas-tech.net/11/3969/2018/
J. M. Creamean et al.: HOVERCAT 3979
tal particles is also consistent with previously reported values et al., 2012). The sample collection time periods for these
(DeMott et al., 2010): INPs represented 1 in every 102 to 105 samples occurred directly over a dense agricultural region
number of particles detected by the OPC, although the OPC in the Colorado plains, supporting the observation of highly
does not measure below 380 nm so the fractions might in re- fluorescent particles (Figs. 2 and 7). Interestingly, Sample 3
ality be even lower (Fig. 9b). However, INPs are thought to contained efficient immersion mode INPs as well that were
be relatively large (i.e., > 200 nm in diameter) based on pre- likely of biological origin due to the relatively higher INP
vious work (DeMott et al., 2010; Fridlind et al., 2012; Kanji concentrations at temperatures greater than −10 ◦ C (Fig. 8).
et al., 2017; Mertes et al., 2007; Niedermeier et al., 2015), Samples 4, 5, and 6 show a C–H stretch peak, as well as
so the OPC may be relevant for supporting INP measure- occasionally sulfate (SO2− −
4 ) and nitrate (NO3 ) peaks, which
ments. Although these results may not be surprising (e.g., is consistent with the composition of typical anthropogenic
total particle, INP concentrations within range of previous aerosols in the atmosphere (Zhang et al., 2007). Sample 5
work and generally highest near the ground, and biologi- had the most intense anthropogenic peaks while yielding the
cal INPs sourced from an agricultural region) and yield re- least efficient immersion mode and deposition mode (i.e., at
sults consistent with previous work (DeMott et al., 2010; Hill the two highest temperatures measured) INPs. It is possible
et al., 2016; Murray et al., 2012; Prenni et al., 2013), they any INPs present in this sample were affected by sulfate or
demonstrate the utility and reliability of the collection and nitrate coatings, which have been shown to inhibit the ice nu-
analytical methods of HOVERCAT and the DFCP systems. cleating abilities of aerosols (e.g., Cziczo et al., 2009; Möhler
et al., 2008; Reitz et al., 2011; Sullivan et al., 2010). Collec-
3.3 Deposition ice nucleation tion of samples 5 and 6 coincided with HOVERCAT flying
close to the ground near I-25, where vehicular traffic and in-
Depositional ice nucleation analysis of the six filter samples dustry lining the multilane interstate likely contributed to the
was conducted using the extra volume of resuspension left larger signal from anthropogenic functional groups and less
from the immersion freezing analysis (i.e., the portion of the efficient INPs. However, the Raman spectrum for Sample 6
2 mL that was not used on the DFCP). Of the particles that also has a weak fluorescent signature, indicating a possible
nucleated ice, three to five particles were analyzed for com- biological contribution. HOVERCAT flew from over I-25 to
position using Raman spectrometry for each sample. We as- the west over more agricultural lands. Sample 6 also con-
sume that a majority of the particles are of similar concen- tained high concentrations of INPs at −10 ◦ C, indicating the
tration because the whole sample was dissolved in water, al- sample also contained biological INPs. Combined, these re-
lowed to mix to a homogeneous solution, and nebulized onto sults from Sample 6 suggest a mixture of biological and an-
the sample disc. Indeed, the particle composition was sim- thropogenic sources.
ilar for each particle in any sample, while there was varia-
tion from sample to sample. Although the Raman spectral 3.4 Recommendations for future airborne INP
and ice nucleation analyses are helpful to observe the over- measurements on small platforms
all particle composition as temperature and relative humidity
are changed, the experiment does not determine the size or As indicated earlier, Phase I of the BBFCS and HOVERCAT
mixing state of the particles as they were in the atmosphere. combination exists in its current prototype state. The priori-
Further, the spectral resolution of 1 µm in our system does ties of Phase I were to develop a system that is cost effective,
not allow smaller scales to be distinguished within the indi- user-friendly, versatile, and in compliance with FAA regu-
vidual particles probed. lations without the need for special approvals or restricted
Overall, ice activation onset conditions between the six airspace. Under these priorities, our objectives were to ad-
samples were similar at all temperatures tested (Fig. 10). dress if we could develop such a system that was (1) re-
However, at −40 ◦ C, samples 3 and 4 showed first ice nu- coverable and (2) controllable. Recoverability was a require-
cleation activity at a saturation ice ratio of 1.12, which was ment as we needed to obtain the filter samples for the offline
lower than the other samples and may be characterized as INP analysis, while controllability was an added benefit to
more efficient deposition INPs at that temperature as com- have altitude-resolved INP measurements. We successfully
pared to the remaining samples These samples contained achieved the first objective by recovering the system after
slightly more efficient INPs at −25 ◦ C, but similar efficien- it landed and controlling the BBFCS such that the landing
cies to the remaining samples at −55 ◦ C. Raman spectrom- was not damaging to the instrumentation. The second objec-
etry demonstrates that most of the samples were composi- tive, however, is still in need of improvement as discussed
tionally disparate from each other (Fig. 11). The first three here. The benefits of the system as a whole are that it is cost
samples show a very intense fluorescence signal (i.e., the effective and easy to operate relative to traditional airborne
curve-like characteristic of the baseline), which is consistent measurements of INPs and it did not require special FAA
with either biological or organic materials (Baustian et al., approvals, providing flexibility to fly anywhere at any time.
2012). Additionally, Sample 2 contained a peak for carbon- HOVERCAT alone has the benefit of having time-resolved
ate, which is indicative of a mineral dust signature (Baustian filter sampling capabilities that, if able to control altitude,
www.atmos-meas-tech.net/11/3969/2018/ Atmos. Meas. Tech., 11, 3969–3985, 20183980 J. M. Creamean et al.: HOVERCAT
Figure 10. Depositional ice nucleation experiments on samples 1–6 plotted by Sice versus temperature. The values plotted here are of the
onset conditions of depositional ice nucleation. For our experiments, this refers to the first particle to nucleate ice out of the 104 particles
deposited on the disc in total, thus a percent activated fraction of 10−4 . Although temperatures measured were not exactly −25, −40, and
−55 ◦ C, these values are used for brevity for all samples within each grouping shown above. Nucleation occurring at −25 ◦ C could also be
due to immersion freezing.
Figure 11. Raman spectra for a representative particle per sample. Characteristic vibrational frequencies for functional groups of organics
(C–H; 2800–3000 cm−1 ), carbonates (CO3 ; 1070–1090 cm−1 ), sulfates (SO4 ; 972–1008 cm−1 ), and nitrates (NO3 ; 1032–1069 cm−1 ) are
noted for reference. Included are images of the particles that initiated depositional freezing for the Raman spectra shown. The length of the
black line in each image represents a scale of 20 µm.
would yield vertically resolved INP measurements. However, HOVERCAT, but also recommendations generally applica-
as discussed throughout, both the BBFCS and HOVERCAT ble towards INP measurements on small airborne platforms.
have their limitations. Here, we discuss these limitations and First, HOVERCAT could only operate in its current de-
provide recommendations not only for a Phase II system for sign up to 2.5 m a.m.s.l. (1.1 m a.g.l.). Although this is an im-
provement over previously reported tethered measurements
Atmos. Meas. Tech., 11, 3969–3985, 2018 www.atmos-meas-tech.net/11/3969/2018/J. M. Creamean et al.: HOVERCAT 3981
of INPs (e.g., Ardon-Dryer et al., 2011, reached 196 m a.g.l.), pressure-controlled, and temperature-controlled conditions is
achieving higher altitudes is desired to capture the profile of required at temperatures down to −40 ◦ C. Ardon-Dryer et
INPs in and above clouds using a launched platform that af- al. (2011) measured INPs successfully using a filter sampler
fords the flexibility to essentially fly anywhere. To improve in the Antarctic, but did not collect samples in cloud. Schrod
operation for higher altitudes, modifications should be made et al. (2017) deployed their sampler on a small unmanned
to incorporate a stronger micropump that would yield higher aircraft system up to 2.5 km a.g.l., but did not fly in cloud
flows and operation at lower pressures. The main issue is or ambient temperatures below approximately 15 ◦ C. Com-
that to fly at free will (i.e., under FAA compliance), pay- bined, even though our system and these previous systems
load weight must be maintained under 2.7 kg for any sin- are subject to limitations, they are a significant advancement
gle module (i.e., HOVERCAT). Thus, stronger pumps, which towards a more flexible and versatile manner in which INPs
are by nature heavier, may not be realistic for HOVER- above ground level can be measured. In general, additional
CAT on a launched balloon system. Implementing a stronger research is needed to continue to improve such systems with
pump would require either (1) a FAA Certificate of Waiver regard to cost, performance, and enhanced spatial and tem-
or Authorization (COA), (2) flights in restricted airspace, or poral coverage to improve understanding of INP impacts on
(3) flights on a tethered balloon system, all of which do not clouds.
align with the priorities to maintain simplicity and versatil-
ity. However, we generally recommend future parallel mea-
surements be made with a better pump. One option could be 4 Conclusions
to reduce weight of the other components (e.g., replace the
metal protective enclosure of the TRAPS with lightweight Here, we present a novel airborne aerosol and ice nucleation
foam). This may not afford enough margin to incorporate the measurement system called HOVERCAT that was tested dur-
weight of a better pump, but it is a possible alternative that ing a pilot study on the BBFCS platform. HOVERCAT mea-
needs to be tested. sured time-resolved particle number and INP concentrations
Second, the hovering capability needs improvement, by a range of altitudes up to 2.6 km a.m.s.l. (1.1 km a.g.l. at a
either further testing with the BBFCS or modification to a ground elevation of 1.5 km a.m.s.l.). Although controlling the
traditional launched balloon system. We were able to con- ascent and descent of the balloon platform was difficult, we
trol the altitude ±80 m, but executing the step-wise flight provide recommendations for future platforms and measure-
plan proved to be more difficult than anticipated. The venting ments using similar non-tethered balloon systems. Unlike
and ballasting functioned properly, but improvement could similar systems, HOVERCAT can vertically resolve particle
be focused on accounting for natural conditions (i.e., up- number concentrations in addition to both immersion and de-
drafts and downdrafts) that affect the altitude and truly enable position mode INPs. To our knowledge, this is the first plat-
the BBFCS to hover at desired altitudes. As another option, form to perform such measurements in tandem. Phase I of
HOVERCAT could be deployed on a traditional launched HOVERCAT has been tested, while ongoing efforts for im-
balloon with a slow rise rate and less helium or a reverse provement and modification are desired for Phase II to enable
parachute (i.e., less buoyancy and more drag) to afford a HOVERCAT to fly higher and in more inclement conditions.
steady vertical profile, although this eliminates the hovering The ability to evaluate vertical distributions of INP con-
capability of the system unless the free lift is adjusted such centrations and glaciation temperatures is of crucial impor-
that the system may hover near inversions. For instance, an tance in order to inform and constrain process level models
ascent rate of 0.5 m s−1 would provide a 900 m vertical res- to improve understanding of aerosol–cloud interactions. Ad-
olution (at 30 min per sample). If such a system were suc- ditionally, more routine measurements of INP properties are
cessful, bidirectional communication to control TRAPS sam- needed to understand the evolving nature of aerosol–cloud
pling intervals would not be required and it would eliminate interactions under a wide range of cloud regimes, locations,
the need for additional hardware, receivers, batteries, and and time of year.
other data processing components in HOVERCAT and for
the ground station. In general, we recommend implementing
advanced controllability features into traditional launched Data availability. Data are freely available by contacting
Jessie M. Creamean (jessie.creamean@noaa.gov).
balloons to not necessarily hover, but afford a consistent and
slow rise for sample collection, and components to terminate
the flight at the desired altitude such that the package is still
Author contributions. JMC contributed to study design, execution,
recoverable.
sample, and data analysis for immersion freezing and led the writing
Third, the Phase I pilot study involved sampling in clear of the manuscript. KMP and MAT analyzed samples for deposition
air to conceptually prove HOVERCAT could perform as de- freezing. JS provided the Boomerang platform and lead flight exe-
sired. Ideally, operation of such a system would be in clouds cution. EGH, JW, AJ, and PJS advised with balloon flight planning
and harsher conditions such as the Arctic. To function in and execution. RCS contributed by helping set up drop freezing ex-
harsher environments, testing the modules in humidified, perimentation. All authors contributed to the writing of this paper.
www.atmos-meas-tech.net/11/3969/2018/ Atmos. Meas. Tech., 11, 3969–3985, 2018You can also read