Elevated Police Turnover following the Summer of George Floyd Protests: A Synthetic Control Study - Justin Nix
←
→
Page content transcription
If your browser does not render page correctly, please read the page content below
Elevated Police Turnover following the Summer of George Floyd
Protests: A Synthetic Control Study∗
SCOTT M. MOURTGOS, University of Utah
IAN T. ADAMS, University of Utah
JUSTIN NIX, University of Nebraska Omaha

Several of the largest U.S. police departments reported a sharp increase in officer resignations following massive public
protests directed at policing in the summer of 2020. Yet, to date, no study has rigorously assessed the impact of the George
Floyd protests on police resignations. We fill this void using 60 months of employment data from a large police department
in the western US. Bayesian structural time-series modeling shows that voluntary resignations increased by 279% relative
to the synthetic control, and the model predicts that resignations will continue at an elevated level. However, retirements
and involuntary separations were not significantly affected during the study period. A retention crisis may diminish po-
lice departments’ operational capacity to carry out their expected responsibilities. Criminal justice stakeholders must be
prepared to confront workforce decline and increased voluntary turnover. Proactive efforts to improve organizational
justice for sworn personnel can moderate officer perceptions of public hostility.

Keywords: police turnover, Floyd protests, Bayesian structural time series, resignations

Introduction

Following George Floyd’s death at the knee of Minneapolis police officer Derek Chauvin on May 25, 2020,
thousands of protests (and in some cases riots) occurred across the United States. As a result, the institution of
policing found itself once again embroiled in demands for reform. Concurrently, a significant portion of the
rhetoric surrounding policing during this period was exceptionally negative (e.g., “All Cops Are Bastards” or
“ACAB” became a rallying cry among some critics of policing). Some allege that sustained public scrutiny of
this sort sparked an increase in police resignations across the country. For example, over 100 officers left the
Minneapolis Police Department – more than double the departures that occur in a typical year (Bailey, 2020).
In Portland and San Francisco, it was reported that police officers were leaving in record numbers (Colton,
2020; Wallace, 2020). The Chicago Police Department experienced a fifteen percent increase in retirements in
2020 compared to 2019 (Main & Spielman, 2021). The monthly loss of officers from the New York City Police
Department (NYPD) was approximately double the amount experienced in 2019, leaving the NYPD with its
lowest headcount in ten years (DeStefano, 2020). Finally, the Seattle Police Department was reportedly on pace
to lose 200 officers by the end of 2020 in what has been described as a “mass exodus,” leaving the agency with
its fewest police officers since 1990 (Rantz, 2020).
 These initial reports are concerning. Fewer officers per capita has been linked to higher crime rates (Ko-
vandzic & Sloan, 2002; Levitt, 1997; Marvell & Moody, 1996; Mello, 2019), and in 2020, many jurisdictions
experienced a dramatic increase in homicides and shootings (Rosenfeld et al., 2021). However, year-to-date
comparisons regarding police turnover can be misleading. Resignations and retirements from police depart-
ments occur every year regardless of public criticism or civil unrest. In fact, a policing ‘workforce crisis’ was
identified well before the events surrounding and following George Floyd’s death (PERF, 2019). Policing has
been dealing with decreased applicants, increased resignations, increased agency competition in recruitment
 ∗
 This is a pre-print version of a manuscript forthcoming at Criminology & Public Policy. Please contact the authors before citing it
for an up-to-date version. Correspondence concerning this article should be addressed to Scott M. Mourtgos, Department of Political
Science, University of Utah, Salt Lake City, UT 84112. Email: scott.mourtgos@utah.edu. Current version: July 06, 2021

 1
and transfers, and a pending retirement bubble for at least a decade (PERF, 2019; Wilson, 2012; Wilson et al.,
2010). The challenge, then, is to estimate the counterfactual: how many officers would have retired or resigned
in 2020 absent the George Floyd protests? In other words, is the observed increase in police resignations signif-
icantly larger than we would have otherwise expected? Or is it merely the continuation of an already existing
trend?
 This study examined the effect of an abrupt shift in the socio-political climate following George Floyd’s
death on police turnover in one large, capital city jurisdiction in the western US. Specifically, we considered
three categories of police turnover – resignations, retirements, and involuntary separations – using Bayesian
structural time-series (BSTS) modeling, a time-series quasi-experimental method (Brodersen et al., 2015). Find-
ings indicate that while retirements and involuntary separations did not experience significant changes during
the post-Floyd period, police resignations increased substantially. Further, probabilistic forecasting models
predict continued elevated rates of police resignations.

Police Turnover
Understanding trends in police turnover is essential. Though the evidence is quite mixed, some studies have
shown that more police per capita is associated with lower levels of crime – particularly violent crime (Chalfin
et al., 2020; Chalfin & McCrary, 2018; Kovandzic & Sloan, 2002; Levitt, 1997; Marvell & Moody, 1996; Mello,
2019; Mourtgos & Adams, 2019a)1 . Specific to police resignations, Hur (2014) found that increased rates of
voluntary officer turnover are associated with increased rates of violent and property crime. The direct and
indirect costs of police turnover extend beyond crime levels, however. For example, direct costs consist of
expenses required to hire replacements: background checks, psychological assessments, medical assessments,
and training expenses (Hilal & Litsey, 2020). It is estimated that the cost of losing an officer ranges from one to
five times the salary of that officer (Orrick, 2008). Indeed, a police agency’s return on investment in an employee
is lost when that employee quits after receiving training and education at the agency’s expense (Hur, 2014).
 Indirectly, when officers leave, both the organization and the community lose accumulated institutional
knowledge and specific professional knowledge and skills (Hilal & Litsey, 2020; Hur, 2014). Leavism can lead to
decreased quality of service and productivity (Hilal & Litsey, 2020). Often termed a “brain drain,” the reduction
in performance levels and increased operational risks driven by high turnover are just as real as replacement
costs, though they are difficult to quantify (Wilson et al., 2010). On a large enough scale, turnover can hinder
a police agency’s ability to engage in proactive problem-solving and respond to calls for service, which in turn
could contribute to increased crime and further erosion of public trust (Bailey, 2020; MacLean, 2020; Ren et al.,
2005).
 In sum, high levels of police turnover have harmful effects at the organizational and community levels. Wil-
son (2012, p. 333) succinctly outlined this problem:
 Police employee success is a function of officer experience and ability to make sensible decisions
 with little supervision or oversight. By reducing the number of officers with experience, turnover
 inhibits effective decision making. It diminishes the strength and cohesion a department gains
 from experienced staff. Agencies with higher turnover and less-experienced officers suffer reduced
 productivity and more-frequent complaints. The cost of training sworn police officers is substan-
 tial, particularly in comparison to other fields. The high level of organizational and job-specific
 knowledge required of police officers also means that high turnover can impair organizational
 performance and service delivery while replacement personnel are selected and trained.
 1
 That said, upon meta-analyzing 62 studies concerned with the relationship between police force size and crime, Lee et al. (2016,
p. 431, emphasis added) concluded that “the overall effect size for police force size on crime is negative, small, and not statistically
significant.”

 2
Police agencies often turn to increased monetary compensation to combat increased turnover (Wilson et
al., 2010). Like other organizations, police agencies view increased salaries as a way to encourage employee re-
tention. As Schuck and Rabe-Hemp (2018) found, there is merit to this strategy. Analyzing data from a national
sample of over 2,000 law enforcement agencies, they found that agencies paying higher salaries were less likely
to experience voluntary and involuntary turnover. As the authors note, investing in higher wages upfront saves
organizations from increased costs due to turnover in the long run. Early investment also reduces involuntary
turnover, which is typically driven by misconduct and is costly in terms of public trust and legitimacy.
 However, monetary compensation is only one of several factors known to influence officer turnover. As
Giblin and Galli (2017, p. 398) note, higher salaries may be used in an attempt to offset less favorable considera-
tions: “[T]he supply of prospective officers fluctuates based on the perceived appeal of…law enforcement.” For
example, while Schuck and Rabe-Hemp (2018) found that higher salaries were associated with lower turnover
rates, they also found that police agencies with a higher propensity for dangerous or strained police-citizen en-
counters were more likely to have elevated levels of turnover. This turnover can hamper organizational efforts
to repair damaged relationships between agencies and the public they serve, as the “reality of strained budgets
and long-standing issues in the hiring and retention of officers will likely pose significant barriers” to efforts
such as community-oriented policing (Peyton et al., 2019, p. 19897).
 Other key factors driving police turnover include loss of trust and confidence in leadership (Wilson et al.,
2010; Wolfe & Lawson, 2020) and sustained negative attention (Mourtgos et al., 2020; Nix & Wolfe, 2017; PERF,
2019; Saunders et al., 2019). A given job’s attractiveness depends significantly on anticipated outcomes (Steers
et al., 2004). Suppose an officer’s subjective beliefs regarding the non-mutuality of an exchange relationship
with the public, political leaders, or organizational leaders are strongly negative. In that case, there is a feeling
of loss of control and predictability, resulting in task avoidance (Paoline, 2003; Schott & Ritz, 2018), with the
ultimate avoidance being quitting.
 Increased turnover resulting from a perceived non-mutual relationship between officers and the public, po-
litical leaders, or organizational leaders aligns with the social psychology literature on exchange theory, equity,
and reciprocity. Social exchange theory contends that individuals attempt to maximize the ratio of benefits to
costs in their relationships (Thibaut & Kelley, 1959). An exchange-based model assumes individuals desire rela-
tionships in which equity is experienced. Hatfield and colleagues (1985) describe equity as a state of affairs in
which the relationship’s benefits and costs are proportional to the benefits and costs incurred by the other half
of the relationship. Suppose officers fail to obtain equity in their relationship with their leaders or the public.
For example, officers are trained to a legal and professional standard regarding their use of force. There is often,
however, a significant gap between the legal and professional standards officers operate under and how some
members of the public, media, and political leaders evaluate their actions (Mourtgos & Adams, 2020; Stoughton
et al., 2020). Individuals who become police officers tend to do so out of a desire to help others (Moon & Hwang,
2004; White et al., 2010). By doing so, they expose themselves to physical harm (Sierra-Arévalo & Nix, 2020;
Tiesman et al., 2018). If an officer uses force to protect themselves or someone else, following the legal and
professional standards they have been trained to, but then experience backlash from their leaders or the public,
a perception of inequity may result. In such a case, this may reduce an officer’s motivation to remain a police
officer (or at least remain a police officer in a specific jurisdiction), as it increases their chances of experiencing
negative costs2 (Mourtgos et al., 2020). Indeed, a loss of perceived organizational support is linked to an offi-
cer’s organizational commitment, job satisfaction, burnout, and turnover intention (Adams & Mastracci, 2019;
Gillet et al., 2013).
 2
 This is not to suggest that backlash from leadership and/or the public is always unwarranted. Public attention to illegitimate
police uses of force is an important democratic tool of governance. Because such acts reflect poorly on the profession as a whole, even
uninvolved officers are subject to its impacts. The salience of use-of-force in the minds of the public can result in increased backlash
against the institution as a whole, which can in turn increase individual officers’ stress levels.

 3
The adverse impacts from accumulated stress and burnout in law enforcement are well-studied (Dick, 2000;
Mastracci et al., 2012; Mastracci & Mourtgos, 2021; McCarty et al., 2019; Sparger & Giacopassi, 1983). These
include individual impacts such as increased chronic medical problems, substance abuse disorders, and marital
problems, as well as organizational ones, such as increased job dissatisfaction and leavism. Stress is a multi-
faceted concept. In the modern policing context, it includes the perception among officers that they are un-
usually vulnerable to political and social forces that might follow from even the lawful use-of-force (Mourtgos
& Adams, 2019b). Negative costs may include damage to one’s reputation, family stress, criminal prosecution,
and loss of livelihood, depending on the circumstances (Mourtgos et al., 2020).
 Indeed, Saunders, Kotzias, and Ramchand (2019) argue that researchers have not paid enough attention to
how the socio-political climate affects police officers. As part of a National Institute of Justice-funded study
examining police suicide, Saunders and colleagues conducted interviews in over one hundred law enforcement
agencies across the United States, representing a wide range of agency type and size. While the socio-political
climate was not the most frequently identified police stressor, those interviewed identified the socio-political
climate as the stressor that has increased the most in recent years. Officers reported that excessive scrutiny
has led to unfair expectations being placed on officers and the belief that policing is being set up for failure by
the media. Many of those interviewed expressed an increasing climate of nonsupport from their communities.
Further, interviewees expressed worry regarding how police actions caught on camera would be judged in the
public eye without understanding police training and standards.
 To be clear, the events following George Floyd’s murder in May 2020 are not unique in policing (e.g., the
1968 Chicago riots, the 1992 Rodney King riots, and the riots and protests following the fatal shooting of
Michael Brown in Ferguson, Missouri in 2014). Further, officer perceptions that politicians, the media, and
the public misunderstand, misrepresent, and dislike them are not new (Mourtgos & Adams, 2019b). Decades
ago, Niederhoffer (1967) conducted his seminal work on police cynicism and found that a substantial portion
of officers generally harbored negative feelings toward the public, media, and politicians. More contemporary
research has continued to reveal that many officers feel they are disliked and not trusted by entities outside their
profession (Moon & Zager, 2007; Nix et al., 2020; Yim & Schafer, 2009).
 Claims for profoundly adverse outcomes following similar past crises have been empirically scrutinized,
with studies often indicating such claims are overblown. For example, following the 2014 protests and unrest in
Ferguson, Missouri, commentators claimed that excessive criticism of police had led to a so-called “war on cops”
(MacDonald, 2016). However, there is no compelling evidence that officers’ working environment became any
more or less dangerous than it was before Ferguson (Maguire et al., 2017; Shjarback & Maguire, 2021; Sierra-
Arévalo & Nix, 2020). However, some evidence suggests that college students became more apprehensive about
a career in law enforcement after Ferguson (Morrow et al., 2019; Todak, 2017). Historically, these crises have
been relatively short-lived without documented substantial increases in police turnover (Rhodes & Tyler, 2019).
Yet, it is certainly possible that the contemporary socio-political climate surrounding policing may have more
staying power due to the salience of social media, the rapid spread of images online, and sustained negative
media attention (Rhodes & Tyler, 2019).
 Perhaps a tipping point has been reached, where a hostile socio-political climate has become powerful
enough to drive a retreat from the police profession. Anecdotal reports from various cities indicate that this
may be the case (Bailey, 2020; Colton, 2020; DeStefano, 2020; Main & Spielman, 2021; Wallace, 2020). How-
ever, as noted previously, a “workforce crisis” was identified in policing before the events surrounding George
Floyd’s death (PERF, 2019). For at least a decade, the policing profession has been concerned with staffing is-
sues due to decreased applicants, increased resignations, and a pending retirement bubble (PERF, 2019; Wilson,
2012; Wilson et al., 2010). It remains to be seen whether 2020 was an atypical year in terms of officer retention.

 4
The Current Study

Context
The current study analyzed police officer turnover from January 2016 through December 2020 in one large
jurisdiction in the western US. The agency provides full-spectrum policing services to an estimated 200,000
residents and is located within a metropolitan area with a population of over one million. The department
employs approximately 600 sworn officers.
 George Floyd died on May 25, 2020, in Minneapolis, Minnesota. On May 30, thousands of individuals
staged a protest in the studied jurisdiction based on the circumstances surrounding Floyd’s death. The protest
turned violent when a large crowd surrounded an occupied police vehicle in the downtown area, forcing the
officer to abandon it. The vehicle was subsequently flipped and set on fire. The ensuing riot resulted in looting
and hundreds of thousands of dollars in property damage (including the agency’s public safety building). Sev-
eral officers sustained serious injuries, and many more received minor injuries during the hours-long process
of quelling the riot. Officers from around the state were required to respond to resolve the civil disorder. Fol-
lowing May 30, the National Guard was activated for several weeks to assist in ongoing civil unrest. Between
May 30, 2020, and November 2020, the jurisdiction experienced nearly 300 protests directed at police.
 In addition to the socio-political climate surrounding George Floyd’s death, body-worn camera footage
from an officer-involved shooting in the jurisdiction was publicly released in June. The video upset some in
the community and gained persistent local media attention, increasing the negative socio-political climate sur-
rounding policing locally. After the video footage was released, a city council member publicly declared the
shooting unlawful, despite the investigation not having been completed. The subsequent independent investi-
gation located additional surveillance camera footage clearly showing the individual who was shot had a gun
and pointed it at officers. The local district attorney ruled the shooting was legally justified, but this determina-
tion prompted yet another violent riot that resulted in additional property damage and officer injuries.
 In early August, the jurisdiction’s mayor announced that the agency would be required to revise its use-
of-force policy within 30 days. Specifically, the agency’s policy would be required to go beyond the Consti-
tutionally defined requirements for using deadly force—an ‘objectively reasonable’ standard—and move to a
‘necessary’ standard. This announcement was not well received by the agency’s officers, and no other surround-
ing agency moved to make similar adjustments to their use-of-force policies.3

Data
We employed secondary data from the department for the analysis. The data consists of monthly counts of resig-
nations, retirements, and involuntary separations (described in more detail below) from January 2016 through
December 2020, providing a total of 60 observations for each measure. With the local civil unrest beginning at
the very end of May 2020, a natural inflection point for ascertaining any turnover change is June 2020 (month
#54). This sharp inflection point is a critical aspect of the research design. It allows for leveraging a natural exper-
iment’s power to analyze trends during the pre- and post-Floyd periods. When a series of measures are broken
up by introducing an intervention that occurs at a specific point in time, time-series analysis is appropriate
(Shadish et al., 2002). The sharp change in socio-political climate experienced by the agency’s officers provides
an opportunity for a time-series quasi-experiment to ascertain the impact (or lack thereof) on turnover.
 3
 The revised use-of-force policy was ultimately modeled after the “necessary” language in another state’s use-of-force legislation
(California Assembly Bill 392). Due to a lack of clarity about how a ‘necessary’ standard works at the implementation level, the policy’s
full impact is likely yet to be felt. Though research is underway, empirical assessment of the effects of California’s similar statewide
effort has not yet been available.

 5
Measures
As Hur (2014) explains, one should differentiate between voluntary and involuntary turnover due to different
etiologies. While voluntary turnover is a decision made by the employee (whether due to individual perceptions,
organizational characteristics, labor market conditions, or otherwise), involuntary turnover is not. When an
employee is involuntarily terminated, it is because of misconduct (layoffs may be considered another type of in-
voluntary turnover, but no layoffs occurred during the study period). Recognizing this, and to allow for a more
nuanced understanding of the socio-political climate’s effect on officer turnover, three measures of turnover
were constructed: resignations, retirements, and involuntary separations. All three measures were recorded
from January 2016 through December 2020, providing 60 time-series data points for each measurement. Table
1 provides the annual counts for each of the three measures.

Resignations
Resignations consist of monthly counts of officers voluntarily leaving the police department before becoming
eligible for retirement.

Retirements
Retirements consist of monthly counts of officers voluntarily leaving the police department after being eligible
for retirement. Based solely on counts, it is impossible to ascertain the reason why an individual retired (i.e.,
low job satisfaction, age, or otherwise). In this particular agency, officers are qualified for retirement at either
20 or 25 years, dependent upon their entrance into law enforcement employment. Accordingly, retirements
were analyzed separately from resignations.

Involunatary Separations
Involuntary resignations consist of monthly counts of officer terminations. While possible that a socio-political
climate calling for additional accountability could lead to an increased level of officer terminations4 , the etiology
of any change in this type of turnover is different from voluntary resignations or retirements. Accordingly, it
was analyzed separately.

 Table 1: 2016 - 2020 Turnover Measures
 Year Resignations Retirements Involuntary Separations
 2016 5 21 2
 2017 9 22 3
 2018 18 29 4
 2019 19 21 5
 2020 37 26 8

Method
Bayesian Structural Time Series (BSTS) modeling was used for the analysis. BSTS models are ideal because they
are flexible and modular. They allow the investigator to determine whether short- or long-term predictions
are more important, to account for seasonal effects, and whether to include regressors (Scott, 2017). Further,
 4
 The agency reports there were no involuntary separations in 2020 related to allegations of police misconduct during the protests.

 6
by working in a Bayesian framework, investigators can better acknowledge and incorporate uncertainty into
statistical models and discuss outcomes in terms of probabilities (Mourtgos & Adams, 2021).
 The analysis proceeds in three steps. First, BSTS models are estimated for each measure. Each model’s
time series is decomposed, and resulting plots are examined for any apparent change in turnover beginning
in June 2020 for all three measures. Second, a causal impact analysis is performed (explained in more detail
below) to assess the post-Floyd socio-political climate’s effect on police turnover. Finally, a probabilistic one-
year turnover forecast is estimated.

Analysis
BSTS Models for Resignations, Retirements, and Involuntary Separations
BSTS models are best described as observation equations, linking observed data with an observed latent state
and transition equation. The transition equation describes the development of the latent state over time. The
observation equation is defined as
 = +
where is a scalar observation, is an output vector, and is the unobserved latent state. The transition
equation is defined as
 +1 = +
where is the unobserved latent state, is the transition matrix, and is the control matrix. allows
the inclusion of seasonality in the analysis. The error terms ( and ) are Gaussian and independent.
 Use of BSTS models are ideal for social science (Brodersen et al., 2015) and have been used in other crimino-
logical studies to examine the effect of mandatory sexual assault kit testing policies on rape arrests (Mourtgos
et al., 2021); the efficacy of COVID-19 vaccinations within a police workforce (Mourtgos & Adams, 2021); vio-
lence reduction as a result of gang arrests (Ratcliffe et al., 2017); the deterrent effect of unarmed private patrols
(Liu & Fabbri, 2016); and the effects alcohol licensing policies have on crime (de Vocht et al., 2017). Further,
BSTS models are preferrable to Auto Regressive Integrated Moving Average (ARIMA) models when examining
low-volume count data, as we do here (Ratcliffe et al., 2017).

Model estimation and validation
A BSTS model was estimated for each of the measures with a local linear trend state component and a sea-
sonal state component, allowing for a monthly seasonal parameter. A local linear trend assumes that both the
mean and the slope of the trend follow random walks (Scott, 2020). Ten thousand Markov chain Monte Carlo
(MCMC) iterations were simulated to fit each model.
 Several post-estimation diagnostics were analyzed for all three models. First, autocorrelation plots were
examined. Autocorrelation was not a problem in any of the three models. Second, a plot of the posterior distri-
bution residuals was generated for each of the three models, showing the residuals to be normally distributed.
 Third, one-step-ahead prediction errors for each model were calculated. A time series has t observed times
points ( 1 …, ). Predictions are made for the model at times + 1, + 2, etc. If we denote the steps
ahead forecast of + with data ( 1 …, ) by ( ), then (1) is the prediction of + 1 based on data
up to and including time . The one-step-ahead prediction error, then, is described as ( ) = + – ( )
and is the amount by which the model differs from the actual value once it becomes available. The mean one-
step-ahead prediction errors for resignations, retirements, and involuntary separations are 0.14, -0.20, and
0.08, respectively. As explained below, the mean prediction error for resignations reported here is inflated.

 7
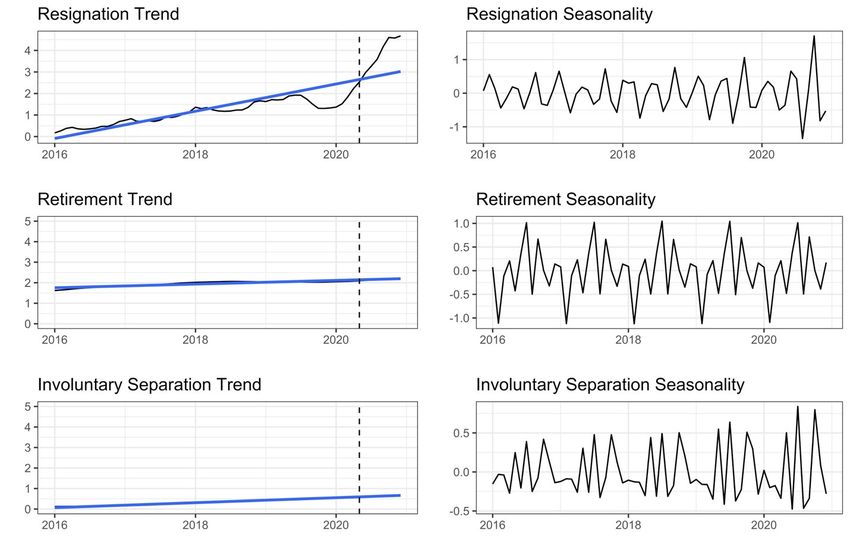
However, even keeping this in mind, the average one-step-ahead prediction errors are minimal, indicating a
good predictive fit for all three models.

Decomposition and assessment
Figure 1 shows the individual state components (i.e., trend and seasonal components) for each model. Decom-
posing and plotting trend and seasonal components separately allow one to see trends in time series data more
clearly without seasonal noise. A regression line is added to each measure’s trend plot. This addition allows for
easy assessment of whether a significant increase occurred in any turnover measures beginning in June 2020
(the dashed vertical line).
 A few observations can be made from Figure 1. First, all three measures show a positive trend over the entire
period, lending credence to past concerns of a growing ‘workforce crisis’ in policing (PERF, 2019; Wilson, 2012;
Wilson et al., 2010). Second, retirements and involuntary separations did not experience any noticeable change
in trends in the post-Floyd period. Third, one can see a substantial jump in resignations above the regression
line immediately in the post-Floyd period5 .
 Recall that the mean one-step-ahead prediction error is inflated for the resignations model. With such a
noticeable jump in resignations following the post-Floyd period, one would not expect the BSTS model to ade-
quately predict resignations during that time. The model’s predictions are based on the preceding years without
the apparent exogenous shock. Accordingly, the mean one-step-ahead prediction error was recalculated for
the resignation model from January 2016 through May 2020 and June 2020 through December 2020. When
measured separately, the mean prediction error for the resignation model is -0.11 and 1.96, respectively—an
absolute difference of 2.07. This measure is a further indication that the post-Floyd period had a significant
effect on officer resignations. Based on the above observations, causal impact analysis is appropriate.

Causal Impact Analysis
BSTS models can be used to infer causal impact by predicting the counterfactual treatment response in a syn-
thetic control that would have occurred if no intervention had taken place. The synthetic control is constructed
using the experimental group’s time-series behavior before and after the intervention and combining control
variables predictive of the target series before the intervention (Brodersen et al., 2015).
 The use of synthetic controls is not new in criminal justice research (e.g., Becker & Klößner, 2017; Donohue
et al., 2019; Mourtgos et al., 2021; Mourtgos & Adams, 2021; Saunders et al., 2015). Historically, however, the
 5
 One can observe an increase in the decomposed resignation time-series trend line before the post-Floyd period. This does not
mean that a substantial rise in resignations began to occur before the post-Floyd period. Instead, this is due to the plot visualizing
the model’s trend rather than actual values. That is, as with any trend measure, the values before and after a specific point in time
affect the trend across the entire period, not necessarily indicating what occurred during that particular point in time. In this case,
November 2020 through February 2021 was a low resignation period, with zero resignations. One can see this uncharacteristically
quiet resignation period pulling the decomposed trend line below the regression line. However, from March 2021 through May 2021,
resignations begin to occur again, with a total of four resignations (one, two, and one, respectively), thus resulting in an increasing trend
line. We do not know of any plausible explanation for the zero resignations occurring from November through February and expect it
to be naturally occurring ‘noise.’ Beginning in June 2020, resignations begin a significant jump with 29 resignations in total—five, four,
zero, six, eleven, and three, respectively. The five resignations in June 2021 alone total more than the previous three months combined
(seven months if one includes November 2020 through February 2021 when zero resignations occurred) or any other single month
in the entire preceding time-series. The sustained substantial increase forces the decomposed trend line to elevate rapidly, affecting
when the increasing trend appears to begin. However, when one examines the absolute values rather than the trend line, it is clear that
a substantial jump in resignations did not start until June 2020 (i.e., the post-Floyd period). The decomposed BSTS models presented
in Figure 1 are not meant to provide causal inference. Instead, they are meant for preliminary analysis, which indicates a sustained
increase in resignations in the post-Floyd period. Using the estimated BSTS models that Figure 1 visualizes, the Causal Impact analysis
provides the causal inference portion of our analysis.

 8
Figure 1: “Resignation, Retirement, and Involuntary Separation Trend”

 9
selection of comparison groups has often been made “on the basis of subjective measures of affinity between
affected and unaffected units” (Abadie et al., 2010, p. 493). Accordingly, as synthetic models have matured, data-
driven procedures to construct synthetic controls have been advocated for and adopted, requiring researchers
to demonstrate the appropriateness of their selected units for comparison.
 Yet, even as counterfactual methods have advanced in sophistication, the construction of a counterfactual
still typically relies on units of analysis endogenous to the entity that receives the intervention of interest. For
example, Wu and colleagues (2021) construct a synthetic counterfactual to test the impact of recreational mar-
ijuana legalization on crime in Oregon by using a pool of counties within states that had not legalized mar-
ijuana. Donohue and colleagues (2019) follow a similar approach to test the effect of right-to-carry laws on
violent crimes, as do Saunders and colleagues (2015) to test the efficacy of focused deterrence on crime but at
the neighborhood (instead of state) level. While this method has been shown to be robust (Becker & Klößner,
2017), it still requires comparing the experimental unit to a synthetic control constructed from nonequivalent
controls. That is, there is an assumption that unknown confounding variables between the experimental unit
and nonequivalent controls (e.g., states, neighborhoods, police departments, etc.) are being accounted for in the
statistical model.
 For example, if we were to build a synthetic counterfactual for turnover based on similarly sized police
agencies within the US, we would be making the assumption that (1) differences between those agencies and
the communities they serve do not affect the differences observed (if any) with the experimental agency, or (2)
the statistical model is adequately accounting for the differences. Police agency culture, practices, surround-
ing communities, and political idiosyncrasies vary greatly (Bottoms & Tankebe, 2012; Crank, 2014; Paoline,
2003). And while the more conventional synthetic control method (Abadie et al., 2010) has been shown to be
robust (Becker & Klößner, 2017) and can arguably account for this variation, we believe one advantage of our
methodological approach is not having to invoke this assumption. That is, we are able to build the synthetic
counterfactual using the time series behavior of the experimental group prior to and after the intervention, as
well as predictors specific to the agency being studied.

Model Predictors
A key component of utilizing BSTS models for causal impact analysis is the identification of predictors. Predic-
tors are linearly regressed onto the observed values of the target series, creating the composite synthetic control
series (along with the experimental group’s time-series behavior before and after the intervention). Based on
the analysis above, the retirement and involuntary separation measures are used for building the synthetic con-
trol for causal impact analysis. Using a Markov Chain Monte Carlo (MCMC) algorithm, computation of the
posterior distribution of the counterfactual time-series is accomplished. A Gibbs sampler and Kalman filter are
used to simulate from a Markov chain with a stationary distribution for model parameters ; ( , | 1 ∶ ). The
posterior incremental effect is described by ( ̃ +1∶ | 1∶ , 1∶ ), where +1̃ , … ,
 ̃ describe the counter-
factual response. The resulting posterior density is conditional only on the observed data and the priors. Param-
eter estimates and the inclusion or exclusion of covariates with static regression coefficients are all integrated
out (de Vocht et al., 2017).
 By placing a spike-and-slab prior over coefficients, the model can choose the proper variables to construct
the synthetic control through Bayesian model averaging techniques. This ensures a particular set of covariates
do not have to be committed to, nor point estimates of their coefficients, avoiding arbitrary selection of co-
variates and overfitting (Brodersen et al., 2015). All predictors are weighted by averaging of marginal inclusion
probabilities for each regression coefficient (Dablander, 2019; de Vocht et al., 2017).
 The pre-intervention time series began in January 2016 and ended in May 2020. The post-Floyd time-series
started in June of 2020 and continued through December of 2020. Accordingly, the pre-intervention series is

 10
53 months in length, with a post-intervention span of 7 months. Ten thousand MCMC samples were drawn
for the analysis, with 95% posterior distribution credible intervals generated6 . Results for the model assessing
change in resignations are presented in Figure 2.

 Figure 2: “Effect of Post-Floyd Socio-Political Climate on Police Resignations”

 Figure 2 contains three panels. The panel labeled “original” shows the data and a counterfactual prediction
for the post-treatment period. The counterfactual prediction is the horizontal dashed line, with a correspond-
ing 95% credible interval surrounding it. The solid line represents the observed data. The panel labeled “point-
wise” represents the pointwise causal effect, as estimated by the model. That is, it shows the difference between
observed data and counterfactual predictions. The panel labeled “cumulative” visualizes the intervention post-
treatments cumulative effect by summing the second panel’s pointwise contributions. The dashed vertical line
represents the intervention date (i.e., June 2020).

 Table 2: Causal Impact Posterior Inference
 Parameter Average SD 95% CI
 Actual Resignations Post-Intervention 4.71
 Predicted Resignations Post-Intervention 1.24 0.42 [0.43, 2.1]

 6
 The frequentist analog to a credible interval is a confidence interval, yet the two concepts are statistically different. In a frequentist
paradigm, confidence intervals are based on repeated sampling theory. A 95% confidence interval indicates that if the same experiment
is repeated ad infinitum, the unknown, but fixed coefficient will fall within it. A credible interval can be interpreted as the probability
that the population parameter is between the upper and lower bounds of the credible interval, based on the available information.

 11
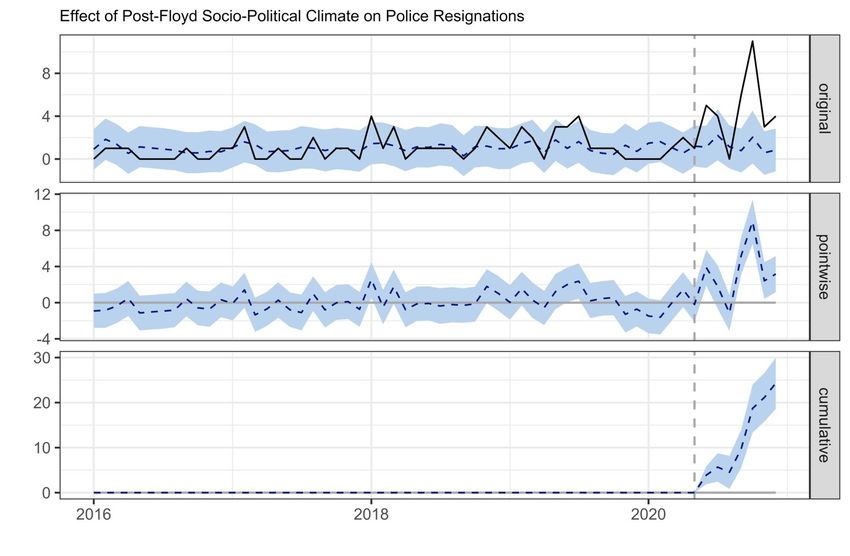
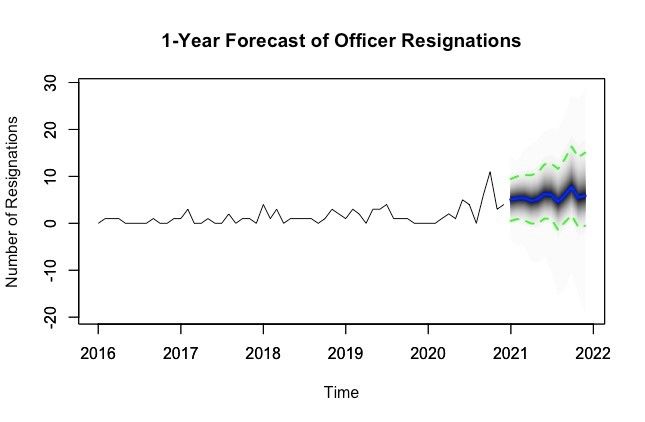
Absolute Effect 3.47 0.42 [2.65, 4.28]
 Relative Effect 2.79 0.34 [214%, 344%]

 Posterior probability of a causal effect > .99

 As indicated in Table 2, the post-Floyd socio-political climate is associated with increased police officer
resignations at the studied police department. During the post-intervention period, the study had an average
of five (4.71) officers resigning per month. By contrast, in the absence of an intervention, a counterfactual
average of one (1.24) officer resignations per month would be expected. Subtracting this prediction from the
observed response yields an estimate of the absolute causal effect the intervention had on resignations (3.47),
resulting in a 279% relative increase in officer resignations. The posterior probability of the observed effect is
>.99. In other words, there is an extremely high probability that the post-Floyd socio-political environment
exerted a positive effect on officer resignations at the studied police department.

Forecasting
Assessing the effect of past events is not the only interest of this study. Of practical consequence is forecasting
continued officer resignations into the future. The BSTS model for resignations can be used to provide a prob-
abilistic forecast for future resignations. Figure 3 plots the resignation forecast for one year beyond December
2020.
 In Figure 3, the blue line represents the median number of resignations the forecast model predicts. The
dashed lines represent 95% credible intervals. The one-year forecast indicates continuing increases in resig-
nations, predicting a median value of five (5.43) officer resignations per month. Noteworthy are the credible
intervals in the forecast, allowing for a greater probability of increased resignations than a decrease in resig-
nations. According to the forecast, it is more probable that the studied department will experience increasing
resignations over the next year than decreasing resignations.
 Forecasts are not destiny. Any number of external factors (the economy, pay increases, political shifts, etc.)
could affect resignations (negatively or positively). The forecast cannot account for these possibilities. Rather,
the forecast takes the BSTS model in its entirety (both pre- and post-Floyd) and estimates a probabilistic projec-
tion for the next 12 months based on the preceding data. Moreover, at some point one would expect a threshold
to be met, at which officers prompted to leave by the post-Floyd socio-political environment have done so, and
the studied agency returns to ‘normal’ attrition levels7 .
 One way to assess the above-listed forecasting limitations is by comparing the forecast with continued ob-
servations. We obtained an additional two months of resignation data since the one-year forecast was projected
(January and February 2021). The one-year forecast posterior distributions estimated a median value of five
(5.019) resignations in January 2021 and five (5.396) resignations in February 2021. Actual resignations in each
month were four additional officers. The observed values are below the projected resignation values, possibly
indicating a pending reduction in resignations. However, the error is low. Thus, the studied agency may not
yet be out of the woods regarding continued resignations.

 7
 We are not able to investigate how the post-Floyd socio-political environment affects recruitment. While a resignation maximum
threshold will likely be met at some point, recruitment could potentially continue to suffer. However, this is an empirical question –
one which this and other agencies should be assessing.

 12
Figure 3: “1-Year Forecast of Officer Resignations”

 13
Discussion

For the past decade, there has been growing concern about a “workforce crisis” in policing, characterized by
an increase in officers leaving the profession (through resignation or retirement), as well as fewer individu-
als applying to become police officers (PERF, 2019; Wilson, 2012; Wilson et al., 2010). Since the fallout from
the fatal police shooting of Michael Brown in Ferguson, Missouri, in August 2014, these concerns have only
grown. Yet, the impact of the socio-political climate on police recruitment remains unclear. While Morrow
and colleagues (2019, 2020) provide evidence of college students being more reticent to become police officers
post-Ferguson (see also Todak, 2017), Rhodes and Tyler (2019) found no evidence of a post-Ferguson decrease
in police applicants in one major metropolitan police department.
 While empirical research on police recruitment is scant, empirical research on police turnover is even more
lacking. A better understanding of police turnover dynamics is crucial as it affects both police organizations
and the communities they serve. In the present study, we examined the effect of a sharp change in the socio-
political climate on officer turnover in a large metropolitan police department. We show the socio-political
environment did not significantly affect retirements or involuntary separations (although both showed an in-
creasing trend across the full period, lending credence to previous concerns about a shrinking police workforce).
However, shortly after protests surrounding George Floyd’s murder began, there was a 279% increase in officer
resignations compared to the synthetic counterfactual.
 Empirical evidence of such a substantial increase in police resignations, paired with anecdotal accounts
from other agencies country-wide (Bailey, 2020; DeStefano, 2020; Main & Spielman, 2021; Rantz, 2020; Wallace,
2020), is concerning for many reasons. A large exodus of experienced officers from a police department can
result in a “brain drain,” where institutional knowledge, along with job experience and skill, are lost from a
department. This loss can reduce performance levels and increase operational risks as newer, less experienced
officers replace veterans (Hilal & Litsey, 2020; Hur, 2014; Wilson, 2012). Prior research indicates that experience
is associated with decreased verbal and physical force (Paoline & Terrill, 2007) and better performance (Sanders,
2008). That being said, prior research also points to experienced officers having lower levels of job satisfaction
(Johnson, 2012) and higher levels of cynicism (Hickman et al., 2004). Future research must continue to study
the correlates and consequences of police turnover, particularly in agencies where turnover is characterized by
rapid replacement of veterans with rookie officers.
 On a large scale, turnover can lead to a police agency’s inability to respond to calls for service, increased
crime, and erosion of public trust (Bailey, 2020; Oliveira et al., 2020). Indeed, some studies indicate that more
police officers are associated with less crime (Kovandzic & Sloan, 2002; Levitt, 1997; Marvell & Moody, 1996;
c.f. Lee et al., 2016). Recent research suggests a correlation between police force size and community violence,
such that each additional ten officers abates approximately one homicide (Chalfin et al., 2020). The authors
also note that “although the total reduction in homicide is roughly equal across Black and white victims, the
decline in homicide is twice as large for Black victims in per capita terms” (p. 4). Thus, a rapid departure of
police officers from a jurisdiction may have a disproportionately negative impact on communities of color (Nix
& Wolfe, 2020). Using RAND’s cost of crime calculator and open-source crime data from the studied agency’s
website, the experienced loss of 33 officers to resignation can be expected to result in an $11.64 million increase
in crime costs over a year’s period, with the value of each individual officer estimated at $357,533 (RAND, 2021).
 More analogous to this study is a recent study published by Piza and Chillar (2020), who found that when
the Newark Police Department laid off 13% of its officers in 2010, violent and property crime promptly in-
creased. Further, overall crime and violent crime became progressively worse each year following the police
layoffs. While the cause of the turnover examined by Piza and Chillar is different from the reason examined in
this study (i.e., layoffs versus resignations), the two studies inform each other as they are both concerned with
sudden, substantial increases in turnover, rather than gentle ebbs across time. It was beyond our study’s scope

 14
to ascertain the causal effect of rapid resignations on crime in the jurisdiction. However, it should be noted
that – similar to other cities across the United States – this jurisdiction experienced a 22% increase in violent
crime and a 25% increase in property crime in 2020. This could be due at least in part to the agency abruptly
becoming understaffed in the summer of 2020, but of course, it might also be a function of societal disruptions
caused by the COVID-19 pandemic (Rosenfeld & Lopez, 2020).
 Concerns regarding police turnover and crime are compounded by the realities of how police hiring works.
For starters, a months-long hiring process is required to ensure high standards are met. The hiring process typ-
ically consists of a psychological exam, medical screening, interview, background check, and more. Once hired,
though, police officers are not “road-ready.” They must graduate from a police academy and then complete a
field training phase. While the length of academy and field training varies from jurisdiction to jurisdiction, it
takes approximately ten months to have an officer ready to function as a solo police officer in the agency we
studied. Our forecasting analysis is instructive when considering the ability of the agency to recover resigna-
tions through increased hiring. Assuming that the police department could recruit and hire 33 officers (approx-
imately 6% of its entire sworn staff) to replace those who resigned (i.e., not including the officers who retired
or were terminated during the same period), it would take almost a year for those 33 new officers to fill the
vacancies. In the meantime, during every month of the year it takes to train the new officers, the above forecast-
ing model predicts an additional five officers will be resigning, equating to a continuing net loss. Accordingly,
for this agency to adequately address their turnover, they will need to hire well ahead of their authorized size
to experience substantial staffing improvements. Considering that retirements and involuntary separations
will likely also continue to occur, it is clear that it will take some time until the agency can return to its full
strength. While forecasting is not destiny, this agency, and others experiencing similar trends, have good cause
for concern.

Financial Costs
There are significant financial costs associated with police turnover. These costs include the actual hiring pro-
cess and new officers’ equipment (Hilal & Litsey, 2020). It is estimated that the cost of losing an officer ranges
from one to five times the salary of that employee (Orrick, 2008). There have been well-publicized calls to “de-
fund” or even “abolish the police” since George Floyd’s death (Kaba, 2020; Vitale, 2017). While the modern
concept is relatively ill-defined, the potential impacts of “defunding” could resemble what has historically oc-
curred following significant police budget cuts.. For example, during the Great Recession many cities were
forced to decrease police staffing out of financial necessity (Wilson et al., 2010). Along with the decrease in offi-
cers working in the community, more crimes went unsolved, community outreach programs suffered, and re-
sponse times increased. Moreover, officers were required to work more overtime, and use-of-force complaints
rose (Weichselbaum & Lewis, 2020). Supporting research further shows that when Newark Police Department
laid off approximately 13% of its police force in response to the 2008 recession, violent, property, and overall
crime increased in response (Piza & Chillar, 2020), with the well-known costs of crime passed onto the city.
 Similar problems may be compounded contemporarily with an exceptionally hostile socio-political climate
surrounding policing, as officers experiencing an antagonistic relationship with the public more strongly en-
dorse coercive tactics and use more physical force (Marier & Moule, 2019; Muir, 1977; Terrill et al., 2003). If
violent crime continues to increase, we may enter a negative feedback cycle, as increased victimization is asso-
ciated with decreased confidence in the police (Ren et al., 2005). While reasonable people can disagree on the
merits of “reimagining policing,” a socio-political climate that results in substantial increases in police turnover
may be failing to remember what recent history taught us.
 Perhaps public monies invested in policing are better suited for other crime reduction efforts or community
outreach programs, as proponents of the #DefundThePolice movement contend. If cities move forward with

 15
“defunding” their police departments, it will be imperative that they (1) have a plan for how the money saved
will be reallocated, (2) establish clear goals and objectives, and (3) rigorously evaluate outcomes.

Long-term Effects
Finally, a substantial increase in turnover not only can have immediate negative effects on the organization
and community, it can also have negative consequences throughout the organization for decades to come by
disrupting workforce cohorts. As Wilson and Heinonen (2012) demonstrate, balance in a police agency’s work-
force structure is important. For example, suppose there is a high level of turnover at the senior level. In that
case, the organization may have to progress junior officers to higher ranks before they possess the skills or expe-
rience to fulfill those duties. Likewise, needing to quickly replace large numbers of personnel results in a large
pool of junior officers, thus inflating the pool of individuals looking to eventually progress to higher ranks. If
progression comes too slowly because of a large cohort competing for a small number of senior positions, the
organization can face a future of frustrated and less satisfied members, possibly resulting in increased future
turnover.
 Wilson and Heinonen (2012) provide several detailed progressions of workforce structure imbalances and
the resultant negative consequences. Due to data limitations, we cannot determine if the experienced turnover
at the studied department may result in a workforce structure imbalance. However, we call attention to an
increased likelihood of these imbalances resulting from sudden, increased turnover and suggest this is an area
demanding attention from policing scholars.

Addressing a Resignation Crisis
So, what can be done to reduce police resignations given the current socio-political climate? We offer sev-
eral suggestions. First, more police agencies should publish data (e.g., use-of-force, stops, arrests, staffing)
promptly—either on their website or repositories like the Police Data Initiative. Such transparency is critical
for policing in the 21st Century (President’s Task Force on 21st Century Policing, 2015). Generally speaking,
open access to police data can help nurture trust between the police and the community. When a controversial
incident (like the killing of George Floyd or the shooting of Jacob Blake) occurs, journalists and citizens can
quickly ascertain how the police in their community perform in regards to use-of-force, racial disparities, and
other outcomes, rather than being left to assume issues in one city are representative of all cities.
 Second, police executives and their political sovereigns must carefully balance their responsibilities to in-
vestigate and discipline misconduct quickly, while doing so in a way that is likely to be perceived by officers as
fair (Nix & Wolfe, 2017). There is a statistically significant and sizeable relationship between perceived orga-
nizational justice and desirable officer attitudes and behaviors (Wolfe & Lawson, 2020). Recent work suggests
that officers who perceive greater organizational justice are less sensitive to the ill effects of heightened pub-
lic scrutiny (Nix & Wolfe, 2016). Further, they are less likely to “de-police” in response to a legitimacy crisis
(Mourtgos & Adams, 2019b) and instead appear to remain committed to working with residents to solve prob-
lems in their communities (Wolfe & Nix, 2016). More generally, research indicates that officers who believe
their agencies treat them fairly are less cynical (Bradford & Quinton, 2014), hold more favorable views toward
the public (Myhill & Bradford, 2013; Tankebe, 2014; Trinkner et al., 2016), and are less likely to engage in mis-
conduct (Wolfe & Lawson, 2020). Research expects that organizationally-just policy has secondary effects that
may help agencies retain officers during times of crisis, through lower levels of depression (Y. Wu et al., 2017),
distress and maladaptive behaviors (Trinkner et al., 2016), and work-related burnout among officers (Adams &
Mastracci, 2019).
 In other words, while agencies have little control over how nationalized stories of police misconduct affect

 16
public opinion, leaders can select and train their front-line supervisors to provide a buffer between community
hostility and their sworn personnel (Wolfe et al., 2018). President Obama’s Taskforce on 21st Century Policing
recognized that organizational justice must precede enhanced trust between police and the communities that
depend upon them (President’s Task Force on 21st Century Policing, 2015). The organizational literature is
vast (see Wolfe & Lawson, 2020, for a recent meta-analysis), but some general approaches to improving organi-
zational justice include giving room for officers to express their feelings about current events affecting them;
revisiting and revising policies with an eye towards clarity of procedure and expectations; enhancing due pro-
cess for officers facing investigation; and ensuring that resulting discipline is consistent and fair. Executive
leadership can model these behaviors, train their supervisors to follow suit, and work to ensure their officers
carry those same behaviors out to their street-level behavior and decision making.
 Finally, politicians and journalists should resist going along with poorly framed narratives. The use of de-
scriptors like “epidemic” to describe civilian deaths resulting from .0002% of all police-citizen encounters (Har-
rell & Davis, 2020; Washington Post, 2021) is at best misleading, at worst dangerous. The framing of how often
and why police-involved fatalities occur can have powerful effects on the way individuals think about police
use-of-force specifically, and policing more generally. Labeling every police-involved death as the result of “po-
lice violence” wrongly suggests the officer is the sole cause of every police-involved fatality, diminishing the
citizen’s contribution to the outcome (Nix, 2020).
 Poorly framed narratives foster a ‘no-win’ socio-political climate for police officers. For example, the initial
video footage of the Jacob Blake shooting in Kenosha, Wisconsin, was inconclusive. While the local police union
asked for the public to withhold judgment until the investigation was complete, the narrative of an unarmed
Black man being shot in the back while entering his vehicle quickly spread across the nation (McLaughlin &
Vera, 2020). Even after an independent investigation found that Jacob Blake was armed with a knife while ac-
tively resisting a lawful arrest—Jacob Blake also gave a public interview admitting to being armed with a knife
(Winsor et al., 2021)—prominent news agencies continued to describe the incident as a police officer shoot-
ing an unarmed Black man (Wulfsohn, 2021). While this incident’s effects on police retention and morale in
Kenosha remain to be seen, the rushed and inaccurately framed narrative led to rioting in Kenosha, exacerbat-
ing an already hostile socio-political environment. This incident also serves as a reminder that police officers
are not the only ones impacted by such poorly framed narratives: the damage to buildings and businesses from
the Kenosha riots was estimated at $50 million (Flores, 2020).
 To be clear, we are not advocating for indiscriminate defense of all police behavior. All stakeholders must
ardently oppose police misconduct. However, political and organizational leaders (if not news agencies) have
an ethical responsibility to their employees and communities to lead with patience and reason. For politicians
and police executives, this is accomplished by ensuring comprehensive and independent investigations and
addressing any misconduct appropriately when and if it is found. For journalists, it means, at a minimum, doing
their due diligence to speak with researchers who can situate incidents within the proper broader context. For
their part, researchers who have subject matter expertise should pick up the phone – or click “reply” – when
journalists contact them about stories. In this regard, entities like the Crime and Justice Research Alliance are
an excellent resource – they can help connect journalists with researchers, and provide training for researchers
interested in learning about how to communicate their research to broader audiences.

Limitations

Some limitations impact our ability to confidently generalize this study’s findings, suggesting the need for fur-
ther research in varying contexts. At a broad level, the debate over potential linkages between protests and
police turnover does not end with the findings presented here. Undoubtedly, there are differences among

 17
You can also read