Holocene surface-rupturing earthquakes on the Dinaric Fault System, western Slovenia
←
→
Page content transcription
If your browser does not render page correctly, please read the page content below
Solid Earth, 12, 2211–2234, 2021
https://doi.org/10.5194/se-12-2211-2021
© Author(s) 2021. This work is distributed under
the Creative Commons Attribution 4.0 License.

Holocene surface-rupturing earthquakes on the
Dinaric Fault System, western Slovenia
Christoph Grützner1 , Simone Aschenbrenner2,a , Petra Jamšek Rupnik3 , Klaus Reicherter2 , Nour Saifelislam2 ,
Blaž Vičič4 , Marko Vrabec5 , Julian Welte1 , and Kamil Ustaszewski1
1 Instituteof Geological Sciences, Friedrich-Schiller-Universität Jena, 07749 Jena, Germany
2 Neotectonics   and Natural Hazards Group, RWTH Aachen University, 52056 Aachen, Germany
3 Geological Survey of Slovenia, Ljubljana, 1000, Slovenia
4 The Abdus Salam International Centre for Theoretical Physics, Trieste, 34151, Italy
5 Department of Geology, University of Ljubljana, Ljubljana, 1000, Slovenia
a now at: Institute of Geology and Mineralogy, University of Cologne, 50674 Cologne, Germany

Correspondence: Christoph Grützner (christoph.gruetzner@uni-jena.de)

Received: 22 January 2021 – Discussion started: 5 February 2021
Revised: 3 August 2021 – Accepted: 6 September 2021 – Published: 4 October 2021

Abstract. The Dinaric Fault System in western Slove-             1   Introduction
nia, consisting of NW–SE-trending, right-lateral strike-slip
faults, accommodates the northward motion of Adria with
respect to Eurasia. These active faults show a clear imprint     This paper is concerned with Holocene surface-rupturing
in the morphology, and some of them hosted moderate in-          earthquakes on strike-slip faults belonging to the Dinaric
strumental earthquakes. However, it is largely unknown if        Fault System (DFS) in western Slovenia (Fig. 1). Follow-
the faults also had strong earthquakes in the late Quater-       ing the established nomenclature in the literature (e.g. Sle-
nary. This hampers our understanding of the regional tec-        jko et al., 1989), the faults are named Dinaric faults because
tonics and the seismic hazard. Geological evidence of co-        they strike parallel to the trend of the Dinarides. However,
seismic surface ruptures only exists for one historical event,   they must not be confused with the now inactive, SW-vergent
the 1511 Idrija earthquake with a magnitude of ∼ M 6.8,          Dinaric thrusts. It is well understood that the Dinaric right-
but the causative fault is still disputed. Here we use geomor-   lateral faults are active and that they accommodate a share of
phological data, near-surface geophysical surveys, and pa-       the relative motion between Adria and Europe (Poljak et al.,
leoseismological trenching to study two of these faults: the     2000; Vrabec and Fodor, 2006; Placer et al., 2010; Moulin et
Predjama Fault and the Idrija Fault. In a paleoseismologi-       al., 2016; Atanackov et al., 2021). However, so far very little
cal trench across the Predjama Fault we found deformation        is known about their earthquake record. In this rather slowly
features that may have been caused by an earthquake be-          deforming region, strong but rare earthquakes may dominate
tween 13–0.7 ka, very likely not earlier than 8.4 ka. At the     the overall seismic moment release. Identifying the strongest
Idrija Fault, a surface-rupturing earthquake happened around     earthquake events in the late Quaternary will, therefore, help
2.5 ka. We show that instrumental and historical seismicity      to better understand the regional active tectonics, shed light
data do not capture the strongest events in this area.           on the role of individual faults in the deformation of the crust,
                                                                 and better inform seismic hazard assessments.
                                                                    Regions of slow continental deformation pose a challenge
                                                                 for active-tectonics studies for several reasons. (i) In low-
                                                                 strain settings, geodetic techniques that cover only a few
                                                                 decades of monitoring (GPS, InSAR) have to deal with very
                                                                 small amounts of total crustal deformation. This hampers a
                                                                 proper recognition of active structures. (ii) Instrumental seis-

Published by Copernicus Publications on behalf of the European Geosciences Union.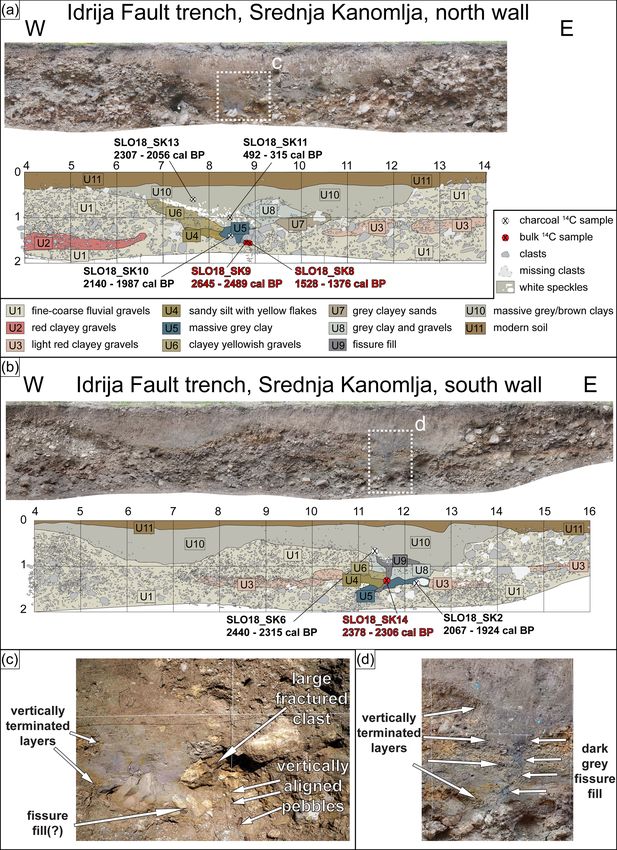
2212                              C. Grützner et al.: Holocene surface-rupturing earthquakes on the Dinaric Fault System

micity is usually low. Microseismicity studies will, therefore,     2     Geological and tectonic setting
often not be able to detect active faults. Earthquakes strong
enough to compute reliable focal mechanisms, for example            2.1    Geological background
by teleseismic body waveform modelling, may not have oc-
curred during the instrumental era. Thus, our understanding         Our study area is located in western Slovenia in the External
of fault mechanisms and seismogenic faults may be limited.          Dinarides, close to the transition zone between the eastern
(iii) Large earthquakes are rare. Historical catalogues contain     Southern Alps and the Dinarides (Figs. 1, 2). The area was
felt events but do not necessarily record the strongest possi-      shaped by the collision of the Adriatic microplate and Europe
ble earthquakes on the local active faults. This is due to the      during the Cenozoic (Schmid et al., 2008; Placer et al., 2010;
faults’ long earthquake recurrence intervals. Also, historical      Ustaszewski et al., 2010; Handy et al., 2015). Shortening
earthquakes can rarely be tied to their causative faults. Earth-    in NE–SW direction and the related SW-directed thrusting
quakes strong enough to leave their imprints in the landscape       of Mesozoic carbonates along NW–SE-striking faults lasted
must have very large recurrence intervals on slowly moving          from the Cretaceous to the Eocene (Fig. 3). This phase has
faults. For the DFS, no long-term recurrence intervals are          shaped the large-scale geological picture as we see it to-
known. Areas with similar strain rates of a few millimetres         day. From the Oligocene to the early Miocene, S-directed
per year are known to have recurrence intervals in the order        transport on E–W-striking faults characterised the phase of
of thousands to tens of thousands of years (e.g. Grützner et        south Alpine thrusting. Žibret and Vrabec (2016) used pale-
al., 2017). Chances are high that their traces were modified        ostress analyses to distinguish three phases of deformation
or obliterated by erosion and sedimentation before any tar-         post-dating the late Eocene NE–SW shortening in western
geted geoscientific investigations. Notwithstanding all those       Slovenia: early to middle Miocene back-arc extension in the
issues, studying slowly deforming regions and diffuse plate         Pannonian Basin led to NE–SW extension and normal fault-
boundaries is important both from the perspectives of active        ing on NW–SE-striking structures. Then, a short pulse of
tectonics (e.g. Stein et al., 2009; Landgraf et al., 2017) and      late Miocene E–W contraction led to a left-lateral reactiva-
seismic hazard (England and Jackson, 2011).                         tion of the NW–SE-striking faults and N–S extension. Since
   In our study area at the transition zone between the east-       the Pliocene, N–S shortening is taken up by right-lateral mo-
ern Southern Alps and the Dinarides we are confronted with          tion on a NW–SE-trending strike-slip fault system known as
the above-mentioned problems to varying extents. GPS stud-          the Dinaric Fault System (e.g. Poljak et al., 2000; Vrabec
ies show that there is about 3 mm/a of convergence be-              and Fodor, 2006; Placer et al., 2010; Moulin et al., 2016;
tween Adria and Europe at the longitude of the Eastern Alps         Atanackov et al., 2021; Figs. 1–3). This phase lasts until to-
(D’Agostino et al., 2005, 2008; Weber et al., 2010; Metois et       day and is corroborated by seismological data (e.g. Herak
al., 2015), but the station network is too sparse to assess indi-   et al., 1995; Pondrelli et al., 2002; Vičič et al., 2019), re-
vidual faults. Only few reliable moment tensor solutions are        mote sensing, and field studies (e.g. Cunningham et al., 2007;
available for moderate earthquakes (Anderson and Jackson,           Kastelic et al., 2008; Gosar et al., 2011; Moulin et al., 2014,
1987; Herak et al., 1995; Bajc et al., 2001; Pondrelli et al.,      2016).
2002, 2011; Kastelic et al., 2008), and they only occurred on
some of the main faults, for example the Ravne Fault earth-         2.2    Active tectonics
quakes in 1998 and 2004 (Fig. 1). For historical earthquakes
of M > 6 the causative faults are either unknown or debated         The largest faults of the strike-slip Dinaric Fault System in
(e.g. Tiberi et al., 2018). Similarly, there is a debate about      the western part of this system are the Raša, Predjama, Idrija,
the strongest historical earthquake on record, the 1511 Idrija      and Ravne faults (Figs. 1–3). They accommodate N–S short-
earthquake, which may have caused surface ruptures on one           ening by right-lateral strike-slip motion since the Pliocene
or two faults (Fitzko et al., 2005; Bavec et al., 2013; Falcucci    (Žibret and Vrabec, 2016). The more than 120 km long Idrija
et al., 2018).                                                      Fault has the most prominent morphological imprint in the
   In this paper we present data from paleoseismological            study area (Cunningham et al., 2006, 2007). It has a to-
trenches dug across two of the large strike-slip faults in west-    tal right-lateral offset of around 10–12 km (Šušteršič, 1996;
ern Slovenia: the Idrija and Predjama faults. We show evi-          Placer et al., 2010) and an almost straight fault trace, pointing
dence for Holocene surface-rupturing earthquakes on those           to its predominant strike-slip mechanism. Lower offset esti-
faults and support our interpretation with geomorphological         mates (∼ 2 km) are based on the displacement of the mercury
data, geophysical profiling, and radiocarbon dating. We then        deposits, which were mined in Idrija for more than 500 years
discuss the implications of our findings in the light of the        (Mlakar, 1964; Placer, 1982; Čar, 2010). The first geological
regional tectonic setting and seismic hazard.                       evidence for the late Quaternary activity of the Idrija Fault
                                                                    came from faulted fluvial deposits in Kanomlja (Cunning-
                                                                    ham et al., 2006; Bavec et al., 2012) and in the Učja River
                                                                    valley (Vrabec, 2012). Geomorphological work showed that
                                                                    the fault offsets the regional drainage system and late Qua-

Solid Earth, 12, 2211–2234, 2021                                                        https://doi.org/10.5194/se-12-2211-2021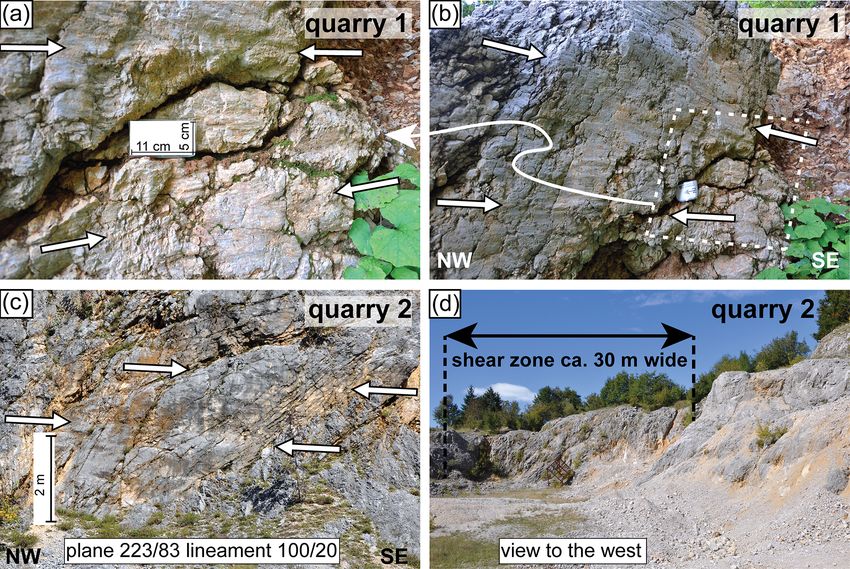
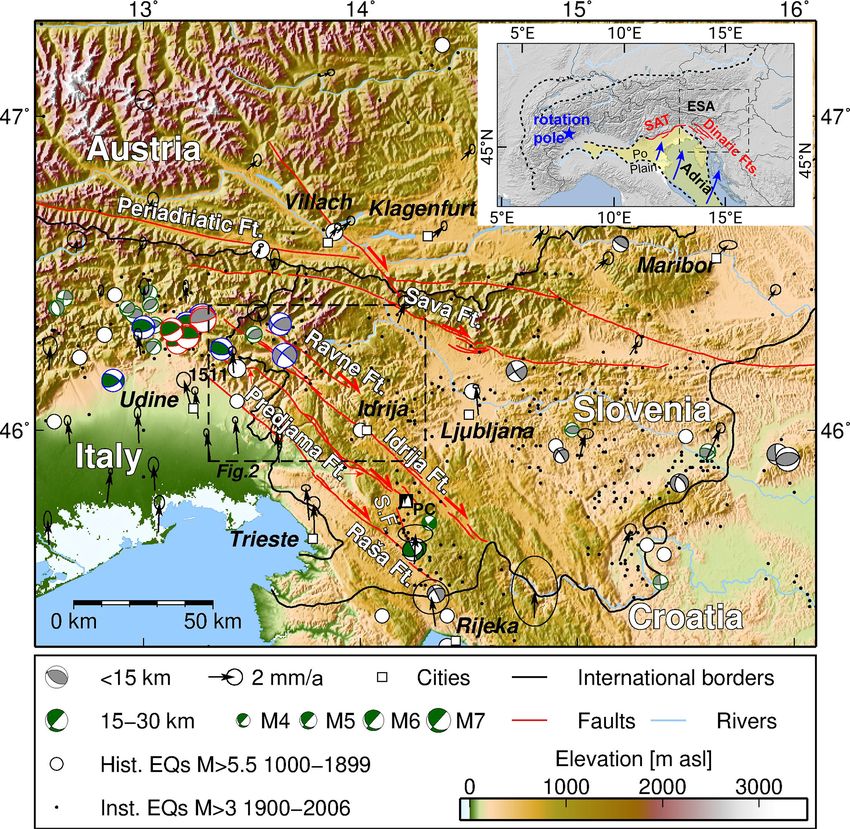
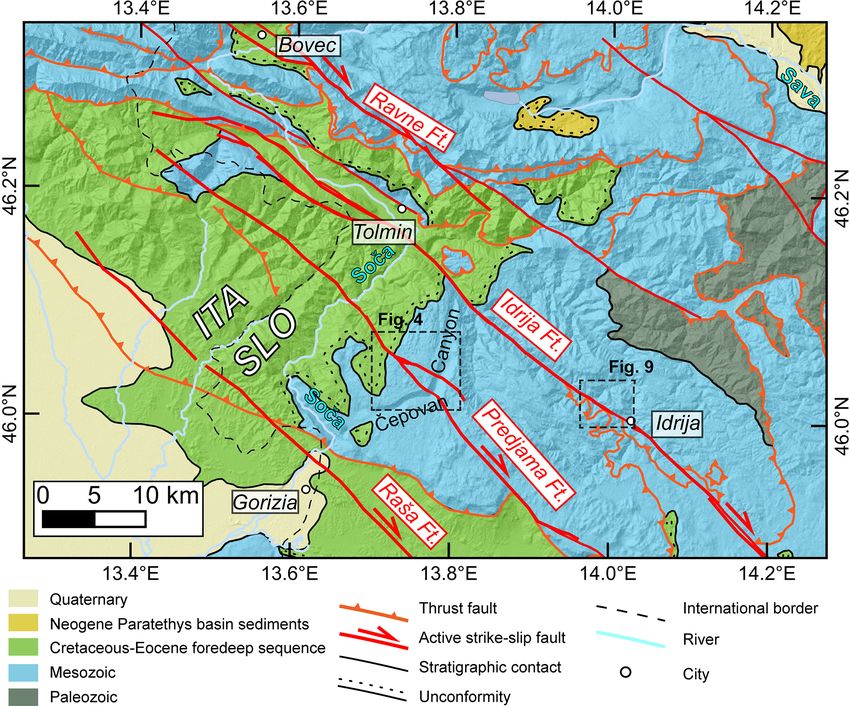
C. Grützner et al.: Holocene surface-rupturing earthquakes on the Dinaric Fault System                                                    2213

Figure 1. The study area in the Alps–Dinarides transition zone. Main faults of interest (red lines) are from Atanackov et al. (2021). Historical
and instrumental seismicity are from the SHEEC database (Stucchi et al., 2013; Grünthal et al., 2013); the 1511 Idrija earthquake is marked
(note that the location is uncertain; the earthquake probably occurred either on the Idrija Fault or on the SW side of the mountain front in
Italy). Beach balls with black outlines are derived from p-wave arrivals (Herak et al., 1995); those with blue outlines are from quakes M > 5
determined from first arrivals used in the Italian RCMT catalogue 1997–2017 (Pondrelli et al., 2002, and updates thereof); red outlines mark
data from teleseismic body waveform inversion 1953–1984 (Anderson and Jackson, 1987); green outlines indicate data from Petersen et
al. (2021) using the AlpArray seismic network. GPS data are from Metois et al. (2015) in a Eurasia-fixed reference frame. S.F.: Selce Fault;
PC: Postojna Cave. Topography is from SRTM1 data. The inset shows the regional tectonic setting with the rotating and northward-moving
Adriatic Plate. Dashed black lines indicate the main deformation fronts (after Bigi et al., 1990; Schmid et al., 2004, 2008; Froitzheim et al.,
1996; Handy et al., 2010; Bousquet et al., 2012). Red lines indicate the south Alpine thrusts in the study area (SAT) and the Dinaric faults.
ESA: eastern Southern Alps.

ternary morphological markers (Moulin et al., 2014, 2016).                all fault kinematics. Around the city of Idrija, the Idrija Fault
Moulin et al. (2016) estimated mean slip rates averaged over              offsets mainly Triassic carbonate units and Permian rocks
the last 255 kyr of 1.15 ± 0.15 mm/a for the Idrija Fault us-             right-laterally.
ing 36 Cl cosmic ray exposure dating. They also reported                     The ∼ 75 km long Predjama Fault is estimated to have
short-term (∼ 15 kyr) slip rates for the Idrija Fault as high             been active since the Middle Pleistocene, based on slip rates
as 3.8 ± 2.0 mm/a. However, recent fault slip rates are mod-              from geomorphic offsets and the total amount of slip (Moulin
elled to only 0.06–0.22 mm/a (Kastelic and Carafa, 2012).                 et al., 2016). It parallels the Idrija Fault but is not as straight
Based on the mean slip rates and the total offset, Moulin                 and shows a prominent bifurcation at the Čepovan Canyon on
et al. (2016) concluded that the strike-slip movement on the              the Trnovski Gozd Plateau. Moulin et al. (2016) estimated
fault probably originated in the early Pliocene. In a meta-               a slip rate of 1.45 ± 0.25 mm/a in the last 255 kyr for the
analysis, Atanackov et al. (2021) report a best estimate fault            Predjama Fault based on offset morphological markers and
slip rate of 1 mm/a. Gosar (2020) used an extensometer to                 36 Cl dating. Atanackov et al. (2021) assigned an average slip

measure ongoing slip on a fault plane in the Učja River val-             rate of 0.7 mm/a in their meta-analysis. In our study area, the
ley, but it remains unclear how this motion relates to the over-          Predjama Fault offsets Mesozoic carbonates by several hun-

https://doi.org/10.5194/se-12-2211-2021                                                                 Solid Earth, 12, 2211–2234, 2021
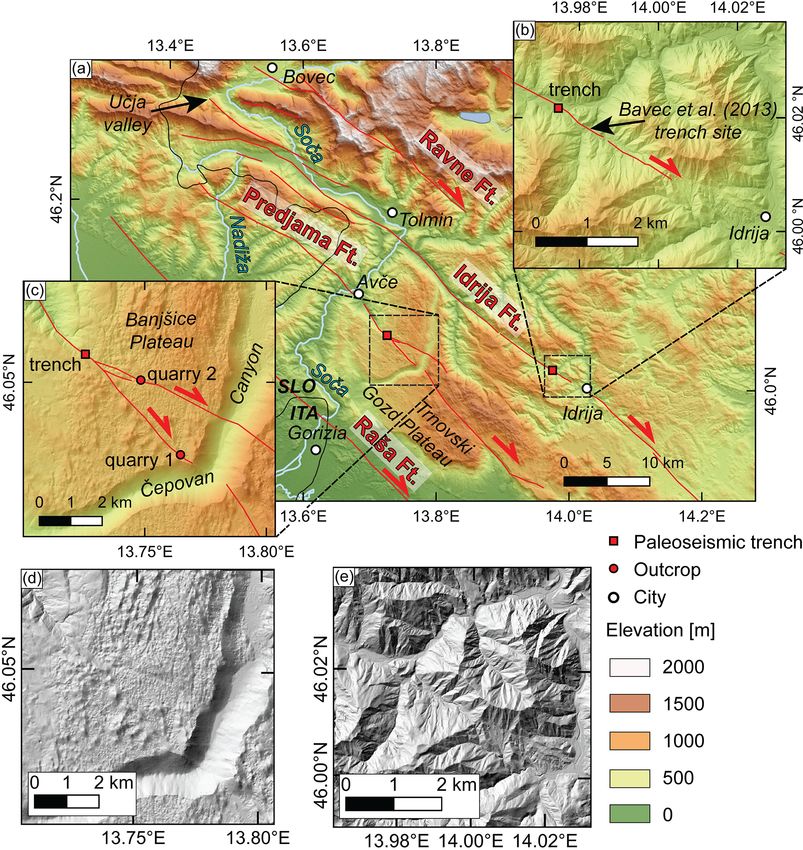
2214                                C. Grützner et al.: Holocene surface-rupturing earthquakes on the Dinaric Fault System

Figure 2. The study sites in NW Slovenia. Faults are from Moulin et al. (2016) and our own mapping. (a) Overview map (DEM from
SRTM1). (b) At the Idrija Fault, the trench site is close to the one of Bavec et al. (2013). (c) At the Predjama Fault, we trenched the single
strand section of the fault. (d) Hillshade of the Predjama Fault trench site. (e) Hillshade of the Idrija Fault trench site. In (b)–(e) the DEM is
based on the 1 m lidar data.

dred metres right-laterally (Fig. 4). At the trench site, coral-           southern Alpine front. Three earthquakes (beach balls with
liferous limestones of Kimmeridgian to Oxfordian age are                   red outlines in Fig. 1) with magnitudes of 6.5, 6.0, and 6.1
juxtaposed with Maastrichtian calcarenites.                                (Aoudia et al., 2000) caused widespread damage. No sur-
   GPS studies show that there is about 2–3 mm/a of N–S                    face rupture occurred, but a few centimetres of uplift were
convergence of Adria vs. Europe at the longitude of the East-              inferred from high-precision levelling and triangulation (e.g.
ern Alps (D’Agostino et al., 2005, 2008; Weber et al., 2010;               Cheloni et al., 2012). Two shallow earthquakes of magni-
Fig. 1) and a anticlockwise rotation of Adria about an Euler               tude Ms 5.7 and Mw 5.2 occurred on the Ravne fault in
pole in the Western Alps of not more than 0.52◦ /Myr (Calais               1998 and 2004, respectively (Bajc et al., 2001; Kastelic et
et al., 2002; Weber et al., 2010). This is in line with slip               al., 2004, 2008; Gosar, 2019a, b). The first event showed
vectors of large earthquakes that occurred around the inter-               right-lateral strike slip on an almost vertical fault, which
nally almost aseismic Adriatic Plate (Anderson and Jackson,                is also supported by structural observations from the field
1987). As of today, the published GPS vectors in Slovenia                  (Kastelic et al., 2008). The second event and its aftershocks
are too coarse to allow for a more detailed analysis of single             also involved oblique right-lateral reverse mechanisms. A
faults.                                                                    number of smaller earthquakes with right-lateral mechanisms
   Large instrumental earthquakes with well-constrained                    occurred in the Slovenia–Croatia border area (Herak et al.,
fault plane solutions in the study area are rare. The 1976                 1995, 2009; Čarman et al., 2011; Jamšek Rupnik et al., 2016;
Friuli sequence occurred on a N-dipping, E–W-trending                      Fig. 1). Vičič et al. (2019) relocated microseismicity data
thrust fault (e.g. Aoudia et al., 2000; Peruzza, 2002) at the              covering 2006–2017. They discovered swarm activity related

Solid Earth, 12, 2211–2234, 2021                                                                 https://doi.org/10.5194/se-12-2211-2021
C. Grützner et al.: Holocene surface-rupturing earthquakes on the Dinaric Fault System                                                  2215

Figure 3. Geological setting of the study sites in NW Slovenia; same extent as Fig. 2. The geology is compiled from the 1 : 250 000 geological
map of Buser (2009) and the 1 : 150 000 geological map of the Friuli Venezia Giulia region (Carulli, 2006).

Figure 4. Geological map of the Predjama Fault trench site. Modified from the 1 : 250 000 geological map of Buser (2009). Same extent as
the inlet in Fig. 2.

to the Raša, Predjama, Idrija, Ravne, and Selce faults down              of the macroseismic effects of the 1895 Mw 6.1 Ljubljana
to 20 km depth on almost vertical fault planes.                          earthquake indicates that it occurred on one of the strike-slip
   Historical seismicity in western Slovenia includes several            faults that belong to the eastern part of Dinaric Fault System
earthquakes exceeding magnitude 5.5 (Ribarič, 1982; Albini              south of Ljubljana (Tiberi et al., 2018). The strongest histori-
et al., 2013, Fig. 1). None of the reported events can be                cal event in western Slovenia was the 1511 Idrija earthquake
conclusively tied to a specific fault, and there is no appar-            (Ribarič, 1979; Fitzko et al., 2005; Cecić, 2011; Camassi et
ent clustering on any of the known active structures. Reli-              al., 2011). It devastated the mining town of Idrija in Slovenia
able historical data are mainly confined to the last 200 years           and caused significant damage in NE Italy (see summary in
(e.g. Herak et al., 2009, 2017, 2018; Cecić, 2015). Modelling           Fitzko et al., 2005). Fitzko et al. (2005) modelled the macro-

https://doi.org/10.5194/se-12-2211-2021                                                               Solid Earth, 12, 2211–2234, 2021
2216                             C. Grützner et al.: Holocene surface-rupturing earthquakes on the Dinaric Fault System

seismic data and found the best fit for a 50 km long rupture          Based on the geophysics results we selected one trench site
of the Idrija Fault, corresponding to a M 6.9 dextral strike-      at the Predjama Fault and one at the Idrija Fault. The trenches
slip earthquake. This is supported by geophysical studies and      were excavated with a backhoe and their walls were cleaned
a paleoseismic trench in the village of Srednja Kanomlja           and straightened. We installed a 1 × 1 m string grid, sketched
near Idrija (Bavec et al., 2012, 2013). However, Falcucci          the walls in 1 : 10 scale, and produced 3D models and or-
et al. (2018) trenched the Colle Villano Thrust in NE Italy        thophotos of the trench walls using the SfM technique. Ra-
and interpreted a post-15th-century surface-rupturing earth-       diocarbon dating was performed by BETA Analytic on char-
quake, which they interpret as the 1511 event. Thus, it is still   coal and bulk organic carbon samples.
not resolved whether the 1511 Idrija earthquake was a single
event or if two earthquakes ruptured two different faults in
close succession.                                                  4     Results

                                                                   4.1     Predjama Fault
3   Methods                                                        4.1.1    Structural data
In order to identify the most promising sites for paleoseis-       In the area of the Čepovan Canyon the Predjama Fault mainly
mological trenching, we first analysed the 1 m digital ele-        runs through Triassic and Jurassic carbonates (Fig. 4). Fur-
vation model (DEM) of Slovenia (Ministry of the Environ-           ther to the northwest of the canyon, Maastrichtian calcaren-
ment and Spatial Planning, Slovenian Environment Agency,           ites are present, which belong to the Cretaceous to Eocene
ARSO, 2019). These data are freely available for the en-           foredeep sequence. The Predjama Fault trench site is located
tire country and were collected using lidar technology (light      on the Banjšice Plateau, northwest of the Čepovan Canyon.
detection and ranging; airborne laser scanning). We manu-          In this area, a single fault trace is clearly visible in the DEM
ally inspected the mapped traces of the Predjama and Idrija        (Fig. 2). At Avče in the Soča Valley to the northwest of
faults and searched for offset geomorphic markers, breaks          our trench site, Moulin et al. (2016) described a prominent
in slope, scarps, and similar indicators of recent tectonics.      change in valley topography caused by the fault (Fig. 2).
Then we identified sites with sediment archives that could         The fault bifurcates just SE of our trench site and the two
have recorded large past earthquakes. For selected sites we        strands offset the cliffs of the Čepovan Canyon (Moulin et
acquired aerial images using a DJI Phantom 4 drone, which          al., 2016). These authors also described a prominent vertical
allowed us to compute high-resolution DEMs with up to 5 cm         offset across the two fault strands. We found that slicken-
resolution using the structure-from-motion technique (SfM).        sides in two quarry outcrops on the two strands (Fig. 2) show
   Geophysical surveys were then used to image the shallow         almost pure right-lateral strike slip on fault planes dipping
subsurface and to precisely map the fault traces. All geo-         steeply to the southwest (Fig. 5a–c). The fault zone is about
physical data are available online (Grützner et al., 2020). We     30 m wide in the second quarry (Fig. 5d). Both quarries ex-
used a ground-penetrating radar (GPR) system from Geo-             hibit Kimmeridgian–Oxfordian coralliferous limestones. To
physical Survey Systems Inc (GSSI) with monostatic 100,            the southeast of the Čepovan Canyon, the two strands of
270, and 400 MHz antennas and a Pulse EKKO Pro Sen-                the Predjama Fault cross the Trnovski Gozd Plateau, but
sors & Software system equipped with bistatic 250 MHz an-          only the southern fault trace continues further to the south-
tennas. All data were processed with the ReflexW software          east (Fig. 2). We chose our trench site partly based on
(Sandmeier Geophysical Research). Processing included fre-         these observations in order to capture the entire slip of the
quency bandpass filtering, background removal, gain adjust-        fault on a single trace and to not miss significant portions
ments, and topographic corrections. The topographic data           due to its branching. About 70 m south of our trench site,
were extracted from the 1 m DEM.                                   Kimmeridgian–Oxfordian coralliferous limestones crop out
   Electric resistivity tomography (ERT) was performed with        in a large road cut, which runs parallel to the fault strike.
a 4point light system (Lippmann Geophysikalische Mess-             These limestones are not intensely fractured and do not ex-
geräte). We used up to 80 electrodes with varying electrode        hibit a fault zone. They only have a thin soil cover. According
spacing for Wenner, Schlumberger, and dipole–dipole arrays,        to the geological maps, Maastrichtian calcarenites are juxta-
depending on target resolution and depth. Data inversion was       posed with the Jurassic limestones by the fault at this site
done with Res2DInv (Geotomo Software) and included man-            (Fig. 4; Buser, 2009). We did not find any outcrop of the cal-
ual de-spiking and topographic corrections.                        carenites near our trench site, but we encountered weathered
   Along several profiles we measured the vertical gradient        and deformed calcarenites in the trench. We will describe
of the geomagnetic field and the total magnetic field strength     these rocks in detail in Sect. 4.1.4. These observations in-
with a proton magnetometer GSM–19T (GEM Systems).                  dicate that the fault must run between the road outcrop and
The system consists of a rover and a base station, which al-       the trench site.
lows correcting the data for diurnal variation. We used 1 m
point spacing along several long transects.

Solid Earth, 12, 2211–2234, 2021                                                      https://doi.org/10.5194/se-12-2211-2021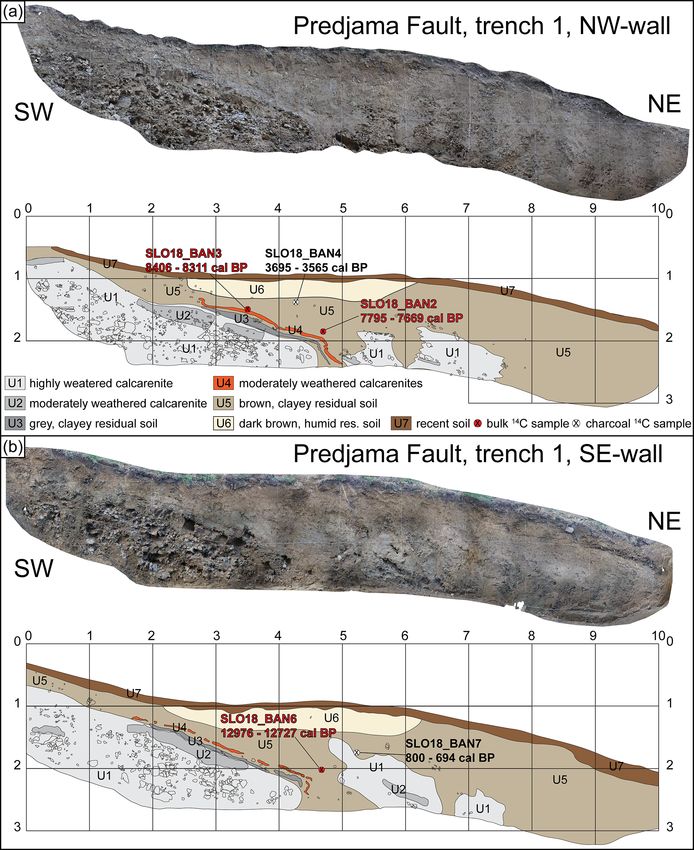
C. Grützner et al.: Holocene surface-rupturing earthquakes on the Dinaric Fault System 2217
Figure 5. Quarries along the Predjama Fault; see Fig. 2 for location. Both quarries exhibit Jurassic coralliferous limestones. (a) At the
southern strand of the fault, quarry 1 (46.0299◦ N, 13.7632◦ E) exhibits E–W lineaments with right-lateral shear sense on a fault plane
dipping steeply to the southwest. (b) Larger section of the striated surface in quarry 1. (c) Large SW-dipping fault planes are present at the
northern fault strand in quarry 2 (46.0506◦ N, 13.7485◦ E). Slickensides show almost horizontal right-lateral motion. (d) In quarry 2, the
shear zone is ca. 30 m wide.
4.1.2 Geomorphological observations action or installations that left their traces in the morphology.
However, Valjavec et al. (2018) found that post-war land-
scape modifications have erased many traces of World War I
At the trench site we observed a break in slope on a gen- in Slovenia. We also inspected the lidar data and the drone
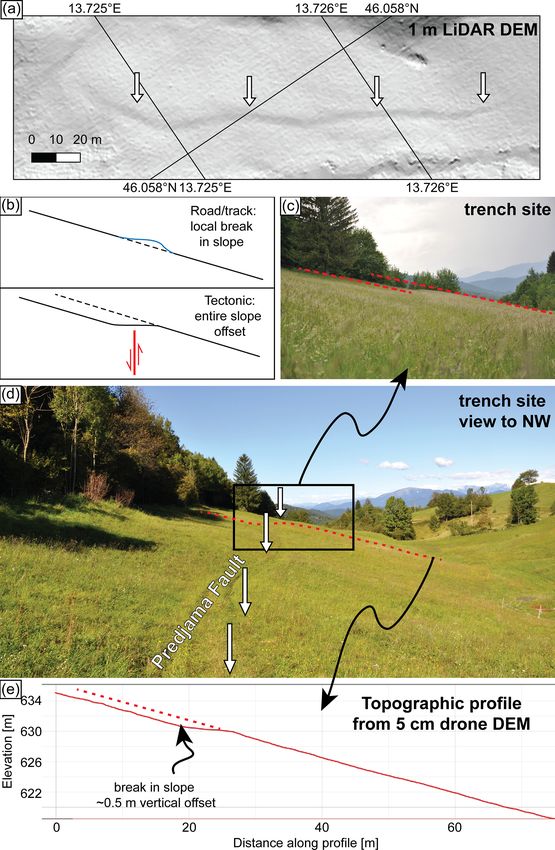
tly NE-dipping meadow (Fig. 6). The break in slope is de- DEMs for evidence of landsliding or soil creep but did not
tectable for ∼ 200 m (Fig. 6a). To the northwest and to the find any such feature. The straight trace of the scarp, the sys-
southeast of our trench site, the scarp disappears in the steep tematic offset of the entire meadow, the lack of evidence for
and forested terrain. Topographic profiles extracted from the anthropogenic modification, and the fact that the scarp co-
1 m lidar DEM and a 5 cm drone DEM reveal a systematic incides with the mapped fault trace led us to interpret it as
vertical offset of ∼ 0.5 m on an uphill-facing scarp. In some the surface expression of the Predjama Fault and to focus our
but not all places the scarp coincides with tracks used by the geophysical prospection on this site.
local farmers. Following the argument of Copley et al. (2018)
the break in slope is unlikely to be caused by a dirt road 4.1.3 Geophysics survey
(Fig. 6b). If the break in slope was solely caused by a dirt
road, the break in slope would be local only. However, we We used GPR, ERT, and magnetic measurements on parallel
find a systematic offset of the entire slope. Slovenian cadas- profiles perpendicular to the scarp in order to check the sub-
tre data from the early 19th century show no road, property surface conditions and to select the most promising trench
boundary, or any other artificial feature at the location of the site (Fig. 7). Georadar did not provide good data quality,
scarp. The area was the scene of the 12th Battle of the Isonzo which during trenching turned out to be due to highly con-
in 1917. Here, the Italian defence lines were running ∼ N– ductive clayey sediments present near the surface. The ge-
S just before the attack of the Austria–Hungarian armies omagnetic data showed neither indications of the fault nor
on 24 October (Glaise von Horstenau, 1932). The Regional of metal objects in the ground, which indicates the lack of
Archives Nova Gorica (Pokrajinski arhiv v Novi Gorici, potentially dangerous war remains.
https://www.pa-ng.si/, last access: 8 November 2018) hold The dipole–dipole ERT data with 1 m electrode spacing
no aerial photographs from World War I from our trenching show mainly resistivities of less than 70 m throughout all
area, but photos from nearby places on the Banjšice Plateau profiles (Fig. 7). We interpret these low values as water-
show intense modification of the surface by military trenches saturated, mainly clayey sediments. North of the break in
and bomb craters. We carefully inspected the available high- slope we found a ∼ 1 m thick layer with higher resistivities
resolution DEMs but did not find any indications of military right below the surface in all profiles. Profiles 1–5 show val-
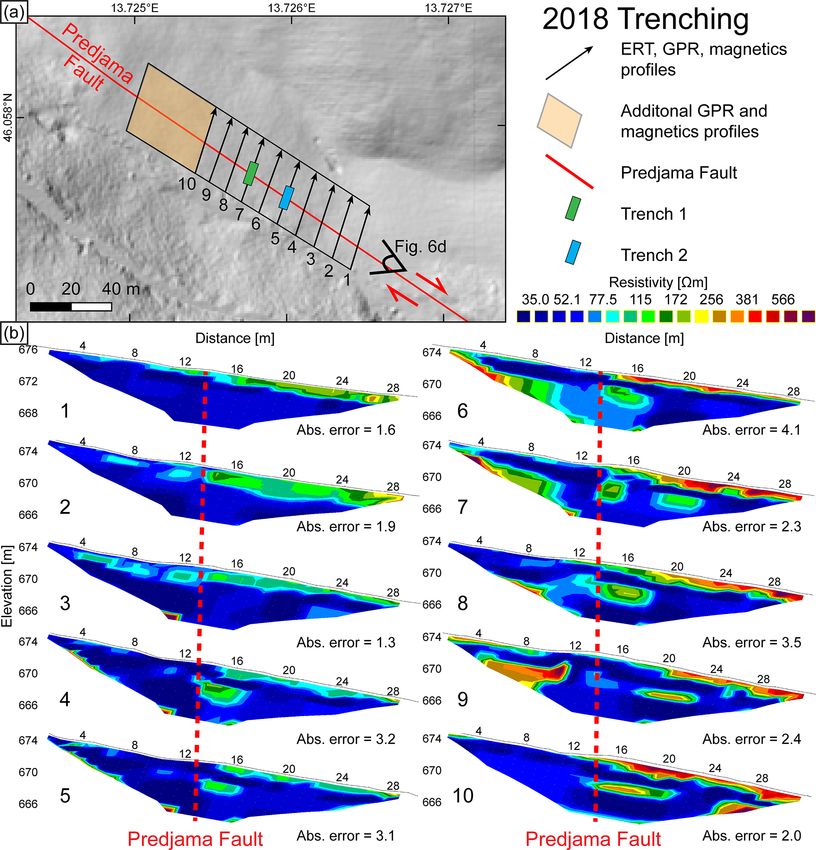
https://doi.org/10.5194/se-12-2211-2021 Solid Earth, 12, 2211–2234, 2021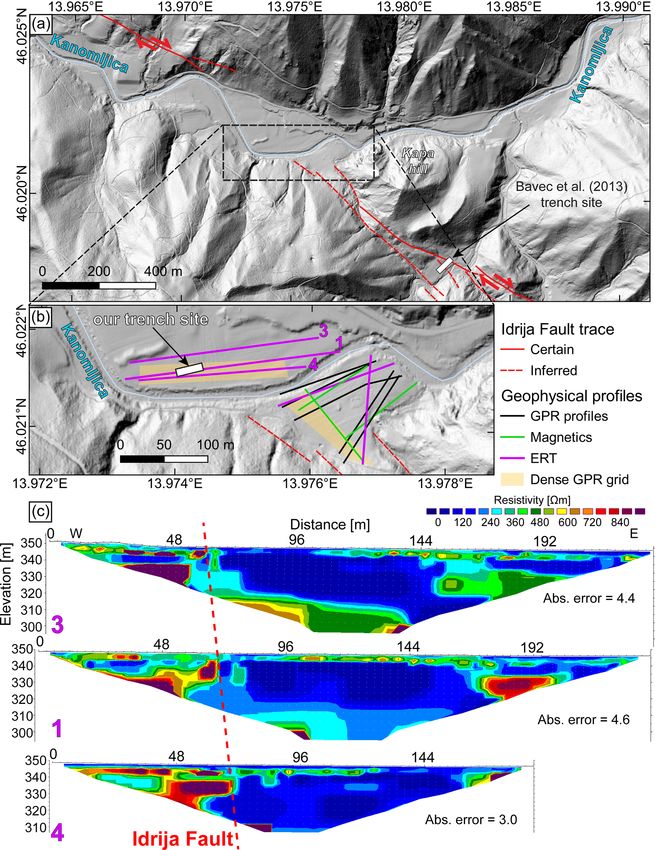
2218                               C. Grützner et al.: Holocene surface-rupturing earthquakes on the Dinaric Fault System

                                                                       plement), we interpret this anomaly as calcarenites and lime-
                                                                       stones that were brought closer to the surface by the Pred-
                                                                       jama Fault. High resistivities were also encountered in pro-
                                                                       files 6–9 at ∼ 3 m depth and below in the southernmost parts
                                                                       of the survey, which presumably correspond to bedrock (see
                                                                       trench logs in the next section). Paleoseismic trenching took
                                                                       place after the geophysical survey and helped to interpret the
                                                                       resistivity pattern. However, prior to trenching the significant
                                                                       variations in resistivity below the break in slope led us to con-
                                                                       clude that we found the trace of the fault and that the site is
                                                                       suitable for further investigation. The break in slope does not
                                                                       always perfectly align with the resistivity contrasts at depth
                                                                       (Fig. 7). It is located a few metres to the north of the scarp
                                                                       in some (e.g. profile 8) but not all profiles (e.g. profile 10).
                                                                       Given that the Predjama Fault forms a ∼ 30 m wide fault zone
                                                                       in fault outcrops nearby (Fig. 5d), it is not surprising that
                                                                       the geophysical anomalies do not always perfectly align with
                                                                       the scarp. The resistivity contrast is not only visible in single
                                                                       profiles, but it is a consistent feature that can be traced for at
                                                                       least 60 m in consecutive profiles. The close spatial relation
                                                                       between the scarp and the geophysical anomalies indicates
                                                                       that we rightly located the Predjama Fault. We chose the lo-
                                                                       cation of profiles 5 and 7 to open two trenches (Figs. 7, 8;
                                                                       Files S1–S4).

                                                                       4.1.4   Paleoseismic trenching

                                                                       Trench 1 was 10 m long and on average 1.5 m deep (Fig. 8).
                                                                       Deeper excavation was prohibited by the shallow groundwa-
                                                                       ter level. We distinguished seven units in both trench walls,
                                                                       most of which represent a rock weathering profile. Since both
                                                                       trench walls show comparable features, we use the north-
Figure 6. Morphology of the Predjama Fault at our trench site.         western trench wall for the detailed description in the fol-
(a) An uphill-facing break in slope can be traced for ∼ 200 m (white   lowing. We use the terms and weathering grades defined by
arrows; 1 m DEM lidar hillshade is illuminated from the northeast      ISRM (1981).
in this figure only). (b) Conceptual sketch illustrating the differ-      Unit U1 at the base of the trench consists of highly weath-
ence between a tectonic scarp and a local break in slope due to        ered calcarenites in a clayey matrix (grade IV). The rocks
road/track construction (Copley et al., 2018). (c) A break in slope    are intensely fractured; coherent bedding is only occasion-
offsets the trench site. The red dashed lines show ∼ 0.5 m vertical    ally visible. While the U1 mainly consist of large clasts in the
offset. (d) NW view of the trench site (also see Fig. 6 for loca-
                                                                       first 4 m of the trench, the weathering products dominate the
tion). The red dashed line marks the location of the topographic
                                                                       upper parts of the unit between 5 and 8 m. There is no sharp
profile in (e). Trench 1 was opened across this profile. (e) Topo-
graphic profile from a drone DEM with 5 cm resolution, illustrat-      boundary between these two zones in the central part of the
ing the systematic offset of the slope and the uphill-facing scarp.    trench. However, the large amounts of fractured calcarenites
This DEM is available at http://www.opentopography.org (last ac-       there and the relationship to unit U2 require mapping it as
cess: 26 March 2021).                                                  U1. Occasionally, large and coherent but intensely fractured
                                                                       blocks of calcarenites are also present in the upper parts of
                                                                       U1. Because of their distinct appearance we mapped them as
ues of 100–200 m for this layer; profiles 6–10 show val-              unit U2, representing moderately weathered rocks of grade
ues of up to 400 m. These values likely correspond to a               III. Both units show a dip towards the northeast, parallel to
drier topsoil in the northern part of the profiles. This may           the slope. On top of U1 and U2 sits a thin layer of compact
be due to the greater thickness of clayey units in the north-          grey clay: unit U3. This unit is a residual soil of grade VI. U3
ern parts, as we will see in the next section. In profiles 4–10        is overlain by a thin red ribbon of sandy clay (unit U4) that
we observe another anomaly with increased resistivities at             mainly consists of moderately weathered calcarenites (grade
about 4 m depth just north of the break in slope. Based on             III). Both U3 and U4 dip to the northeast. We interpret Units
the findings in the trenches (Fig. 8, File S1–S4 in the Sup-           U1–U4 as a sequence of intensely weathered bedrock.

Solid Earth, 12, 2211–2234, 2021                                                           https://doi.org/10.5194/se-12-2211-2021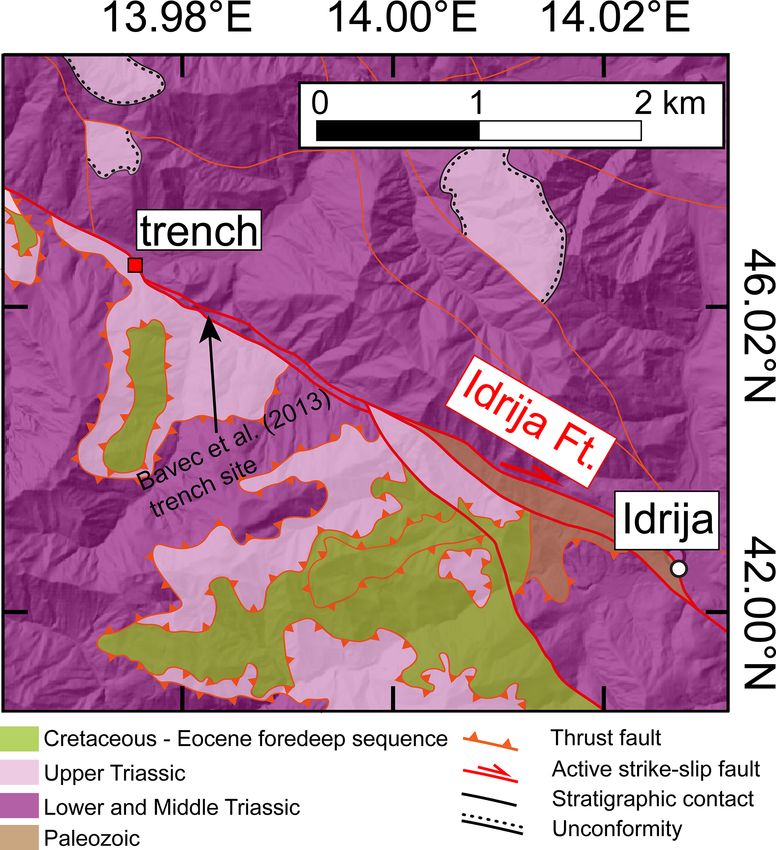
C. Grützner et al.: Holocene surface-rupturing earthquakes on the Dinaric Fault System                                                2219

Figure 7. Map of the trench site at the Predjama Fault and ERT data. (a) Black arrows mark the location of geophysical profiles (ERT, GPR,
magnetics). Additional GPR and magnetics data were collected further to the northwest. Seven iterations were used to invert the dipole–
dipole ERT data. The hillshade is based on the 1 m lidar DEM. (b) The ERT data show abrupt changes in resistivity below the break in slope,
interpreted as the Predjama Fault trace (red dashed line). The absolute error describes the misfit between the data and the best-fit inverse
model.

   Most of the upper part of the trench is formed by a residual         tance from the southern end of the trench. Unit U1 can be
soil (grade VI) that forms massive brown clays (unit U5).               easily identified in the first 5 m of the trench. Around 5 m
The contact between U4 and U5 is sharp. Where U5 is in                  distance from the southern end of the trench, this unit bends
contact with U4, it contains small amounts of sand and fine             down together with the overlying units U3 and U4. In a 40 cm
gravels as well as fragments of charcoals. Small (fine gravel)          wide gap unit U5 reaches the bottom of the trench. Unit U1
calcarenite and limestone clasts are present throughout U5 in           then occurs again between 5–6 m and between 6–8 m with
small amounts. Around 5 m in the trench, U5 is in contact               up to 0.6 m thickness. It becomes gradually more weathered
with U1. Here the units U3 and U4 appear as lenses within               upwards and the contact with unit U5 is not sharp. The larger
U5, although they overlay U1 and U2 in the southwestern                 blocks of intact calcarenites that make up unit U2 are present
part of the trench. The pale, bleached clayey unit U6 with up           throughout the trench and show no deformation.
to 30 cm thickness occurs just beneath the recent soil (unit               Unit U3 is only visible in the southern section of the trench
U7). We note that unit U6 is not a sedimentary body, but a              for about 2 m. It has a more constant thickness of 10 cm in
residual soil. The distinct pale appearance is likely just due          the SE wall of the trench and varies between 10 and 20 cm
to a modification of U5 by increased water content, or it may           thickness in the NW trench wall. While this unit parallels the
result from compaction due to the occasional use of the track           top of unit U1 for about 2 m from its southern end, it then
by the farmers.                                                         bends down and dips steeply towards the northeast beneath
   No sharp fault trace was found in the trench. Instead, we            the break in slope. Here we observe small folds in the tip of
observe a zone of localised deformation at around 4–5 m dis-            the layer.

https://doi.org/10.5194/se-12-2211-2021                                                              Solid Earth, 12, 2211–2234, 2021
2220                               C. Grützner et al.: Holocene surface-rupturing earthquakes on the Dinaric Fault System

Figure 8. Paleoseismic trench 1 across the Predjama Fault on the Banjšice Plateau. (a) NW wall of the trench. The fault crosses the trench at
∼ 5 m distance. Note the folded units U3 and U4. (b) SE wall of the trench. The fault crosses the trench between 4 m and 5 m distance.

   A similar feature is observed in unit U4, which also paral-           this scenario are the lack of a sharp fault zone in the trench
lels U1 but then bends downward and becomes folded. Here                 and the fact that vertical motion is not expected on the strike-
we identified small horizontal faults with < 5 cm offset cut-            slip Predjama Fault. Arguments in favour of a tectonic pro-
ting the layer. The tip of the unit flattens again to almost the         cess are (i) the lack of evidence for slope-parallel motion in
same dip angle as its southern part, with a vertical offset of           the trench, such as shallow sliding planes, (ii) that the ver-
30 cm. The few coarser grains at the contact between U4 and              tical separation of units U1 and U2 is not easily explained
U5 show that the lowermost part of U5 also bends down par-               by gravitational processes only because the downslope side
allel to U4.                                                             is uplifted, and (iii) the absence of evidence for run-off pro-
   Two scenarios could explain the observations in this                  cesses or slope-parallel motion in the two high-quality DEMs
trench: non-tectonic or tectonic processes. In the non-                  (1 m lidar and drone DEM). The slope is very smooth apart
tectonic scenario, the shape of U3 and U4 as well as the verti-          from the scarp; there are no landslide scars or “wrinkles” that
cal offset in units U1 and U2 could be due to shallow-seated,            may point to the toes of slides, etc. Since at least the upper
slope-parallel motion, combined with phases of pedogenic                 units in the trench are of Holocene age as we will show in the
development above the weathered bedrock units and perhaps                following, we might expect to see such features in the mor-
additional oblique run-off processes. Arguments in favour of             phology. Furthermore, although prevailing vertical motion is

Solid Earth, 12, 2211–2234, 2021                                                              https://doi.org/10.5194/se-12-2211-2021
C. Grützner et al.: Holocene surface-rupturing earthquakes on the Dinaric Fault System                                            2221

not expected, a vertical component of slip can be due to an
irregular, bending fault trace.
   The bending, the folding, and the faulting observed in
the trench could be interpreted as tectonically induced (sce-
nario 2). This interpretation is supported by the observation
that U3 and U4 are intensely deformed in a relatively nar-
row zone, across which a vertical separation of U1 and U2 is
observed. This zone at around 5 m would then represent the
fault. This view is strengthened by the geomorphological and
geophysical observations.
   A sample of organic material from the contact between
U4 and U5, sample SLO18_BAN3, gave an age of 8406–
8311 cal BP (Table 1). Note that we sampled a fragment of
charcoal, but during sample preparation in the lab it turned
out to be too small, but it was possible to date the organic
sediment around it.
   We dated unit U5 with a bulk sample (SLO18_BAN2)
from 10 cm above U4. This sample gave an age of 7795–
7669 cal BP. A charcoal sample (SLO18_BAN4) from right
below U6 provided an age of 3695–3565 cal BP. All these
ages are in stratigraphic order. On the opposite trench wall,
we also dated U5 with a bulk sample (SLO18_BAN6) that re-
turned an age of 12 976–12 727 cal BP and a stratigraphically
                                                                   Figure 9. Geological map of the trench site at the Idrija Fault. Sim-
higher charcoal sample (SLO18_BAN7) that showed an age
                                                                   plified from Mlakar and Čar (2010). Same extent as the inset in
of 800–694 cal BP. These two samples are significantly older       Fig. 2.
and younger than those of U5 on the NW trench wall, respec-
tively.
   Unit U6 can only be observed for around 4 m on ei-              Cunningham et al. (2006) noted that several drainage anoma-
ther trench wall. It probably represents compacted residual        lies around the Kapa hill just to the southwest of our trench
soil of U5 resulting from the occasional use of the break          site point to late Quaternary or even Holocene fault motion
in slope as a dirt road. Its age is constrained by samples         (Figs. 9, 10). Bavec et al. (2012, 2013) chose the river valley
SLO18_BAN4 and SLO18_BAN7 to post-800 cal BP. The                  at the SW foot of the Kapa hill for a geophysics study and for
full high-resolution trench orthophotos are presented in the       a paleoseismological trench. Moulin et al. (2014) analysed
Supplement.                                                        the geomorphology in detail and reported between 340 and
   Trench 2 exhibited a different stratigraphy. Here, we ob-       380 m of right-lateral offset based on the correlation of the
served massive brown and grey, clayish residual soils beneath      modern Kanomljica river and abandoned valleys. The pre-
the modern soil but no calcarenites. Instead, the base of the      cise trace of the Idrija Fault in the vicinity of our trench site
trench at ∼ 2 m depth was made up in its southern part by          is subject to some debate (Fig. 10; also see Moulin et al.,
limestone clasts in a brown clayey matrix, probably repre-         2014). The NW flank of the Kapa hill exhibits a wide shear
senting highly weathered bedrock (grade IV). Attempts to           zone with (ultra-)cataclastic rocks. This wide shear zone is in
excavate deeper than 2 m were prohibited by the groundwa-          line with the observation that the Idrija Fault has a large cu-
ter level. A possible fault zone in the centre of the trench is    mulative offset (Čar, 2010; Placer et al., 2010). The trace of
marked by a colour change in the clayey material and the ter-      the fault in the wide valley of the Kanomljica is obscured by
mination of the limestone clast layer. However, the uniform        flat-lying fluvial sediments. Outcrops on the north side of the
clays and the lack of clearly deformed markers led us to not       valley show that at least one fault strand clearly runs along
speculate about evidence for faulting in the trench. A high-       the base of the hills (Moulin et al., 2014).
resolution orthophoto of both trench walls is provided in the
Supplement.                                                        4.2.1   Geophysics survey

4.2   Idrija Fault                                                 We concentrated our geophysical investigations on the flat
                                                                   area of the Kanomljica valley because we expected to find
The Idrija Fault trench site is located 4.5 km NW of the town      deformed sediments if the fault ruptured the surface in the
of Idrija, in the valley of the Kanomljica River (Fig. 2). Here,   late Quaternary (Fig. 10). Additional surveys were performed
the fault juxtaposes Upper Triassic with Lower–Middle Tri-         on the southern bank of the Kanomljica. The geomagnetics
assic rocks, mainly dolomites (Fig. 9; Mlakar and Čar, 2010).     survey was not successful. Not only did the data quality suf-

https://doi.org/10.5194/se-12-2211-2021                                                         Solid Earth, 12, 2211–2234, 2021
2222 C. Grützner et al.: Holocene surface-rupturing earthquakes on the Dinaric Fault System Figure 10. Map of the trench site at the Idrija Fault and selected ERT data. (a) Setting of the trench site and mapped traces of the Idrija Fault after Cunningham et al. (2006), Bavec et al. (2013), and Moulin et al. (2014). The precise fault trace is unknown in the flood plain of the Kanomljica River. (b) Detailed view of the location of all geophysical profiles used for trench site selection. (c) ERT profiles 1, 3, and 4, which were crucial for trench site location. Red dashed line indicates the interpreted fault trace. All data show dipole–dipole configuration with 10 iterations in the inversion. The absolute error describes the misfit between the data and the best-fit inverse model. In (a) and (b) the hillshade is based on the 1 m lidar DEM. fer from the presence of power lines and other anthropogenic The ERT profiles on the flat surface north of the disturbances, but also in areas not affected by these effects Kanomljica showed the clearest indication of the location we could not identify a signal pointing to a change in the of the Idrija Fault. For these profiles we used 3 m electrode subsurface structure. Georadar data suffered partly from low spacing in order to reach great depths (Fig. 10). The up- penetration depths owing to clay-rich sediments and a low permost part of the subsurface is made up of a medium- groundwater table. Although some information on the geom- resistivity layer (200–700 m) of about 3–5 m thickness, etry of the fluvial units could be extracted, we did not see which likely corresponds to the sediment fill of the valley. In any clear evidence for faulting that would have allowed for the trenches that we opened after the geophysics campaign picking a promising trench site. we found that the sediments are dominantly coarse fluvial Solid Earth, 12, 2211–2234, 2021 https://doi.org/10.5194/se-12-2211-2021
C. Grützner et al.: Holocene surface-rupturing earthquakes on the Dinaric Fault System                                         2223

gravels and that the groundwater table is below 2 m depth.              We observed 11 different units in the trench. Unit U1
This explains the observed range of resistivities.                   consists of clast-supported, fine-coarse fluvial gravels in a
   Below the medium-resistivity layer, the central parts of          brown clayey matrix. This unit is present throughout the en-
the profiles are characterised by an up to 30 m thick low-           tire trench. Unit U2 is made up of mostly medium gravels
resistivity unit (< 200 m). The western parts of the profiles,      in a bright red, clayey matrix. This layer is situated within
however, show high-resistivity units of more than 700 m.            unit U1 and only visible in the northern wall. Fine to coarse
The contact between the two is sharp and mostly vertical. In         gravels in a light red clay matrix (unit U3) can be found as
profiles 1 and 4, the contact is at 69 m profile distance. In pro-   pockets in both trench walls within U1. We cannot rule out
file 3, the contact is at 60 m. We interpret the low-resistivity     that U2 and U3 are the same unit, since it is only their colour
unit as the crushed bedrock of the wide fault zone and the           that is different. At the base of the channel, we identified U4,
high resistivities as the intact, non-faulted bedrock. This is       consisting of sandy silt with yellow flakes. This unit is in
supported by our field observations of cataclastic rocks along       vertical contact with massive grey clays (unit U5) and over-
the mapped and inferred fault trace. Furthermore, Bavec et           lain by yellowish clayey gravels (unit U6). In the southern
al. (2012) found the same pattern in their geoelectric profiles      trench wall, U4 partly overlies U5, which may indicate that
SE of Kapa hill. Their trench (Bavec et al., 2013) confirmed         it has eroded into the latter. Only in the northern trench wall
the low resistivity of the faulted bedrock. These authors also       is a small pocket of grey clayey sands (unit U7) present at the
found the active fault strand at the contact between the units       contact between U1 and U8/U10. In the southern trench wall,
of high and low resistivities. Consequently, we interpret the        silty–sandy, dark-grey unit U9 cuts through units U5 and U8.
contact between the high-and low-resistivity units as the lo-        Both units U4 and U6 terminate at U9. Unit U9 is overlain by
cation of the fault. This contact lies in the projection of the      the darkest parts of U10, to which there is no sharp boundary.
inferred SW fault strand of Bavec et al. (2012). In the eastern         Unit U10 consist of gravels in a matrix of grey clays. This
parts of the three profiles presented in Fig. 6, sharp contacts      unit overlies U7 in the northern trench wall and units U5 and
between the low-resistivity units in the centre and medium           U6 in the southern trench wall. The upper part of the chan-
to high resistivities (300–800 m) further east can be seen.         nels is made up by unit U10. The lowest part of U10 is dark
These zones are located at 170, 150, and 160 m distance in           and rich in organics and made up of sandy clays. It changes
profiles 1, 3, and 4, respectively. The contacts do not align        upwards into massive grey and brownish clays with a minor
as well as the ones in the western part of our survey area,          gravel component. It is not possible to draw a sharp bound-
and they are located approximately in the projection of the          ary between the dark, sandy clays and the greyish–brownish
NE fault trace (Fig. 10; Bavec et al., 2012). A power line           clays with gravel because the transition is gradual. However,
was present above these parts of the profiles, which may have        these deposits must be mapped as one single unit because
distorted the measurements here. However, we interpret this          they clearly cover all the other fine and coarse units in the
pattern as the NE edge of the inner fault zone following the         trench and because the internal changes are so gradual. We
reasoning above.                                                     found white speckles at the base of U10 between 7 and 9 m
                                                                     distance (N wall) and between 11 and 12 m distance in the
                                                                     southern trench wall. Unit U10 is overlain by the recent soil
4.2.2   Paleoseismic trenching
                                                                     (unit U11).
                                                                        We interpret most of the units in the northern trench as
Based on the ERT data we decided to open a trench across             undisturbed fluvial sediments. Between 8 and 9 m distance,
the sharp contact between the high-resistivity units and the         however, we observe several features that point to tecton-
low-resistivity units in the western part of the survey area         ically induced deformation. Units U4 and U6 show verti-
(Fig. 10). The trench was 20 m long, 2 m deep, 2 m wide, and         cal terminations at their eastern ends, where they are in
placed on the track of profile 1. We did not dig any deeper          contact with U5. A charcoal sample dates U5 to 2140–
because the nearby Kanomljica stream incised about 2 m into          1987 cal BP. The base of U5 fills the space between larger
the flat valley bottom, and the groundwater table was located        blocks (Fig. 11c). It remains unclear whether this resem-
just beneath the trench floor. In the following we only de-          bles a fissure fill because of the lack of horizontally layered,
scribe the central part of the trench where we encountered           fine-grained material here. Two bulk sediment samples from
traces of recent deformation. The full high-resolution trench        these lowest parts of U5 returned radiocarbon ages of 2645–
orthophotos are presented in the Supplement.                         2489 and 1528–1376 cal BP, respectively. Next to the base
   In general, the trench is characterised by fine to coarse         of U5 we encountered vertically aligned pebbles (Fig. 11c).
gravel deposits. In the centre of the trench, a channel exhibits     This is the only occasion of aligned pebbles in the entire
clayey to sandy units. In the north wall, the channel can be         trench. Right above these pebbles sits a large (∼ 40 cm di-
seen between 5.5 and 12.5 m distance, reaching down to the           ameter) clast that is intensely fractured but not offset. The
trench floor (Fig. 11a). In the southern trench wall, the chan-      cracks have no preferred orientation, and their surfaces show
nel is observed between 4 and 14 m distance at up to 1 m             slightly different colours than those of fresh hand specimens
depth (Fig. 11b).                                                    that we hammered off the clast. The fractures were clearly

https://doi.org/10.5194/se-12-2211-2021                                                         Solid Earth, 12, 2211–2234, 2021
2224 C. Grützner et al.: Holocene surface-rupturing earthquakes on the Dinaric Fault System
not caused by the excavator. This is the only fractured clast 5 Discussion
that we have found in the trench. In the northern wall, U5 is
overlain by U10, which was dated to 2307–2056 and 492– 5.1 Earthquakes on the Predjama Fault
315 cal BP by two charcoal fragments. Unit U8 resembles a
pocket of coarse material emplaced into the clays of U10. We Paleoseismological trenching at the Predjama Fault provided
did not encounter any faults that bound U8, but we note its evidence that could be interpreted as Holocene activity be-
suspicious position above the aligned pebbles and the frac- cause the weathered units are deformed. Thus, the deforma-
tured clast. If units U2 and U3 were indeed the same unit tion can be interpreted as post-dating the formation of the
despite their different colours (bright red vs. light red), there base of U5. Alternatively, slope processes and pedogenesis
might be a vertical step of ca. 30 cm across the fault zone. could have led to the features observed in the trench. Com-
However, we note that unit U3 also bends significantly with- bined with geomorphological data and geophysical prospec-
out clear folding. tion two main observations support the view in favour of a
In the southern trench wall, only a narrow zone shows ev- recent surface-rupturing seismic event: (i) the uphill-facing
idence for tectonic deformation between 11 and 12 m dis- scarp and (ii) the folded and faulted units in the trench. The
tance. Similar to the north wall, we observe vertical termi- detectable break in slope is rather short (∼ 200 m), but it
nations of units U4 and U6. The most striking feature is the perfectly matches the mapped fault trace, it is located right
organic-rich, dark-grey U9. This unit is funnel-shaped and above the geophysical evidence of faulting, and an anthro-
extends from the base of U10 about 1 m downwards. It is in pogenic origin is as unlikely as a mass movement (cf. Copley
vertical contact with U4 and U6, and it cuts through U5 and et al., 2018). Notably, the break in slope was used as a local
U8 (Fig. 11d). We interpret U9 as a fissure fill, with the fill- track for agricultural purpose, but we can exclude the possi-
ing material sourced from the base of U10. Unit U10 is the bility that it solely represents a road (Fig. 6b, c, e). The bend
only one in the trench that also yields this dark layer rich in in the trace of the Predjama Fault at our trench site (Fig. 2,
organics. This indicates that the fissure was filled from above inset) leads to a locally transpressive regime, which allows
and later became covered by the thick clays that make up the for significant vertical offsets. Moulin et al. (2016) also de-
top part of unit U10. scribe the long-term vertical offset along the Predjama Fault
If the fissure were instead a sand dyke that propagated up- between our trench site and the Čepovan Canyon. However,
wards due to seismic shaking as opposed to surface rupture, our structural data, long-term offsets at the edge of the Čepo-
we should see the source material of the dark fissure fill at its van Canyon (Moulin et al., 2016), and vertically aligned mi-
base, which is not the case. Furthermore, there is no evidence croseismicity below the fault trace (Vičič et al., 2019) show
for liquefaction or soft sediment deformation structures else- that the fault is predominantly, albeit not purely, strike slip.
where in the trench. These features may include flame struc- In addition to the morphological evidence, the trench
tures, warped layers, mushroom structures, pseudonodules, (Fig. 8) exhibits features that could be interpreted as fault-
broken layers, ball-and-pillow structures, etc., but none of perpendicular shortening. In the northern trench wall, we ob-
these were observed here (also see the high-resolution photo- serve a vertical step of ∼ 0.4 m in unit U1 between 4 and
mosaics in the Supplement). For liquefaction to occur, a se- 5.5 m distance (north side up, same as the scarp). In the
quence of liquefiable, water-saturated layers is needed, but in southern trench wall, this step is harder to measure because
our case the base of the trench exhibited coarse high-energy unit U1 does not have a sharp boundary. The offset of unit U2
deposits. Our geophysics data hint at a rather thin sediment is the better marker here and indicates ∼ 0.6 m of vertical off-
layer above fractured bedrock only. A similar observation set between 4 and 6 m distance. In such a setting one might
was reported by Bavec et al. (2013) from their nearby trench expect a drag fold geometry. In our trench we observe the op-
site. We excavated the fissure U9 further into the trench wall posite. This could either indicate that non-tectonic processes
to check if it may be due to a large root, but we found that were involved in the deformation or that an unknown amount
the feature is elongated and not round as would be typical of lateral motion has contributed to the observed geometry.
for roots. A bulk sediment sample from the fissure fill re- In the first case, it is hard to imagine a process that would
turned a radiocarbon age of 2378–2306 cal BP. A charcoal lead to such a configuration and also result in a ∼ 200 m long
fragment from U5 was dated to 2067–1924 cal BP. At the scarp. Lateral motion, however, can juxtapose units that were
base of U10 we collected a charcoal that gave an age of originally located at different depths and lead to complicated
2440–2315 cal BP. deformation patterns as a result of transpression. Our data do
not allow further speculation on the cause. The location of
the deformation zone fits in well with the presence of U6 on
top of the deformation zone. Unit U6 is most likely nothing
but a compacted and more humid U5 due to the occasional
use of the break in slope as a dirt road; the local farmers
might have taken advantage of the morphological scarp. The
offsets also fit in with the height of the scarp as seen in the
Solid Earth, 12, 2211–2234, 2021 https://doi.org/10.5194/se-12-2211-2021C. Grützner et al.: Holocene surface-rupturing earthquakes on the Dinaric Fault System 2225 Figure 11. Results from the Idrija Fault trench at Srednja Kanomlja. (a) Orthophoto and trench log of the northern trench wall. (b) Orthophoto and trench log of the southern trench wall. Note that the photo and log have been flipped for easier comparison with the northern wall. (c) Close-up photo of the fault zone in the northern trench wall. Note the vertically terminated layers and the aligned pebbles below the massive, fractured clast. (d) Close-up photo of the fault zone and the fissure fill observed in the southern trench wall. morphology, which speaks against non-tectonic processes as logical observation that would support this view. The geo- the cause. Both trench walls show folding, minor-scale fault- physics show that there is a fault zone beneath the trench ing, and a downward bend of the prominent reddish marker site, although this does not necessarily mean that it caused horizon, unit U4. the deformation in the trench. Although we cannot pin down The observed deformation could also be explained by the exact fault trace, the sharp breaks in unit U4 point to shallow-seated mass movements or soil creep. Pedogenic de- rapid shortening. We argue that there are better arguments velopment above the weathered bedrock units could have in favour of tectonic deformation and that the fault has had contributed to the apparent deformation, perhaps aided by at least one recent surface-rupturing earthquake. The lack of oblique run-off processes. However, there is no geomorpho- clearly identifiable, thin sedimentary layers makes it impos- https://doi.org/10.5194/se-12-2211-2021 Solid Earth, 12, 2211–2234, 2021
2226                             C. Grützner et al.: Holocene surface-rupturing earthquakes on the Dinaric Fault System

Table 1. Summary of all dated samples. Probability was calculated after Bronk Ramsey (2009). Calibration was done with INTCAL13
(Reimer et al., 2013).

      Sample ID      Fault       Trench         Material              δ 13 C   Conventional age   Calibrated age (probability)
      SLO18_SK2      Idrija      S wall         Charcoal           −25.3 ‰     2040 ± 30 BP       2067–1924 cal BP (88.1 %)
                                                                                                  2111–2080 cal BP (6.8 %)
                                                                                                  1907–1904 cal BP (0.5 %)
      SLO18_SK6      Idrija      S wall         Charcoal                  –    2340 ± 30 BP       2440–2315 cal BP (94.5 %)
                                                                                                  2456–2449 cal BP (0.9 %)
      SLO18_SK8      Idrija      N wall         Organic sediment          –    1550 ± 30 BP       1528–1376 cal BP (95.4 %)
      SLO18_SK9      Idrija      N wall         Organic sediment   −27.4 ‰     2510 ± 30 BP       2645–2489 cal BP (67.7 %)
                                                                                                  2740–2650 cal BP (27.7 %)
      SLO18_SK10     Idrija      N wall         Charcoal           −25.4 ‰     2080 ± 30 BP       2140–1987 cal BP (94.5 %)
                                                                                                  1958–1952 cal BP (0.9 %)
      SLO18_SK11     Idrija      N wall         Charcoal           −24.9 ‰     350 ± 30 BP        412–315 cal BP (54.2 %)
                                                                                                  492–420 cal BP (41.2 %)
      SLO18_SK13     Idrija      N wall         Charcoal           −24.5 ‰     2160 ± 30 BP       2208–2056 cal BP (55.4 %)
                                                                                                  2307–2228 cal BP (40 %)
      SLO18_SK14     Idrija      S wall         Organic sediment   −28.3 ‰     2320 ± 30 BP       2378–2306 cal BP (89.9 %)
                                                                                                  2235–2184 cal BP (5.5 %)
      SLO18_BAN2     Predjama    T1, NW wall    Organic sediment   −24.0 ‰     6900 ± 30 BP       7795–7669 cal BP (95.4 %)
      SLO18_BAN3     Predjama    T1, NW wall    Organic sediment          –    7530 ± 30 BP       8406–8311 cal BP (93.9 %)
                                                                                                  8235–8221 cal BP (1.5 %)
      SLO18_BAN4     Predjama    T1, NW wall    Charcoal           −23.2 ‰     3380 ± 30 BP       3695–3565 cal BP (95.4 %)
      SLO18_BAN6     Predjama    T1, SE wall    Organic sediment   −23.8 ‰     10 980 ± 40 BP     12 976–12 727 cal BP (95.4 %)
      SLO18_BAN7     Predjama    T1, SE wall    Charcoal           −24.5 ‰     860 ± 30 BP        800–694 cal BP (83.5 %)
                                                                                                  901–866 cal BP (9.9 %)
                                                                                                  826–814 cal BP (2 %)

sible to decide whether only one event or several earthquakes          In the southern trench wall, a bulk sample from unit
were recorded in the trench.                                        U5 close to the deformation zone gave an age of 12 976–
                                                                    12 727 cal BP (SLO18_BAN6). The stratigraphically higher
5.2    Dating of the Predjama Fault earthquake(s)                   sample SLO18_BAN7 (charcoal) is much younger with
                                                                    an age of 800–694 cal BP. While samples SLO18_BAN2
In this section we first consider the tectonic interpretation of    and SLO18_BAN3 are consistent, sample SLO18_BAN6 is
the trenching results. In the northern trench wall, all three       much older than those two but should give a similar age.
radiocarbon samples are in stratigraphic order (Fig. 8, Ta-         This can either be explained by the inherent large uncertain-
ble 1). The stratigraphically lowest sample from U4, sample         ties related to the dating of bulk samples (e.g. Wang et al.,
SLO18_BAN3, was submitted as a charcoal, but in the lab, it         1996; Howarth et al., 2018; Langridge et al., 2020) or by the
turned out that the sample size was very small and that only        (unknown) lateral component of fault motion that juxtaposes
the surrounding organic sediment could be treated. This sam-        units of different ages. Likewise, the two charcoal samples
ple, however, gave an age of 8406–8311 ka cal BP (Table 1)          SLO18_BAN4 and SLO18_BAN7 are 3 kyr apart, although
and dates the start of pedogenesis of the weathered bedrock.        they were expected to give similar ages. One explanation is
Bulk sample SLO18_BAN2 is located just a few centime-               that the older sample has a residence time issue; that is, the
tres above U4 and returned a slightly younger age of 7795–          charcoal could stem from an old tree, and it could have rested
7669 cal BP. Taken together, these two samples indicate that        somewhere upslope before deposition in the present-day lo-
the deformation happened after ∼ 8.4 ka because U4 and the          cation (see discussion in Zachariasen et al., 2006). Another
base of U5 are deformed. Charcoal sample SLO18Ban_4 has             explanation is again the unknown lateral component of fault
an age of 3695–3565 cal BP and most likely post-dates the           motion. Post-glacial pedogenic processes might be responsi-
deformation.

Solid Earth, 12, 2211–2234, 2021                                                        https://doi.org/10.5194/se-12-2211-2021
You can also read