Characterization of particle-associated and free-living bacterial and archaeal communities along the water columns of the South China Sea ...
←
→
Page content transcription
If your browser does not render page correctly, please read the page content below
Biogeosciences, 18, 113–133, 2021
https://doi.org/10.5194/bg-18-113-2021
© Author(s) 2021. This work is distributed under
the Creative Commons Attribution 4.0 License.

Characterization of particle-associated and free-living
bacterial and archaeal communities along the water
columns of the South China Sea
Jiangtao Li1 , Lingyuan Gu1 , Shijie Bai2 , Jie Wang3 , Lei Su1 , Bingbing Wei1 , Li Zhang4 , and Jiasong Fang5,6,7
1 StateKey Laboratory of Marine Geology, Tongji University, Shanghai 200092, China
2 Institute
          of Deep-Sea Science and Engineering, Chinese Academy of Sciences, Sanya 572000, China
3 College of Marine Science, Shanghai Ocean University, Shanghai 201306, China
4 School of Earth Sciences, China University of Geosciences, Wuhan 430074, China
5 The Shanghai Engineering Research Center of Hadal Science and Technology,

Shanghai Ocean University, Shanghai 201306, China
6 Laboratory for Marine Biology and Biotechnology, Qingdao National Laboratory

for Marine Science and Technology, Qingdao 266237, China
7 Department of Natural Sciences, Hawaii Pacific University, Kaneohe, HI 96744, USA

Correspondence: Jiasong Fang (jfang@hpu.edu)

Received: 29 March 2020 – Discussion started: 14 April 2020
Revised: 27 October 2020 – Accepted: 15 November 2020 – Published: 8 January 2021

Abstract. There is a growing recognition of the role of         lineages are also mostly distributed within Alphaproteobac-
particle-attached (PA) and free-living (FL) microorganisms      teria and Gammaproteobacteria, along with other abundant
in marine carbon cycle. However, current understanding of       members chiefly from Actinobacteria, Cyanobacteria, Bac-
PA and FL microbial communities is largely focused on           teroidetes, Marinimicrobia and Deltaproteobacteria. More-
those in the upper photic zone, and relatively fewer studies    over, there was an obvious shifting in the dominant PA and
have focused on microbial communities of the deep ocean.        FL bacterial compositions along the depth profiles from the
Moreover, archaeal populations receive even less attention.     surface to the bathypelagic deep. By contrast, both PA and FL
In this study, we determined bacterial and archaeal com-        archaeal communities dominantly consisted of euryarchaeo-
munity structures of both the PA and FL assemblages at          tal Marine Group II (MGII) and thaumarchaeotal Nitrosop-
different depths, from the surface to the bathypelagic zone     umilales, together with variable amounts of Marine Group
along two water column profiles in the South China Sea.         III (MGIII), Methanosarcinales, Marine Benthic Group A
Our results suggest that environmental parameters includ-       (MBG-A) and Woesearchaeota. However, the pronounced
ing depth, seawater age, salinity, particulate organic carbon   distinction of archaeal community compositions between PA
(POC), dissolved organic carbon (DOC), dissolved oxygen         and FL fractions was observed at a finer taxonomic level.
(DO) and silicate play a role in structuring these micro-       A high proportion of overlap of microbial compositions be-
bial communities. Generally, the PA microbial communi-          tween PA and FL fractions implies that most microorganisms
ties had relatively low abundance and diversity compared        are potentially generalists with PA and FL dual lifestyles for
with the FL microbial communities at most depths. Fur-          versatile metabolic flexibility. In addition, microbial distri-
ther microbial community analysis revealed that PA and FL       bution along the depth profile indicates a potential vertical
fractions generally accommodate significantly divergent mi-     connectivity between the surface-specific microbial lineages
crobial compositions at each depth. The PA bacterial com-       and those in the deep ocean, likely through microbial attach-
munities mainly comprise members of Alphaproteobacteria         ment to sinking particles.
and Gammaproteobacteria, together with some from Planc-
tomycetes and Deltaproteobacteria, while the FL bacterial

Published by Copernicus Publications on behalf of the European Geosciences Union.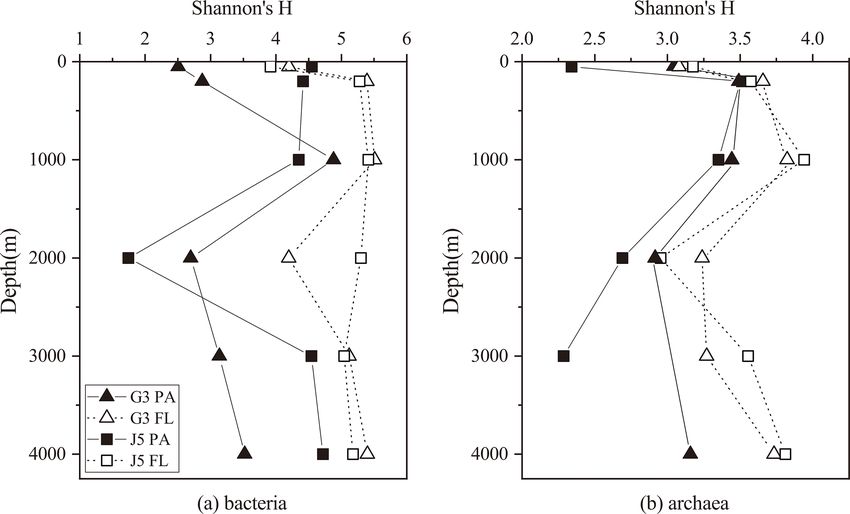
114                                            J. Li et al.: Characterization of particle-associated and free-living bacterial

1   Introduction                                                  Actually, most members of the PA and FL clades are gen-
                                                                  eralists which switch their lifestyles via attachment and de-
The sinking of particulate organic matter (POM) formed in         tachment to particles (Crespo et al., 2013; Li et al., 2015).
the photic layer is a fundamental process that transports car-    As revealed in many marine niches, Alphaproteobacteria,
bon and nutrient materials from the surface into the usu-         Gammaproteobacteria and Bacteroidetes are the major over-
ally starved deep ocean, with a significant role in structur-     lapped phylum and classes in both PA and FL microbial frac-
ing the distributions and activities of marine microorganisms     tions (Yung et al., 2016).
in the dark realm (Azam and Malfatti, 2007; Mestre et al.,            Our current knowledge of PA and FL microbial popula-
2018; Suter et al., 2018). During sinking, the POM is gen-        tions largely relies on the upper photic ocean, whereas lit-
erally colonized and concurrently decomposed by particle-         tle information is known from the deep dark ocean, which
attached (PA) prokaryotes, releasing dissolved organic mat-       is the largest biome and accommodates more than half of the
ter (DOM) into ambient seawater, fueling the free-living (FL)     ocean’s microbes (Aristegui et al., 2009; Salazar et al., 2016).
microbes (Kiorboe and Jackson, 2001; Azam and Malfatti,           Recently, a number of studies have revealed the PA and FL
2007). It has been revealed that PA and FL microbial popu-        microbial communities in the bathypelagic waters (Li et al.,
lations exhibit different taxonomic composition, physiology       2015; Salazar et al., 2015; Milici et al., 2017; Mestre et al.,
and metabolism, corresponding to their lifestyle and ecologi-     2018) or the deepest abyssal and hadal environments (Eloe
cal behavior. For example, PA bacteria, compared to FL bac-       et al., 2011; Tarn et al., 2016; Liu et al., 2018a). It is shown
teria, are often larger in size (Alldredge et al., 1986; Zhang    that PA and FL bacterial communities in the deep ocean have
et al., 2007; Lauro et al., 2009) and metabolically more ac-      clear differences in abundance and composition, in addition
tive (Karner and Herdl, 1992; Grossart et al., 2007). They of-    to the detection of novel, unknown prokaryotic taxa. Further-
ten maintain higher levels of extracellular enzymes, adhesion     more, although archaea are a major component of the marine
proteins, and antagonistic compounds and are capable of de-       ecosystem and play significant roles in the degradation of or-
grading high-molecular-weight (HMW) organic compounds             ganic materials (Iverson et al., 2012; Suzuki et al., 2017),
(Smith et al., 1992; Crump et al., 1998; Long and Azam,           PA and FL archaeal communities receive less attention and
2001; Mevel et al., 2008; Ganesh et al., 2014). An exami-         little is known about them. Previous limited reports have ob-
nation of microbial metagenomes suggests that there are no-       served controversial results, as several studies showed no ob-
table differences between PA and FL assemblages in GC con-        vious differences in archaeal community structures between
tent, effective genome size, general taxonomic composition        PA and FL assemblages (Galand et al., 2008; Eloe et al.,
and functional gene categories (Smith et al., 2013). In par-      2011; Suzuki et al., 2017), while a clear separation was found
ticular, some broad key functional gene categories involved       in recent reports (Tarn et al., 2016), with the PA archaeal
in DOM utilization (Poretsky et al., 2010; Rinta-Kanto et         fraction dominated by Marine Group II (MGII) and Marine
al., 2012) and specific functional gene groups linked to suc-     Group III (MGIII) and the FL archaeal fraction dominated by
cessive decomposition of phytoplankton blooms (Teeling et         Marine Group I (MGI) and anaerobic methane-oxidizing ar-
al., 2012) are significantly different, indicating the funda-     chaea (ANME). In brief, the changes of PA and FL prokary-
mental differences in survival strategies in relation to po-      otes along vertical profiles of the water column, from the sur-
tentially available substrates. It is further revealed that PA    face to the deep bathyal, abyssal and hadal depths, are not
microbes generally have larger genomes with a variety of          well known.
metabolic and regulatory capabilities of utilizing composi-           In this study, we analyzed and compared microbial compo-
tionally varied organic matter, while the genomes of FL mi-       sitions between PA and FL fractions at different depths along
crobes usually are smaller with streamlined metabolic and         the vertical profile in the South China Sea (SCS). The SCS is
regulatory functions that enable efficient adaption to olig-      a marginal sea located in the northwestern Pacific Ocean with
otrophic conditions (Smith et al., 2013; Yawata et al., 2014;     a maximal depth of approximately 5380 m (Fig. S1). Our
Yung et al., 2016). Phylogenetically, PA and FL lineages gen-     results reveal diverse and significantly divergent microbial
erally exhibit different compositions. The PA fraction is rel-    compositions in PA and FL fractions and obvious community
atively enriched in members of Gammaproteobacteria, Ver-          stratification at different depths along the vertical profiles.
rucomicrobia, Bacteroidetes, Firmicutes and Planctomycetes
(Azam and Malfatti, 2007; Milici et al., 2016; Salazar et al.,
2016; Suter et al., 2018), while the FL assemblages are of-       2     Materials and methods
ten populated by members of Alphaproteobacteria (SAR11
clade or Candidatus Pelagibacter) and Deferribacteres (De-        2.1    Sample collection and environmental parameter
Long et al., 1993; Crespo et al., 2013; Milici et al., 2017).            measurements
However, significantly overlapped compositions of PA and
FL microbial communities were also reported in a few stud-        Seawater samples were collected from two stations – the G3
ies (Hollibaugh et al., 2000; Ghiglione et al., 2007; Ortega-     station, at a depth of 4039 m at 117◦ 00.1310 E, 16◦ 59.9470 N,
Retuerta et al., 2013; Rieck et al., 2015; Liu et al., 2018a).    and the J5 station, at a depth of 4301 m at 114◦ 00.2090 E,

Biogeosciences, 18, 113–133, 2021                                                     https://doi.org/10.5194/bg-18-113-2021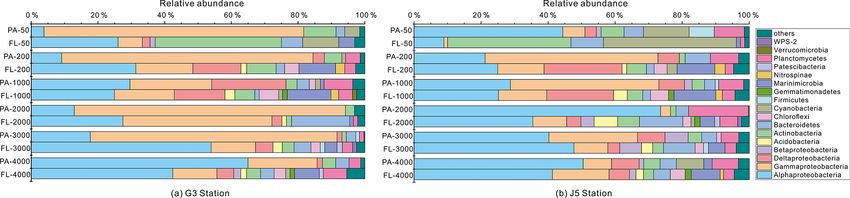
J. Li et al.: Characterization of particle-associated and free-living bacterial                                            115

13◦ 59.9580 N – located in the central deep basin of the SCS    ing was taken from Niskin bottles with first priority. To avoid
during the open cruise of R/V Dongfanghong II from 3 to         the disturbance of air during the sampling, glass bottles were
18 July 2014 (Fig. S1). Both stations have a depth > 4000 m,    fully filled with flowing seawater with as little head space as
providing us the bathyal environments to vertically profile     possible. In addition, mercury chloride was added to prevent
the variation of microbial assemblages with depth. A Sea-       any microbiological influence.
Bird CTD rosette sampler (SBE 911 plus) with 12 L Niskin
bottles (Seattle, Washington, USA) was used to collect sea-     2.2   DNA extraction
water from six different depths (50, 200, 1000, 2000, 3000
and 4000 m) at each station.                                    In this study, we used the SDS-based method to extract
    Basic environmental parameters of the water column,         the total DNA as described by Li et al. (2015) with mi-
including depth, salinity, temperature and dissolved oxy-       nor modifications. The PC membranes containing seawa-
gen (DO), were obtained in situ using the conductivity–         ter microbes were first cut into small pieces in a sterile
temperature–depth (CTD) profiler and a DO sensor during         petri dish and put into autoclaved 2 mL centrifuge tubes.
the sampling. Once water samples were collected on board,       A total of 800 µL of DNA extraction buffer consisting of
about 0.1 L of seawater was taken immediately for pH mea-       100 mM Tris-HCl, 100 mM sodium EDTA, 100 mM sodium
surement using a pH meter (Mettle Toledo Inc., Switzerland).    phosphate, 1.5 M NaCl and 1 % hexadecyl trimethyl ammo-
    Approximately 8 L of seawater was filtered on board         nium bromide (CTAB) was added into each tube. The cen-
through a 8142 mm precombusted glass fiber membrane             trifuge tubes were frozen in liquid nitrogen and then thawed
(0.7 µm nominal pore size, Whatman, USA) under a gen-           in a 65 ◦ C water bath. This procedure was repeated three
tle vacuum of < 150 mm Hg for particulate organic carbon        times. When the centrifuge tubes cooled down to room tem-
(POC) collection. The membranes were folded and stored          perature, proteinase K was added with a final concentra-
at −20 ◦ C until our POC analysis. Then about 30 mL of          tion of ∼ 0.2 mg mL−1 . The tubes were then incubated in
filtered seawater of each sample was collected into 40 mL       a 65 ◦ C water bath for 2 h and shaken gently every about
precombusted EPA vials and stored at −20 ◦ C immediately        30 min. Then, 800 µL of phenol : chloroform : isoamyl alco-
for dissolved organic carbon (DOC) concentration measure-       hol (25 : 24 : 1, v/v) was added into the centrifuge tubes,
ment (laboratory on land). About 200 mL filtered seawater       and the tubes were shaken gently several times and cen-
at each depth was stored at −20 ◦ C for analysis of nutri-      trifuged at 12 000 × g for 10 min. The supernatant was care-
ents (NO−         −
           3 / NO2 , dissolved inorganic phosphate and sili-    fully transferred into new tubes, and an equal volume of
cate). The remaining seawater was stored at −20 ◦ C for other   chloroform / isoamyl alcohol (24 : 1, v/v) was added. The
analyses.                                                       tubes were centrifuged at 12 000×g for 10 min. The aqueous
    At each depth, we collected 4 L of seawater to obtain       layer was pipetted into clean 2 mL tubes, and 0.6 volume of
microorganisms for further analysis. Seawater was filtered      cold isopropanol and 0.1 volume of 3 M sodium acetate were
first through a 847 mm polycarbonate (PC) membrane of           added. The centrifuge tubes were incubated at −20 ◦ C for
3.0 µm nominal pore size (Millipore, USA) and subsequently      1 h and centrifuged at 12 000×g for 10 min. The liquids were
through a 847 mm PC membrane of 0.22 µm nominal pore            carefully discarded, and DNA pellets at the bottom were gen-
size (Millipore, USA) to collect the PA and FL microorgan-      tly rinsed with 70 % pre-cooling ethanol. Finally, each DNA
isms, respectively (Eloe et al., 2011). To avoid damaging the   pellet was suspended into sterile deionized H2 O with a vol-
membrane and the fragile particles, a relatively low vacuum     ume of 50 µL.
pressure of < 10 mm Hg was used, and at the same time, the
filtration time was no longer than 40 min for each membrane.    2.3   Pyrosequencing and analysis of 16S rRNA gene
The membranes were then frozen at −80 ◦ C until further mi-           sequence amplicons
crobial analysis.
    Concentration of POC was determined with a PE2400 Se-       Before PCR amplification, we first used the PicoGreen ds-
ries II CHNS/O analyzer (PerkinElmer, USA) (Chen et al.,        DNA Quantitation Kit (Life Technologies, USA) to quantify
2008). DOC concentration was measured using a Shimadzu          the concentration of DNA. DNA concentrations obtained var-
TOC-V analyzer (Shimadzu Inc., Japan) (Meng et al., 2017).      ied between 4.48 and 29.1 ng µL−1 with a volume of ∼ 50 µL
Nutrients were determined using a four-channel continuous-      for each sample. For the PCR amplification of the bacterial
flow Technicon AA3 auto-analyzer (Bran+Luebbe GmbH,             16S rRNA gene, the primer sets 27F (50 -AGA GTT TGA
Germany).                                                       TCC TGG CTC AG-30) and 533R (50 -TTA CCG CGG CTG
    About 1 L of seawater for each sample was sent to Beta      CTG GCA C-30) with 10-nucleotide barcodes were used,
Analytic, Inc. in Miami, Florida, for 14 C radiocarbon dat-     while Arch344F (50 -ACG GGG YGC AGC AGG CGC GA-
ing with the accelerator mass spectrometry (AMS) method         30) and Arch915R (50 -GTG CTC CCC CGC CAA TTC CT-
as described in their website (https://www.radiocarbon.com/     30) containing 8-nucleotide barcodes were used for archaea
beta-lab.htm, last access: 2 December 2014). When CTD           (Ohene-Adjei et al., 2007; Sun et al., 2014). About 10 ng
rosette sampler came back on board, seawater for 14 C dat-      of DNA template was amplified for PCR. The PCR condi-

https://doi.org/10.5194/bg-18-113-2021                                                   Biogeosciences, 18, 113–133, 2021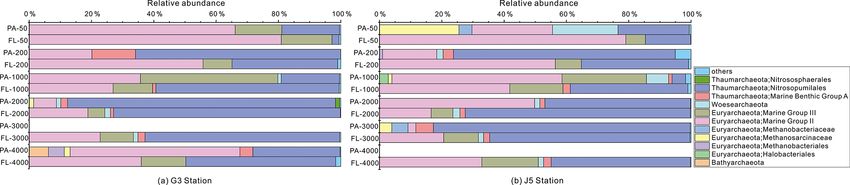
116                                             J. Li et al.: Characterization of particle-associated and free-living bacterial

tions are as follows: firstly, 94 ◦ C, 5 min; then, 94 ◦ C, 5 s,   //CRAN.R-project.org/package=vegan, last access: 4 Febru-
53 ◦ C, 50 s, and 72 ◦ C, 50 s, total 25 cycles; 72 ◦ C, 6 min.    ary 2019).
The products after PCR amplification were purified with               In this study, we used the “odds ratio” to assess microbial
the MiniBEST DNA Fragment Purification Kit (Takara Bio             preference for the PA or FL lifestyles. As defined by Ganesh
Inc, Japan) and then quantified using the NanoDrop 2000            et al. (2014), the formula of the odds ratio is the following:
(Thermo Scientific, USA). The pyrosequencing was car-
ried out at the Majorbio Bio-Pharm Technology, Co., Ltd.
(Shanghai, China) with the 454 GS-FLX Titanium system              odds ratio = lg(relative abundance
(Roche, Switzerland).

                                                                                in the PA fraction
   QIIME 1.9.1 was used to perform the following phyloge-                       relative abundance in the FL fraction),        (1)
netic analysis of pyrosequenced amplicons (Caporaso et al.,
2010). As described in our previous study (Li et al., 2017),
the low-quality reads were first filtered with the following         where a positive value indicates the PA preference, while a
quantity control (QC) criteria: (1) the reads with ambigu-         negative value signifies the FL preference (Suter et al., 2018).
ous nucleotides, (2) the length of reads < 200 bp, (3) the
reads containing > 5 bp homopolymers, and (4) the reads
with an average flowgram score < 25 in a quality window            2.5   Quantification of 16S rRNA gene and cell
of 50 bp. The operational taxonomic units (OTUs) were gen-               abundance estimation
erated based on 3 % cutoff of sequence similarity, and the
longest sequence was picked as the representative sequence         The copy numbers of the microbial 16S rRNA gene for PA
of each OTU for downstream analysis. The RDP classifier            and FL fractions were estimated with the 7500 Real-Time
was used for the taxonomy assignment by the SILVA 16S              PCR System (Applied Biosystems, Thermo Fisher, UK). The
rRNA gene database (version 132). The ChimeraSlayer in             primer sets used were 341f and 518r for bacteria (Dilly et
the QIIME package was used to identify and exclude those           al., 2004) and 344f and 519r for archaea (Bano et al., 2004)
of potential chimeras after alignment with PyNAST. In addi-        with about 200 bp amplified DNA fragments. The PCR prod-
tion, the singletons were removed from the final OTU tables.       ucts of the bacterial and archaeal 16S rRNA gene were first
                                                                   cloned into a pUC18 plasmid vector (Takara Bio Inc, Japan)
2.4   Diversity estimators and statistical analyses of             and then transformed into E. coli DH5α. The recombinant
      microbial communities                                        plasmids were extracted and purified and subsequently di-
                                                                   luted 10-fold as the standard for real-time PCR. R2 for the
To avoid the variation caused by an unequal sequence num-          standard curves varied between 0.994 and 0.996, indicat-
ber across samples, the OTU abundance was normalized by            ing a linear relationship well over the concentration ranges
resampling of sequences for each sample based on the sam-          used in our study. PCR was carried out in a 20 µL amplifi-
ple with the fewest number of sequences. After resampling          cation volume. The reaction mixture contained 1 µL of DNA
the sequences to the same number, diversity estimators in-         template, 0.15 µM forward and reverse primers, and 10 µL
cluding Chao 1 and Shannon’s diversity (H ) indices were           of Power SYBR Green PCR Master Mix (Life Technolo-
calculated. Similarities among different microbial communi-        gies, USA). The PCR amplification conditions include the
ties were determined using similarity matrices generated ac-       following: 95 ◦ C, 10 min to activate polymerase; 95 ◦ C, 15 s,
cording to the phylogenetic distance between reads (UniFrac        60 ◦ C, 1 min, 40 cycles. A negative control was used to mon-
distance), and beta diversity of principal coordinates anal-       itor potential contamination, and agarose gel electrophoresis
ysis (PCoA) was computed as components of the QIIME                helped to confirm the absence of nonspecific amplification.
pipeline. The correlation between the microbial community          Melt curves were generated using the Applied Biosystems
structures and environmental parameters was analyzed by            real-time PCR system software with default thresholds. Each
canonical correspondence analysis (CCA). For the PCoA              sample had triplicate amplifications, and the average copy
and CCA ordinations, the transformation of the resampled           number of the 16S rRNA gene was calculated. To make a di-
OTU abundance table was performed by taking the log of             rect comparison between bacterial and archaeal abundances,
the sequence numbers. In addition, to test the statistical sig-    we converted the copy number of the 16S rRNA gene into
nificance of different groups identified by PCoA ordination,       cell abundance based on the assumption that, on average,
multiple statistical analyses including MRPP, ANOSIM and           a bacterial cell has 4.08 16S rRNA gene copies while ar-
PERMANOVA were performed based on the resampled and                chaea contain 1.71 copies per cell (Lee et al., 2009). Al-
transformed OTU abundance table. A Mantel test was also            though the cell abundances inferred from the 16S rRNA gene
performed to test the statistical significance of environmen-      copy number quantified by qPCR may be potentially biased,
tal factors with microbial community compositions from the         the estimation of cell abundances based on the qPCR of the
results of CCA. All statistical analyses were performed in         16S rRNA gene has been confirmed as an effective method to
the R environment (v 3.2.1) using the vegan package (https:        reflect the approximate cell abundances in previous studies.

Biogeosciences, 18, 113–133, 2021                                                      https://doi.org/10.5194/bg-18-113-2021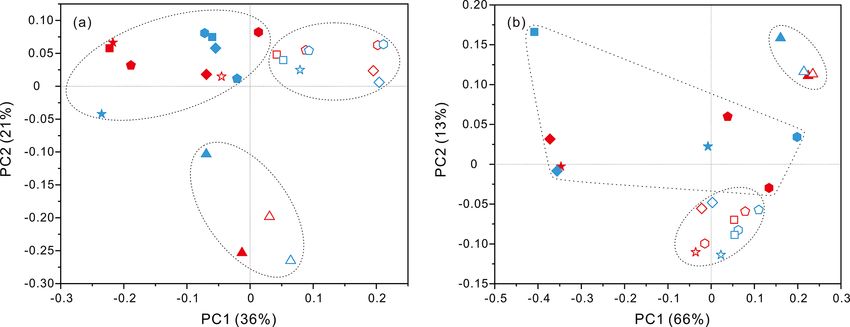
J. Li et al.: Characterization of particle-associated and free-living bacterial 117
3 Results
Silicates
(µM)
2.36
26.56
121.93
151.46
145.03
145.06
3.1 Environmental parameters of the water columns
(µM)
BD
1.30
2.73
2.81
2.79
2.78
PO2−
Fundamental environmental parameters, including tempera-
4
ture, salinity, pH, DO, DOC and POC, are listed in Table 1.
In general, they showed similar vertical trends with the nor-
(µM)
0.12
19.13
37.04
38.41
38.16
38.58
NO−3
mal pelagic ocean. Salinity increased gradually from ∼ 33.84
at 50 m to ∼ 34.52 at 200 and 1000 m and then remained
(yr)
108
106
1310
1670
1680
1610
Ages∗
at around 34.60 at greater depths until 4000 m. DO concen-
tration was the highest (∼ 204.5 µM) in surface water, de-
creased gradually to the lowest (∼ 83.9 µM) at 1000 m depth
J5 station
POC
(µM)
1.6
0.9
2.1
0.9
0.7
1.2
and then increased gradually from ∼ 102.0 µM at 2000 m to
∼ 113.5 µM at 4000 m. Nitrite concentrations of the water
DOC
(µM)
67.77
49.99
45.62
41.67
40.34
46.52
columns at all depths were below the detection limit. Con-
centrations of nitrate, phosphate, and silicate were continu-
ously increasing from the surface to 1000 m depth and then
DO
(µM)
204.8
116
82.3
102
109.7
111.8
remained at relatively constant levels (Table 1).
As expected, the age of the seawater determined from
Table 1. Environmental parameters of the water columns at different depths of G3 and J5 stations in the South China Sea.
114 CDIC was youngest at the surface and increased with
pH
8.02
7.72
7.51
7.52
7.52
7.53
depth linearly, varying from about 106 to 1650 years. The up-
per water layers (50 and 200 m) from the two stations had the
(‰)
33.88
34.52
34.53
34.61
34.62
34.62
S
youngest and nearly the same ages, around 106 years. Ages
of 1000 and 2000 m in the G3 station were almost identical,
(◦ C)
23.60
14.27
4.46
2.49
2.36
2.43
T
around 1180 years, and increased to 1600 years at 3000 m
and 1750 years at 4000 m. By contrast, the age of 1000 m in
the J5 station was ∼ 1310 years and remained relatively sta-
Silicates
(µM)
2.27
21.06
114.40
–
–
141.81
ble below 1000 m with the age of about 1650 years (Table 1).
DOC concentrations ranged from 63.07 to 40.34 µmol L−1 ,
with the highest at the surface and the lowest at the deep.
(µM)
BD
1.20
2.72
–
–
2.82
PO2−
4
However, POC concentrations varied greatly between 0.5
and 2.1 µmol L−1 and showed great variations. The POC
(µM)
BD
17.98
37.16
–
–
38.48
concentrations were highest at 3000 m of the G3 station
NO−3
(1.8 µmol L−1 ) and at 1000 m of the J5 station (2.1 µmol L−1 )
(Table 1).
(yr)
109
106
1170
1190
1600
1750
Ages∗
3.2 Microbial cell abundances
G3 station
POC
(µM)
1.5
0.8
1.2
1.1
1.8
0.7
The estimated abundances of bacteria and archaea were
about 106 –109 cells L−1 and 105 –107 cells L−1 , respec-
DOC
(µM)
63.07
53.02
49.34
–
42.94
42.44
tively (Fig. 1). The FL bacterial fraction generally
accommodated higher cell abundances (varying from
0.62 × 10⁷ to 1.65 × 10⁸ cells L−1 ), several times higher
DO
(µM)
204.3
115.1
85.5
–
–
115.1
∗ 14 C ages; BD: below detection; –: no measurement.
than their corresponding PA fraction (1.85 ± 0.02 × 10⁶ –
1.90 × 10⁸ cells L−1 ). However, one remarkably lower abun-
pH
8.02
7.75
7.51
–
–
7.52
dance of the FL bacterial fraction than the PA frac-
tion was detected in the surface water (50 m) of the
(‰)
33.81
34.54
34.51
34.61
34.62
34.63
S
G3 station, where PA bacterial abundance was up to
1.70 × 10⁹ cells L−1 , 2 orders of magnitude higher than that
of the FL fraction (1.62 × 10⁷ cells L−1 ) (Fig. 1a). Simi-
(◦ C)
25.80
15.46
4.68
2.52
2.36
2.39
T
lar to bacteria, the FL archaeal fractions usually showed
higher cell abundances than their PA fractions (Fig. 1b).
Depth (m)
The only exception was also at the depth of 50 m of the
G3 station, where the estimated PA archaeal cell abun-
1000
2000
3000
4000
200
dance (6.50 ± 0.01 × 10⁷ cells L−1 ) was much higher than
50
https://doi.org/10.5194/bg-18-113-2021 Biogeosciences, 18, 113–133, 2021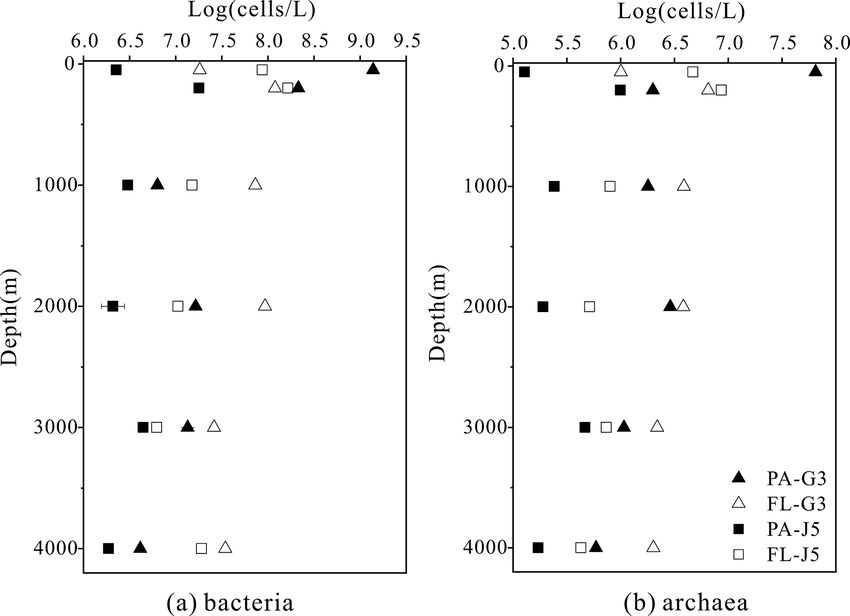
118                                             J. Li et al.: Characterization of particle-associated and free-living bacterial

that of the FL archaeal fraction (1.01 × 10⁶ cells L−1 ).          erted potential impact on variations of FL and PA microbial
The FL archaeal fraction had cell abundances be-                   communities along the water column (Figs. 4, S4). A Man-
tween 2.70 × 10⁵ and 8.62 ± 0.03 × 10⁶ cells L−1 , while           tel test further indicated that all those factors, except POC
PA archaeal fractions fluctuated between 1.28 × 10⁵ and            concentration (P = 0.164), were the statistically significant
6.50 ± 0.01 × 10⁷ cells L−1 (Fig. 1).                              variables associated with variation of PA and FL fractions
                                                                   (P = 0.001).
3.3   Estimation of microbial diversity
                                                                   3.4   Taxonomic compositions of the PA and FL
In total, (91 692, 81 332) and (72 590, 93 059) valid se-                bacterial and archaeal fractions
quences of the bacterial 16S rRNA gene were obtained for
FL and PA fractions of G3 and J5 stations, respectively.           Taxonomic compositions of FL and PA bacterial fractions
Based on the 97 % similarity, these FL and PA bacterial se-        and their relative abundances are presented in Fig. 5. At the
quences were defined into a total of 6320 operational taxo-        phylum level, bacterial sequences were mainly assigned into
nomic units (OTUs) in which 1982 OTUs belonged to sin-             Proteobacteria (Alpha-, Beta-, Gamma- and Deltaproteobac-
gletons and were finally removed from the valid OTU table          teria), Actinobacteria, Cyanobacteria, Planctomycetes, Bac-
(Table S1). Correspondingly, (50 727, 41 511) and (44 443,         teroidetes, Marinimicrobia (SAR406 clade), Chloroflexi,
37 751) archaeal sequences were determined for FL and PA           Firmicutes, Acidobacteria, Gemmatimonadetes, Nitrospinae
archaeal fractions of the G3 and J5 stations. Attempts to de-      and Verrucomicrobia. The taxa at the family level with rela-
termine the PA archaeal sequence from 3000 m depth of the          tively high abundances (> 3 %) on average in either the PA
G3 station and 4000 m depth of the J5 station failed because       or FL fraction are further shown in Fig. 6.
of technical reasons. A total of 1070 archaeal OTUs were              It is clear that Alphaproteobacteria and Gammaproteobac-
defined, and 329 OTUs were considered as singletons (Ta-           teria were the dominant lineages in both the FL and PA frac-
ble S2). The sequencing depths of the 16S rRNA gene were           tions at nearly all depths. In most cases, the sum of Alphapro-
shown in their rarefaction curves (Fig. S2).                       teobacteria and Gammaproteobacteria accounted for ∼ 40 %
   Shannon’s diversity (H ) and Chao 1 indices were cal-           to nearly 90 % (Fig. 5). Moreover, their relative abundances
culated to estimate microbial diversity of both PA and FL          in different PA and FL fractions and different stations also
fractions at all depths (Figs. 2 and S3). In most cases, the       varied widely. Within the Alphaproteobacteria, the dominant
H indices of the bacterial FL fractions were usually higher        families included Methylobacteriaceae, Phyllobacteriaceae,
than their PA counterparts at each depth (Fig. 2). The H in-       Rhodobacteraceae and Erythrobacteraceae (Fig. 6). Mem-
dex of FL and PA bacterial fractions gradually increased           bers of the families Methylobacteriaceae and Erythrobac-
from 50 to 1000 m, decreased in the intermediate water             teraceae occurred commonly in both fractions at almost
of around 2000 m depth, and increased again at 3000 and            all depths but usually with higher proportions in PA frac-
4000 m (Fig. 2a). The archaeal H index varied along the ver-       tions. The family Rhodobacteraceae occurred commonly in
tical profiles with a trend similar to bacteria, and FL archaea    both fractions at every depth (1 %–20 %), while the Phyl-
generally had higher H index values than the PA fraction           lobacteriaceae was dominantly distributed in the PA frac-
(Fig. 2b). In addition, it was further observed that even at the   tion of 2000 m depth of the J5 station with > 60 % pro-
same depth the values of the H index between two stations          portions. In addition, another important lineage within Al-
fluctuated a lot. The Chao 1 index showed nearly similar vari-     phaproteobacteria is the SAR11 clade (now named Pelag-
ation trends for both PA and FL microbial fractions (Fig. S3).     ibacterales) (Grote et al., 2012). It was clearly revealed that
   PCoA analysis revealed that there were significant differ-      the SAR11 clade showed relatively higher abundances in
ences (P values < 0.05, Table S3) in bacteria and archaea          FL fractions than PA fractions. Moreover, at depths above
community structures over the depth profiles and between           1000 m, the SAR11 clade had a far higher proportion than
the FL and PA fractions. Overall, three groups were distin-        the deep ocean, and the maximum levels occurred at 200 m
guished, the surficial 50 m group, the FL group, and the PA        depth (20 %–24 %) (Fig. 6, Table S1). Gammaproteobacte-
group (Fig. 3). One group, which consisted exclusively of          ria was another lineage with the highest abundance over-
samples at 50 m depth, separated the microbes at the surface       all. Its relative abundances changed significantly with depths
from those in the rest of the water column of both stations,       and in different fractions. The minimum abundances were
irrespective of microbial lifestyles (FL or PA). However, the      only 1 %–5 %, while the maximum were up to 73 %–80 %
other two groups were separated mainly based on the FL             (Fig. 5 and Table S1). Moreover, the G3 station generally had
and PA lifestyles. It is interesting to note that the FL bac-      higher Gammaproteobacteria proportions than that of the J5
terial samples clustered into one group where samples were         station on average. As shown in Fig. 6, although sequences
further partitioned with respect to depth (Fig. 3a). Canoni-       of Gammaproteobacteria were classified into multiple fami-
cal correspondence analysis (CCA) showed that fundamen-            lies, actually only two families, Alteromonadaceae and Pseu-
tal environmental parameters including depth, DO, salinity,        doalteromonadaceae, exhibited absolutely dominant preva-
seawater age, DOC and POC concentration, and silicate ex-          lence in the bacterial populations. The Pseudoalteromon-

Biogeosciences, 18, 113–133, 2021                                                      https://doi.org/10.5194/bg-18-113-2021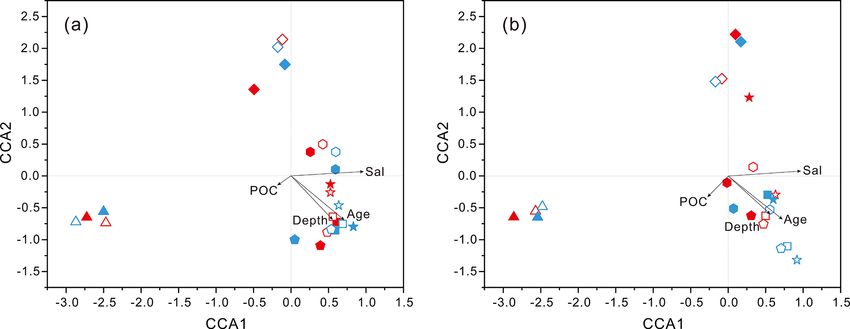
J. Li et al.: Characterization of particle-associated and free-living bacterial                                                        119

Figure 1. Bacterial and archaeal cell abundances in seawaters at different depths from the G3 station and J5 station in the South China Sea,
estimated from 16S rRNA gene copy abundances.

Figure 2. Shannon’s diversity index calculated for all bacterial and archaeal communities of seawaters collected from the G3 station and J5
station in the South China Sea.

adaceae populated predominantly the PA fractions in 50                  (Fig. 6). Actinobacteria and Cyanobacteria were abundantly
and 200 m depths (66 %–75 %), while the Alteromonadaceae                distributed only in the surficial 50 m depth, and by sharp
mainly dominated the PA fractions in the deep water, partic-            contrast, their proportions in other depths were less than
ularly at 2000 and 3000 m depths. Deltaproteobacteria also              5 %. Other bacterial lineages which had a wide distribution
had a common distribution in both fractions of all depths,              in all depths but only with minor abundances in both frac-
usually accounting for less than 10 % proportions in most               tions included Planctomycetes, Bacteroidetes, Marinimicro-
samples (Fig. 5), and SAR324 clade members contributed                  bia (SAR406 clade), Chloroflexi, Betaproteobacteria, Firmi-
significantly to the dominance of the Deltaproteobacteria               cutes, Gemmatimonadetes and Verrucomicrobia (Fig. S5).

https://doi.org/10.5194/bg-18-113-2021                                                              Biogeosciences, 18, 113–133, 2021
120                                                 J. Li et al.: Characterization of particle-associated and free-living bacterial

Figure 3. Results of PCoA analysis for particle-attached and free-living microbial fractions collected from seawater columns of the South
China Sea. (a) PA and FL bacteria; (b) PA and FL archaea. Statistical analyses supported the groups with statistical significances (Table S3).
Triangle: 50 m; rhombus: 200 m; hexagon: 1000 m; star: 2000 m; square: 3000 m; pentagon: 4000 m. Blue color: J5 station; red color: G3 sta-
tion. Filled: particle-attached fraction; open: free-living fraction.

Figure 4. Results of CCA analysis to correlate several environmental factors including POC, seawater age, salinity and depth to PA and FL
microbial communities collected from seawater columns of the South China Sea. (a) PA and FL bacteria; (b) PA and FL archaea. Triangle:
50 m; rhombus: 200 m; hexagon: 1000 m; star: 2000 m; square: 3000 m; pentagon: 4000 m. Blue color: J5 station; red color: G3 station.
Filled: particle-attached fraction; open: free-living fraction.

   The majority of archaeal amplicons mainly fell into the               MGII clade, particularly in FL fractions with up to ∼ 80 %
Nitrosopumilales and several uncultured taxonomic lineages               proportions. By sharp contrast, the lowest abundances of
(Figs. 7 and S6). Both FL and PA archaeal fractions at all               MGII occurred at 2000 (G3 station) and 3000 m (J5 sta-
depths were principally populated by the order Nitrosopumi-              tion) depths, making up < 20 % of proportions. The third
lales (formerly referring to MGI.1a, a subclade of MGI) (Qin             most abundant clade overall is Marine Group III (MGIII) of
et al., 2017) of the Thaumarchaeota and Marine Group II                  the Euryarchaeota. MGIII representatives were mainly dis-
(MGII) of the Euryarchaeota. Members from the Nitrosop-                  persed in the FL fractions with 5 %–18 % abundances, while
umilales and MGII lineages generally contributed more than               they were absent from most of the PA fractions. However,
80 % relative abundances in their respective clone libraries.            the relative abundances of MGIII members in PA fractions
The Nitrosopumilales was always one of the most abundant                 of 1000 m depth could be as high as 30 %–45 % (Fig. 7).
clades along the vertical profiles except in the topmost FL              The order Methanosarcinales of Euryarchaeota was detected
and PA fractions. The MGII clade exhibited a wide distribu-              commonly in most PA fractions, but it had the higher abun-
tion along the water columns, and it usually accounted for the           dance only in the upmost 50 m depth (∼ 29.7 %) (Fig. 7). An-
large proportions in both archaeal size fractions. The photic            other sample accommodating relatively many Methanosarci-
layer (∼ 50 m depth) contained the highest abundances of the             nales was the PA faction of 3000 m in the J5 station with

Biogeosciences, 18, 113–133, 2021                                                              https://doi.org/10.5194/bg-18-113-2021
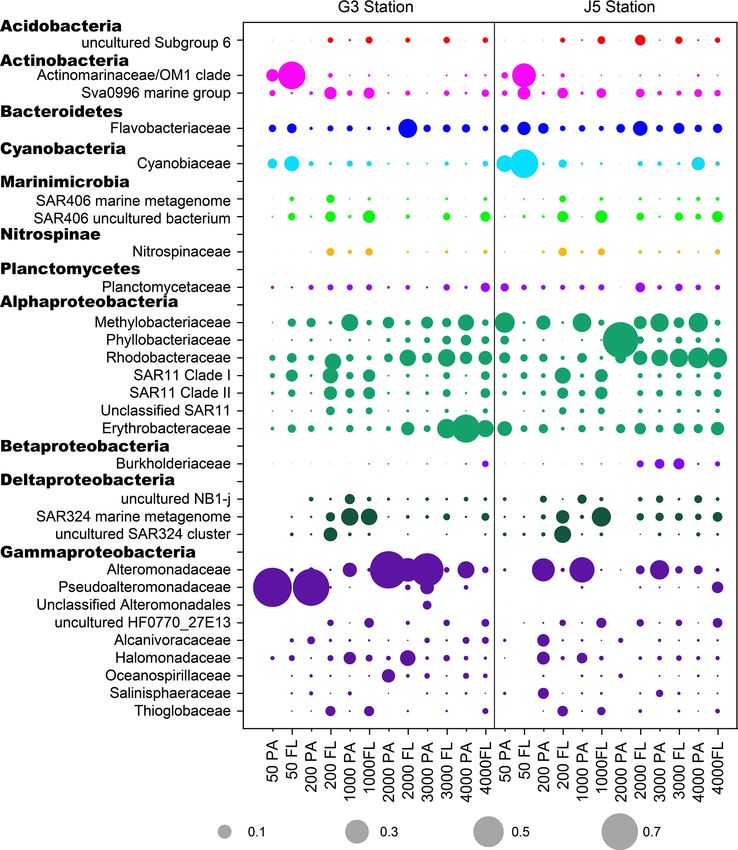
J. Li et al.: Characterization of particle-associated and free-living bacterial                                                           121

Figure 5. Taxonomic compositions of particle-attached and free-living bacterial communities of seawaters at different depths along two
different water columns in the South China Sea. (a) G3 station; (b) J5 station. The phylum or class which has less than 1 % proportions is
classified into “others” (Fig. S5).

Figure 6. The relative abundances of families in particle-attached and free-living bacterial communities. Dark grey bubbles are the average
relative abundances in the PA fraction, while light grey bubbles are the average relative abundances in the FL fractions. Scale is shown at the
bottom, and the circle with a number indicates the actual relative abundance.

https://doi.org/10.5194/bg-18-113-2021                                                                Biogeosciences, 18, 113–133, 2021
122                                             J. Li et al.: Characterization of particle-associated and free-living bacterial

9.1 % proportion. Within the Euryarchaeota, another clade          OTUs at different levels are approximately similar to OTUs
of methanogens, Methanobacteriales, was also detected from         retrieved exclusively from either the PA fractions or the FL
both size fractions but with low relative abundances (< 5 %)       fractions (Table S1, Fig. S7).
(Figs. 7, S6, Table S2). In addition, other archaeal lineages
included Woesearchaeota (formerly known as the DHVEG-
6 group), the Miscellaneous Crenarchaeotic Group (MCG,             4     Discussion
now named Bathyarchaeota), the Halobacteriales of the Eu-
ryarchaeota and Marine Benthic Group A (MBG-A) of the              4.1    Comparison of microbial abundance and diversity
Thaumarchaeota. They just provided a limited contribution                 between PA and FL fractions
to archaeal populations (Fig. S6).
                                                                   PA bacterial and archaeal fractions show generally lower
3.5   Bacterial preference for PA or FL lifestyles                 abundance and taxonomic richness than their FL counter-
                                                                   parts and constitute a small fraction of the total abundances.
The odds ratio was used to assess the preference of bacte-         Our results are consistent in principle with previous reports
rial taxonomic lineages to the PA or FL lifestyle. A posi-         on various pelagic environments, in either the euphotic zone,
tive odds ratio indicates PA preference or higher abundance        twilight or the dark deep ocean (Turley and Stutt, 2000; Si-
in the PA fraction, while a negative value suggests FL pref-       mon et al., 2002; Ghiglione et al., 2007; Rieck et al., 2015).
erence or higher abundance in the FL fraction. The bacte-          However, in some eutrophic and notably particle-rich marine
rial lineages dominating the PA fractions come exclusively         ecosystems, for example, marine snow or estuaries, PA bac-
from Alphaproteobacteria and Gammaproteobacteria with              terial fractions were present in higher local concentrations
some relatively abundant Deltaproteobacteria and Plancto-          and greater diversity than FL bacteria (Caron et al., 1982;
mycetes at specific depths (Fig. 5). By contrast, although the     Karner and Herndl, 1992; Turley and Mackie, 1994; Gar-
predominant lineages of FL fractions also mainly consisted         neau et al., 2009). In the upper photic zone, PA bacterial
of members of Alphaproteobacteria and Gammaproteobac-              abundance and their contribution to total bacterial biomass
teria, other abundant lineages were more diverse, includ-          are highly variable and depend largely on the quantity and
ing Actinobacteria, Cyanobacteria, Bacteroidetes, Marinimi-        quality of suspended organic particles (Cammen and Walker,
crobia and Deltaproteobacteria, as shown in Fig. 5. As             1982; Simon et al., 2002; Doxaran et al., 2012). This is in-
shown in Fig. 8, we listed those lineages at the family level      deed the case in the South China Sea. As shown in Fig. 1, at
with high proportions (> 1 %) with their odds ratios along         50 and 200 m depths of the G3 station, PA bacterial abun-
the depth profiles. It was suggested that most of the ab-          dances outnumbered FL bacteria by nearly 2–100 times,
solutely dominant families of PA fractions comprised of            whereas the J5 station has an opposite trend. However, as
the Phyllobacteriaceae and Methylobacteriaceae (Alphapro-          shown in Table 1, these two stations have almost the same en-
teobacteria) and Pseudoalteromonadaceae and Alteromon-             vironmental parameters, particularly in POC concentrations.
adaceae (Gammaproteobacteria) (Fig. 6) showed a prefer-            One possibility may be that G3 and J5 have different POC
ence for the PA lifestyle. However, the alphaproteobac-            compositions, attributable to different origins of organic mat-
terial Rhodobacteraceae and Erythrobacteraceae prevailing          ter (Chen et al., 2015; He et al., 2016; Liang et al., 2018). Al-
in PA fractions preferred to different lifestyles at differ-       though bacteria attaching to particles are of relatively lower
ent depths (Fig. 8). Compared with those PA-preferred lin-         abundance compared to free-living cells in the pelagic ocean,
eages, there is a wider range of lineages showing a pref-          they are consistently metabolically more active with higher
erence for the FL lifestyle. These phylogenetic lineages           extracellular enzymatic activities (Karner and Herndl, 1992)
are mainly populated by the OM1 clade and Sva0996 ma-              and cell-specific thymidine incorporation rates (Turley and
rine group (Actinobacteria), Nitrospinaceae (Nitrospinae),         Mackie, 1994; Turly and Stutt, 2000). Therefore, PA bacteria
Planctomycetaceae (Planctomycetes), the SAR11 clade (Al-           often play a comparable role to free-living bacteria in hydrol-
phaproteobacteria), the SAR324 clade (Deltaproteobacteria),        ysis or decomposition of marine organic matter, biomass pro-
the SAR86 clade and Thioglobaceae (Gammaproteobacte-               duction, and carbon cycling (Griffith et al., 1994; Turly and
ria). It is important to point out that a considerable number      Stutt, 2000; Liu et al., 2015). The decline of bacterial abun-
of bacterial lineages exhibited their preferences for both PA      dance and richness along the depth profile is largely owing to
and FL lifestyles, though their preferences varied at different    the gradual decreasing availability of usable organic carbon
depths or locations (Fig. 8). Actually, at OTU level, less than    (Smith, 1992; Turly and Stutt, 2000; Jiao et al., 2014). It is
1/2 of the total OTUs (2005 out of 4338 OTUs) were shared          interesting that the mid-water around 2000 m depth showed
by PA and FL fractions (Fig. S7). Phylogenetically, these PA-      the lowest bacterial diversity (Figs. 2, S3). One possibility
and FL-shared OTUs mostly fell into Alphaproteobacteria,           is that 1500–2000 m is roughly a boundary for different wa-
Gammaproteobacteria, Deltaproteobacteria, Planctomycetes,          ter masses in the deep, central basin of the South China Sea.
Chloroflexi, Bacteroidetes, Marinimicrobia and Actinobac-          The deep water masses (> 2600 m) of the central basin com-
teria. The taxonomic components of the PA- and FL-shared           ing from the western Pacific Ocean through the Bashi Chan-

Biogeosciences, 18, 113–133, 2021                                                      https://doi.org/10.5194/bg-18-113-2021
J. Li et al.: Characterization of particle-associated and free-living bacterial 123
Figure 7. Taxonomic compositions of particle-attached and free-living archaeal communities of seawaters at different depths along two
different water columns in the South China Sea. (a) G3 station; (b) J5 station. PA-3000 at the G3 station and PA-4000 at the J5 station
indicate the samples failing in the sequencing of archaeal 16S rRNA gene. The archaeal lineages, at the phylum or class level, with less than
1 % proportions are classified into “others” (Fig. S6).
nel are relatively rich in nutrients compared to the mid-water In our study, PCoA analysis revealed that PA and FL frac-
masses of the SCS. Therefore, it may cause a relative in- tions from the surficial zone (50 m) were clustered into a
crease in microbial diversity in deep water masses such as separate but relatively loose group distant from other depths
those at 3000 and 4000 m. In addition, some “old, deep” (Fig. 3), which is indicative of the influence imposed from
water from the bottom of the central basin will also rise to depth in shaping microbial community structures. Several
around 2000 m depth because of the basin-scale circulation. bacterial lineages, including Cyanobacteria, Actinobacteria,
These old waters are relatively enriched in refractory DOC Deltaproteobacteria, Marinimicrobia (SAR406 clade) and
(RDOC) and remained after microbial utilization of labile Firmicutes, with distinct distributing stratification contribute
DOC during their circulation, potentially reducing microbial to this dissimilarity (Fig. 5). Cyanobacteria and Actinobac-
diversity. This hypothesis is partly supported by the seawater teria belong to typical phototrophs (Mizuno et al., 2015),
age at the J5 station. It is shown that the age of seawater at and they are prevalently distributed in euphotic zones. By
2000 m depth of the J5 station is 1670 years, which is roughly contrast, the deltaproteobacterial SAR324 clade, as shown in
equal to those of deep waters at 3000 and 4000 m (1680 years our results, is primarily found in mesopelagic waters (200–
and 1610 year). In contrast, archaea are commonly much 1000 m) (Fuhrman and Davis, 1997; Wright et al., 1997). The
lower in cell abundance and community diversity compared SAR406 clade has a ubiquitous distribution across diverse
with their bacterial counterparts at the same depths (Figs. 1, marine niches; however, its high abundance always occurs
2 and S3). The relative abundance of archaeal populations within the mesopelagic zones, ∼ 5 times higher or more than
in total prokaryotes increases gradually with depth, which is in surface ocean (Yilmaz et al., 2016). Archaeal population
indicative of a potential rising impact on the biogeochemi- components also reflect the impact of depth. Euphotic zones
cal cycle in marine environments. In addition, a pronounced hold less abundant thaumarchaeotal Nitrosopumilales and
distinction in microbial community structures of PA and FL more euryarchaeotal Methanosarcinales and Woesearchaeota
assemblages was observed along the depth profile, which was (Fig. 7), while marine thaumarchaeotal groups are more
well supported by the results of statistical analyses (Fig. 3). abundant in meso- and bathypelagic waters (Karner et al.,
It is expected that the PA microbial fraction differs from the 2001; Mincer et al., 2007; Varela et al., 2008). In addition,
FL fraction, considering their discrepant activity patterns for Salazar et al. (2016) found that sampling depth appears to
survival. Related discussions are shown below. have a more direct impact on free-living bacterial communi-
ties. Our results are highly consistent with this observation
4.2 Environmental factors potentially shaping in that FL bacterial fractions from the same depth grouped
microbial community structure together irrespective of their sampling locations (G3 or J5
station) (Fig. 3a).
Several environmental parameters played a pivotal role in DO concentration is observed to strongly affect particle
structuring microbial communities of seawater. Hydrolog- flux and particle transfer efficiency from the euphotic zone
ical condition (e.g., depth), together with age and salin- to the deep sea since remineralization of organic particles
ity of water mass, is a key subset of environmental drivers appears to be oxygen dependent (Laufkotter et al., 2017;
(Fig. 4). Recent studies have shown that microbial popu- Cram et al., 2018). DO is considered one of the most cru-
lations in the meso-/bathypelagic ocean are largely dissim- cial environmental variables for shaping the compositions of
ilar to those of the epipelagic zone (Salazar et al., 2015; particle-attached bacterial assemblages (Salazar et al., 2016).
Milici et al., 2017; Liu et al., 2018a), which is indicative of Some taxonomic lineages are directly affected by oxygen.
a crucial environmental selection process exerted by depth. For example, a recent study found that oxygen is one of the
https://doi.org/10.5194/bg-18-113-2021 Biogeosciences, 18, 113–133, 2021124 J. Li et al.: Characterization of particle-associated and free-living bacterial Figure 8. Odds ratio for each of the families with relatively abundant proportions in each sample. Dark grey bubbles represent the clades with a positive odds ratio, meaning the preference of the PA lifestyle. Light grey bubbles represent the clades with a negative odds ratio, which is indicative of the FL preference. Scale is shown at the bottom. Biogeosciences, 18, 113–133, 2021 https://doi.org/10.5194/bg-18-113-2021
J. Li et al.: Characterization of particle-associated and free-living bacterial                                                  125

key factors driving the distribution and evolutionary diver-         Salazar et al., 2015; Liu et al., 2018a). The pronounced con-
sity of Woesearchaeota (Liu et al., 2018b). POC and DOC              trast in population compositions of the two filtration frac-
can be substrates for both PA and FL communities, respec-            tions was unveiled only at a greater taxonomic level, and
tively (Azam and Malfatti, 2007; Zhang et al., 2016; Liu et          a considerable number of phylogenetic taxa exhibited dif-
al., 2018a). However, POC concentration in the present study         ferent preferences for PA or FL lifestyles. It is shown in
is not statistically significantly correlated with either bac-       Figs. 5 and 6 that as the most abundant members, Alphapro-
terial or archaeal community abundances (P values > 0.05)            teobacteria and Gammaproteobacteria, occurred prevalently
(Table S3). We hypothesize that the quality rather than the          in both filtration fractions, but at the family level, most of
quantity of POC imposes a decisive influence on microbial            predominant bacterial lineages of PA and FL fractions were
populations, especially in the deep, dark ocean. During POC          significantly divergent, indicating their preference for differ-
sinking from surface through the water column, and also as           ent microhabitats shaped by organic particles and environ-
seawater ages, the labile organic matter becomes increas-            mental parameters. The dominant lineages in PA fractions
ingly decomposed, while the more refractory material re-             were mainly associated with the families Pseudoalteromon-
mains and resists further degradation (Simon et al., 2002). In       adaceae and Alteromonadaceae within Gammaproteobacte-
such cases, utilization of the POC in the deep sea by microor-       ria, as well as the Methylobacteriaceae and Phyllobacteri-
ganisms depends on the quality and quantity of the remain-           aceae within Alphaproteobacteria. These gammaproteobac-
ing POC. Meanwhile, in older seawater, DOC also becomes              terial members are usually retrieved from diverse marine
more refractory because free-living microorganisms prefer-           habitats such as the typical PA clades, and they are be-
entially utilize labile DOC and the remaining refractory DOC         lieved to have the abilities to degrade/utilize HMW organic
gradually accumulates, which potentially affects microbial           compounds with higher nutrient requirements (DeLong et
community structures. Among common nutrients, silicate ex-           al., 1993; Crespo et al., 2013). The adhesion to particles
hibited statistically significant correlation with microbial dis-    could make them increase nutrient acquisition and avoid the
tributions (Fig. S4), and this is unexpected because the SCS         nutrient-depleted conditions (Crespo et al., 2013). By con-
generally exhibits N- or P-limited phytoplankton production          trast, members of Alphaproteobacteria are rarely reported as
(Wu et al., 2003; Chen et al., 2004). However, recent research       the dominant lineages of the PA fraction or particle-attached
found that, near the sampling site of this study, there is a clear   preference (Crespo et al., 2013; Rieck et al., 2015; Suzuki
silicon deficiency in the euphotic zones shallower than 75 m         et al., 2017), which is inconsistent with our results reveal-
(Huang et al., 2015), which directly influences the diversity        ing alphaproteobacterial lineages frequently prevailed as PA
and biomass of phytoplankton (for example, diatom), and              members. Further phylogenetic analysis revealed that the
consequently the quantity and quality of POM transported             majority of alphaproteobacterial PA members belonged to
to the deep along the vertical water columns, and finally ex-        the genus Methylobacterium and are strictly aerobic, facul-
erts a potential impact on microbial communities. Some bac-          tatively methylotrophic bacteria, which can grow on a wide
terial lineages such as the Rhodobacteraceae, Flavobacteri-          range of carbon compounds (Green, 2006). They probably
aceae, Oceanospirillaceae and the SAR11 clade, commonly              benefit from the particle-attached lifestyle, making their high
retrieved in our present study, have been confirmed to be            requirements for organic matter easily to achieve. Compared
closely related to marine diatom blooms (Zhang et al., 2018;         with bacterial PA counterparts, FL bacterial communities
Mönnich et al., 2020). Actually, the microbial community             are more diverse, and dominant populations are scattered in
structure and its distribution along the water column profile        more phylogenetic taxa with relatively homogeneous propor-
are a comprehensive combination impacted by multiple en-             tions (Fig. 8). Among the predominant lineages, the acti-
vironmental variables.                                               nobacterial OM1 cade and cyanobacteria dominate the up-
                                                                     per surficial waters (Fig. 6), likely attributed to their pho-
4.3   Specialist or generalist for the PA and FL lifestyle:          totrophic behaviors. Although Actinobacteria are recognized
      clues from bacterial community compositions                    as ubiquitous members of marine bacterioplankton (Giovan-
                                                                     noni and Stingl, 2005), they are scarcely reported with pre-
It was indicated that PA and FL bacterial fractions gener-           dominance (Milici et al., 2016). Ghai et al. (2013) revealed
ally accommodated different community compositions along             the OM1 clade members possess the smallest cell sizes
the depth profiles (Fig. 3), consistent with previous reports in     with streamlined genome, representing a typical adaption
various marine habitats (Acinas et al., 1997; Moeseneder et          to oligotrophic conditions (Giovannoni et al., 2014), which
al., 2001; Ghiglione et al., 2009; Salazar et al., 2015). How-       agrees well with the oligotrophic environments in the SCS
ever, in most cases, the taxonomic compositional disparity           (Gong et al., 1992). Other predominant FL lineages include
between the two filtration fractions does not seem very ap-          the alphaproteobacterial SAR11 clade, the deltaproteobacte-
parent, at least at the phylum level (Fig. 5). Actually, a few       rial SAR324 clade, and Marinimicrobia (SAR406 clade), all
studies also confirmed that at high taxonomic ranks, bacte-          usually being the most ubiquitous free-living bacterial lin-
ria show conserved lifestyles either in association with par-        eages and dominantly distributed in epi- and mesopelagic
ticles or as free-living microorganisms (Eloe et al., 2011;          zones (Grote et al., 2012; Tarn et al., 2016; Yilmaz et al.,

https://doi.org/10.5194/bg-18-113-2021                                                         Biogeosciences, 18, 113–133, 2021
126 J. Li et al.: Characterization of particle-associated and free-living bacterial 2016; Milici et al., 2017; Liu et al., 2018a). Genomic infor- that these bacteria are able to employ two different survival mation suggests that, although these clades have a flexible strategies at the same time. On the other hand, lots of taxa metabolism utilizing multiple hydrocarbon compounds, they show divergent preferences for PA or FL lifestyles at differ- generally lack carbohydrate-active enzyme genes for the at- ent depths or different locations. This is clearly evident by tachment to and the degradation of particulate organic matter the shift or conversion of their odds ratios at different depths (Peoples et al., 2018), consistent with their preference for the along the vertical profiles of the water column (Fig. 8), which free-living lifestyle rather than particle attachment (Eloe et is indicative of their different adaption tactics to different al., 2011; Salazar et al., 2015; Tarn et al., 2016). In addition, environments. One possible explanation is that most of the the percentages of the SAR11 clade revealed here seem to marine bacteria are generalists with dual-lifestyle strategies be relatively lower compared with those reported in previous (Bauer et al., 2006; Gonzalez et al., 2008) and able to grow in studies where the SAR11 clade typically makes up 20 % to suspension as well as on particles (Lee et al., 2004; Grossart 40 % of the bacterioplankton (Morris et al., 2002; Apprill et et al., 2006, 2010). For instance, PA bacteria must be capable al., 2015). It may be related to the sequencing primers used, of surviving freely in the water column to migrate and colo- which potentially cause underestimation of the SAR11 clade nize new organic particles (Ghiglione et al., 2007; Crespo et and bias the interpretation of their relative abundances (Ap- al., 2013). Bacterial populations may switch their lifestyles prill et al., 2015). between free-living and particle-attachment, depending on In addition to those predominant lineages mentioned substrate availability and the surrounding chemical triggers above, there are a couple of bacterial taxa showing evident (Grossart, 2010; D’Ambrosio et al., 2014). To date, one ex- PA or FL preferences. At the family level, these PA- or FL- ception, the genus Scalindua in the Planctomycetes phylum, preferred taxa are indicated well by their odds ratio between which is a known marine chemoautotroph involved in anam- PA and FL fractions. These bacterial lineages are character- mox, is exclusively observed in FL fractions in previous stud- ized by low abundances or occasional occurrences in wa- ies (Fuchsman et al., 2012; Ganesh et al., 2014; Suter et al., ter columns (Fig. 6, Table S1) but a high odds ratio (abso- 2018). However, it is absent from our water columns. lute value) (Fig. 8), indicating their strong preferential diver- gence in the two size fractions. The majority of these lineages 4.4 Archaeal community preferences for PA and FL are recorded consistently regarding their PA or FL prefer- lifestyles ences in previous studies and commonly possess the ability to hydrolyze and utilize complex carbon sources. Although Samples of PA and FL archaeal fractions were also sepa- their abundance is low, these relatively minor populations rated into different groups by statistical analysis (Fig. 3b, can still effectively influence local microhabitats because of Table S3), indicating their different community structures. their high specificity for organics. In contrast, there are still However, because most of OTUs belonged to uncultured ar- some populations which are scarcely reported. For exam- chaeon, it is impossible to assign them into taxonomic lin- ple, the Sva0996 marine group, an actinobacterial group, is eages at a finer level. Thus, the distinction of archaeal popu- retrieved occasionally from marine sediments and the up- lation compositions between PA and FL fractions was un- per ocean (Bano and Hollibaugh, 2002; Wang et al., 2018). noticeable (Fig. 7). The Nitrosopumilales under MGI and Orsi et al. (2016) first found this group prefers the free- MGII are the most abundant taxa in both PA and FL ar- living lifestyle in upper seawater and has the ability to assim- chaeal fractions. The thaumarchaeotal Nitrosopumilales are ilate phytoplankton-derived dissolved protein. Our present one of the most abundant and cosmopolitan chemolithoau- results suggest that the Sva0996 group is flexible in adapt- totrophs in the dark ocean (Konneke et al., 2005) and re- ing to PA or FL lifestyles at the surface seawater because sponsible for much of the ammonia oxidation in this environ- the two lifestyles occur concurrently. Moreover, the distribu- ment for their common metabolism of aerobic ammonia oxi- tion of the Sva0996 group is not restricted only in the upper dation. Corresponding to their autotrophic metabolism, MGI photic ocean, and they can survive in meso- and bathypelagic (including Nitrosopumilales) generally exhibit a free-living seawaters with the significant preference for the free-living preference and are the prevalent archaeal taxa in free-living lifestyle (Fig. 8). However, due to a lack of pure culture or fractions below euphotic zone (Smith et al., 2013; Salazar their genome information, it is not yet possible to elaborate et al., 2015; Tarn et al., 2016). However, different from our on their preferences for PA and FL lifestyles. results, a few studies showed that MGI dominated both the A high proportion of bacterial lineages are revealed to co- PA and FL archaeal populations, and no obvious distinction occur in both PA and FL fractions (Figs. 8 and S7), indicating was observed in abundance and ecotype of MGI (Eloe et al., that a considerable amount of bacterial lineages potentially 2011; Jing et al., 2018). To date, only a few pure cultures have PA and FL dual-lifestyle strategies. On the one hand, of marine MGI, small rods with a diameter of 0.15–0.26 µm, as shown in Fig. 6, a few bacterial lineages co-occur in PA and a length of 0.5–1.59 µm and no flagella were observed and FL fractions at least at one of the same depths with ap- (Könneke et al., 2005; Qin et al., 2014), suggesting that their proximately equivalent abundances. In such cases, their odds occurrence in the PA fraction is not caused by the pore size ratios are close to zero or minor range (Fig. 8), indicating of the filter to fractionate different assemblages. One pos- Biogeosciences, 18, 113–133, 2021 https://doi.org/10.5194/bg-18-113-2021
You can also read