A multi-purpose, multi-rotor drone system for long-range and high-altitude volcanic gas plume measurements
←
→
Page content transcription
If your browser does not render page correctly, please read the page content below
Atmos. Meas. Tech., 14, 4255–4277, 2021
https://doi.org/10.5194/amt-14-4255-2021
© Author(s) 2021. This work is distributed under
the Creative Commons Attribution 4.0 License.

A multi-purpose, multi-rotor drone system for long-range and
high-altitude volcanic gas plume measurements
Bo Galle1 , Santiago Arellano1 , Nicole Bobrowski2,3 , Vladimir Conde1 , Tobias P. Fischer4 , Gustav Gerdes5 ,
Alexandra Gutmann6 , Thorsten Hoffmann6 , Ima Itikarai7 , Tomas Krejci8 , Emma J. Liu9,10 , Kila Mulina7 ,
Scott Nowicki4,11 , Tom Richardson12 , Julian Rüdiger6 , Kieran Wood12 , and Jiazhi Xu1
1 Department  of Earth, Space and Environment, Chalmers University of Technology, 41296, Gothenburg, Sweden
2 Institute
          for Environmental Physics, University of Heidelberg, 69120 Heidelberg, Germany
3 Max Planck Institute for Chemistry, 55128 Mainz, Germany
4 Department of Earth and Planetary Sciences, University of New Mexico, Albuquerque, NM 87131, USA
5 Gerdes solutions AB, 128 41, Stockholm, Sweden
6 Department of Chemistry, Johannes Gutenberg University, 55099 Mainz, Germany
7 Rabaul Volcano Observatory, P.O. Box 386, Rabaul, Papua New Guinea
8 HAB Electronic AB, 34140, Ljungby, Sweden
9 Department of Earth Sciences, University of Cambridge, Cambridge, CB2 3EQ, UK
10 Department of Earth Sciences, University College London, London, WC1E 6BS, UK
11 Quantum Spatial, Inc., Albuquerque, NM, USA
12 Department of Aerospace Engineering, University of Bristol, Bristol, BS8 1TR, UK

Correspondence: Bo Galle (bo.galle@chalmers.se) and Santiago Arellano (santiago.arellano@chalmers.se)

Received: 11 November 2020 – Discussion started: 14 December 2020
Revised: 10 March 2021 – Accepted: 26 April 2021 – Published: 9 June 2021

Abstract. A multi-rotor drone has been adapted for studies         This paper describes the drone platform and the multiple
of volcanic gas plumes. This adaptation includes improved       payloads, the various measurement strategies and an algo-
capacity for high-altitude and long-range, real-time SO2 con-   rithm to correct for different response times of MultiGAS
centration monitoring, long-range manual control, remotely      sensors. Specifically, we emphasize the need for an adaptive
activated bag sampling and plume speed measurement ca-          flight path, together with live data transmission of a plume
pability. The drone is capable of acting as a stable plat-      tracer (such as SO2 concentration) to the ground station, to
form for various instrument configurations, including multi-    ensure optimal plume interception when operating beyond
component gas analysis system (MultiGAS) instruments for        the visual line of sight. We present results from a compre-
in situ measurements of SO2 , H2 S, and CO2 concentrations      hensive plume characterization obtained during a field de-
in the gas plume and portable differential optical absorption   ployment at Manam volcano in May 2019. The Papua New
spectrometer (MobileDOAS) instruments for spectroscopic         Guinea region, and particularly Manam volcano, has not
measurement of total SO2 emission rate, remotely controlled     been extensively studied for volcanic gases due to its re-
gas sampling in bags and sampling with gas denuders for         mote location, inaccessible summit region and high level of
posterior analysis on the ground of isotopic composition and    volcanic activity. We demonstrate that the combination of a
halogens.                                                       multi-rotor drone with modular payloads is a versatile solu-
   The platform we present was field-tested during three cam-   tion to obtain the flux and composition of volcanic plumes,
paigns in Papua New Guinea: in 2016 at Tavurvur, Bagana         even for the case of a highly active volcano with a high-
and Ulawun volcanoes, in 2018 at Tavurvur and Langila vol-      altitude plume such as Manam. Drone-based measurements
canoes and in 2019 at Tavurvur and Manam volcanoes, as          offer a valuable solution to volcano research and monitor-
well as in Mt. Etna in Italy in 2017.                           ing applications and provide an alternative and complemen-

Published by Copernicus Publications on behalf of the European Geosciences Union.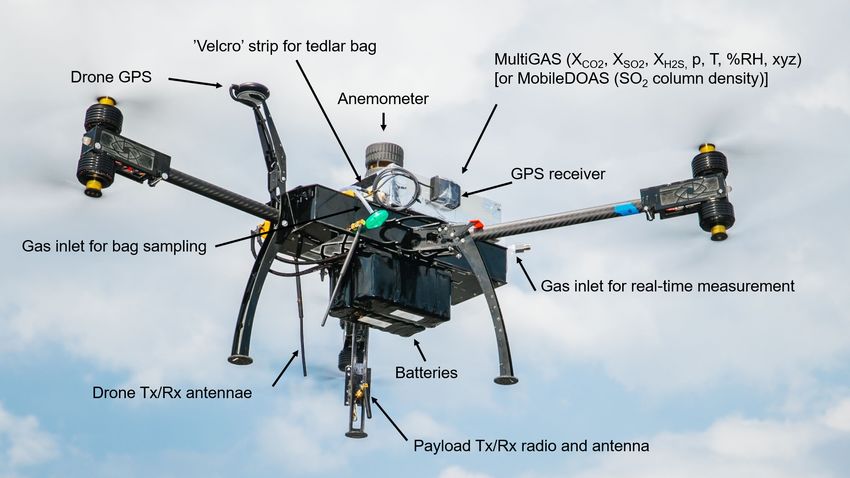
4256                   B. Galle et al.: A drone system for long-range and high-altitude volcanic gas plume measurements

tary method to ground-based and direct sampling of volcanic        al. (2019) described in-plume ash collection at long range us-
gases.                                                             ing fixed-wing vehicles at Fuego volcano (Guatemala), and
                                                                   Syahbana et al. (2019) launched a fixed-wing aircraft with
                                                                   sensors for H2 O, CO2 and SO2 that were essential for a
                                                                   successful assessment of eruptive activity of Mt. Agung in
1     Introduction                                                 2017. This short account is intended to highlight represen-
                                                                   tative studies using drones as platforms for volcanic plume
1.1    The use of drones for studies of volcanic plumes            measurements; more comprehensive reviews, including the
                                                                   broader applications of drones in volcanology, can be found
The use of drones for volcanic plume studies was pioneered         in Villa et al. (2016) or James et al. (2020).
by Faivre-Pierret et al. (1980), who employed a fixed-wing            The above-mentioned studies show different aspects of the
drone equipped with in situ sensors to measure the com-            capabilities of drones to reach volcanic plumes and vents
position of the volcanic plume of Mt. Etna, together with          and perform measurements with various levels of complex-
correlation-spectrometry-derived (COSPEC; Stoiber et al.,          ity. Our study combines multiple aspects of these indepen-
1983) fluxes of H2 O, SO2 , HCl and HF. This was an                dent developments to show that the same unit can be used to
unmanned research aircraft that demanded high expertise            achieve the above-mentioned goals in a single field experi-
and complex field operations. More recently, McGonigle et          ment, with maximum field operability in terms of portabil-
al. (2008) employed an unmanned helicopter equipped alter-         ity and a reduced number of people required for the mea-
natively with a multi-component gas analysis system (Multi-        surement, i.e. usually only two. These features make our ap-
GAS; Aiuppa et al., 2005; Shinohara, 2005) and a portable          proach a practical solution to expand the use of drones for
differential optical absorption spectrometer (MobileDOAS;          routine monitoring of volcanic plumes.
Galle et al., 2003) system to measure the flux of CO2 and
SO2 from the crater rim of Vulcano Island, Italy. This was         1.2   Manam volcano
a proof-of-concept study that demonstrated the utility of a
commercial system to acquire proximal measurements, al-            Manam volcano, located in Papua New Guinea, is the highest
though the vehicle still required a level of piloting expertise.   volcano in the Bismarck arc. The volcano is a 3000 m high
The first use of a multi-rotor platform capable of reaching        composite volcano that rises about 1800 m a.m.s.l. (above
a high-elevation plume was reported by Mori et al. (2016),         mean sea level). The island of Manam is about 10 km in di-
who performed measurements with a multi-rotor drone in the         ameter. Manam has erupted about 40 times since the early
eruptive plume of Ontake volcano and measured SO2 , CO2 ,          1600s. The current phase of eruptive activity began in June
H2 S, H2 O and HCl concentrations, employing a combination         2014 and continues to date of writing, characterized by
of MultiGAS and MobileDOAS instruments. The authors re-            sporadic VEI4 eruptions superimposed on persistent pas-
ported various problems, such as the need to properly shield       sive degassing and minor explosive activity (Venzke, 2013).
electrochemical sensors used in MultiGAS units from elec-          In 2004, an eruption devastated large sectors of the island
tromagnetic interference derived from the drone motors or          and displaced thousands of people to the mainland (Liu et
radio telemetry. Similar work was conducted by Rüdiger et          al., 2020). Manam is currently ranked as one of the top
al. (2018), who measured the plumes of Masaya, Stromboli           10 SO2 and CO2 emitters in the world and degassed about
and Turrialba volcanoes and studied the ageing of halogenic        1 Mt CO2 a−1 during 2005–2015 based on petrological prox-
species using drone-mounted denuder samplers. De Moor et           ies to estimate the CO2 flux (Aiuppa et al., 2019; Fischer
al. (2019) and Stix et al. (2018) used a multi-rotor drone to      et al., 2019).
perform MultiGAS and MobileDOAS measurements and to                   Manam is an archetypical case that represents the chal-
collect plume samples for posterior carbon isotopic specia-        lenges of obtaining detailed information on volcanic plumes
tion analyses. They also measured plume speed by letting           for a large proportion of volcanoes in the world. Indeed,
the drone drift freely with the winds at plume level. Man-         our present knowledge of the composition and flux of gas
don et al. (2019) also used a multi-rotor drone and a sam-         emissions from volcanoes is limited due to the same rea-
pling unit to collect high-temperature filter pack samples of      sons described above: remote location, explosive activity
volcanic gases at White Island volcano, which were charac-         or inaccessible vents and plumes. Although satellite-based
terized geochemically, focusing on the composition of trace        remote-sensing instruments have a large potential to over-
metal aerosols. At Villarrica, comparison of the plume chem-       come these limitations, this approach is in general only
istry measured directly above the lava lake (using a drone-        valid for SO2 because its atmospheric background concen-
mounted gas analyser) and downwind on the crater rim (us-          tration is low compared to the volcanic signal. For most other
ing a traditional ground-based instrument) simultaneously          species, in situ measurements are the only option, when fea-
showed how volcanic plumes can dilute and homogenize               sible. From a total of nearly 1500 Holocene volcanoes listed
over short distances of < 150 m, especially in turbulent crater    in the Smithsonian Institution’s Global Volcanism Program
environments (Liu et al., 2019). Furthermore, Schellenberg et      database (https://volcano.si.edu/list_volcano_holocene.cfm,

Atmos. Meas. Tech., 14, 4255–4277, 2021                                             https://doi.org/10.5194/amt-14-4255-2021
B. Galle et al.: A drone system for long-range and high-altitude volcanic gas plume measurements                             4257

last access: 4 June 2021), about 50 % have a summit alti-         to changing wind conditions and to chase high volcanic gas
tude above 2 km a.m.s.l. Nearly 100 of the Holocene volca-        concentration regions of the plume; (4) high portability due
noes had a flux of SO2 above the Ozone Monitoring Instru-         to its small size, low weight and foldable parts; and (5) sim-
ment (OMI) 1 year-average threshold of about 40 t d−1 (Carn       plicity for operation, usually not requiring expert piloting
et al., 2017) during 2005–2016, of which ∼ 60 % have a sum-       capabilities and no more than two people. The main disad-
mit at 2 km a.m.s.l. or higher. Therefore, a drone-based plat-    vantage of a battery-driven multi-rotor drone in comparison
form for gas sampling or real-time measurement of volcanic        with combustion-powered (i.e. liquid fuel) platforms is a lim-
species in the plume needs to be suitable to reach plumes at      ited flight time, which translates into a reduced time of mea-
high elevation where air density is low and robust enough to      surement in the plume, especially at high altitudes and dis-
sustain harsh measurement conditions such as acidity, cor-        tances. A main disadvantage with the combustion-powered
rosion and turbulence that are encountered in dense regions       platforms related to gas volcanic measurements is the risk of
of the plume. Thus, Manam volcano is a suitable volcano           contamination, especially under hovering conditions.
for demonstrating the challenging use of a drone in volcano
gas monitoring, and for this reason it was chosen as the tar-     2.1.1   Drone feasibility studies and lessons learnt
get of a field campaign (Aerial Based Observations of Vol-
canic Emissions, ABOVE; Liu et al., 2020) to characterize         The development of our drone platform was initially moti-
this strong, yet difficult-to-access, volcanic plume.             vated by the goal to measure the CO2 emission from Bagana
                                                                  volcano, identified as one of the strongest emitters of SO2
                                                                  (Carn et al., 2017), in 2016. The high level of activity of this
2     Methods                                                     remote volcano made it impossible for people to reach its ac-
                                                                  tive vents for sampling, and to reach a plume at summit level
2.1    The drone platform                                         required at least 1600 m of vertical climb above ground. We
                                                                  tested an earlier version of our drone for high-altitude flights,
We designed our system to fulfil the following demands:           in order to assess the maximum altitude achievable with a
    – capability to measure in situ concentrations in excess of   payload of about 1 kg. These tests were performed at the ES-
      a few parts per million (ppm) above ambient for several     RANGE Space Center, which is operated by the Swedish
      components of the plume: CO2 , SO2 and H2 S in real         Space Corporation and located near to Kiruna, in northern
      time;                                                       Sweden. Loaded flights were done in vertical and horizon-
                                                                  tal trajectories to measure the current consumption during
    – capability to measure the flux of all major volcanic        climb (at 5 m s−1 ), hovering, descent (at 4 m s−1 ) and cruise
      species in the plume, SO2 with direct measurement and       (at 8 m s−1 ). Typical currents for these flight modes were
      the other gases after obtaining their ratio against SO2     54, 33, 22 and 30 A (1200, 730, 490, 660 W), respectively,
      and combination with SO2 flux;                              during horizontal wind conditions of ∼ 10 m s−1 . Vertical as-
                                                                  cents up to 1800 m above ground were reached in these tests,
    – capability to collect physical bag samples of the vol-
                                                                  above which radio control signal (at 2.4 GHz) was lost. Us-
      canic plume, for posterior chemical or isotopic analysis
                                                                  ing two batteries, each consisting of 24 Li-ion cells (3.7 V,
      (of carbon or other species) on the ground;
                                                                  2.5 Ah each) connected in a 6S4P configuration, gives a total
    – capability to reach altitudes higher than 2 km above        battery capacity of 20 Ah. For a conservative mean current
      take-off altitude and ranges of the order of 5 km;          consumption of 40 A, this battery capacity allows for a nom-
                                                                  inal flight time of 30 min. After the experience gained from
    – relatively low-cost, low-expertise threshold to operate     this study and field studies in Bagana and Ulawun (North-
      and high field robustness and portability.                  ern Hemisphere (NH) autumn 2016), Etna (NH spring 2017)
   With these demands in mind, we developed the following         and Langila (NH autumn 2018) volcanoes, the main lessons
concept: a multi-rotor drone platform with modular payloads       learnt were as follows.
for different types of measurement. We chose a hexa-copter          – When ascending and moving horizontally, it was found
in Y-shape configuration, the Micro model developed by                that energy consumption could be reduced if the rise
Sky-Eye Innovations in Sweden, which we dubbed “Munin”.               and forward motion were balanced in an optimal way,
Among the advantages of a multi-rotor configuration, we in-           as compared to moving only in one direction at a time.
clude (1) the possibility to hover, which is required for op-         This is because a considerable horizontal component in
timal positioning of the drone in the plume, for collecting           the movement gives a lift that reduces the energy con-
samples in a bag from a confined region and for measur-               sumption for maintaining the vertical position. An ad-
ing during a time long enough to guarantee a good signal;             ditional advantage is that the drone then flies in undis-
(2) the possibility to perform measurements in the vertical           turbed air with less turbulence compared to a clean ver-
direction, required to, for example, determine the concentra-         tical movement. When the drone flew into clouds, en-
tion profile in the plume; (3) high manoeuvrability to adapt          ergy consumption increased by about 50 %. On descent,

https://doi.org/10.5194/amt-14-4255-2021                                            Atmos. Meas. Tech., 14, 4255–4277, 2021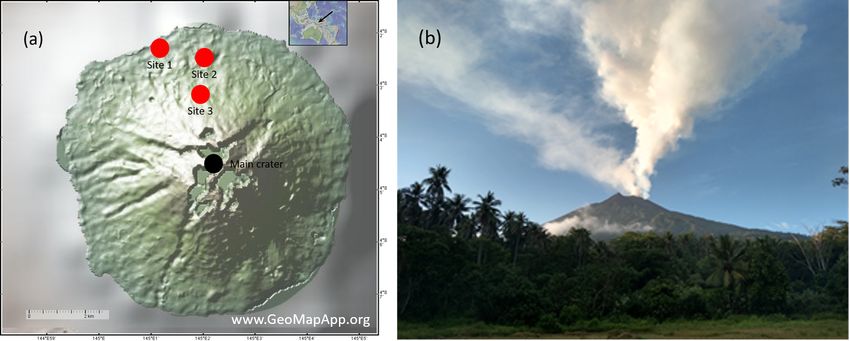
4258                  B. Galle et al.: A drone system for long-range and high-altitude volcanic gas plume measurements

    it was found that stability deteriorated when descend-        Based on these experiences, we modified the standard
    ing through clouds; see Fig. 1. Therefore, we avoided        model of our platform in the following ways:
    clouds as much as possible during flights. In the later
    part of the campaign, this was facilitated by using an on-     – Change of operative system. We adopted an open-
    board camera and flying with FPV (first-person view).            source navigation module PixHawk V4 with its own
    The drone’s angle through the air, the tilt related to           power distribution card in order to overcome typical re-
    the ratio between horizontal and vertical motion, also           strictions in altitude and distance of other commercially
    proved to be of great importance for energy consump-             available solutions, as well as to access all information
    tion. Both during ascent and descent, energy consump-            of the flight logs for posterior analysis.
    tion could be minimized by considering and taking ad-
                                                                   – Modifications in the frame design. These modifications
    vantage of the wind’s strength and direction. On the pre-        include addition of a larger payload-carrying platform,
    vailing conditions at Manam, a tilt of 11◦ from the hori-        the use of more robust motors with race drone ESC
    zon was found to be optimal for the decent.                      (electronic speed control) that improves the manoeuvra-
  – The volcanic plumes were typically found to move both            bility and propellers with a larger diameter than are typ-
    horizontally and vertically within a short time span. In         ically standard for a drone of this size (45 cm). We also
    order to be able to sample the plume with in situ meth-          placed the batteries below, instead of on top, of the main
    ods, it is crucial that the plume centre, having the dens-       frame to gain further stability. The drone has a triple in-
    est gas concentrations, can be reached. Thus it is impor-        ertial measurement unit (IMU), dual compass and one
    tant to be able to receive real-time information on the          GPS and was provided with two 6S4P 10 Ah batteries.
    ground of a relevant plume tracer (SO2 concentration)
    and to be able to control the remote drone location from       – Control board. Jeti DC16 was used as a pilot controller,
    the ground and thereby adapt the flight path of the drone        and for transmission a Crossfire (TBS Crossfire Diver-
    in response to this real-time data stream.                       sity Nano RX) was used. A tablet was connected to
                                                                     the Crossfire for flight planning and for monitoring the
  – Electrical interference from motors and telemetry in-            telemetry.
    fluenced the noise level of the electrochemical sensors.
    Thus shielding and location of power and data cables, as       – Increased telemetry range. We replaced the common
    well as location of antennas, were important (see hard-          2.4 GHz by a 900 MHz radio link and used a high-gain
    ware modifications detailed below).                              directional antenna for ground control. Figure 2 shows a
                                                                     photo of the drone and its main modular payloads. Tech-
  – It was found that the time needed for switching be-              nical specifications of our drone are provided in Table 1.
    tween different payloads could be considerably reduced
    by changes in the drone frame and payload designs              – Electrical interference. We used a shielded metal box
    (balance, power connection, data access, telemetry).             for the electrochemical sensors and tested the optimal
    The batteries were mounted under the frame and could             location of power and data cables and antennas to mini-
    be changed with a “click” locking. This enabled fast             mize electrical interference on these detectors.
    switching of batteries and improved the balance, es-
    pecially at take-off and landing. The payloads were            – Camera. During the later part of the campaign at
    mounted on individual plates that were locked in place           Manam, it was found to be useful to include a cam-
    on the drone platform with a click lock similar to what          era running in FPV (first-person view) mode. The main
    was used for the batteries and provided by the drone             reason for this was that it facilitated the avoidance of
    manufacturer. This enabled the payloads to be pre-               clouds and thereby reduced energy consumption. It also
    balanced, and no further balancing of the drone was              improved the manoeuvrability as it gave the pilot ac-
    needed after replacement of payload. A special power             cess to critical parameters in real time within their view
    output on the drone gave the payloads power and access           (goggles).
    to the drone-mounted telemetry. This power output was
                                                                    With these modifications we have been able to reach
    always turned on to make it possible to do pre-flight and
                                                                 heights of 2000 m above take off position (equivalent to ab-
    post-flight operations on the payload instrument without
                                                                 solute altitudes of up to 3700 m a.m.s.l.) and a range of nearly
    turning on the main drone electricity to save power.
                                                                 5 km. Although we have limited the total flight time to 30 min
  – Access to the drone flight logs were found to be useful      under normal conditions (i.e. those conditions resulting in
    for post-flight analysis of power consumption with dif-      normal current consumption), with favourable conditions and
    ferent flight modes, extraction of wind information and      flight piloting strategies, a flight time of 35 min could be
    backup data of basic parameters like pressure, temper-       achieved within a safe margin. In the following sections,
    ature and position. An example of data from the flight       we describe each of the modular payloads and measurement
    log is given in Fig. 1.                                      strategies compatible with this drone platform.

Atmos. Meas. Tech., 14, 4255–4277, 2021                                           https://doi.org/10.5194/amt-14-4255-2021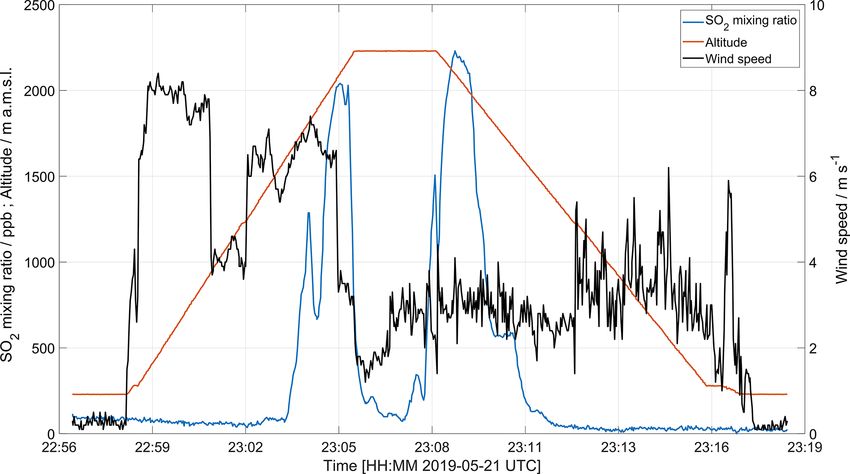
B. Galle et al.: A drone system for long-range and high-altitude volcanic gas plume measurements                                           4259

Figure 1. Flight data from the drone flight shown in Fig. 9. The upper panels show time series of yaw, pitch and roll angles, the thrust
(percentage) and the altitude of the drone. Notice the high variability of the parameters associated with acceleration, hovering and interference
from clouds.

Figure 2. Photo of the multi-rotor drone with modular payloads. The MultiGAS unit includes in situ sensors for gas composition (XA –
concentration of species A, p – pressure, T – temperature, %RH – relative humidity, xyz – tilt coordinates), a gas-sampling unit and an
anemometer. The MobileDOAS is used for the remote sensing of the gas flux. The modules are clamped to the drone at balanced position.
The battery pack is placed below the drone chassis to lower the centre of gravity of the system. Flight and sensor data are telemetered in real
time (photo courtesy of Matthew Wordell).

https://doi.org/10.5194/amt-14-4255-2021                                                       Atmos. Meas. Tech., 14, 4255–4277, 2021
4260                    B. Galle et al.: A drone system for long-range and high-altitude volcanic gas plume measurements

Table 1. Technical specifications of the hexa-copter.

          Model                                         SkyEye Innovations Micro
          Nickname                                      Munin
          Configuration                                 Y6 multi-rotor (three pairs of co-axial, counter-rotating rotors in tandem)
          Navigation system                             PixHawk model V4
          Remote control                                Jeti DC16
          Camera system                                 OcuSync 2.0
          Drone size, folded (D × H × W ) (cm)          80 × 20 × 23
          Frame weight, without batteries               3.0
          Drone weight, including batteries (kg)        4.5–6.0
          Maximum payload (kg)                          2.0
          Maximum combined thrust (N)                   120
          Battery voltage (V)                           22.2 (6 × 3.7)
          Battery capacity (Ah)                         20 (2 × 10)
          Control range (km)                            5
          Typical flight time (1 kg payload) (min)      30
          Maximum climb speed (m s−1 )                  5
          Maximum descent speed (m s−1 )                4
          Maximum cruise speed (still wind) (m s−1 )    10

2.2    In situ measurements of plume speed                              time as other measurements in the plume are conducted. The
                                                                        anemometer is integrated with the MultiGAS unit, described
                                                                        below.
When determining the gas emission rate – using methods
such as MobileDOAS (Galle et al., 2003), ScanDOAS (Ed-                  2.3   MobileDOAS for remote measurement of SO2
monds et al., 2003) or COSPEC (Stoiber et al., 1983) – infor-                 emission rate
mation about the wind speed at plume height is critical. Since
volcanic plumes are often located at several kilometres’ alti-          Since 2002 an instrument referred to as MobileDOAS (Galle
tude, and the measurements are conducted in an area rela-               et al., 2003; Johansson, 2009) has been used increasingly
tively close to a major topographic structure, acquiring rep-           to replace the previously used COSPEC instrument (Stoiber
resentative measurements of plume speed is challenging. The             et al., 1983) for measurements of volcanic SO2 gas emission
use of atmospheric models (such as operational databases                rate. Both MobileDOAS and COSPEC instruments use the
provided by NOAA or ECMWF) is an alternative approach;                  diffused UV solar radiation as a light source for the deter-
however, these models are usually coarse in horizontal, ver-            mination of the total column of SO2 above the instrument,
tical and temporal resolutions, and thus validation of these            which is calculated using absorption spectroscopy. During a
modelled wind data by local measurements is valuable. A                 typical measurement, the instrument is moved in such a way
drone can offer such in situ validation.                                that it passes under the gas plume in a direction close to per-
   We have applied two different methods for plume speed                pendicular to the plume transport direction while simultane-
measurements using the drone: drone drift and anemometer.               ously recording spectra and GPS location. Thus, by correct-
In the drone drift method, the drone is first positioned at the         ing for deviations from traversing the plume perpendicularly
altitude of the plume, and then the GPS position-locking is             using GPS data and using DOAS evaluation algorithms to
deactivated. The drone is thus left free to drift with the hor-         derive SO2 total columns along the track, the total number
izontal wind and, after an initial lag time of less than 1 min,         of SO2 molecules in a cross-section of the gas plume can be
the drone reaches the local wind speed. The movement of the             derived. This quantity is then multiplied by wind speed at the
drone is logged with a separate GPS receiver, from which the            centre of mass of the plume – i.e. plume speed – to derive the
local wind speed can be determined. Additionally, the actual            gas emission rate.
airspeed can also be monitored in real time through the infor-             The main sources of error in these measurements are “dilu-
mation sent to ground control, derived from GPS data. In the            tion” of the absorption signal due to simultaneous collection
second method, a small and lightweight anemometer was in-               of skylight that has been either transmitted through the plume
stalled on the drone, logging the total velocity experienced by         or scattered from outside of the plume (Millán, 1980; Mori et
the drone (wind velocity + drone velocity). With the drone              al., 2006) and limited knowledge of the plume speed (Galle
held in a fixed position close to the plume, the plume speed            et al., 2010).
is thus obtained. The advantage of this method over the drone
drift approach is that plume speed may be derived at the same

Atmos. Meas. Tech., 14, 4255–4277, 2021                                                    https://doi.org/10.5194/amt-14-4255-2021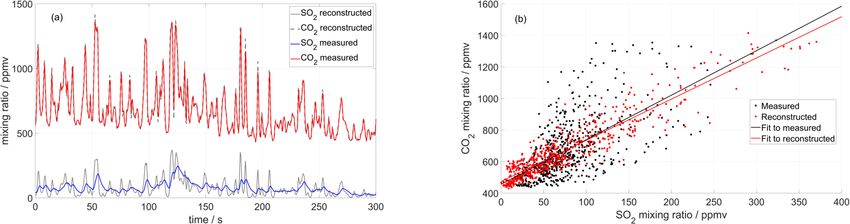
B. Galle et al.: A drone system for long-range and high-altitude volcanic gas plume measurements                           4261

                                                                 other volcanic species, such as CO2 and H2 S, direct measure-
                                                                 ments must be conducted within the plume itself; high atmo-
                                                                 spheric background concentrations or weak optical absorp-
                                                                 tion of these species preclude robust detection by remote-
                                                                 sensing methods. The most common method used for this is
                                                                 multi-component gas analyser systems (MultiGAS; Aiuppa
                                                                 et al., 2005; Shinohara, 2005). MultiGAS-type instruments
                                                                 generally consist of several small sensors (typically elec-
                                                                 trochemical or optical), with low power consumption, con-
                                                                 nected to a micro-computer and sometimes a data link for
                                                                 real-time data transfer. The instrument is typically installed
                                                                 in a gas-exposed location (e.g. a crater rim), often proxi-
                                                                 mal to the vent location. Although its installation may be
                                                                 labour-intensive and sometimes risky, this method is gen-
                                                                 erally straightforward. However, on many volcanoes, ap-
                                                                 proaching the summit area would represent an enormous
                                                                 risk – this is the situation at Manam. In such cases, perform-
Figure 3. Schematic layout of the MobileDOAS instrument.
                                                                 ing the in-plume measurements using a drone is an attrac-
                                                                 tive possibility. An obvious requirement here is the ability of
   MobileDOAS measurements from a drone platform offer           the drone to reach high altitude as well as having long en-
several advantages compared to traditional approaches (e.g.      durance. This is emphasized further by the fact that many
Rüdiger et al., 2018; De Moor et al., 2019): regardless of in-   of the sensors used have slow response times, while the gas
frastructure (roads) and topography, traverses can be made       concentrations (especially close to the vent where the signal
in a direction perpendicular to the plume direction. Measure-    is stronger) may vary quickly within seconds due to dilution
ments can be made at an elevated altitude, thus reducing the     and turbulent wind conditions. Under these conditions, it is
effects of light dilution, and plume speed can be determined     preferable to expose the sensors to the volcanic gas for as
reasonably accurately by the methods described in Sect. 2.2.     long a sampling duration as possible – ideally at least sev-
   General details of the MobileDOAS hard- and software          eral minutes. Short time fluctuations in concentration and
are given in Johansson et al. (2009). Details specific to our    plume location also imply that the ability to monitor a gas
drone-mountable version of the instrument are provided in        tracer (such as SO2 ) in real time is desirable to “chase” high-
Table A1 (Appendix A). A schematic view of the Mobile-           concentration sites. This is of course not guaranteed when
DOAS instrument is shown in Fig. 3.                              the drone is sent in autopilot, unless an adaptive flight rou-
   The MobileDOAS instrument is built into a plastic case        tine based on a plume tracer is implemented.
with clamps adapted to a platform on the drone in a bal-            MultiGAS units combine information from different sen-
anced position, and it is powered from a 12/5 V power cable      sors to determine the mixing ratios of different species. In our
from the drone that was permanently active. Thus, the Mo-        present system, these quantities are determined according to
bileDOAS could be installed on the drone platform, and the       the following processes:
MobileDOAS software could be started up, or data from the          – For SO2 and H2 S. The target gas is pumped into a cham-
MobileDOAS could be backed up, without the main drone                ber to which the electrochemical sensors are exposed.
power turned on, thereby saving battery power. While the             The signal generated by the electrochemical effect from
MobileDOAS software is active, a stream of basic informa-            an electrode exposed to the gas of interest is subtracted
tion (time, position, SO2 column density) is transmitted in          from the signal of a reference electrode inside the sys-
real time via an independent radio link from the instrument.         tem This differential signal is proportional to the gas
These real-time data help the pilot to guide the drone and en-       mixing ratio. The proportionality is linear within a cer-
sure a complete traverse of the plume. The full traverse can         tain range and depends to some degree on temperature,
be visualized upon landing, by connecting an external com-           pressure and the concentration of interfering species.
puter to the instrument computer running MobileDOAS.                 These proportionality and disturbance factors are deter-
                                                                     mined by calibration.
2.4   MultiGAS for in situ measurement of gas
      composition                                                  – For CO2 .
MobileDOAS and ScanDOAS are used to obtain SO2 – and                    – The same gas sample is passed through a cavity il-
under some circumstances also BrO (Lübcke et al., 2014) –                 luminated by two infrared beams with wavelengths
emission rates from the ground using remote-sensing tech-                 centred in and out of an absorption band of CO2 .
niques. However, to obtain the relative concentrations of

https://doi.org/10.5194/amt-14-4255-2021                                           Atmos. Meas. Tech., 14, 4255–4277, 2021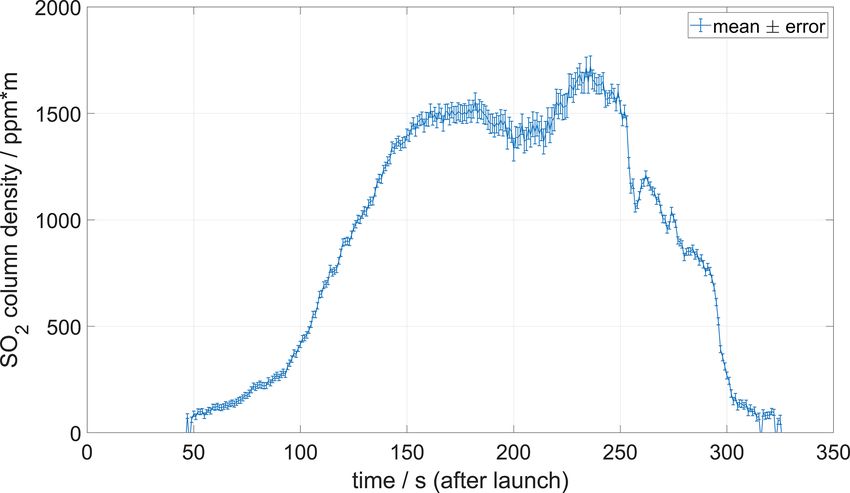
4262                   B. Galle et al.: A drone system for long-range and high-altitude volcanic gas plume measurements

       – Using Beer–Lambert’s extinction law, the local             gas for a time long enough to achieve the correct amplitudes.
         concentration of CO2 is determined.                        Our system fulfils these two criteria: the sensors have simi-
       – To get the mixing ratio, further corrections are           lar response characteristics, and the MultiGAS incorporates
         needed for temperature, pressure and relative hu-          a bag and pump unit that makes it possible to take samples of
         midity, which should be established by calibration.        the plume and then expose it to the sensors for several min-
                                                                    utes i.e. on the ground (see Sect. 2.5). In this mode the gas
   For the case of H2 O, the mixing ratio can be derived from       from the Teflon bag is circulated through the detectors in a
measured relative humidity, pressure and temperature, fol-          closed loop, thereby exposing the detectors for the constant
lowing known thermodynamic laws (see Appendix B). If                gas concentration in the sample for several minutes. Another
the measurement of such variables is done inside the sam-           advantage here is that any possible losses, i.e. wall effects,
pling circuit, the H2 O mixing ratio of the sample can be de-       could be monitored and compensated for. This method was
termined simultaneously to the other species. Our system,           however not tested in the actual field campaign because the
however, measures these variables only inside the instru-           limited gas samples were instead used for isotopic composi-
ment box, so the mixing ratio is representative of ambient          tion analyses.
gas passively diffusing in the interior of the unit; H2 O there-       A detailed analysis of the problems encountered when
fore varies differently than the other species as it is deter-      combining data from sensors with different response times
mined from outside of the closed system. The schematic lay-         is given in the following section.
out of the MultiGAS instrument used in this study is shown
in Fig. 4, and technical specifications of the sensors are given    2.4.1   Correction of time-response differences in
in Appendix A.                                                              MultiGAS sensors
   Data from this unit are transmitted through an independent
data link and visualized on the ground using self-developed         When measurements are made with combined data from sev-
software used for tracking emissions from ships (Beecken            eral sensors having a different response time, e.g. measure-
et al., 2015; Mellqvist et al., 2018). This visualization is the    ments of the ratio CO2 /SO2 using a MultiGAS instrument,
basis to fine-tune the position of the drone for the sampling       great care must be taken.
of more concentrated regions of the plume.                             In this measurement procedure, three characteristic times
   To obtain the mixing ratios representative of the volcanic       are important:
emission, it is necessary to correct for the contribution from
                                                                      – the time of variability in gas concentration, tv ;
the same species present in the background atmosphere. Ide-
ally, such a measurement should be done at similar ambient            – the sampling time, ts ;
conditions (i.e. pressures, temperature) to those expected in-
side the plume, unless the corrections for different conditions       – the response time of the sensor, t90 (meaning the time to
are known precisely.                                                    reach 90 % of the true signal for a step change in con-
   When two sensors have different response time character-             centration, higher than the detection limit).
istics, the signals they measure will have different amplitude
and shape and be time-shifted with respect to the input sig-           The first characteristic is determined by variability in
nals depending on the frequency content of the input. This          emission, variability caused by local turbulence at the point
“distortion” of the input signals can be large when a rapidly       of measurement and variability caused by relative transit of
fluctuating signal is measured for a short time; i.e. the instru-   the drone with respect to the plume. The second characteris-
ment basically records only the transient signal. This could        tic is determined by the sampling rate of the instrument and
be the case with MultiGAS measurements on a flying drone            the time required for exchange of the gas sample inside the
in a turbulent plume. These effects must be considered to           measurement cavity. By the third characteristic, we mean the
reproduce the input signal and subsequently analyse it (for         dynamic response time of the sensor. Because sensors often
example, taking the ratio of two signals such as CO2 /SO2 ).        operate according to different principles, the sensor response
   However, if only the ratio of the signals, and not their in-     times are usually different; this may introduce artefacts in the
stantaneous amplitudes, is sought, it is enough that the dy-        mixing ratios, which would then result in wrong molar ratios
namic constants are similar. Alternatively, the true ampli-         for the different species, as discussed by Aiuppa et al. (2005),
tudes may be obtained if the input signals have variations          Shinohara (2005), Roberts et al. (2017) and Liu et al. (2019).
in timescales longer than the characteristic response times of         Drone MultiGAS measurements are normally performed
the sensors, and the measurement is taken for a time longer         by hovering in a region of high gas concentration. This means
than the response time of the sensor. This can be achieved          that the relative motion of gas parcels is mostly determined
in two ways, either by selecting carefully the characteristics      by local turbulence. Farther away from active vents, concen-
of the sensors or by exposing them to a near-constant signal.       tration heterogeneities are largely smoothed out, but the sig-
To achieve the latter, a practical solution is to take a sam-       nal is very weak. Therefore, strong signals are usually subject
ple of the gas and then expose the sensors to the sampled           to high variability.

Atmos. Meas. Tech., 14, 4255–4277, 2021                                              https://doi.org/10.5194/amt-14-4255-2021
B. Galle et al.: A drone system for long-range and high-altitude volcanic gas plume measurements 4263
Figure 4. Schematic layout of the MultiGAS instrument.
Our MultiGAS intakes a flow of 0.5 L min−1 ponent dominate, and oscillatory behaviours are neglected.
(∼ 10−5 m3 s−1 ), which means that for a measurement For such sensors, the dynamical response can be modelled
cell section of ∼ 10 cm2 , the flow speed is in the order of through the differential equation (e.g. Pallas-Areny and Web-
0.01 m s−1 . This results in a negligible dynamic pressure ster, 1991):
in relation to atmospheric pressure inside the measurement
cavity. The relation between the sampling and variability dy(t)
time is determined by the Nyquist criterion. The instrument x(t) = a0 y(t) + a1 , (1)
dt
would only be able to capture signals with frequency fluctu-
ations lower than half the sampling frequency accurately (in where x(t) is the time-varying input signal (e.g. mixing ra-
practice, a much higher sampling frequency is required). Our tio of SO2 ), y(t) is the time-varying measured signal (e.g.
MultiGAS takes a sample every second, so variations with voltage of the SO2 electrochemical sensor), dy/dt is the first
frequencies higher than 0.5 Hz cannot be properly captured. derivative of the measured signal with respect to time, and
Such dynamic changes in plume composition are assumed a0 and a1 are constants identified with the response time
to be improbable for most typical scenarios. The CO2 sensor (τ = a1 /a0 ) and static sensitivity of the sensor (K = 1/a0 ).
has a cavity with dimensions of 153 mm × 30 mm × 36 mm; The dynamical time-response factor defines a delay in the
i.e. the sampling volume of 0.17 L is exchanged in a time response of the measured signal in relation to the input sig-
of about 20 s. For the electrochemical sensors, the response nal. If the input signal is a step function, one usually relates
time depends on the transport through the membrane, this factor by the time required for the sensor to achieve a
dissolution in the electrolyte, reaction time and sampling. certain level of the signal, for example 90 %. Periodical sig-
Thus, differences in sensor geometry and measurement nals will be affected by an error in amplitude and by a shift
principle produce differences in response times, even if the caused by the frequency response of the sensor. The steady-
gas flow rate remains constant (i.e. with the same pump). state amplitude response to a signal of angular frequency ω
The response time depends on the dynamic properties of is given by k/[(ωτ )2 +)]0.5 . The shift is given by tan−1 (ωτ ).
the sensor and the nature of the signal. For first-order sensors, An arbitrary signal can be represented by a Fourier sum of
only one energy-storing and one energy-dissipating com- periodical signals, and for linear systems, the response of the
https://doi.org/10.5194/amt-14-4255-2021 Atmos. Meas. Tech., 14, 4255–4277, 20214264 B. Galle et al.: A drone system for long-range and high-altitude volcanic gas plume measurements
sensor is obtained by superposition of the responses to the This method is quite general for the correction of the dy-
monochromatic signals (Pallas-Areny and Webster, 1991). namic response of the sensors. It obviates time-consuming
We correct our signals based on these conditions: and frequent characterization of the response time in a labo-
ratory and accounts for the fact that the sensors may change
– Sensors of the MultiGAS instrument can be accurately their dynamic characteristics when exposed to different con-
modelled as first-order systems. ditions in the field, relative to the lab. Of course, calibration
is still desirable to check for possible changes in offset and
– The input signals of different sensors measured at the sensitivity of the sensor over time.
same time are highly correlated.
– Variability of the gas concentration occurs at a charac- 2.5 Bag sampling unit for gas composition and isotopic
teristic time much shorter than the exchange time in the analysis
sensor.
In some cases, real-time measurements in the gas plume
– The total measurement time is much larger than the ex- are not possible, either because longer measurement time
change/diffusion time in the sensor. is needed to reduce the signal-to-noise ratio or because the
measurement requires an analytical technique that is more
The first assumption is supported by the design and lab- complex than can be performed in situ on a drone platform.
oratory characterization of the electrochemical and optical In such cases, acquiring a sample of the plume gas using a
sensors. The second assumption requires that the molar ra- drone carrying a sample bag and a pump may be a viable op-
tio of different species is constant and homogeneous within tion. For successful sampling of the most concentrated region
the time of measurement. Sampling a heterogeneous mix- of the plume, real-time data transmission of a plume tracer –
ture would produce different ratios at different times, com- such as SO2 – to the drone operator on the ground (in combi-
plicating both the measurement and the interpretation of the nation with manual flight control to respond accordingly) is
results. In volcanic emissions, drastic changes in molar ra- advantageous; however, this can be technically challenging,
tios within minutes are unlikely if the gases come from the especially for long-range flights.
same source. But if the plume mixes emissions from different Measurement of the carbon isotope composition of vol-
vents, or if large local heterogeneities affect the chemistry or canic CO2 is a key example of an application that re-
condensation of different species unequally (e.g. for plumes quires in-plume sample collection. Carbon isotope analyses
with heterogeneous concentration of ash), changes in gas are performed using instrumentation such as isotope ratio
molar ratios can occur, even on short timescales (Kelly et al., mass (IRMS) spectrometers (Chiodini et al., 2011; Sharp,
2013). The third condition ensures that enough information 2007), bench-top infrared spectroscopic analyses (Fischer
is available for finding a unique solution because the high and Lopez, 2016; Rizzo et al., 2014; van Geldern et al.,
variability in the signal is required for the cross-correlation 2014) or cavity ring down spectroscopy (Lucic et al., 2015).
analysis, and the fourth condition is required to reduce the While the bench-top spectroscopic techniques are much
error caused by sampling over different exchange/diffusion more portable than IRMS systems and do not require a vac-
times of the sensors. uum, they still depend on a stable 110 or 220 V power source
Based on the first assumption, our method starts with and pressurized calibration and dilution gases – facilities that
the two measured signals (e.g. yCO2 (t) and ySO2 (t)) and are not always available in remote field locations. The spec-
constructs from them their derivatives (dyCO2 (t)/dt and troscopic techniques generally require a sample volume of
dySO2 (t)/dt) by simple numerical approximation, which about 300 mL at atmospheric pressure and temperature. This
works fine as long as the sampling time is short (i.e. as long can be accomplished by directly placing the instrument in
as large variability in timescales shorter than the sampling the volcanic plume (Rizzo et al., 2014, 2015) or by collect-
rate is not expected). Based on the second assumption, we ing a plume or fumarole sample in an appropriately sealed
expect that a simple scaling exists between the two input sig- and non-reactive container (i.e. Tedlar sample bags) for sub-
nals, defining a constant ratio r (r = xCO2 (t)/xSO2 (t)). Now sequent analyses by spectroscopy (Fischer and Lopez, 2016).
we simply iteratively vary the time-response factors of the The application of drones for this purpose is advantageous
two signals and look for the combination that maximizes the over the use of helicopters due to the lower operational cost
cross-correlation between the reproduced inputs according and smaller scale logistics, as well as avoiding sample con-
to Eq. (1) (see Appendix B for an implementation of this tamination by gases present in the helicopter exhaust (Fischer
method). This method works best for strongly fluctuating and Lopez, 2016).
signals, rich in information for the correlation analysis. Fig- During our fieldwork at Manam volcano, we used two pay-
ure 5 shows an example of this method applied to field mea- loads to sample the plume. In the first, we equipped our drone
surements of a very dynamical signal obtained in the crater with four Tedlar sampling bags. Each bag was connected to
of Tavurvur volcano (Papua New Guinea) in 2016 using the a small rotary pump triggered by a timer. The drone operator
Sunkist instrument. positioned the drone in the plume, at which point the sam-
Atmos. Meas. Tech., 14, 4255–4277, 2021 https://doi.org/10.5194/amt-14-4255-2021B. Galle et al.: A drone system for long-range and high-altitude volcanic gas plume measurements 4265
Figure 5. (a) Time series of CO2 and SO2 mixing ratios measured inside the crater of Tavurvur volcano in September 2016 using a Multi-
GAS unit (Arellano et al., 2017). The two signals are reconstructed iteratively until an optimal correlation is found between them. For this
instrument, the SO2 sensor was slower than the CO2 sensor and could not capture all rapid fluctuations. (b) After the correction, the corre-
lation between the two series is higher, and the dispersion of the scatter plot much lower. But most importantly, the CO2 /SO2 molar ratio
changes from 2.8 ± 0.3 to 2.6 ± 0.08 (± of 95 % CI), and the background CO2 (inside the crater) changes from 457 ± 26 to 473 ± 9 ppm.
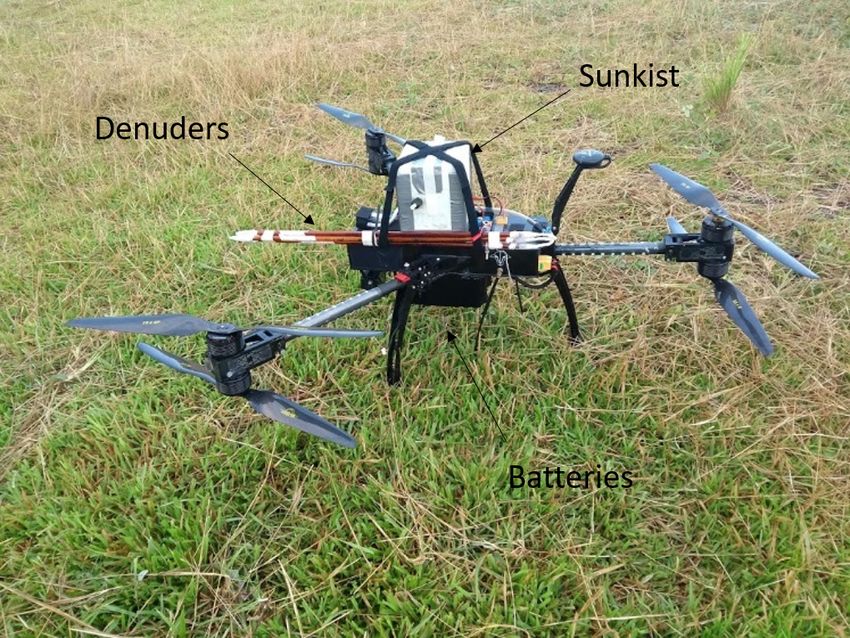
ple was collected by a timed trigger. The duration of sam- 2.6 Plume sampling of halogens using a denuder
ple collection was approximately 45 s at an approximate flow system
rate of 1 L min−1 . A valve system was not necessary because
the pump also functioned as a valve once it stopped pump-
ing. The second system was similar, but here the pump (at Besides H2 O, CO2 and SO2 , halogens are among the ma-
0.5 L min−1 ) could be remotely controlled, and only one Ted- jor constituents of volcanic emissions (Textor et al., 2004).
lar bag was used. After return of the samples to the ground, The discovery of bromine monoxide (BrO) in volcanic
the valves on the Tedlar bags were closed, and the samples plumes and the correlation of the simultaneously gained
were analysed by a Delta Ray infrared spectrometer. In addi- BrO/SO2 ratio with volcanic activity by automatized instru-
tion to collecting samples from the plume, a clean air sample ments (Lübcke et al., 2014) made BrO/SO2 a promising vol-
was collected upwind and at the same elevation as the plume. cano monitoring tool. To utilize BrO/SO2 ratios for monitor-
In principle, the analytical procedure followed that described ing volcanic activity, an understanding of ongoing bromine
in Fischer and Lopez (2016). Due to the remote location of chemistry in the plume is essential. For a detailed discus-
Manam island and the difficulty encountered when obtaining sion on bromine chemistry in volcanic plumes, see Gutmann
calibration and CO2 -free air gases in-country, we developed et al. (2018) and references therein. Besides BrO, no other
an air purification system that utilized a bicycle pump and bromine species can be detected by remote-sensing instru-
CO2 scrubber, Sulfolime™, obtained from PP systems Inc., ments. Therefore in situ methods have been developed re-
to produce pressurized CO2 -free air. This system allowed the cently for the determination of reactive bromine (BrX) and
production of essentially unlimited amounts of CO2 -free air hydrogen bromide (HBr) (Rüdiger et al., 2017; Gutmann
with CO2 contents of < 0.7 ppm, as measured using the Delta et al., 2020, respectively). The new methods reveal the down-
Ray. The calibration gas was pure CO2 obtained from a lo- wind conversion of released HBr to other bromine species
cal distributor. Prior to analysis, the C isotope composition of with time in a volcanic plume.
this gas was not known, and we therefore collected a sample Bromine speciation can be measured using gas diffu-
of this gas to analyse back in the Volatiles Laboratory at the sion denuder systems. Gaseous molecules are derivatized
University of New Mexico using the Delta Ray and standard in situ by an organic coating at the inner walls when
calibration gases. Therefore, we were not able to determine pumped through gas diffusion denuders. Analysis of bromine
the exact C isotope compositions of the samples in the field speciation has been carried out for two different bromine
but were able to adjust the pure CO2 calibration gas to the species. HBr has been determined by 5,6-epoxy-[1,10]-
concentration of CO2 measured in the bag sample by setting phenanthroline-coated denuders (Gutmann et al., 2020), and
the corresponding CO2 concentration in the Delta Ray soft- BrX (such as Br2 , BrCl, HOBr) and reactive chlorine species
ware. We then retroactively corrected all our measurements (ClX) were detected by 1,3,5-trimethoxybenzene-coated de-
using the values obtained for the field calibration gas. nuders (Rüdiger et al., 2017). Samples were analysed by
high-performance liquid chromatography or gas chromatog-
raphy coupled to mass spectrometry, at the University of
Mainz, Germany, after returning from the field.
For the detection of SO2 a compact MultiGAS-type sys-
tem called “Sunkist” (Rüdiger et al., 2018) was used, which
https://doi.org/10.5194/amt-14-4255-2021 Atmos. Meas. Tech., 14, 4255–4277, 20214266 B. Galle et al.: A drone system for long-range and high-altitude volcanic gas plume measurements
in the laboratory and are, therefore, calculated for each sam-
ple separately.
3 Results
3.1 Manam field-campaign conditions
A field campaign was conducted at Manam volcano in
Papua New Guinea during 19–27 May 2019. This field cam-
paign utilized all above-mentioned measurement and sam-
pling techniques and was the culmination of several previous
campaigns during which parts of the system had been exten-
sively tested and modified in response to lessons learnt (see
Sect. 2.1.1). The meteorological conditions during the cam-
paign at Manam were characterized by low wind speeds and
Figure 6. Drone-based denuder sampling setup and SO2 sensor varying wind direction. Volcanic gas was emitted from two
(Sunkist). different locations close to the summit, the Main Crater and
the Southern Crater (Liu et al., 2020). The Southern Crater
was the most active, with incandescent lava visible within the
contained an electrochemical CiTiceL 3MST/F sensor. The crater and emanation of a persistent strong gas plume with
calibration of the electrochemical SO2 sensor followed Arel- high buoyancy (2–3 km above the crater rim). In contrast, the
lano et al. (2017). The Sunkist also measures ambient pres- Main Crater showed more fumarolic degassing, generating a
sure and temperature. Since the thermometer is inside the iso- weaker plume with reduced buoyancy (see Fig. 7). Due to the
lated box and is affected by running instruments, only tem- low wind speed and varying wind direction, during some pe-
peratures at the beginning of the flight were considered. The riods there was a buildup of high ambient SO2 concentrations
temperature at the starting position was 26 ◦ C for the first covering a large part of the island, giving rise to challenging
flight and 32 ◦ C for the second. Assuming a vertical tempera- measurement conditions.
ture gradient of −5 K km−1 and an approximate flight height
of 2000 m, 16 and 22 ◦ C were estimated for calculations, re- 3.2 Plume speed measurements
spectively.
Denuders were connected by PTFE tubes to a micro pump Figure 8 shows the horizontal wind velocity measured with
providing 200 mL min−1 for each denuder. Denuder sam- an anemometer on board the drone, made in connection with
pling does not provide time-resolved samples and instead a MultiGAS measurement on 22 May 2019. The high wind
yields an average concentration for the whole exposure in- speeds measured before reaching the maximum altitude are
terval (i.e. an average per flight). Since results obtained with due to a combination of wind velocity and horizontal drone
environmental denuders predict that these bromine species velocity when approaching the plume region. After reaching
usually only appear within the volcanic plume, we calculate the plume region (indicated by increased SO2 concentration
their plume concentrations based on the known duration of around 2000 m altitude), the drone is kept at a fixed position,
exposure in the plume as detected by the SO2 sensor. Fig- and after a short time a stable plume speed of 3.0 ± 0.5 m s−1
ure 6 shows a photo of the drone, with denuders and Sunkist, is obtained.
mounted on the drone and ready for take-off. Figure 9 shows a plume speed measurement made using
A blank correction for denuder results was performed by the drone drift method. After reaching the plume altitude,
subtracting analysis results from coated denuders that trav- the drone GPS is deactivated remotely, and after a time lag
elled alongside samples but did not sample any air. (caused by the inertia of the drone), a stable drift speed of
Background environmental blanks were sampled at the 3.8 m s−1 is obtained.
starting position of flights. For subtraction of background As can be seen in Fig. 10, the wind speed at Manam dur-
environmental blanks, the atmospheric concentration of sam- ing the field campaign was variable and relatively low, 1–
ples (ppb) was calculated for the total flight time. After blank 4 m s−1 , except on the final day (27 May 2019). This vari-
subtraction, the atmospheric concentration of the bromine ability results in larger overall emission rate error estimates,
species was calculated for the duration in the plume (esti- as a change of a few metres per second (m s−1 ) in wind speed
mated based on SO2 signals). generates a large uncertainty in the emission. However, the
Limits of detection (LOD) and limits of quantification data from the ECMWF regional model are in relatively good
(LOQ) were calculated via 3 and 10 times deviation of the agreement with our drone measurements.
coated denuder blanks (n = 3), respectively. LOD and LOQ
are dependent on sampling time and the processing method
Atmos. Meas. Tech., 14, 4255–4277, 2021 https://doi.org/10.5194/amt-14-4255-2021B. Galle et al.: A drone system for long-range and high-altitude volcanic gas plume measurements 4267
Figure 7. (a) Map showing the location of Manam volcano (based on GeoMapApp; Ryan et al., 2009), with the main sites of launch of our
drone (red) and the location of the crater emissions (black). (b) Photo of the plumes of Manam taken on the 27 May 2019 from Site 1.
Figure 8. Horizontal wind speed measurement made 22 May 2019 using an onboard anemometer. The effective measurement of wind speed
at a certain level is obtained when the drone is placed in a hovering position for several seconds, usually in combination with composition
measurements or gas sampling.
3.3 SO2 emission rate this higher value in the drone measurement is that the rel-
atively high elevation minimizes the atmospheric scattering
Figure 11 shows an example of a MobileDOAS traverse dilution in this measurement. Over the full period of the
made at an altitude of 1000 m a.m.s.l. at Manam volcano on field campaign, the representative SO2 flux was estimated
27 May 2019. An SO2 emission rate of 5200 ± 660/180 t d−1 at 5150 ± [733/336] t d−1 (high and low 1σ bound on uncer-
was obtained for this traverse using a wind speed at plume tainty) by synthesizing a large number of measurements (and
height of 6 m s−1 measured with the drone drift method about their respective uncertainties) from ground-based, drone-
30 min after completing the traverse. mounted and satellite-based approaches (Liu et al., 2020).
This drone-based emission rate measurement can be com-
pared to ScanDOAS measurements made from the ground 3.4 Molar ratios
on the same day, yielding an average over the day of
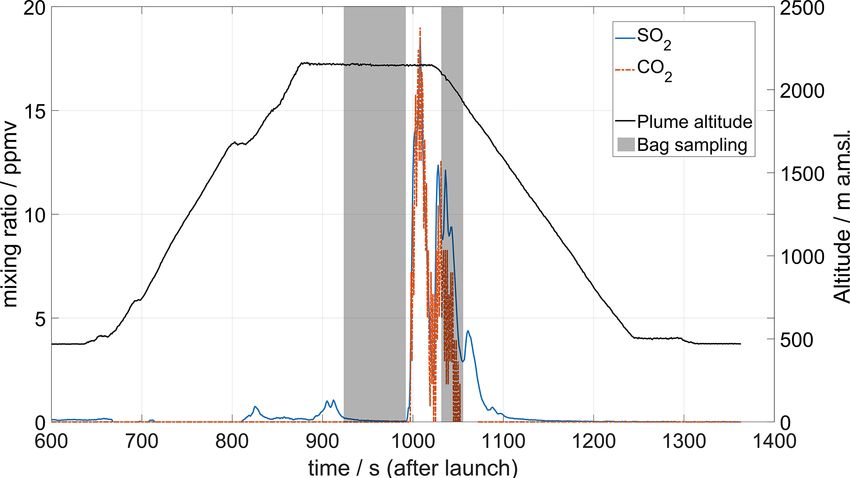
4512 ± 2230 t d−1 , using wind speed from the ECMWF Figure 12 shows the results from a flight simultaneously car-
ERA5 model (Liu et al., 2020). One possible reason for rying a MultiGAS instrument and a plume sampling device
https://doi.org/10.5194/amt-14-4255-2021 Atmos. Meas. Tech., 14, 4255–4277, 2021You can also read