Laboratory and field studies of ice-nucleating particles from open-lot livestock facilities in Texas
←
→
Page content transcription
If your browser does not render page correctly, please read the page content below
Atmos. Chem. Phys., 21, 14215–14234, 2021
https://doi.org/10.5194/acp-21-14215-2021
© Author(s) 2021. This work is distributed under
the Creative Commons Attribution 4.0 License.

Laboratory and field studies of ice-nucleating particles from
open-lot livestock facilities in Texas
Naruki Hiranuma1 , Brent W. Auvermann2 , Franco Belosi3 , Jack Bush2 , Kimberly M. Cory1,4 ,
Dimitrios G. Georgakopoulos5 , Kristina Höhler6 , Yidi Hou1 , Larissa Lacher6 , Harald Saathoff6 , Gianni Santachiara3 ,
Xiaoli Shen6,7 , Isabelle Steinke6,8 , Romy Ullrich6 , Nsikanabasi S. Umo6 , Hemanth S. K. Vepuri1 , Franziska Vogel6 ,
and Ottmar Möhler6
1 Department   of Life, Earth, and Environmental Sciences, West Texas A&M University, Canyon, TX 79016, USA
2 Texas  A&M AgriLife Research, Amarillo, TX 79106, USA
3 Institute of Atmospheric Sciences and Climate, National Research Council, Bologna, 40129, Italy
4 Department of Environmental Toxicology, Texas Tech University, Lubbock, TX 79409, USA
5 Department of Crop Science, Agricultural University of Athens, Athens, 118 55, Greece
6 Institute of Meteorology and Climate Research, Karlsruhe Institute of Technology, Karlsruhe, 76021, Germany
7 Department of Earth Atmospheric and Planetary Sciences, Purdue University, West Lafayette, IN 47907, USA
8 Atmospheric Sciences and Global Change, Pacific Northwest National Laboratory, Richland, WA 99354, USA

Correspondence: Naruki Hiranuma (nhiranuma@wtamu.edu)

Received: 7 October 2020 – Discussion started: 20 November 2020
Revised: 29 July 2021 – Accepted: 19 August 2021 – Published: 24 September 2021

Abstract. In this work, an abundance of ice-nucleating parti-    ing efficiency than previously studied soil dust samples at
cles (INPs) from livestock facilities was studied through lab-   temperatures below −25 ◦ C. Despite their differences in
oratory measurements from cloud-simulation chamber ex-           composition, the freezing efficiencies of both proxy livestock
periments and field investigation in the Texas Panhandle.        dust samples were comparable to each other. Our dynamic
Surface materials from two livestock facilities, one in the      filter processing chamber results showed on average approx-
Texas Panhandle and another from McGregor, Texas, were           imately 50 % supermicron size dominance in the INPs of
selected as dust proxies for laboratory analyses. These two      both dust proxies. Thus, our laboratory findings suggest the
samples possessed different chemical and biological proper-      importance of particle size in immersion freezing for these
ties. A combination of aerosol interaction and dynamics in       samples and that the size might be a more important fac-
the atmosphere (AIDA) measurements and offline ice spec-         tor for immersion freezing of livestock dust than the com-
trometry was used to assess the immersion freezing mode          position. From a 3-year field survey, we measured a high
ice nucleation ability and efficiency of these proxy samples     concentration of ambient INPs of 1171.6 ± 691.6 L−1 (av-
at temperatures above −29 ◦ C. A dynamic filter processing       erage ± standard error) at −25 ◦ C for aerosol particles col-
chamber was also used to complement the freezing efficien-       lected at the downwind edges of livestock facilities. An obvi-
cies of submicron and supermicron particles collected from       ous seasonal variation in INP concentration, peaking in sum-
the AIDA chamber. For the field survey, periodic ambient         mer, was observed, with the maximum at the same temper-
particle sampling took place at four commercial livestock fa-    ature exceeding 10 000 L−1 on 23 July 2018. The observed
cilities from July 2017 to July 2019. INP concentrations of      high INP concentrations suggest that a livestock facility is
collected particles were measured using an offline freezing      a substantial source of INPs. The INP concentration values
test system, and the data were acquired for temperatures be-     from our field survey showed a strong correlation with mea-
tween −5 and −25 ◦ C.                                            sured particulate matter mass concentration, which supports
   Our AIDA laboratory results showed that the freezing          the importance of size in ice nucleation of particles from live-
spectra of two livestock dust proxies exhibited higher freez-    stock facilities.

Published by Copernicus Publications on behalf of the European Geosciences Union.
14216                                                     N. Hiranuma et al.: Ice-nucleating particles from livestock facilities

1   Introduction                                                    ature range, i.e., 0.002 to 60 L−1 (see Sect. 3.2.3 for a more
                                                                    detailed comparison discussion).
Atmospheric ice-nucleating particles (INPs) are a small sub-           Agricultural land use accounts for more than 50 % of total
set of aerosol particles that initiate ice crystal formation in     US land use according to the U.S. Department of Agricul-
supercooled clouds (Vali, 1968; Pruppacher and Klett, 2010).        ture (Bigelow and Borchers, 2017), and there are >26 000
While their importance, relevance, and perturbations to cloud       “open-lot livestock facilities” (OLLFs) in the US (Drouil-
and precipitation properties have been revealed by numerous         lard, 2018). The term OLLF is adapted to denote a partic-
past studies (e.g., Kanji et al., 2017, and references therein),    ular type of animal-feeding operation, in which cattle live-
the potential climatic impact of INPs and their representa-         stock is raised in outdoor confinement, as distinct from par-
tion in numerical models remain under debate (Boucher et            tially or totally enclosed housing and also as distinct from
al., 2013; Storelvmo, 2017; Zelinka et al., 2020). One of the       pasture or free-range production systems (Auvermann et al.,
greatest challenges in the INP research field is the fact that we   2004). OLLFs are common in semi-arid and arid climates.
do not yet understand all INP sources worldwide, in part due        Contrasted with the alternative production systems typical
to the ongoing global climate change (Murray et al., 2021).         of wetter and more temperate climates, they (1) are an in-
Thus, it is crucial to identify and characterize any perturba-      tensified form of livestock production, generating more mar-
tion sources that alter INP abundance and cloud-phase feed-         ketable product per unit land area with less built infrastruc-
back.                                                               ture, (2) make use of the elevated evaporative demand to
   Recently, a resurgence of “fertile-and-agricultural soil         reduce or eliminate precipitation-generated wastewater that
dust” (soil dust hereafter) INP research has been underway,         must be controlled under water-quality regulations, and (3)
in part because of emerging concerns regarding hydrologi-           capitalize on the nocturnal cooling characteristic of semi-arid
cal cycle alteration contributed by modern agricultural prac-       and desert climates to avoid major investments in (and oper-
tices (Alter et al., 2015; Overpeck and Udall, 2020). More-         ating costs associated with) ventilation systems while still re-
over, since agricultural practices represent a substantial dust     ducing the incidence and duration of livestock heat stress un-
emission source, accounting for up to 25 % of total global          der most conditions (Auverman, 2001; Pastoor et al., 2012).
dust emissions (Ginoux et al., 2012), a large number of INPs           In particular, the Texas Panhandle (northernmost coun-
are globally anticipated from agricultural activities. Moti-        ties of Texas, also known as West Texas) is a major con-
vated by these reasons as well as by earlier studies on ice         tributor to US cattle production, accounting for 42 % of fed
nucleation (IN) of surface soil organic and biological sam-         beef cattle in the US and 30 % of the total cattle popula-
ples (Schnell and Vali, 1972, 1973), more recent studies uti-       tion in Texas (>11 million head, Annamalai et al., 2012;
lized various online and offline instruments. In turn, scien-       USDA, 2021). Annually, these cattle produce >5 million
tists now have a better understanding of ambient INP con-           tons of manure, which represents a complex microbial habi-
centrations (nINP , per unit volume of air), especially through     tat containing bacteria and other microorganisms, on an as-
immersion freezing (i.e., the freezing of aerosol particle(s)       collected basis (Von Essen and Auvermann, 2005). In gen-
immersed in a supercooled droplet), from different agricul-         eral, cattle manure hosts a wide variety of bovine rumen bac-
tural sources (Conen et al., 2011; Hill et al., 2016; Steinke       teria (e.g., Prevotellaceae, Clostridiales), lipoprotein compo-
et al., 2016; Suski et al., 2018). These efforts allow for first-   nents of certain bacterial cell walls, and non-bacterial fauna
order estimates of immersion-mode nINP from soil dust that          of the rumen, such as fungal spores, lichens, fungi, Plan-
is relevant to mixed-phase clouds (O’Sullivan et al., 2014;         tae, Protista, Protozoa, Chromalveolata, and Archaea (Na-
Tobo et al., 2014; Steinke et al., 2020). For instance, by com-     garaja, 2016). Mainly by cattle movements, dried manure
piling the data from the Colorado State University contin-          became airborne (Bush et al., 2014). Agricultural dust par-
uous flow diffusion chamber and an ice spectrometer, the            ticles observed at OLLFs have long been known to affect
range of measured soil dust nINP at −20 ◦ C produced by the         regional air quality because the dust emission flux and 24 h-
harvesting of several crops in the High Plains region of the        averaged ground-level dust concentration can be as high as
United States from Suski et al. (2018) spanned from ∼ 0.3           23.5 µg m−2 s−1 and 1,200 µg m−3 (Bush et al., 2014; Hi-
to 10 L−1 . Based on global mean aerosol particle concentra-        ranuma et al., 2011). While there has been no study on the
tions and immersion-mode IN parameterization, O’Sullivan            vertical profiles of OLLF dust, our previous study revealed
et al. (2014) estimated the simulated nINP at −20 ◦ C and           the presence of OLLF-derived particles at 3.5 km downwind
600 mb to range from ∼ 0.01 to 8 L−1 . Similarly, Steinke           of the facility, suggesting their ability to be transported re-
et al. (2020) estimated that soil dust nINP can be as high as       gionally (Hiranuma et al., 2011). Moreover, some recent
approximately 40 L−1 at −20 ◦ C based on their laboratory-          studies suggest that aerosol particles emitted from agricul-
derived IN parameterization for soil dust from northwestern         tural activities might reach cloud heights due to wind ero-
Germany and Wyoming, USA. Overall, these measurements               sion, scouring, and other relevant mechanisms (Duniway et
and approximations represent the upper bound of general             al., 2019; Katra, 2020; Steinke et al., 2020, and references
field-studied nINP from different geographical areas as sum-        therein). Convection and updraft systems may also help the
marized in Kanji et al. (2017; Fig. 1–10) in the same temper-

Atmos. Chem. Phys., 21, 14215–14234, 2021                                           https://doi.org/10.5194/acp-21-14215-2021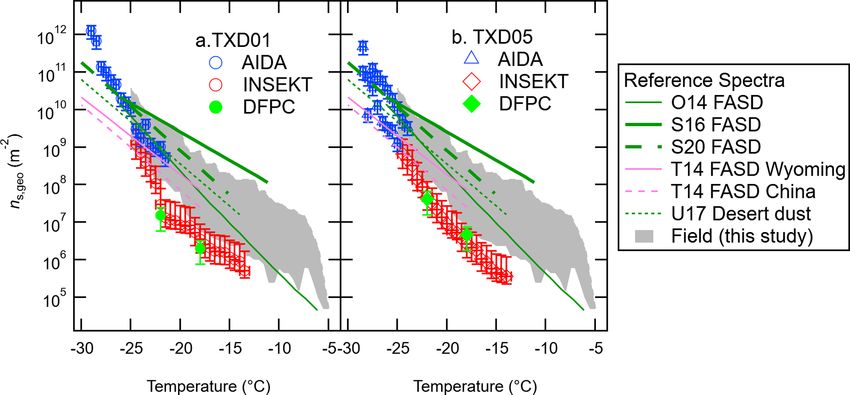
N. Hiranuma et al.: Ice-nucleating particles from livestock facilities                                                   14217

vertical transport of aerosol particles in the Southern High     Quantachrome Instruments) was used to measure BET SSAs
Plains region (Li et al., 2017).                                 in this study. A summary of the physical properties of our
   Due to the potential to act as a prevalent point source       samples is provided in Sect. 3.1.1. In addition, we used a
of microbiome-enriched dust particles, we hypothesized that      single-particle mass spectrometer to characterize the aerosol
an OLLF could be a source of soil dust INPs. To ver-             particle chemical compositions of our surface samples in the
ify this hypothesis, IN efficiencies of OLLF proxies, their      size range between 200 and 2500 nm presented in Supple-
physicochemical and biological properties, and IN propensi-      ment Sect. S1.
ties of ambient particles from OLLFs were studied in both
laboratory and field settings. Specifically, we examined the
                                                                 2.1.2   Cloud-simulation chamber experiments
immersion-mode IN ability of surface-derived material sam-
ples aerosolized in a cloud-simulation chamber and ambient
OLLF dust sampled in the field through offline lab analysis.     We used the AIDA expansion cloud-simulation chamber
We focused on the immersion-mode freezing because recent         (e.g., Möhler et al., 2003) and a set of analytical instruments
modeling simulation and remote sensing studies suggest that      at the Karlsruhe Institute of Technology to conduct a lab-
immersion freezing is the most prominent heterogeneous IN        oratory campaign named TXDUST01 in 2018. The AIDA
mechanism, through which ice crystals are formed in mixed-       chamber generates artificial clouds and activates particles in
phase clouds, accounting for 85 % to 99 % of ice crystal for-    a simulated atmospheric cloud parcel via expansion cooling.
mation (Hande and Hoose, 2017; Westbrook and Illingworth,        The air volume adjacent to the chamber wall in the 84 m3
2011). To complement the immersion freezing results, we          vessel is much smaller than the actively mixed volume of
also attempted to investigate the presence of any known bio-     the vessel. Hence, we neglect the so-called wall effect (e.g.,
logical INPs by taxonomic identification of the microbiome.      particle wall deposition) in the AIDA. The AIDA measure-
                                                                 ment uncertainties for temperature, relative humidity (RH),
                                                                 and freezing efficiency are ±0.3 ◦ C (Möhler et al., 2003),
2     Materials and methods                                      ±5 % (Fahey et al., 2014), and ±35 % (Steinke et al., 2011).
                                                                 Note that the AIDA results provided a validation of the other
2.1     Laboratory study                                         INP spectrometers employed in this study.
                                                                    An overall AIDA experimental schematic is shown in
2.1.1    Samples                                                 Fig. 1. Our OLLF dust proxy sample was injected into the
                                                                 AIDA chamber in an aerosolized form by a rotating brush
Two types of OLLF surface-derived materials, Texas-Dust-         disperser (PALAS, RBG1000). A series of inertial cyclone
01 (TXD01) and Texas-Dust-05 (TXD05), were used for our          impactor stages (50 % cut-size diameters ∼ 1 and 5 µm) was
laboratory study at the Aerosol Interaction and Dynamics         deployed between the disperser and the AIDA vessel to limit
in the Atmosphere (AIDA) facility. TXD01 is a composite          particle size to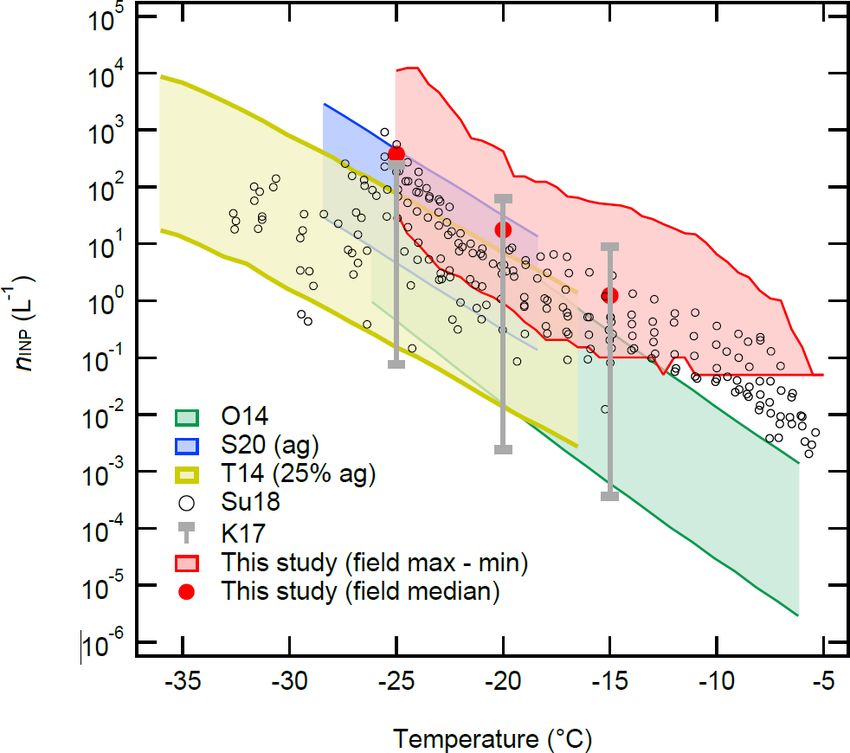
14218                                                         N. Hiranuma et al.: Ice-nucleating particles from livestock facilities

                                                                        Lauda), which was cooled down at a rate of 0.33 ◦ C min−1 .
                                                                        If a well froze upon the presence of an INP, a camera de-
                                                                        tected the associated brightness change based on an opti-
                                                                        mized greyscale threshold value set on the LabView soft-
                                                                        ware.
                                                                           The freezing data were analyzed with a 0.5 ◦ C tempera-
                                                                        ture resolution. The temperature uncertainty of INSEKT was
                                                                        ±0.5 ◦ C, and the nINP error was estimated as the 95 % bino-
                                                                        mial confidence intervals (CI95%) for each sample.
                                                                           A series of diluted suspensions (×15 to ×225) was consis-
                                                                        tently analyzed for each sample to acquire INP spectra cov-
                                                                        ering a wide range of heterogeneous freezing temperatures
Figure 1. Lab experimental schematic of the AIDA facility. All
                                                                        (above −25 ◦ C), which complemented the AIDA results at
samples were injected using a rotating brush generator (RBG) for        higher temperatures than AIDA could examine. For the over-
aerosol particle generation. Multiple extramural instruments, welas     lapping temperatures, we chose the data exhibiting the mini-
optical particle counters (OPCs), a hygrometer, a tunable diode laser   mum CI95% as representative nINP for a given temperature.
(TDL) spectrometer, a laser ablation aerosol particle time-of-flight       We now describe the derivations of nINP based on
mass spectrometer (LAAPTOF; see Supplement), and aerosol parti-         Vali (1971) as well as immersion freezing efficiencies. Ini-
cle counters/sizers (SMPS, APS, CPCs) are connected to the AIDA         tially, we computed the CINP (T ) value, which is the nucleus
chamber. Downstream filters and impactors collected aerosol parti-      concentration in ultrapure water suspension (L−1 water) at
cles for multiple offline analyses.                                     a given temperature. This CINP (T ) value was calculated as
                                                                        a function of the unfrozen fraction, funfrozen (T ) (i.e., the ra-
                                                                        tio of the number of droplets unfrozen to the total number of
ments. These filter samples were used for three complemen-              droplets), as
tary offline analyses.
                                                                                        ln (funfrozen (T ))
                                                                        CINP (T ) = −                       ,                         (1)
2.1.3   The ice nucleation spectrometer of the Karlsruhe                                        Vd
        Institute of Technology (INSEKT)                                in which Vd is the volume of the sample in a well (50 µL)
                                                                        for INSEKT. Next, we converted CINP (T ) to nINP (T ), INP
The IN spectrometer of the Karlsruhe Institute of Technol-              in the unit volume of atmospheric air at standard tempera-
ogy (INSEKT) system is an offline immersion freezing tech-              ture and pressure (STP), which are 273.15 K and 1013 mb,
nique, and its design and concept are based on the Colorado             respectively. The cumulative nINP per unit volume of sample
State University ice spectrometer (Hill et al., 2014 and 2016)          air, described in the previous study DeMott et al. (2017), was
as described in Schiebel (2017) and Schneider et al. (2021).            then estimated as
In this study, INSEKT was used to assess the IN ability                                                     Vl
of surface OLLF samples collected on 47 mm polycarbon-                  nINP (T ) = CINP (T ) × (DF) ×           ,                    (2)
                                                                                                            Vair
ate Nuclepore filters (Whatman, Track-Etched Membranes,
0.2 µm pore) at the AIDA facility. The INSEKT data are es-              where DF is a serial dilution factor, Vair is the sampled air
pecially useful for complementing the AIDA chamber im-                  volume, and Vl is the suspension volume. Finally, based on
mersion results at temperatures above −25 ◦ C. All filter sam-          Eq. (3) of Hiranuma et al. (2015), the INP concentration per
ples were collected with a sampling flow rate of 10 L min−1 ,           unit aerosol particle mass, nm (T ), and INP concentration per
and a total of ≈ 600 L of air was sampled through a cross-              unit geometric aerosol particle surface as a function of T ,
section of each filter (see Table 1 for corresponding AIDA              ns,geo (T ), were derived as
experiments).                                                                        nINP (T )

                                                                                                   Stotal

    Filter-collected aerosol particles were suspended in 8 mL           nm (T ) =              ≈            ns,geo (T ) ,          (3)
                                                                                       Mve         Mtotal
filtered nano-pure water, which has a negligible contribution
to background freezing (Schneider et al., 2021). The wash-              where Mve is the mass of a spherical particle of volume-
ing water volume was optimized based on the total amount                equivalent diameter (g), and Stotal /Mtotal is a geometric spe-
of air sampled through the cross-section of the filter, so that         cific surface area. The Stotal /Mtotal value used for this study
the resulting suspension contained at least 0.015 INP L−1               was derived from particle size distribution measurements
at the upper temperature detection limit of INSEKT. For the             from the AIDA chamber (presented in Table 1). Niemand
INSEKT analysis, the resulting suspension was divided into              et al. (2012) infer that the application of ns,geo is valid for
volumes of 50 µL, which were placed in wells of a sterile               small percentages of an IN-active fraction (≤ 1 %). From the
PCR tray. It was then placed in an aluminum block ther-                 numbers of Ntotal,0 given in Table 1 (total number concen-
mostated with an ethanol cooling bath (LAUDA RP 890;                    tration of particles at the initial stage prior to expansion), we

Atmos. Chem. Phys., 21, 14215–14234, 2021                                                https://doi.org/10.5194/acp-21-14215-2021
N. Hiranuma et al.: Ice-nucleating particles from livestock facilities 14219
Table 1. Characterization of particle properties: assessed prior to AIDA expansion experiments.
Experiment ID Aerosol particle measurements
Aerosol particle Mode (min–max) Ntotal,0 , × 103 L−1 Stotal,0 , × 10−9 m2 L−1 Mtotal,0 , × 10−3 µg L−1
type diameter, µmb
TXDUST01_7 TXD01 0.55 (0.10–3.16) 213.7 98.8 18.4
TXDUST01_8a TXD01 0.54 (0.11–2.69) 266.3 115.5 21.1
TXDUST01_30 TXD01 0.72 (0.08–6.44) 210.6 119.0 29.7
TXDUST01_12a TXD05 0.67 (0.09–5.14) 199.2 163.5 41.1
TXDUST01_13 TXD05 0.71 (0.10–4.71) 155.0 117.2 29.6
TXDUST01_32 TXD05 0.84 (0.15–4.37) 163.3 124.9 33.2
a Samples for offline analyses (Sect. 2.1.3–2.1.5) were collected. b Based on the dS/d log D fit; min–max values are estimated at 0.1 × 10⁻⁹ m2 L−1 ; N
ve total,0 = total number
concentration of particles at the initial stage (t = 0) prior to expansion; Stotal,0 = total surface concentration of particles at the initial stage (t = 0) prior to expansion;
Mtotal,0 = total mass concentration of particles at the initial stage (t = 0) prior to expansion; Dve = volume-equivalent diameter.
examined on average ∼ 200 000 L−1 aerosol particles in the ciency along the total sampling line was taken into account
immersion freezing mode in AIDA. INSEKT typically mea- by estimating gravitational losses in the horizontal tract of
sures INP counts up to several hundred. Even assuming we the sampling tube and inertial losses in the bend. At a par-
evaluate INP up to 2000 L−1 , our INP fraction is 1 %. We, ticle size of 10 µm (larger than what was measured in the
therefore, conclude that our ns parameterization introduced AIDA chamber), the overall particle transmission efficiency
in Sect. 3.1 is reasonable. was higher than 86 %. For a particle size of 2 µm, the parti-
cle loss is estimated to be ≈ 2.5 %. Due to the small loss, we
2.1.4 The dynamic filter processing chamber neglected any corrections for aerosol particle counts. After
collection, the filters were safely kept in Petri dishes at room
Condensation-/immersion-mode nINP was also measured at temperature until the freezing experiments were initiated.
the National Research Council in Bologna by means of a dy- Prior to the DFPC measurement, the sampled filter was
namic filter processing chamber (DFPC, Santachiara et al., inserted onto a metal plate and covered with a smooth sur-
2010). The DFPC system is a replica of the Langer dynamic face of paraffin in order to ensure good thermal contact be-
developing chamber (Langer and Rodgers, 1975). The sys- tween the filter and the supporting substrate. Subsequently,
tematic temperature uncertainty in DFPC is within ±0.1 ◦ C the paraffin was slightly heated and rapidly cooled to fill the
(Table S1 in Hiranuma et al., 2019). With a water saturation filter pores. DFPC controlled the temperatures of the filter
error of ±0.01, an ice detection error of ±33 %, and the ex- and the air, saturated with respect to finely minced ice, with
perimental standard deviation, the overall IN efficiency un- the flow continuously grazing the filter. IN measurements of
certainties of DFPC are estimated to be less than ±62 % for total aerosol particles, nINP,total , as well as measurements of
this study. The application of DFPC for immersion freezing PM1 (PMx = particulate matter smaller than x µm), nINP,PM1 ,
has been verified in previous inter-comparison studies (De- were performed at a water supersaturation of 2 % and tem-
Mott et al., 2018; Hiranuma et al., 2019). peratures of −18 and −22 ◦ C. The supersaturation was cal-
For the DFPC analyses, aerosol particles were collected culated theoretically from vapor pressures over ice and water.
on nitrocellulose black gridded membrane filters (Millipore The exposure time of the filter was 20 min to grow visible ice
HABG04700, nominal porosity 0.45 µm) from the AIDA crystals on INPs at the considered RH and temperature con-
chamber prior to each expansion experiment (Table 1). Two ditions. The nINP value was calculated by scaling the total
parallel samplers employed in this study had an identical counts of ice crystals detected on each filter by the sampled
sampling flow rate of 2 L min−1 , and a total of 100 L of air volume.
air was sampled for each system. One sampling system col-
lected the total aerosol particles, while another was equipped 2.1.5 Analysis of sample microbiomes
with a cyclone impactor (MesaLabs, SCC0732, S/N 13864)
to collect only submicron-sized aerosol particles. This im- The microbiome of our samples was characterized by
pactor was characterized by a cut-off size around 1 µm in metagenomic analysis. With this approach, total DNA is ex-
aerodynamic diameter (50 % cut-off diameter at 0.9 µm) at a tracted from environmental samples; this DNA is a mix from
2 L min−1 flow rate (Kenny et al., 2000). Therefore, the latter all microorganisms and macroorganisms present in a sample.
line selectively collected particles smaller than 1 µm aerody- The qualitative and quantitative identification of microorgan-
namic diameter. isms is carried out by amplifying (by polymerase chain reac-
The cut-size efficiency of this cyclone impactor was tested tion) and sequencing (several methods are in use) specific
in the lab against NaCl particles. Particle transmission effi- DNA segments of phylogenetic markers (genes that are used
https://doi.org/10.5194/acp-21-14215-2021 Atmos. Chem. Phys., 21, 14215–14234, 202114220 N. Hiranuma et al.: Ice-nucleating particles from livestock facilities
for identifying an organism) from the extracted and purified
total DNA. Bioinformatics analysis of sequences obtained
determines the nature and abundance of microorganisms in
this sample.
To sample aerosolized dust from the AIDA cloud cham-
bers, stainless steel filter holders containing 47 mm Nucle-
pore filters (0.2 µm pore size) were used. These filters were
previously sterilized in a standard vapor autoclave and fitted
onto the AIDA cloud chamber for aerosol particle sampling
prior to the expansion IN experiment. After the conclusion of
the experiments, the holders were removed from the cham-
ber to extract total DNA directly from the Nuclepore filters.
DNA extractions were performed using the FastDNA® Spin
Kit for Soil (MP Biomedicals) as described in the manufac-
turer’s protocol. Filters were aseptically removed from hold-
ers and placed in the Lysing Matrix E tube for mechanical
cell disruption, which was carried out with the FastPrep® in-
strument (MP Biomedicals). The concentration and purity of Figure 2. Schematic of the field sampling activity at individual
the extracted DNA were measured by using the Qubit™ 3.0 sites (only the counties are shown). The dimension of each facil-
(Thermo Fisher Scientific). The volume of each sample was ity (east–west × north–south) is (1) 1.6 × 1.6 km, (2) 1.0 × 0.8 km,
50–100 µL. (3) 0.7 × 0.7 km, and (4) 1.4 × 0.8 km. A combination of polycar-
The amplification of phylogenetic marker genes and the bonate filter samplers (PFSs) and DustTrak instruments was used at
metagenomic analysis and sequence processing of ampli- the nominally upwind and downwind edges of OLLF-1 to OLLF-3.
cons from each dust sample were performed by Eurofins
Genomics Germany GmbH using the INVIEW Microbiome
Profiling 3.0 protocol in order to identify and classify the mi- wind and upwind sampling. When southerly wind prevailed
crobial population (Fungi, Bacteria, and Archaea) of each (90◦ < wind direction < 270◦ ), we used the northern site as
sample. To achieve this, the hypervariable regions V1–V3 the downwind site. Likewise, the southern site was used as
and V3–V5 of the bacterial 16SrRNA gene, the fungal inter- the downwind site while the northerly wind was dominant
nal transcribed spacer (ITS2) gene, and part of the archaeal (270◦ < wind direction < 90◦ ). Our sampling sites represent
16SrRNA gene were amplified by polymerase chain reac- typical OLLFs, as more than 75 % of cattle are produced in
tions from each sample using in-house primers. Amplicons large concentrated animal-feeding operation facilities in the
were sequenced with the MiSeq next-generation sequencing US (Drouillard, 2018).
system with the 2 × 300 bp paired-end read module.
2.2.2 Field sampling
2.2 Field investigation
All field samples were collected using 47 mm Nuclepore fil-
2.2.1 Locations ters (0.2 µm pore). A filter holder was deployed at ∼ 1.5 m
above the ground. The filter sampling conditions measured
Four commercial OLLFs, ranging from 0.5 to 2.6 km2 (max- locally (during individual sampling activities) are summa-
imum 45 000 head capacity), located in the Texas Panhandle rized in Table 2. For the given conditions, the estimated
region were used as the ambient aerosol particle sampling 50 % particle transmission of a 1.5 m conductive tube (0.5-
sites. All four sites are located within a 53 km radius of West inch opening diameter) employed for aerosol samplings was
Texas A&M University in Canyon, Texas. Our experimen- ∼ 5 µm (von der Weiden et al., 2009). Our samples were
tal layouts at each site, denoted as OLLF-1 to OLLF-4, are collected in different meteorological seasons, including sum-
shown in Fig. 2 (no further specification is provided to pro- mers in 2017–2019, springs in 2018 and 2019, and winter in
tect location privacy). All the sites have a capacity greater 2019, in order to examine the seasonal variation in nINP . All
than 1000 head, which is categorized as a large concen- samples were collected when the OLLF pen surface was dry.
trated animal-feeding operation facility for cattle under the In 2017, polycarbonate filter samplers were used at both up-
U.S. Environmental Protection Agency’s definition (https: wind and downwind edges (N. Hiranuma et al.: Ice-nucleating particles from livestock facilities 14221
ilized tubes refrigerated at 4 ◦ C until the immersion freezing
measurements commenced (typically within 24 h after sam-
pling).
To complement the polycarbonate filter samplers, simul-
taneous 1 min time-resolved mass concentration measure-
ments of PM10 during individual sampling intervals were
also carried out using DustTrak particulate monitors (TSI
Inc., Model 8520) equipped with a PM10 inlet. The inlets of
DustTrak were maintained at ∼ 1.5 m above the ground to be
consistent with our polycarbonate filter samplers.
2.2.3 The West Texas Cryogenic Refrigerator Applied
to Freezing Test system
To assess the ambient nINP through samples collected in the
field, we used an offline droplet-freezing assay instrument,
the West Texas Cryogenic Refrigerator Applied to Freez- Figure 3. Temporal profiles of the AIDA immersion freezing exper-
ing Test system (WT-CRAFT; Vepuri et al., 2021). Briefly, iment: TXDUST01_07 (i), _08 (ii), _30 (iii), _12 (iv), _13 (v), and
WT-CRAFT enables a simulation of atmospheric immersion _32 (vi). Arrays of alphabetical panels represent the chamber gas
freezing using supercooled droplets containing aerosol parti- temperature (solid line) and the chamber wall temperature (dashed
cles at temperatures > − 25 ◦ C. WT-CRAFT was a replica of line) (a), pressure in the AIDA chamber vessel (b), RH with respect
to water (green line) and ice (blue line) (c), and aerosol particle con-
NIPR-CRAFT (Tobo, 2016), but the two systems currently
centration measured by the CPC (red solid line) as well as number
possess different sensitivities to artifacts and detectable tem- concentration of >20 µm Dve AIDA particles measured by a welas
perature ranges as described in Vepuri et al. (2021). optical particle counter (blue line) (d). Horizontal numerical panels
In this study, for each ambient sample, we evaluated represent different sample types and AIDA experiments, including
70 solution droplets (3 µL each) placed on a hydropho- TXD01 (i)–(iii) and TXD05 (iv)–(vi). RHs were determined with an
bic vaseline layer with a cooling rate of 1 ◦ C min−1 . All accuracy of ±5 %, represented as the green shaded area in (c), using
droplets were prepared using filter rinse suspensions with the mean gas temperature and the mean water vapor concentration.
high-performance liquid chromatography (HPLC)-grade wa-
ter. The amount of HPLC water volume (i.e., Vl ) was deter-
mined based on the total amount of air sampled through the To evaluate the immersion freezing efficiency of ambi-
cross-section of the filter, which limits the detection capabil- ent aerosol particles collected at OLLFs, we converted our
ity to 0.05 INP per liter of air (STP). Each freezing event was WT-CRAFT-based nINP measurements to ice-nucleating ef-
determined optically based on the change in droplet bright- ficiency metrics, such as nINP , nm , and ns,geo (Eq. 3). The
ness when the initially transparent liquid droplets became Stotal /Mtotal value used for this study, ∼ 0.4 m2 g−1 , is de-
opaque upon freezing. If the freezing temperature was not rived from particle size distribution measurements presented
obvious for any droplets, the 8-bit greyscale images were as- in Fig. 3 of Hiranuma et al. (2011).
sessed using ImageJ software to determine the temperature
of phase change.
After the measurement, we calculated the frozen fraction 3 Results and discussion
and estimated the nINP per volume of air as a function of
temperature, nINP (T ), for every 0.5 ◦ C using Eqs. (1)–(2) 3.1 Laboratory results
(Vd = 3 µL; Vair and Vl are provided in Table 2). The temper-
3.1.1 Physical properties of samples
ature uncertainty and immersion freezing efficiency in WT-
CRAFT are ±0.5 ◦ C and ±23.5 %, respectively (Vepuri et Table 3 summarizes the physical properties of surrogate sam-
al., 2021). The experimental uncertainty is typically repre- ples from OLLFs. Additionally, geometric SSA values were
sented by CI95%. While the background freezing contribu- computed based on aerosol particle size distribution mea-
tion of the field blank filter was negligible (14222 N. Hiranuma et al.: Ice-nucleating particles from livestock facilities
Table 2. Summary of the ambient aerosol particle filter sampling conditions: UW denotes upwind.
Year Date Location Start time End time Flow rate Air volume, Suspension water
(local) (local) (LPM)∗ Vair (L STP) volume, Vl (mL)
2019 20190715 OLLF-1 18:45:00 22:05:00 4.19 838.00 8.74
20190716 OLLF-2 18:45:00 20:29:00 4.30 447.20 4.66
20190724 OLLF-3 19:24:00 20:34:00 4.54 317.80 3.31
20190226 OLLF-1 16:08:00 19:09:00 3.95 714.95 7.45
20190328 OLLF-2 16:26:00 20:52:00 5.00 1330.00 13.87
20190420 OLLF-3 17:05:00 21:05:00 4.15 996.00 10.39
20190116 OLLF-1 16:03:00 19:33:00 3.97 832.65 8.68
20190117 OLLF-2 15:48:00 19:30:00 3.97 880.23 9.18
20190118 OLLF-3 15:40:00 18:40:00 3.62 651.60 6.79
2018 20180722 OLLF-1 18:42:00 22:39:00 6.58 1560.00 16.26
20180723 OLLF-2 18:42:00 22:17:00 5.46 1173.79 12.24
20180724 OLLF-3 18:20:00 22:13:00 3.65 850.31 8.86
20180416 OLLF-4 16:53:30 20:06:40 5.99 1158.00 12.10
2017 20170709 OLLF-1 19:32:45 22:26:00 5.28 915.58 9.54
20170710 OLLF-2 18:06:00 22:06:30 5.10 1227.19 12.79
20170711 OLLF-3 18:28:00 22:08:00 5.13 1127.99 11.76
20170709 OLLF-1-UW 19:50:00 22:47:00 5.28 935.24 9.75
20170710 OLLF-2-UW 18:28:00 22:24:00 5.10 1204.24 12.55
20170711 OLLF-3-UW 18:41:45 21:54:00 5.12 983.52 10.25
∗ A mass flow controller or a critical orifice was used to ensure a constant flow throughout each sampling activity. An airflow rate was measured
with a flowmeter (TSI Inc., model 4140).
tle hooves on the pen can cause compaction of the surface
Table 3. Properties of OLLF samples: TXD01 and TXD05. layer, which may result in the higher densities of our sam-
ples (Guo et al., 2011). The measured BET SSA values of
System TXD01 TXD05 OLLF samples are slightly higher compared to previously
measured agricultural soil dust samples (0.74–2.31 m2 g−1 ;
1 Density, g cm−3 1.89 ± 0.06 2.05 ± 0.06 O’Sullivan et al., 2014), which suggests that TXD01 and
Geometric SSA, m2 g−1 4.95 ± 0.82 3.97 ± 0.02 TXD05 are more porous than these previous soil samples,
2 BET-based SSA, m2 g−1 3.23 ± 0.20 2.41 ± 0.20 leading to higher BET SSA. Our geometric SSA values are
1 With a measurement standard deviation of ± 0.06, our system is capable higher than the BET SSA values. In general, a small SSA
of measuring densities of other powder samples, such as illite NX value is often consistent with the presence of a large aerosol
(2.91 g cm−3 ) and fibrous cellulose (1.62 g cm−3 ). Note that these values
are similar to the density values reported by manufacturers for illite NX
particle population. Hence, the predominance of larger parti-
(2.65 g cm−3 ) and fibrous cellulose (1.5 g cm−3 ). 2 Brunauer et al. (1938). cles in bulk powders assessed in BET is presumably respon-
sible for the observed differences in these two SSA values.
Indeed, the particles observed in AIDA were all /6.5 µm
volume-equivalent diameter, Dve (Table 1), presumably due
to the use of cyclone impactor stages after a rotating brush
Table 4. Geometric SSA values for individual AIDA expansion ex-
generator, whereas the particles evaluated by BET were up
periments.
to 75 µm. Therefore, in association with the large grain size
involved in the BET analysis, bulk samples might have ex-
Experiment ID Aerosol particle Geometric SSA,
hibited smaller SSA than dry dispersed ones. As seen in Ta-
type m2 g−1
ble 1, the mode diameters of TXD01 samples in AIDA were
TXDUST01_7 TXD01 5.38 in general smaller than that of TXD05 samples, which is con-
TXDUST01_8 TXD01 5.46 sistent with our SSA measurements (see Tables 3 and 4).
TXDUST01_30 TXD01 4.01 As demonstrated in our previous study, the surface area
TXDUST01_12 TXD05 3.98
distribution of ambient OLLF dust peaks in mode diame-
TXDUST01_13 TXD05 3.95
ter at ≤ 10 µm (Hiranuma et al., 2011). This mode diam-
TXDUST01_32 TXD05 3.77
eter is larger than surface-derived samples aerosolized and
examined in the AIDA chamber. However, it is cautiously
Atmos. Chem. Phys., 21, 14215–14234, 2021 https://doi.org/10.5194/acp-21-14215-2021N. Hiranuma et al.: Ice-nucleating particles from livestock facilities 14223
noted that the ambient OLLF dust size distribution is not spa- surface materials are located towards the minimum bound-
tially uniform, and the emitting mechanism itself is not con- aries of our field ns,geo spectra for temperatures > − 25 ◦ C.
trollable as it highly depends on a unit of mobile livestock. While the variability of ns,geo at a single temperature could
Granting the primacy of hoof action as the decisive emission vary by several orders of magnitude for our field data, smaller
mechanism of OLLF dust as described in Bush et al. (2014), variations are found for both lab results, implying different
a more controlled laboratory experiment has been needed to properties of our lab and field samples. The difference be-
characterize IN ability of OLLF soil dust. tween our laboratory results and field data is discussed in
Sect. 3.3.1 in more detail. Additionally, the similarity of our
3.1.2 AIDA measurements and freezing efficiencies of lab results between TXD01 and TXD05 suggests that differ-
surface materials ent physicochemical properties found for our samples may
not impact their INP propensities.
Shown in Fig. 3 are expansion experiment profiles of all six
AIDA expansion experiments. These profiles represent data 3.1.3 Size-segregated analysis
points measured in the chamber over a series of time, such
as temperature (a), pressure (b), RH (c), and aerosol parti- Our DFPC-derived ns,geo values in Fig. 4 agreed reason-
cle and hydrometeor concentration (d) for each AIDA ex- ably well with the INSEKT results at the measured temper-
periment. For each cloud formation experiment, the pres- atures within our error ranges. This comparability suggests
sure within the chamber was reduced (1Pressure ∼ 180– that freezing ability is similar for condensation and immer-
290 hPa), causing the temperature to drop and a simulated sion for our surface samples. Besides, several unique char-
adiabatic “expansion” to occur. As can be seen, measure- acteristics of OLLF INPs were disclosed. For instance, com-
ments were made at water saturation (RH with respect to liq- parability of results from our condensation freezing instru-
uid water around 100 %). A droplet–ice threshold typically ment (DFPC) and immersion freezing assay (INSEKT) was
coincided with ≥ 20 µm Dve . Thus, the number concentra- found for both sample types at the overlapped temperatures
tion of >20 µm Dve particles measured by a welas optical (18 and −22 ◦ C). A similar observation was previously made
particle counter (Benz et al., 2005) primarily represents pris- for kaolinite particles in Wex et al. (2014). However, as the
tine ice crystals formed during the expansion (Fig. 3d). In examined temperatures in our study are limited, the observed
almost all cases, the RH dropped during some expansions at equivalence between immersion and condensation freezing
low temperatures. At these temperatures, ice crystals grow for our surface OLLF samples should be cautiously inter-
rather quickly at the expense of available water vapor in the preted and may not be conclusive.
AIDA chamber, which causes the observed RH drop. Never- More importantly, Table 5 summarizes the comparison of
theless, droplets were fully activated within ≈ 100 s of each the submicron vs. supermicron INPs for a set of four sam-
expansion while reaching the peak RH, where we see the ples measured at −18 ◦ C and −22 ◦ C by DFPC. On aver-
steep slope of 1RH/1t in Fig. 3. Further, as seen in Fig. 3d, age, the supermicron INP fraction, given by [(nINP,total −
particles of >20 µm Dve are not increasing, and the total nINP,PM1 )/nINP,total ] × 100, shows that this fraction con-
aerosol concentration measured by CPC also does not change tributed 45.0 % ± 6.7 % (average ± standard error) of the to-
after the RH peak. Thus, all predominant ice formation oc- tal INP for TXD01 and TXD05 samples at the measured tem-
curs at or before the RH peak through immersion freezing. peratures. This highlights the importance of the large parti-
Lastly, we made sure to only report our IN efficiency at tem- cles, which might dominate the particle surface and mass, in
peratures higher than ∼ −30 ◦ C, corresponding to a saturated the INP population. Note that we also compared the submi-
condition in the AIDA vessel. cron vs. supermicron ns,geo values. Our PM1 ns,geo and su-
Figure 4 summarizes our ns,geo spectra of our surface ma- permicron ns,geo were virtually identical, implying non-size-
terial samples from the AIDA, INSEKT, and DFPC (total dependent IN ability across the sizes evaluated in this study
aerosol) experiments. For each sample, we compared our (not shown).
experimental dust ns,geo spectra to six reference soil dust Several studies have shown evidence that coarse aerosol
ns,geo curves, O14 (England), S16 (Mongolia, Argentina, and particles dominate INPs across the world. DeMott et
Germany), S20 (northwestern Germany and Wyoming), T14 al. (2010) successfully demonstrated the correlation be-
(Wyoming), T14 (China), and U17 (desert dust samples from tween immersion-mode nINP and the number concentration
Asia, the Canary Islands, Israel, and the Sahara), available in of aerosol particles larger than 0.5 µm diameter based on
previously published studies (O’Sullivan et al., 2014; Steinke the compilation of field data for more than a decade. Ma-
et al., 2016; 2020; Tobo et al., 2014; Ullrich et al., 2017), as son et al. (2016) reported a substantial fraction of supermi-
well as our field data (see Sect. 3.2.3). As seen in Fig. 4, cron INPs through immersion freezing at a relatively high
our OLLF spectra are comparable to the previous soil dust temperature (>78 % at −15 ◦ C) measured at seven different
ns,geo parameterization at relatively low temperatures (e.g., sites over North America and Europe. Even at −20 ◦ C, the
the ns,geo value range in orders of magnitude from 109 to authors reported a fraction of supermicron INPs larger than
1010 m−2 at around −25 ◦ C). The immersion spectra of both 50 %. Compared to these numbers, our laboratory data show
https://doi.org/10.5194/acp-21-14215-2021 Atmos. Chem. Phys., 21, 14215–14234, 202114224 N. Hiranuma et al.: Ice-nucleating particles from livestock facilities
Figure 4. IN-active surface-site density, ns,geo , of surface materials, TXD01 (a) and TXD05 (b), was assessed by AIDA, INSEKT, and DFPC
(total aerosol particles) as a function of temperature. Six reference ns,geo curves for fertile and agricultural soil dust (FASD) and desert dust
are adapted from O’Sullivan et al. (2014; O14), Steinke et al. (2016; S16), Steinke et al. (2020; S20), Ullrich et al. (2017; U17), and Tobo et
al. (2014; T14). The grey-shaded area represents the range of our field ns,geo values at a 0.5 ◦ C interval for −5 ◦ C > temperature > −25 ◦ C
(Fig. 8).
Table 5. DFPC-estimated nINP for TXD01 and TXD05 samples. The subscripts of Tot and PM1 represent INP obtained from total aerosol
particles and that from PM1 size-segregated aerosol particles, respectively. Standard deviations were derived based on multiple measurements
for each sample.
Dust nINP × 103 (L−1 ) ± SD Supermicron INP fraction (%)
−18 ◦ C −22 ◦ C −18 ◦ C −22 ◦ C
TXD01Tot 340.0 ± 211.0 2580.0 ± 698.0 26.5 46.5
TSD01PM1 250.0 ± 90.0 1380.0 ± 219.0
TXD05Tot 770.0 ± 110.0 6780.0 ± 426.0 58.4 48.4
TSD05PM1 320.0 ± 116.0 3500.0 ± 1066.0
lower fractions, but the INP sources are presumably differ- served freezing properties of OLLF particles are still miss-
ent. Based on findings from recent studies of size-resolved ing. Lastly, while we did not see a systematic increase in
INPs vs. fluorescent biological particles, these INPs activated supermicron INP fraction as a function of temperature as
at −15 ◦ C are typically thought to be biological (e.g., Huff- shown in Mason et al. (2016; i.e., supermicron INP fraction
man et al., 2013; Huang et al., 2021). While there is evidence at −15 ◦ C larger than at −20 ◦ C), our results in Table 5 show
that terrestrial and marine biological particles play an impor- that nINP,total is always higher than nINP,PM1 for samples used
tant role in immersion freezing of supermicron-sized parti- in this study.
cles (e.g., Ladino et al., 2019; Si et al., 2018; Creamean et
al., 2018), the atmospheric implications of such rare aerosol 3.1.4 Metagenomic analysis
species and their overall impact on aerosol–cloud interac-
tions are still under debate. More recently, high IN efficiency We examined the diversity of Archaea, Bacteria, and Fungi
by supermicron INPs derived from quartz-rich atmospheric in TXD01 and TXD05. We analyzed aerosolized parti-
mineral dust has been reported from different locations, in- cles collected on Nuclepore filters. The results and data
cluding East Asia (Chen et al., 2021) and the eastern Mediter- of metagenomic analysis are summarized in Supplement
ranean (Reicher et al., 2019). These mineral components usu- Table S1. Useful data for Bacteria were generated from
ally contribute to IN at low temperatures. However, there has the amplification and sequencing of the V3–V5 region of
not been much discussion of large soil dust particles, espe- the 16S rDNA phylogenetic marker down to the genus
cially organics, and their contribution to atmospheric IN in and species level. Data on Archaea were generated from
previous studies. Hence, direct implications of which com- TXD05 only. The predominant phyla of Archaea consisted
ponents contribute to IN at different temperatures to the ob- of methanogens, colonizers of the bovine rumen, as expected
(Fouts et al., 2012) (Table S1a). The bacterial fraction of
Atmos. Chem. Phys., 21, 14215–14234, 2021 https://doi.org/10.5194/acp-21-14215-2021N. Hiranuma et al.: Ice-nucleating particles from livestock facilities 14225
the microbiome was dominated by Actinobacteria (the most
abundant phylum, common soil inhabitants), Proteobacteria,
Firmicutes (diverse bacterial phyla with species living in the
soil as well as in the bovine rumen), and Bacteroidetes (com-
mon members of the bovine rumen microflora) (Fouts et al.,
2012; Chaucheyras-Durand and Ossa, 2014). No known IN-
active bacterial species were identified in either sample (De-
sprés et al., 2012), although the genus Pseudomonas (con-
taining IN-active species) was detected in low numbers (Ta-
ble S1b). The predominant fungal taxa in our samples be-
long to Pezizomycetes (Ascomycota), common soil inhabi-
tants. In this taxon, the coprophilic genus Ascobolus was de-
tected in high numbers, as expected (Sarrocco, 2016). The
genera Fusarium (Ascomycota-Hypocreales) and Mortierella
(Mucuromycota-Mortierellales) were also detected in low
numbers. These genera contain species with IN activity;
however, the phylogenetic analysis did not detect any known
IN-active species of these genera (Table S1c). Thus, we did Figure 5. The nINP spectra of OLLF aerosol particles from
not identify any known IN-active microorganisms in our field ambient samples: a comparison of the downwind nINP
samples. This insignificance of the IN-active microbiome (brown) to the upwind nINP (grey) from summer 2017 is shown
and relatively high importance of non-biological supermi- in (a). Different symbol shapes correspond to individual OLLF
cron particles as OLLF-INPs are deemed robust if these par- sites as indicated in the legend. The uncertainties in temper-
ticles are emitted as individual, externally mixed particles. ature and nINP are ±0.5 ◦ C and ± CI95%, respectively. Er-
Otherwise, the observed strong mass dependency of OLLF- ror bars are shown at selected temperatures to make all data
nINP (discussed in Sect. 3.2 below) cannot be explained as points visible. The log-scaled downwind-to-upwind nINP ratios,
microorganisms typically contain small mass (Hoose et al., log(nINP,downwind /nINP,upwind ), for the overlapping temperature
ranges are shown in (b). Note that the uncertainty in this ratio is
2010).
>50 % due to large CI95% errors for measured nINP . The black
dashed line represents the ratio of zero (i.e., no difference between
3.2 Field results
nINP,downwind and nINP,upwind ).
3.2.1 Downwind vs. upwind
Individual PM10 mass (derived from DustTrak measure- The source of upwind INPs is unknown. Since our
ments), nINP , and nm for each sampling date are provided polycarbonate filter samplers were deployed in the close
in Table 6. On average, an extremely high cumulative nINP proximity of livestock pens (14226 N. Hiranuma et al.: Ice-nucleating particles from livestock facilities
Table 6. Summary of the ambient aerosol particle mass and immersion freezing properties of all field samples used in this study: UW denotes
upwind.
Year Date Location Start time End time Cumulative PM mass nINP @ −25 ◦ C nm @ −25 ◦ C
(local) (local) (µg STP)∗ (L−1 STP) (g−1 STP)
2019 20190715 OLLF-1 18:45:00 22:05:00 168.20 8.38E+01 4.18E+08
20190716 OLLF-2 18:45:00 20:29:00 41.92 3.66E+01 3.91E+08
20190724 OLLF-3 19:24:00 20:34:00 105.00 3.11E+02 9.42E+08
20190226 OLLF-1 16:08:00 19:09:00 57.22 1.48E+02 1.84E+09
20190328 OLLF-2 16:26:00 20:52:00 204.55 2.72E+02 1.77E+09
20190420 OLLF-3 17:05:00 21:05:00 34.50 1.10E+02 3.18E+09
20190116 OLLF-1 16:03:00 19:33:00 12.02 4.78E+01 3.31E+09
20190117 OLLF-2 15:48:00 19:30:00 41.53 4.22E+01 8.94E+08
20190118 OLLF-3 15:40:00 18:40:00 251.77 4.35E+02 1.13E+09
2018 20180722 OLLF-1 18:42:00 22:39:00 1281.10 2.31E+03 2.81E+09
20180723 OLLF-2 18:42:00 22:17:00 2917.86 1.10E+04 4.43E+09
20180724 OLLF-3 18:20:00 22:13:00 334.15 3.87E+03 9.84E+09
20180416 OLLF-4 4:53:30 8:06:40 38.92 4.93E+02 1.47E+10
2017 20170709 OLLF-1 19:32:45 22:26:00 445.33 1.09E+03 2.25E+09
20170710 OLLF-2 18:06:00 22:06:30 226.47 1.48E+03 8.00E+09
20170711 OLLF-3 18:28:00 22:08:00 171.52 4.92E+02 3.23E+09
20170709 OLLF-1-UW 19:50:00 22:47:00 12.39 4.22E+01 3.18E+09
20170710 OLLF-2-UW 18:28:00 22:24:00 12.40 1.01E+01 9.78E+08
20170711 OLLF-3-UW 18:41:45 21:54:00 16.53 2.57E+01 1.53E+09
∗ Cumulative values of the mass collected on a filter were estimated by integrating DustTrak mass data, sampling time, and flow rate.
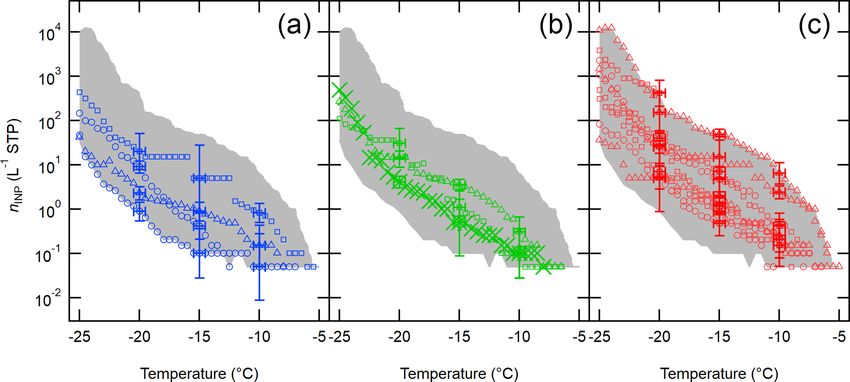
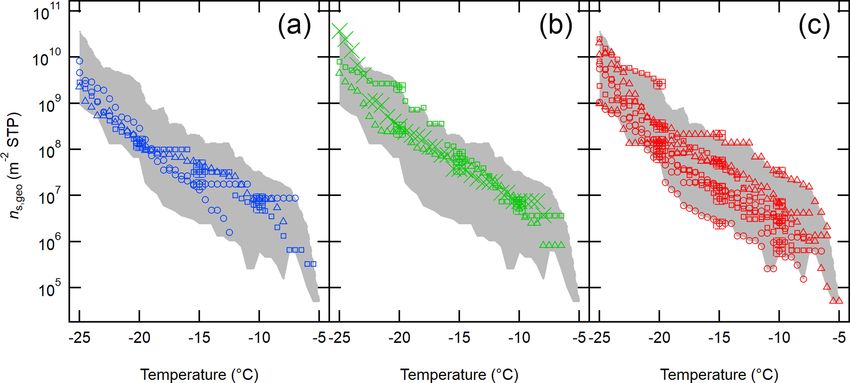
3.2.2 Seasonal variation spring (2.4 × 10⁸ –2.3 × 10⁹ m−2 ), and summer (6.7 × 10⁷ –
2.7 × 10⁹ m−2 ). This observation is consistent with the as-
cribed dominance and importance of large particles as soil
Shown in Fig. 6 is a compilation of nINP,downwind sorted dust INPs.
based on the sampling season (i.e., winter, spring, and sum- Ambient meteorological conditions during the field sam-
mer). Overall, we detected INPs at temperatures lower than pling activities are summarized in Table 7. Resuspension of
−5 ◦ C, and the range of nINP,downwind at −20 ◦ C varied feedlot surface materials is not mainly wind-driven. As men-
in different seasons in 2017–2019: winter (0.9–20.4 L−1 ), tioned in Sect. 3.1.1, cattle movement and hoof action trigger
spring (4.2–31.2 L−1 ), and summer (5.0–421.7 L−1 ). As in- feedlot dust when the air is dry and hot. We performed lin-
ferred from Fig. 6, this seasonality holds true for all investi- ear regression analysis for wind speed vs. PM10 concentra-
gated temperatures. To complement our measurements and tion, and the resulting Pearson correlation coefficient (r) was
observations, more discussion on estimated INPs from an −0.32. Concerning the high variability of PM10 concentra-
OLLF and their seasonal variability is provided in Supple- tions while sampling, we also examined the relationship be-
ment Sect. S5 and Table S2. tween wind speed and cumulative PM mass, and the resulting
The observed seasonal variation in nINP corresponds to the r was −0.35. In addition, we could not find any relevant sta-
variation in cumulative PM mass (Table 6). In fact, we ob- tistical correlations between other meteorological parameters
served a prominent linear relationship between aerosol parti- (temperature, pressure, and RH) and PM10 . We note that pre-
cle mass and INP number concentration (at −25 ◦ C: Fig. 7a). cipitation was not considered in this study because we made
Furthermore, the nm values (Fig. 7b) show a nearly con- sure to sample aerosol particles when the pen surface was
stant value (≈ 3 × 10⁹ g−1 ) at −25 ◦ C (independent of par- dry (at least several days after precipitation). These results
ticle mass concentration). imply the following. (1) Ambient meteorological conditions,
Figure 8 depicts the ns,geo spectra of aerosol particles from as summarized in Table 7, might not be determining factors
OLLF downwind ambient samples, color-coded with differ- for nINP for our study sites. (2) There are abundant supermi-
ent sampling seasons. As seen in the figure, the seasonal cron INPs from the feedlot (Sect. 3.1.3), which potentially
diversity of ns,geo,downwind is less apparent as compared to dominates particle mass and OLLF INPs (Fig. 7). Overall,
that of nINP,downwind (Fig. 6). There is no systematic dif- our offline measurements of ambient nINP using field filter
ference in the range of nINP,downwind in different seasons samples collected in OLLFs show more than several hundred
in 2017–2019 at −20 ◦ C: winter (1.2 × 10⁸ –2.9 × 10⁸ m−2 ),
Atmos. Chem. Phys., 21, 14215–14234, 2021 https://doi.org/10.5194/acp-21-14215-2021N. Hiranuma et al.: Ice-nucleating particles from livestock facilities 14227
Figure 6. Downwind OLLF nINP spectra from 2017 to 2019 sorted based on meteorological seasons are shown: winter (a), spring (b), and
summer (c). The uncertainties in temperature and ns,geo are ±0.5 ◦ C and ± CI95%, respectively, and error bars are shown at −5, −10, and
−15 ◦ C. The shaded area represents minimum − maximum nINP .
Figure 7. Correlation between cumulative PM mass vs. nINP (a) and vs. nm (b) at −25 ◦ C; a linear regression curve in log scale
(nINP = 3.51 × cumulative PM mass − 2.41; r = 0.94) is shown in (a), and the constant value of representative nm at the given tempera-
ture (3.55 × 10⁹ g−1 ), which is a median nm value of minimum − maximum, is shown in (b). Note that the errors in cumulative PM mass
are ±40.4 %. The uncertainty in nINP and nm is ±23.5 %.
INPs L−1 below −20 ◦ C. More interestingly, there is a no- spectra from previous studies across the temperature range
table correlation between INP and PM10 based on our 2017– we examined in our field study. Although our INP detec-
2019 field study, which indicates the importance of large su- tion limit of 0.05 L−1 in this study is higher than Suski et
permicron aerosol particles as INPs. This result supports the al. (2018; ≈ 0.002 L−1 ), our data exceed their data from crop
DFPC characterization of our OLLF samples in a controlled fields (soybean, sorghum, wheat, and corn) or are at least po-
lab setting (i.e., supermicron nINP > submicron nINP ). sitioned towards the higher bound of the S18 data points. The
observed consistent gap between our OLLF data and previ-
3.2.3 Comparison to previous soil dust IN studies ous data holds true even when compared to the globally com-
piled nINP from multiple field campaigns at −15, −20, and
Figure 9 summarizes our field-measured nINP (Fig. 6) in the −25 ◦ C (Kanji et al., 2017), indicating that absolute INPs per
temperature range between −5 ◦ C and −25 ◦ C in compari- unit volume at OLLFs are much higher than previously inves-
son to the previously reported ambient nINP of soil dust and tigated field INP sources.
a compilation of other field-measured nINP from across the
world. We chose to display our estimated nINP with standard 3.3 Laboratory vs. field results
deviations and global reference field nINP data from Kanji
et al. (2017) at their temperature points (i.e., −15, −20, and 3.3.1 Potential source of discrepancy
−25 ◦ C) to make all comparisons visible in this figure. It is
apparent that the OLLF nINP spectra are consistently located Our laboratory- and field-derived ns,geo values for our OFFL
above or overlapping with the upper bound of soil dust nINP samples are comparable to other reference soil and desert
https://doi.org/10.5194/acp-21-14215-2021 Atmos. Chem. Phys., 21, 14215–14234, 2021You can also read