Are polarized courts dangerous for litigation? Evidence from French labor courts - Cambridge ...
←
→
Page content transcription
If your browser does not render page correctly, please read the page content below
Journal of Institutional Economics (2021), 17, 799–820
        doi:10.1017/S1744137421000126

        RESEARCH ARTICLE

        Are polarized courts dangerous for litigation? Evidence
        from French labor courts
        Umberto Nizza
        University of Verona, Verona, Italy
        Corresponding author. Email: umberto.nizza@univr.it

        (Received 27 August 2020; revised 8 February 2021; accepted 10 February 2021; first published online 11 March 2021)

           Abstract
           France relies on unionized judges to assess labor cases in court. The economic literature advocates that
           judges pertaining to the more belligerent unions alter judicial equilibrium, foster lower settlements,
           avoid trials, and intensify a professional judge’s interventions. This paper intends to test whether such
           speculations are accurate. The empirical evidence provided here suggests that such fears are not grounded.
           Using a database on French employment courts, between 2012 and 2016, we show that judges from the
           most adversarial trade unions foster conciliation and reduce the number of dropped legal cases. The lack
           of statistically significant impact of unions on the judicial institution’s dysfunctions is evident: the labor
           judiciary’s alleged polarization does not drive the rate of appeals and the number of professional judges’
           intervention. Finally, the judicial malfunctions appear to be driven by institutional distortions and local
           socio-economic conditions.

        Key words: Confrontational trade unions; judicial decision-making; labor courts; litigation strategies

        1. Introduction
        Are judicial decision-making processes affected by confrontational trade unions? Concerning French
        employment courts – the Conseil de prud’hommes (CPH) – the answer to this vexed question is posi-
        tive. Nevertheless, whether trade unions hamper courts’ regular functionality is a speculation that is
        not substantiated.
            The unionization of judges forms an integral part of the court. The reconciliation of opposite
        worldviews involves judges being representatives of employees and employers and, simultaneously,
        norms’ interpreters. The proactive reconciliation of conflicting interests stimulated a conciliatory
        ambition, therefore escaping the Council to be defined tribunal or court (Mouriaux, 1982).
            The CPH is notorious for bringing litigation before a jury of peers, on a ground-floor equity principle,
        particularly sensitive and aware of each sector’s specific labor issues (Essenberg, 1986). The Council is a
        bicentenary institution and a child of the First Napoleonic Empire, built after a notable insurrection in
        Lyon to guarantee ‘social peace’ (Royer et al., 2016). Hence, the so-called ‘prud’hommes’ are righteous indi-
        viduals of high morality, intended to be ‘professional judges and not judges by profession’ (Mazeaud, 2016).
            Today, the representation of trade unions among judicial members varies across space, and the
        majority of judges are appointed among trade unions that are accustomed to refuse social dialog
        (Andolfatto and Labbé, 2006). The clear mandate of CPH is to protect the interest of those bound
        by an employment contract (Langé and Roulet, 2012), promoting the reconciliation of both social
        partners’ sides. Nevertheless, the average number of conciliations is 6% of cases only.
            The reversal of the core principle of conciliation has been analyzed by the economic literature
        (Desrieux and Espinosa, 2015, 2017, 2019), suggesting that an increase in judges’ membership to
        © Millennium Economics Ltd 2021. This is an Open Access article, distributed under the terms of the Creative Commons Attribution-
        NonCommercial-NoDerivatives licence (http://creativecommons.org/licenses/by-nc-nd/4.0/), which permits non-commercial re-use, distribution,
        and reproduction in any medium, provided the original work is unaltered and is properly cited. The written permission of Cambridge University
        Press must be obtained for commercial re-use or in order to create a derivative work.

Downloaded from https://www.cambridge.org/core. IP address: 46.4.80.155, on 26 Sep 2021 at 21:03:00, subject to the Cambridge Core terms of use, available at
https://www.cambridge.org/core/terms. https://doi.org/10.1017/S1744137421000126
800 Umberto Nizza
adversarial unions affects the settlement and withdrawal of labor cases. According to previous find-
ings, the more the judges’ panel is polarized by hostile unions, the higher are the stalemates and
the referrals of the case to a professional judge.
Hence, the contribution of this paper to the literature is twofold. In the first place, it provides an
instrument to tackle the potential endogeneity bias, overlooked by previous studies. Using a tiny vine-
yards’ parasite – daktulosphaira vitifoliae, known as phylloxéra – we measure the institutional persist-
ence of localized preferences for adversarial unionism. The insect produced the abrupt increase of
obstinate conflict and mass protests at the end of the 19th century, when trade unions rose from
the ashes of a devastating crisis.
We show that territories continue to reflect the dominance of structured confrontational unionism.
The professional elections capture and measure the power and mobilization capacity of unions. Their
encouragement of adversarial class struggle shows the structuring influence of choices made and prac-
tices adopted in the past on present/day decisions (Dormois et al., 2005).
In particular, the paper argues that the archetypal confrontational opposition to social counterparts
can be traced in the obstinate beliefs and deep-rooted values superimposed by the historical opposition
to the phylloxérian plague. The long-lasting effects of the phylloxérian calamity were a radical change
of affected regions, in which social life was routed into angrier and more structured channels (Judt,
2011). In effect, peasants and landowners built the legal and political strength necessary to fight
the agricultural crisis led by phylloxéra.
The political force necessary to protect collective and diffuse interests was entrusted to the ‘syndi-
calisme de lutte’, in clear opposition to gubernatorial immobilism. Despite the prohibition of gather-
ings and the governmental discouragement of permanent structures for mobilizing political support
(Scarrow, 2006), the movement obtained the implementation of a legal tool to defend the wine’s pure-
ness. Empirical results confirm a correlation between the phylloxérian plague and the deep-rooted
attachment of conflictual unions to the same geographic areas.
Ultimately, using phylloxéra as an instrumental variable, we show that labor courts’ functioning is
not obstructed in courts where adversarial unions have power. The paper replicates and extends prior
studies, testing whether lawsuits assigned to polarized judicial panels force lawsuits’ settlement, aban-
donment, and professional judges’ intervention from higher or appellate courts.
The estimations refute previous findings, suggesting the opposite. Using a dataset between 2012
and 2016, the paper shows that an increase of adversarial unionism among judges denotes higher
settlement and fewer abandoned lawsuits. This verdict may sound negative, but it shows that confron-
tational unions promote the core mission of the Council, which is to foster conciliation along with all
the judicial pursuit of justice.
The remainder of the paper is organized as follows. Section 2 describes the Council and the intri-
cate procedure that governs its proceedings. Section 3 reports the research question, whereas the
instrumental variable is described in section 4. The data, empirical strategy, and checks for the instru-
ment’s validity are outlined in sections 5 and 6. Section 7 outlines the results, whereas section 8 is
dedicated to discussing the empirical analysis results. Conclusions are then drawn in section 9.
2. Physiology of the court and procedural oddities
The Conseil is a curious institution that approaches social protection governance with field actors
(Damon, 2017), aware of the realities of the business they face. The principle of ‘paritarianism’ –
which balances employers and employees’ representatives among judges – originates in the 13th century,
when craftsmen conflicts were solved by ‘preux hommes’, i.e. brave counsel men (Bah, 2010). The
Napoleonic court was then marked by field actors characterized by wisdom, experience, foresight, fair-
ness (Hess-Fallon et al., 2015), and notorious for their prudence and useful advice. Judges were expected
to grant ‘social peace’ and improve the management of changing labor demands (Royer et al., 2016).
During the years, the counseling role of prud’hommes has consolidated a particular ‘labor lan-
guage’ (Tucker, 2005) that advocates for social partners’ direct action to promote social issues in
Downloaded from https://www.cambridge.org/core. IP address: 46.4.80.155, on 26 Sep 2021 at 21:03:00, subject to the Cambridge Core terms of use, available at
https://www.cambridge.org/core/terms. https://doi.org/10.1017/S1744137421000126Journal of Institutional Economics 801
court. From that standpoint, one of the most relevant aspects of this ‘counseling roots’ sinks in the
intention to give guidance and go straight to the heart of the relations between employers and employ-
ees. The original mission and nowadays primary assignment of CPH is to foster the conciliation of
distant social partners. Hence, the ‘meeting of the patronal and militant humanism’ (Cam, 1981)
attaches prime importance to human relations and fundamental needs.
The Council should promote the settlement of individual disputes arising between all kinds of
employees and their employers throughout the employment relationship (Subileau, 1999). A judgment
should only be considered if the conciliatory initiative fails. Therefore, the CPH’s declared objective is
to balance both social partners’ requests. Accordingly, the conciliation of lawsuits is a crucial aspect,
even in the case of legitimate or unlawful terminations of contracts.
The jurisdiction concerns solely the private labor sector, involving parties from the commercial,
industrial, agricultural, civil, or liberal sectors (Favennec-Héry and Verkindt, 2016), bounded by an
employment relationship. Hence, all officers that work in the public service must bring their dispute
before the Administrative Court. Finally, it suffices to say that the ‘paritarian’ nature forces a dialog
between social partners (Mazeaud, op. cit.). Judicial panels are composed of pairwise lay assessors, bal-
ancing the composition of the court’s formation in respect of the equality between the judges elected
among social partners’ associations (Siau, 2016).
The professional elections were held, until 2018, every 5 years to measure the power and the mobil-
ization capacity of employees’ associations and employers’ trade unions. A professional judge’s inter-
vention is only eventual and restricted to specific situations of an impasse between the counselors in
reaching a verdict.
The legal procedure is the following. A preliminary and mandatory phase involves an attempt at
conciliation between the parties before a conciliatory panel, the ‘bureau de conciliation’ (BC). The
BC is the expression of the legislator’s aim to favor in-court amicable resolution of disputes. The
BC is composed of an equal number of counselors – one employee and one employer representative
– and is responsible for informing the parties of their rights and duties and taking a proactive behavior
in seeking settlement (Auzero et al., 2017).
The transition before the BC develops with a non-public hearing, in which each party provides
explanations and can be heard in confidentiality. In case of arrangement between litigants, the dispute
ends with a minute of agreement. In case of disagreement, the case is sent to a different judgment
office (JO), composed of four members, balanced between employers and employees in the same man-
ner as the BC (Peskine and Wolmark, 2016). If the parties do not appear before the JO, the suit is
abandoned by default. The JO should have the final say in the fate of the labor lawsuit.
In the event of a stalemate in reaching a shared verdict, the case is referred to a professional magis-
trate of the District Court’s equivalent (Tribunal d’Instance), who has the casting vote. This procedure
of tiebreak is called départage (DP). A schematic representation of the legal steps described above is
given in Figure 1 to facilitate the general understanding of the prud’homal procedure.
Disputes’ settlement is not only the principal aim of prud’hommes but also a legal ‘substantial for-
mality’ (Bataille, 2017). Hence, the omission of conciliatory attempt invalidates the entire procedure.
In this sense, conciliation acts as the guarantee of a compromise, tested and discussed locally by social
partners in the appropriate forum (Cottereau, 2002). However, the French characteristic is a low rate of
settlements, constantly decreasing (Barthélemy and Cette, 2015).
Ultimately, the so-called ‘paritarianism’ is only illusory (Tillie, 2015). The reality shows a disequi-
librium inside the institution, directed by the employees’ counselors (Willemez, 2012). On the one
hand, unionists become judges only after an experienced militant career as employees’ defenders
(Tomás et al., 2014). They are the judicial mouthpieces of the union responsible for electing them
(Kessler, 2010), with a clear mandate to operate accordingly. On the other hand, many judges are
not affiliated to a professional organization within the employing college, thus having difficulties iden-
tifying employers’ collective interests and behaving actively in the courtroom (Michel and Willemez,
2009). Following the absence of a specific mandate and the lack of specific legal skills, the result is that
employers’ dossiers are undefended (Rabier, 2016).
Downloaded from https://www.cambridge.org/core. IP address: 46.4.80.155, on 26 Sep 2021 at 21:03:00, subject to the Cambridge Core terms of use, available at
https://www.cambridge.org/core/terms. https://doi.org/10.1017/S1744137421000126802 Umberto Nizza
Figure 1. A schematic description of all judicial phases before the Conseil de prud’hommes.
3. Research question
The paper intends to test whether litigants adapt their decision-making processes before courts
marked by the most confrontational trade unions’ presence.
The literature has proposed a confrontation propensity measure of unions, suggesting that
Confédération Générale du Travail (CGT) and Force Ouvrière (FO) are the most adversarial syndi-
cates. Lawsuits assigned to judges with such ideological predispositions are more likely to be with-
drawn and referred to départage (Desrieux and Espinosa, 2019).
The same scholars suggest that these unions, which they label as ‘non-reformist’, would be char-
acterized by more decisive confrontations with the employers’ federations than the ‘reformist’ trade
unions (Desrieux and Espinosa, 2017). The literature alludes that such unions favor the conciliation
of ‘poor quality lawsuits’ that would be otherwise detrimental to the employee (Desrieux and
Espinoza, 2015).
Nonetheless, even though these studies acknowledge that the population’s preferences affect both
judicial and electoral strategies, none of them find a suitable solution to endogeneity. The proportion
of confrontational unions in the prud’homal judiciary is the result of an election, which is known to be
dependent on a heterogeneous list of driving circumstances (Kelley, 2016), such as prospective time
horizons (Evans and Andersen, 2006) and political factors, with clear endogenous consequences
(Wlezien et al., 1997).
We propose a suitable instrument, identified in the diffusion of the inexplicable and terrible
phylloxérian disease (Gale, 2011), circulated in France at the end of the 19th century. Hence, we intend
to test whether speculations on polarized prud’homal justice are grounded.
Two main questions are proposed here. First, we test whether previous speculations on CGT and
FO’s role in the conciliation and withdrawal of lawsuits operate with a different empirical strategy.
Prud’hommes are essentially unionists. Hence, we should expect that polarized courts promote appli-
cants’ rights in court, not vice versa. An increase in confrontational unions among courts should foster
conciliation and reduce dropped lawsuits.
Second, we test whether polarized courts are characterized by verdicts deemed ‘unfair’ by the par-
ties or other judges. On some occasions, councilors are said to use ‘fertile imagination’ and ‘creativity’,
imposing obstacles to the balanced examination of the claims made by employees (Derouvroy, 2004).
Downloaded from https://www.cambridge.org/core. IP address: 46.4.80.155, on 26 Sep 2021 at 21:03:00, subject to the Cambridge Core terms of use, available at
https://www.cambridge.org/core/terms. https://doi.org/10.1017/S1744137421000126Journal of Institutional Economics 803
Consequently, we should expect an increase of départage and appealed lawsuits in situations of more
significant conflict and, therefore, an appreciably lower consensus on the application and interpret-
ation of labor standards.
That being the questions to be answered, it is now necessary to briefly address our instrumental
variable’s historical background.
4. Phylloxérian IV: a sudden shock inflaming French society
To tackle the previously mentioned endogeneity issues, we instrument the confrontational level among
courts with the degree of infection of phylloxéra in 1882. The phylloxérian ‘black evil’ (Bazin, 2004)
was originated from the transfer from the USA to France of alien vineyards (Planchon, 1874), dissem-
inating silently like wildfire (Carton et al., 2007).
A single parasite can produce alone up to several hundred eggs (Powell, 2012) and, unlike aphids,
phylloxéra produces no externally excreted waste products (Granett et al., 2001), with unexpected and
inexplicable death of vineyards. At the 19th century’s end, the plague was described as a ‘spot of oil
upon a paper’ (Amerine, 1991; Jemina, 1887) and an unsolvable calamity asking for a miracle to stop
(Riley, 1883).
France was the first worldwide producer of wine. The wine sector was the second greatest agricul-
tural asset (Zolla, 1903) and principal French export (Bittner, 2015). The economic and social conse-
quences were grave, exceeding the French–Prussian war debt (Pouget, 2019).
The infection triggered a significant drop in wine production, from almost 57 to 29 million hecto-
liters (cf. Bateman, 1883; Stevenson, 1980), and a notable decline in average prices (Gide, 1907). The
‘pure juice’ (Beaulieu, 1885), once renowned throughout Europe, was challenged by the rising supply
of lower-quality and counterfeited wine – with the addition of alcohol, sugar, and raisins from Greece
and Asia Minor – collapsing the market of the principal French excellence at the time (Nye, 2018).
However, society did not sit on its hands. Winegrowers considered themselves isolated materially
and morally (Lhomme, 1970), and the vineyard’s rapid destruction caused a general tumult. The soci-
ety was dominated by small cultivators and farmers (Carpentier and Lebrun, 2004), with independent
and middle-class winegrowers who were outspoken supporters of a societal revolution.
Despite restrictions to the right to unionize and strike, the entire society clamored for a turnaround
in the law against fraud and adulteration (Frader, 1991). The perceived absence of the State – that was
supposed to protect the market face to fraud (Stanziani, 2003) – pushed toward the radicalization of
the militancy and the cooperative approaches’ refusal to gubernatorial immobilism.
Although reformism admitted that ‘capitalism could be corrected from within’, without confron-
tational action (Nordmann, 2018), newborn movements promoted direct actions, massive demonstra-
tions, and a great distrust of any theoretical and political drive (Vedel, 2002). The phylloxérian crisis
eroded adults and children’s living conditions (Banerjee et al., 2010) and fostered social forces’ mobil-
ization via political associations (Cirone, 2018).
The emergence of an intensive class struggle was intended to promote legalism through new market
forces (Conklin et al., 2015). The destruction led by the insect paved the way for structured move-
ments, with clear strategies, professionalized activists, and institutionalized networks (Dufour,
2013). In particular, massive demonstrations were held as a ‘natural instrument of class struggle’
(Gervasoni, 2006) to raise consciousness on the existing ‘precariousness of existence’ (Ferré, 1997).
The phylloxérian revolt was the biggest massive popular uprising experienced by France after the
Revolution (Pech, 2007). The autonomous action of vinedressers became steeped in revolutionary
ideologies (Friedman, 1988), encouraged by sentiments of fraternity and national solidarity from
the high-middle class, lawyers (Ferran, 2007), deputies, prefects, and even mayors (Pech, 2014).
The requests of wine-makers had a broader goal to obtain political insurance to have the market
run smoothly and efficiently (Gavignaud-Fontaine et al., 2009). The echoes of the confrontational
opposition to the government and the army’s mutiny, hesitating in overturning the protests (Le
Bras, 2018), reached the Parisian parliament (Lemarchand et al., 2008).
Downloaded from https://www.cambridge.org/core. IP address: 46.4.80.155, on 26 Sep 2021 at 21:03:00, subject to the Cambridge Core terms of use, available at
https://www.cambridge.org/core/terms. https://doi.org/10.1017/S1744137421000126804 Umberto Nizza
Eventually, the movement’s success was enacting the registered designation of origin and protected
geographical indication, still in use today. The newly introduced anti-fraud mechanism resulted from
the confrontational class struggle developed locally in more than 30 years of empowerment and fusion
between social classes (Verdejo, 2007).
The rise of trade unions was shaped by prominent personalities having experienced fierce oppos-
ition to the central government’s inactivity. Two examples are engraved in stone. Paul Ader, a vine-
dresser who fell on hard times during the plague (Smith, 1978), was one the prominent signatory
of CGT’s Charter of Amiens. The Charter was the manifesto and principal theoretical reference of
revolutionary syndicalism in response to the ‘schizophrenic situation’ (Julliard, 2006) of
post-phylloxérian society. Following the wartime parenthesis, CGT registered a schism between social-
ist and non-partisan members, ostensibly financed by the overseas intelligence to strengthen the power
of ‘non-bolshevik’ unions (Lacroix-Riz, 1990) and foster antagonism among syndicates (Hanley et al.,
2005).
Despite the sudden fragmentation of confrontational syndical representativity, FO is a ‘historical
construction’ (Béroud et al., 2018), and its origins are engraved in the Amien’s idea of class struggle
as a tool ‘for a global transformation of society’. Even the secretary and founder of the union, Robert
Bothereau, former leader of CGT since 1909 and descendant of a quadricentennial vinedresser family
(Pennetier, 2003), acknowledged that CGT-FO was the ‘continuation of the CGT of the Charter of
Amiens’ (Da Silva, 2017).
Consequently, even with significant differences in the role of socialism in the class-warfare, both
trade unions capitalize their consensus on strike and stiff methods of opposition to the government
and the masters. The adversarial methods of class struggle are the fruit of prolonged sedimentation
of social behavior. As suggested by the literature, psychological mechanisms and local culture can
be driven by the incidence of disease-causing pathogens (Fincher et al., 2008).
Hence, this paper supports the existence of a robust connection between the phylloxérian plague
and the confrontational stiff of trade unions. Path dependency mechanisms rely on a set of forces
that encouraged the previous choice to be sustained, given the creation of positive externalities and
benefits when such choices are repeated in time (Page, 2006). It has already been said that French
heat is dependent upon the position of legal and political strength built up by peasants in the course
of eras of successful resistance against their exploitation (O’Brien, 1996: 23).
It seems that local consolidation of confrontational syndical methods was the answer to the deten-
tion of vinedressers’ representatives and the repression of dissenting voices (Geslin, 1990). Indeed, the
French antagonistic universe supported a cause connected with everyday life by putting pressure on
the institutions and the power in place (Sirot, 2002).
If this intuition holds, we might record a correlation between the degree of phylloxérian infection
and nowadays manifestation of confrontational syndical heat through professional elections. In the
next sections, the empirical strategy necessary to reach such a verdict will be detailed.
5. Data and methodology
The investigation is based on a balanced panel dataset of 201 annual observations between 2012 and
2016. Descriptive statistics are provided in Table 1.
The data were collected from the National Institute of Statistics and Economic Studies (INSEE), the
Statistical Office of the European Union (EUROSTAT), the Ministry of Labor, Employment and
Integration, and the Ministry of Justice. The instrumental variable and its alternative vineyard IV
are implemented according to a Ministerial Decree dated 26/02/1882 and two original maps from
the French National Archives. The sample is restricted to Metropolitan France, excluding overseas ter-
ritories due to their unique legal status and autonomy level.
Furthermore, the Councils of Carcassone and Créteil are excluded due to the lack of information
regarding lawsuits’ duration and courts’ backlog. That reduces the sample from 1,015 observation to
1,005. The merges and suppressions that happened to local urban agglomerations across the years are
Downloaded from https://www.cambridge.org/core. IP address: 46.4.80.155, on 26 Sep 2021 at 21:03:00, subject to the Cambridge Core terms of use, available at
https://www.cambridge.org/core/terms. https://doi.org/10.1017/S1744137421000126Journal of Institutional Economics 805
Table 1. Descriptive statistics
Quantiles
Variable n Mean S.D. Min 0.25 Mdn 0.75 Max
Polarized judges 1,005 57.74 10.89 27.78 50.00 58.82 65.00 95.00
Conciliation rate 1,005 7.20 4.29 0.69 4.35 6.33 9.06 42.60
Lawsuits’ drop 1,005 9.78 5.04 0.71 6.69 8.96 11.50 55.45
rate
Appeal rate 1,005 29.99 12.09 0.00 23.66 28.71 35.23 107.37
Départage rate 1,005 15.57 12.69 0.00 6.70 12.30 21.30 85.40
Clearance rate 1,005 61.94 27.13 8.66 48.31 58.16 70.23 461.05
Backlog rate 1,005 112.18 50.79 17.58 76.50 102.33 136.71 415.04
Losing rate 1,005 28.91 10.23 4.23 22.60 28.12 34.16 88.72
Rate of farmers 1,005 2.31 1.95 0.01 0.76 2.06 3.29 10.85
Rate of employees 1,005 28.63 2.43 18.25 27.19 28.76 30.17 34.26
Rate of workmen 1,005 23.52 5.36 6.09 20.01 24.03 27.24 35.79
Unemployment 1,005 9.73 1.78 5.04 8.61 9.54 10.68 16.06
rate
Inactive rate 1,005 26.68 2.48 19.49 25.13 26.62 28.00 35.31
Jobseekers rate 1,005 42.02 5.07 20.10 39.70 42.70 45.20 52.30
Rural towns rate 1,005 40.16 10.61 0.00 38.07 43.33 46.73 49.51
Note: The table provides the descriptive statistics of the balanced panel dataset on which this paper is based. The dataset includes detailed
observations of 201 labor courts during the period 2012–2016. The data concerning judicial figures are publicly available from the Ministry of
Justice’s institutional website, whereas the results of professional elections among prud’hommes are retrieved from the Ministry of Labor.
The data of socio-economic controls, at NUTS3 level, come from EUROSTAT and INSEE.
taken into duly consideration and territorial adjustments to the active population’s concentration per
territory. Hence, combining the data from official sources, this paper relies on an innovative dataset,
composed of aggregate observations at the court level, concerning almost the totality of the so-called
French Hexagon’s labor jurisdictions. Lamentably, the rate of rural towns and long-term jobseekers
were available only at the departmental level.
Ultimately, the variance within the single judicial panels is not visible since the data were publicly
available only at the court level. The pitfall of data-aggregation is that we cannot analyze whether non-
polarized courts attract specific lawsuits or measure the potential effect of the public opinion on the
judges.
6. Empirical strategy and econometric model
The empirical line is to estimate the potential effect of confrontational judicial polarization on legal
decision-making processes. To this end, this contribution uses the following linear model:
Yc,t = b1 counsc + b2 Xc,t + at + 1c,t
The dependent variable Y represents four outcome variables that measure litigants’ decision-
making processes: the rate of conciliated cases, abandoned cases, départage, and appealed lawsuits,
registered for each Council c, and every year of observation t.
The main explanatory variable is couns, representing the proportion of judicial seats distributed
within the most belligerent trade unions across CPH, which has not changed since the last polls in
2008. The variable is instrumented as described in detail below.
Downloaded from https://www.cambridge.org/core. IP address: 46.4.80.155, on 26 Sep 2021 at 21:03:00, subject to the Cambridge Core terms of use, available at
https://www.cambridge.org/core/terms. https://doi.org/10.1017/S1744137421000126806 Umberto Nizza
To reduce the effect of confounding variables, X defines a vector of control variables, including
judicial-related factors: the rate of judgments unfavorable to the plaintiff (losing rate); the clearance
rate, constructed as the proportion between judgments and incoming cases; the rate of backlogged
instances; the monthly duration of lawsuits. All variables are registered annually among each
jurisdiction.
The vector also includes some socio-economic controls represented by the rate of farmers, work-
men, and employees among the active population; the rate of unemployment; the rate of inactive indi-
viduals, defined by the INSEE as individuals not working and not actively looking for a job or not
quickly available to occupy one. These variables are constructed as a proportion of the population
existing in the catchment area of every single CPH for each year of observation. Finally, the controls
include the yearly rate of long-term jobseekers and the rural towns’ rate among departments.
Hence, since we are dealing with a balanced panel dataset, the regression model includes year-fixed
dummies (αt), to capture the potential influence of aggregate (time-series) trends. Courts fixed effects
are excluded because the primary explanatory variable – represented by the proportion of judges
elected, at the last professional elections, among CGT and FO – is time-invariant.
Being aware that multiway clustering might have a tremendous impact on the estimated standard
errors and associated p-values (Cameron et al., 2011), we proceed by making a simultaneous adjust-
ment of standard errors to the serial double-correlation of residuals at the temporal and judicial coun-
cil levels.
Eventually, the model also includes unobserved random terms that are represented by ϵ.
6.1 Design of the instrument and weakness check
To test the institutional persistence of confrontational preferences among territories with a strong
tradition of struggle, we rely on an 1882 Ministerial Decree. The Decree imposed limitations on intro-
ducing foreign vineyards and vines from phylloxérian affected cantons, which might be assimilated to
the USA’s districts.
Following a map shown in Girard (1883), we can superimpose the zones gravely attacked by
phylloxéra at the peak of the infection with the existing labor jurisdictions. According to epidemio-
logical insight, we assign values to our IV, fitting the level of infection registered by the legislator.
The instrument takes a value of 0 if no local infection was discovered, and it takes a value of 1 if
phylloxéra is only ‘spotted’ in few vineyards. The instrument is set with a value of 2 for the zone of
‘outbreak’ of the disease, being the term synonymous with a localized epidemic exceeding what would
usually be expected in a given area (Aschengrau and Seage, 2020). Finally, the instrument takes a value
of 3 where the disease is ‘hyperendemic’, namely present at a high incidence (Kadri, 2019).
For the sake of completeness and to perform a validity check of exclusion restrictions, we substitute
the IV with a wine-growing instrument. The dummy instrument takes a value of 1 in the presence of
vineyards and 0 otherwise. The first stage regression between vineyards and CGT/FO is reported in the
Appendix (Table A2).
The visual representation of the phylloxérian and wine-growing IV is compared with current judi-
cial districts in Figure 2 (see Table A1 for the values assigned to each CPH).
The statistically non-significant results between vineyards and judicial unions demonstrate that the
most confrontational syndicates capitalize on their consensus where – at the peak of the crisis and
before acknowledging potential solutions – the plague was overwhelming the community with the
unexpected crisis.
6.2 Testing instrument strength and over-identifying restrictions
The empirical results of the first stage, and the cluster-robust test statistics, are reported in Table 2.
The distribution of the F-statistics is at 1% threshold. The rule of thumb for the IV’s validity is an F
statistic of 10 (Staiger and Stock, 1997). On the other hand, regarding under-identification and
Downloaded from https://www.cambridge.org/core. IP address: 46.4.80.155, on 26 Sep 2021 at 21:03:00, subject to the Cambridge Core terms of use, available at
https://www.cambridge.org/core/terms. https://doi.org/10.1017/S1744137421000126Journal of Institutional Economics 807
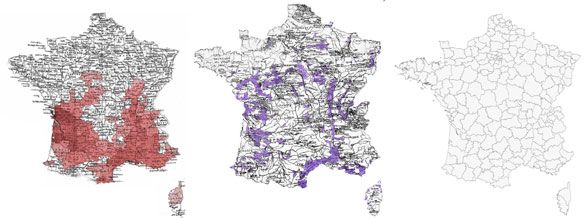
Figure 2. To the left, a crop of the map showing the diffusion of phylloxéra among cantons in 1882. In the middle, the distribution
of wine-producing zones in 1863. On the right, the judicial geography of CPH nowadays. Sources: Girard (1883), Bibliothèque
Nationale de France, and Qgis/Ministry of Justice.
Table 2. Estimation results of the first-stage regressions and relative tests
1st stage CGT/FO CGT/FO CGT/FO CGT/FO
Degree of phylloxérian 2.449*** 2.528*** 2.518*** 2.505***
plague
(0.234) (0.233) (0.234) (0.235)
Covariates Yes Yes Yes Yes
Years dummies Yes Yes Yes Yes
Observations 1,005 1,005 1,005 1,005
F Statistics 109.04*** 117.83*** 115.45*** 113.62***
Sanderson–Windemeijer 111.25*** 120.22*** 117.79*** 115.93***
χ2
Cragg–Donald Wald F 81.58 87.31 86.24 85.54
statistic†
Kleibergen–Paap Wald F 109.04 117.83 115.45 113.62
statistic†
Kleibergen–Paap rank LM 86.65*** 91.68*** 90.62*** 89.84***
test
Outcome variable Conciliation Abandon Départage Appeal
Double-clustered standard errors in parentheses.
***p < 0.01, **p < 0.05, *p < 0.1.
Note: The table shows the estimation results of the first stage of 2SLS, between the rate of judges appointed among non-reformist trade
unions (CGT/FO) across CPHs and the dummy variable representing the phylloxérian infection. The table also presents the first stage
identification statistics, reporting the results of the test performed on redundancy, under-identification, and weak identification with
F-distribution at 1%. The Stock–Yogo weakness threshold (†) is set, for one instrument and 10% maximal IV size, at 16.38.
weakness, the literature advises considering the instrument weak if tests’ values are below the critical
threshold of 16.38, at 10% maximal IV size (Stock and Yogo, 2005).
All reported statistics are considerably above such a critical threshold. As anticipated above, the
phylloxérian shock still impacts radicalized unions’ designation among prud’hommes, confirming
that labor judges’ alleged belligerency has important roots in history.
According to the estimations, the average increase in adversarial trade unions’ professional electoral
polls is around 2.4% of the votes’ share. This result suggests that territories where the plague triggered
revolts and social struggles are still characterized by strong revolutionary syndicalism, which devotes
most of the share of votes to CGT and FO.
Downloaded from https://www.cambridge.org/core. IP address: 46.4.80.155, on 26 Sep 2021 at 21:03:00, subject to the Cambridge Core terms of use, available at
https://www.cambridge.org/core/terms. https://doi.org/10.1017/S1744137421000126808 Umberto Nizza
Concerning exclusion restrictions, the phylloxérian infection should affect the outcome variables
only through the proportion of confrontational trade unions, even though the assumption is not veri-
fiable (Labrecque and Swanson, 2018).
In this regard, it should suffice to mention that lawsuits are heavily dependent on parties’ circum-
stances (e.g. dismissal, discriminations, mobbing, and failed payment of wage), and laws and regula-
tions are independent from the viticultural disease that happened two centuries ago. On the contrary,
French unions’ passionate attachment to society is deeply attached to historical reasons. French unions
were able to confront even the most terrible chimeras (Sirot, 2011), and the phylloxérian crisis repre-
sents one of the most striking examples.
7. Estimation results
The empirical results of the 2SLS estimations are summarized in Table 3.
Before proceeding further with quantile regressions, prudence should suggest at least to test for
endogeneity. The Durbin–Wu–Hausman test is not valid with clustered covariance estimators, so
we test endogeneity with the difference-in-Sargan statistic tests. The C-test suggests that the dependent
variable does not appear as exogenous and shall be treated as endogenous, confirming that profes-
sional elections have to be instrumented. The two-stage least squared coefficients should be unbiased
and efficient (Angrist et al., 1996). Nonetheless, since every serious estimate should be supplemented
with a reliable assessment of precision (Koenker and Hallock, 2001), we report quantile empirical
results to check our parameter of interest’s sensitivity to the sample structure.
7.1 Quantile regressions
The coefficients of the second stage of least trimmed quantile regressions are reported in Table 4.
The least trimmed instrumental quantile regression is a robustness check capable of reducing the
outliers’ influence on the explanatory variable (Neykov et al., 2012) and removing dirty estimators and
inefficient statistics. The idea is to use a α-trimmed mean of the sample after the proportion of largest
and smallest observations are removed from the dataset (Koenker and Bassett, 1978). The literature
considers optimal a trimming proportion between 5 and 10%, and both suitable arrangements of
the dataset are reported in Table 4.
8. Discussion
The coefficients of the quantitative estimations reported above suggest several conclusions. First and
foremost, the results are robust to variations of the sample. The strength and validity of the instrument
are undiminished by the elimination of the outliers. Even after the trim, the first-stage F statistics’
values, at the 1% threshold, remain abundantly above any critical value. In the second place, the
empirical evidence suggests no statistically significant impact of judges on the rate of appeals and
départage.
Consequently, it appears that courts deemed to be ‘polarized’ by confrontational unions are not
characterized by a dissatisfaction with the verdict, both from the judicial and litigants’ point of
view. On the contrary, belligerent unions play a significant role in reducing cases withdrawn and a
constructive influence on conciliation. As a remark, the statistical significance and magnitude of con-
frontational unions’ effect on conciliation and abandonment of lawsuits increase with the progressive
elimination of outliers from the dataset.
Hence, the results confirm that unionism has a significant role in the functioning of alternative dis-
pute resolution mechanisms, where judges consider themselves as arbiters of the ultimate fairness of
labor rules (Yeazell, 1998). Conciliation is the fundamental procedural principle and the keystone of
CPH. Thus, it was critical to examine its determinants.
Downloaded from https://www.cambridge.org/core. IP address: 46.4.80.155, on 26 Sep 2021 at 21:03:00, subject to the Cambridge Core terms of use, available at
https://www.cambridge.org/core/terms. https://doi.org/10.1017/S1744137421000126Journal of Institutional Economics 809
Table 3. Two-stage least squared estimation results
Conciliation Drop of suits Départage Appeals
Confrontational unions 0.120*** −0.113** 0.0822 0.141
(0.0415) (0.0527) (0.136) (0.140)
Conciliation rate −0.0373 −0.0376 −0.150*
(0.0452) (0.110) (0.0901)
Lawsuits’ drop rate −0.00151 −0.000338 −0.0745
(0.0315) (0.107) (0.0688)
Départage rate −0.0109 0.00329 0.0132
(0.0134) (0.0203) (0.0459)
Appeal rate −0.0192 −0.0170 0.0201
(0.0119) (0.0128) (0.0473)
Clearance rate −0.0208** −0.0295*** 0.116*** 0.169***
(0.00963) (0.00896) (0.0387) (0.0299)
Backlog rate 0.000668 0.00561 0.00354 0.0448***
(0.00356) (0.00464) (0.0104) (0.00929)
Losing rate −0.0126 −0.00784 −0.114** 0.0358
(0.0157) (0.0153) (0.0506) (0.0470)
Duration of lawsuits −0.139*** 0.0333 0.890*** −0.382**
(0.0478) (0.0673) (0.172) (0.177)
Rate of farmers −0.359*** 0.170 −0.292 −0.510
(0.115) (0.142) (0.407) (0.425)
Rate of employees −0.492*** −0.138 0.0333 −0.372
(0.0778) (0.104) (0.262) (0.241)
Rate of workmen 0.247*** −0.0442 0.0219 0.116
(0.0342) (0.0463) (0.112) (0.0972)
Unemployment rate −0.537*** −0.205 −0.194 −0.612
(0.155) (0.176) (0.467) (0.430)
Inactive rate 0.0913 0.0210 0.291 0.854***
(0.0928) (0.0885) (0.248) (0.245)
Jobseekers rate −0.0687* 0.0194 −0.0259 −0.148
(0.0409) (0.0432) (0.101) (0.130)
Rural towns rate 0.0124 0.00739 −0.00553 −0.0842**
(0.0146) (0.0170) (0.0397) (0.0344)
Time indicators Yes Yes Yes Yes
Clusters 1,005 1,005 1,005 1,005
Observations 1,005 1,005 1,005 1,005
R2 0.123 0.067 0.214 0.150
(Continued )
Downloaded from https://www.cambridge.org/core. IP address: 46.4.80.155, on 26 Sep 2021 at 21:03:00, subject to the Cambridge Core terms of use, available at
https://www.cambridge.org/core/terms. https://doi.org/10.1017/S1744137421000126810 Umberto Nizza
Table 3. (Continued.)
Conciliation Drop of suits Départage Appeals
Adjusted R 2 0.105 0.048 0.198 0.133
Double-clustered standard errors, at court and year level, in parentheses.
***p < 0.01, **p < 0.05, *p < 0.1.
Note: The table shows the 2SLS estimates on a panel of 201 yearly observations of French labor courts, between 2012 and 2016. The
dependent variables are the rate of cases settled in court, the rate of lawsuits dropped, the rate of cases appealed, and sent to départage.
The variable polarized is the rate of judges elected among the most confrontational trade unions. The sources of data for labor litigation and
socio-economic controls are the Ministry of Justice and EUROSTAT/INSEE, respectively. All other variables are defined in section 5. Year
fixed-effects are included in all specifications.
Nevertheless, these results should not come as a surprise. Courts deemed to be ‘polarized’ follow
the archetype of a ‘unionist judge’ that suggests to the parties to assert their rights, even if doing so
is costly and time-consuming. If courts are effectively headed by employees’ counselors (Willemez,
2012) and ‘paritarianism’ is fictional (Tillie, 2015), these results are quite important.
They show that confrontational unionism does not deter the litigation process, inducing parties,
with potential ‘moral suasion’ mechanisms, to address their labor grievances to the very end. The evi-
dence seems to confirm the speculations that prud’hommes use a paternalistic logic of conciliation and
fairness, fostering an ideology of concord that avoid the transformation of disputes into litigation and
possibly into conflicts (Willemez, 2015).
If we concentrate our attention on excessive backlog and duration of legal cases, we can explain the
partial drainage of judicial responsibilities in favor of a professional judge. A unitary increase in the
monthly duration of lawsuits reduces the number of conciliated lawsuits, increases the rate of
départage, and decreases the number of appeals. The more time-consuming is the procedure, the
more the litigation pace and judicial endurance are intense. The same pernicious effect might be
found regarding a raise in the backlogs’ rate: for one unitary increase of judicial caseload, lawsuits
are more easily appealed.
Interestingly, the same perverse effects can be considered under the impact of the clearance rate,
which captures the court’s caseload that is not considered overdue (otherwise, it is intended by the
Ministry of Justice as a ‘backlog’). Intuitively, a rise in the ratio between incoming and adjudicated
cases involves fewer lawsuits settled or abandoned (having already reached the trial stage).
Simultaneously, the implication of additional judgments is an increase of appeals and a rise in
départage, probably to reduce the caseload that weighs the judiciary.
All these results, combined, confirm that procedural flaws are attached to the chronic under-
endowment of this jurisdiction, which results in justice contrary to reasonable time principles (cf.
Tournaux, 2016, and Tribunal de Grande Instance de Paris judgment 11/02506). Note that the con-
ciliation rate negatively affects the number of appeals, probably because of a reduction of verdicts
issued by the court: the more conciliations, the fewer judgments rendered.
Nonetheless, even though this evidence might appear trivial and intuitive, the underlying reasons
for this phenomenon should be investigated further since filing an appeal does not necessarily imply
pursuing it to its natural conclusion (Eisenberg, 2004). Future case-by-case analyses might concentrate
their attention on this particular aspect.
Finally, it is interesting to notice that the least trimmed instrumental quantile estimation coeffi-
cients show that the increase in plaintiffs’ losing rate entails a decrease in conciliation. Courts that
tend to refute plaintiffs’ arguments increase the litigiousness inherent in the court, with the possible
result that settlement is less accessible from both litigants and judges’ point of view.
Economic controls reveal some statistically significant impacts. Inactive individuals’ rate seems to
impact the number of appeals substantially, whereas a raise in the local unemployment rate implicates
a reduction of settlement and dropped lawsuits. The health of the employment state is somewhat deli-
cate. The situation of less favorable working conditions waters down judicial agreements between the
parties and promotes uncompromising litigation.
Downloaded from https://www.cambridge.org/core. IP address: 46.4.80.155, on 26 Sep 2021 at 21:03:00, subject to the Cambridge Core terms of use, available at
https://www.cambridge.org/core/terms. https://doi.org/10.1017/S1744137421000126https://www.cambridge.org/core/terms. https://doi.org/10.1017/S1744137421000126
Downloaded from https://www.cambridge.org/core. IP address: 46.4.80.155, on 26 Sep 2021 at 21:03:00, subject to the Cambridge Core terms of use, available at
Table 4. Least trimmed instrumental quantile regression’s estimation results
Trimming proportion 5% 5% 5% 5% 10% 10% 10% 10%
1st stage
CGT/FO CGT/FO CGT/FO CGT/FO CGT/FO CGT/FO CGT/FO CGT/FO
Phylloxéra 2.548*** 2.628*** 2.615*** 2.610*** 2.036*** 2.133*** 2.101*** 2.102***
(0.217) (0.215) (0.218) (0.217) (0.193) (0.192) (0.193) (0.192)
F statistics 137.54*** 149.74*** 144.31*** 145.22*** 110.68*** 122.90*** 118.74*** 119.11***
Covariates Yes Yes Yes Yes Yes Yes Yes Yes
Observations 965 965 965 965 900 900 900 900
Time indicators Yes Yes Yes Yes Yes Yes Yes Yes
Clusters 965 965 965 965 900 900 900 900
nd
2 stage
Conciliation Abandon Départage Appeals Conciliation Abandon Départage Appeals
Confrontational unions 0.128*** −0.126** 0.0218 0.0824 0.162*** −0.178*** −0.0862 0.0787
(0.0411) (0.0526) (0.137) (0.131) (0.0554) (0.0686) (0.176) (0.171)
Conciliation rate −0.0458 −0.0487 −0.162* −0.0688 −0.0703 −0.125
Journal of Institutional Economics
(0.0463) (0.111) (0.0876) (0.0470) (0.119) (0.0903)
Lawsuits’ drop rate −0.00734 −0.0167 −0.0760 −0.00906 0.00470 −0.0704
(0.0323) (0.107) (0.0662) (0.0347) (0.112) (0.0708)
Départage rate −0.0109 0.00135 0.00310 −0.00927 0.00514 −0.000238
(0.0135) (0.0206) (0.0468) (0.0145) (0.0219) (0.0479)
Appeal rate −0.0217* −0.0173 0.00689 −0.0161 −0.0181 −0.000177
(0.0125) (0.0136) (0.0514) (0.0132) (0.0145) (0.0508)
Clearance rate −0.0302*** −0.0330*** 0.0939** 0.187*** −0.0299*** −0.0426*** 0.105** 0.192***
(0.00863) (0.0114) (0.0462) (0.0389) (0.00954) (0.0125) (0.0479) (0.0399)
Backlog rate −0.00210 0.00477 −0.00380 0.0517*** −0.00191 −0.000577 0.000553 0.0515***
811
(Continued )https://www.cambridge.org/core/terms. https://doi.org/10.1017/S1744137421000126
Downloaded from https://www.cambridge.org/core. IP address: 46.4.80.155, on 26 Sep 2021 at 21:03:00, subject to the Cambridge Core terms of use, available at
Table 4. (Continued.)
812
Trimming proportion 5% 5% 5% 5% 10% 10% 10% 10%
Umberto Nizza
(0.00385) (0.00541) (0.0122) (0.0105) (0.00435) (0.00592) (0.0127) (0.0111)
Losing rate −0.0291** −0.00456 −0.153*** 0.0190 −0.0310** −0.00132 −0.143*** 0.00105
(0.0148) (0.0167) (0.0501) (0.0436) (0.0155) (0.0177) (0.0502) (0.0450)
Duration of lawsuits −0.129*** 0.0626 0.975*** −0.458** −0.127** 0.0887 0.782*** −0.410**
(0.0482) (0.0761) (0.190) (0.194) (0.0537) (0.0829) (0.195) (0.197)
Rate of farmers −0.306*** 0.146 0.0136 0.161 −0.336*** 0.159 0.0587 0.141
(0.110) (0.143) (0.390) (0.335) (0.116) (0.151) (0.415) (0.354)
Rate of employees −0.475*** −0.153 0.182 −0.178 −0.471*** −0.111 0.341 −0.132
(0.0740) (0.0993) (0.245) (0.219) (0.0822) (0.108) (0.267) (0.238)
Rate of workmen 0.211*** −0.0110 −0.0141 0.00970 0.188*** 0.0162 −0.0182 0.00520
(0.0313) (0.0427) (0.103) (0.0895) (0.0332) (0.0439) (0.104) (0.0988)
Unemployment rate −0.483*** −0.285* −0.185 −0.315 −0.464*** −0.305* −0.0774 −0.349
(0.137) (0.162) (0.423) (0.372) (0.141) (0.166) (0.423) (0.371)
Inactive rate 0.0613 0.0685 0.238 0.674*** 0.0712 0.141 0.180 0.691***
(0.0910) (0.0883) (0.241) (0.232) (0.103) (0.0960) (0.258) (0.248)
Jobseekers rate −0.0485 0.00448 0.0441 −0.127 −0.0482 −0.0234 0.0290 −0.140
(0.0441) (0.0447) (0.102) (0.121) (0.0512) (0.0492) (0.113) (0.137)
Rural towns rate 0.0174 0.00282 −0.00929 −0.0961*** 0.0215 0.0126 −0.0236 −0.0756**
(0.0150) (0.0174) (0.0399) (0.0332) (0.0173) (0.0187) (0.0426) (0.0358)
Observations 965 965 965 965 900 900 900 900
R2 0.127 0.071 0.199 0.138 0.075 0.056 0.162 0.136
Adjusted R 2 0.109 0.052 0.183 0.121 0.055 0.035 0.144 0.117
Double-clustered standard errors, at court and year level, in parentheses.
***p < 0.01, **p < 0.05, *p < 0.1.
Note: The table shows the results of the first and second stage of the lest trimmed quantile regression estimates, on a panel of yearly observations for 201 French labor courts, during the period 2012–2016. The
trimming proportion is set within the variable confrontation unions, the of the most confrontational trade unions among judges. All other variables are defined in section 5. The distribution of the F-statistics of
the first-level is set at 1% threshold.Journal of Institutional Economics 813
These outcomes might be more intuitive than expected. In effect, the literature has suggested that
labor market contingencies are likely to influence decisions, inducing judges to be more favorable to
workers (Ichino et al., 2003).
Hence, it is easily comprehensible why local economic factors influence conciliations, abandon, and
appeals. On the same floor, the different economic sectors’ available measures significantly impact the
settlement ratio. An increase in farmers and employees’ rates reduces settlement possibilities, whereas
the opposite happens if laborers among the active population expand. Instead, a unitary rise in the
ratio between urban and rural towns increases the rate of appealed lawsuits.
The possible explanations for these results reside in the different sectors’ capacity to genuinely
articulate the workers’ class feeling in a more comprehensive and conflictual battle. The manufacturing
sector is the most coordinated workers’ group in France (Despax et al., 2017). Therefore, their
demands are more structured and organized, probably inducing employers to settle more lawsuits
to escape uncontrollable litigation and hostility. More dispersed sectors, like the agricultural or clerical
services, have a lower corporate spirit and negotiating power.
The possible explanation for lawsuits conducted until the very end is again that judges intervene to
suggest the weaker party his rights and duties, explaining the negative impact of an increase in the
departmental rurality rate on the rate of appealed lawsuits. These speculations, however, could only
be corroborated by a case-by-case analysis.
9. Conclusion
The legitimacy of the immeasurable power of prud’homal justices has been under discussion for years
(Desbarats, 2004). In particular, the economic literature has argued, on several occasions, that prud’-
homal judges, pertaining to the most belligerent trade unions, foster confrontation in court. This paper
intended to test whether these speculations were grounded.
Using a panel dataset of yearly observations for 201 French labor courts during the period 2012–
2016, we show that prud’homal authority is only affected positively by confrontational trade unions.
The general perception is that labor courts are polarized and guided by contradictions, being com-
posed of ‘judges of bias by nature’ (Lacabarats, 2014), excessively prone to employees seeking to obtain
the recognition of symbolic reparation of the harm suffered from the patronal relationship (Trémeau,
2017).
Nevertheless, the potential concerns about adversarial unions’ concerns hampering justice and
introducing insecurity in labor law (Lokiec, 2004) are not substantiated. On the contrary, an increase
of antagonistic unionism fosters the active research of compromising solutions, concessions, and
equitable decisions. This conclusion is hardly surprising, considering that prud’homal litigation is
based on substantial and procedural norms that follow the rule of law to analyze – from the judicial
point of view – daily working relationships, where the scope of legislative and negotiated rules are
played out in real life (Didry, 2009).
In this regard, the Council’s purpose has always been to maintain social peace and harmony
between employers and employees. Consequently, contrary to what could legitimately be expected
from combative syndicalism, the most belligerent trade unions restrict themselves to their most
important assignment: conciliate lawsuits and, if and only if settlement fails, find a compromising ver-
dict in the name of the French people.
References
Amerine, M. (1991), ‘Review: Histoire de la lutte contre le phylloxéra de la vigne en France by Roger Pouget’, Agricultural
History, 65(3): 106–109.
Andolfatto, D. and D. Labbé (2006), ‘La transformation des syndicats français Vers un nouveau modèle social?’, Revue
française de science politique, 56(2): 281–297.
Angrist, J. D., G. W. Imbens and D. B. Rubin (1996), ‘Identification of Causal Effects Using Instrumental Variables’, Journal
of the American Statistical Association, 91(434): 444–455.
Downloaded from https://www.cambridge.org/core. IP address: 46.4.80.155, on 26 Sep 2021 at 21:03:00, subject to the Cambridge Core terms of use, available at
https://www.cambridge.org/core/terms. https://doi.org/10.1017/S1744137421000126You can also read