G21 REGION PROFILE G21 - GEELONG REGION ALLIANCE JULY 2019 - G21 Geelong Region Alliance
←
→
Page content transcription
If your browser does not render page correctly, please read the page content below

G21 REGION PROFILE G21 - GEELONG REGION ALLIANCE JULY 2019
G21 IS THE FORMAL ALLIANCE
OF GOVERNMENT, BUSINESS
AND COMMUNITY ORGANISATIONS,
WORKING TOGETHER TO IMPROVE
THE LIVES OF PEOPLE WITHIN THE
GEELONG REGION ACROSS
FIVE MUNICIPALITIES – COLAC OTWAY,
GOLDEN PLAINS, GREATER GEELONG,
QUEENSCLIFFE AND SURF COAST.

                       This document was prepared by Civic Collective for
                       the G21 - Geelong Region Alliance

                                         Dr Fiona Gray
                                         fiona@civiccollective.com.au
                                         0417 056 659
                                         http://www.civiccollective.com.au/

                       © G21 Geelong Region Alliance

                       Please refer to data tables in appendix for
                       detailed data, at www.g21.com.au/region-profile-
                       data-tables

2
CONTENTS
1.0 INTRODUCTION                                   4     4.17 HEALTH STATUS                               35
2.0 REGIONAL STRENGTHS & CHALLENGES                6     4.18 HEALTH SERVICES                             37
3.0 PLACE                                          8     4.19 DISABILITY                                  37
 3.1 G21 – A GROWING REGION                        11    4.20 MENTAL HEALTH                               38
 3.2 HOUSING                                       12    4.21 INFANTS & CHILDREN’S HEALTH                 40
 3.3 FACILITIES & SERVICES                         14   5.0 ECONOMY                                       44
 3.4 TRANSPORT                                     14    5.1 INDUSTRY PERFORMANCE & GROWTH                45
4.0 PEOPLE                                         16    5.2 EMERGING INDUSTRIES & SECTORS                51
 4.1 POPULATION                                    18    5.3 PRIORITY PROJECTS                            53
 4.2 AGE STRUCTURE                                 20    5.4 CITY DEAL                                    54
 4.3 GENDER DISTRIBUTION                           20    5.5 REVITALISATION OF CENTRAL GEELONG            54
 4.4 LESBIAN, GAY, BISEXUAL, TRANS/TRANSGENDER &        6.0 ENVIRONMENT                                   56
    INTERSEX (LGBTI) PEOPLE                        21
                                                         6.1 NATURAL FEATURES & LAND USE                  57
 4.5 FAMILY STRUCTURE                              21
                                                         6.2 CLIMATE & RAINFALL                           59
 4.6 INDIGENOUS POPULATION                         22
                                                         6.3 CLIMATE CHANGE                               60
 4.7 CULTURAL DIVERSITY                            23
                                                        7.0 CULTURE                                       62
 4.8 INDEX OF RELATIVE SOCIO-ECONOMIC
                                                         7.1 ARTS & CULTURAL PARTICIPATION & ATTENDANCE   63
    DISADVANTAGE (IRSD)                            23
                                                         7.2 G21 CREATIVE INDUSTRIES                      64
 4.9 INCOME                                        25
                                                         7.3 UNESCO GEELONG - CITY OF DESIGN              65
 4.10 EDUCATION                                    26
                                                         7.4 HERITAGE                                     65
 4.11 EMPLOYMENT CHARACTERISTICS                   27
                                                         7.5 LGA DATA FOR ARTS & CULTURE DATA             65
 4.12 HOMELESSNESS                                 29
                                                        8.0 REFERENCES                                    66
 4.13 GAMBLING                                     29
                                                        9.0 GLOSSARY                                      68
 4.14 CRIME & SAFETY                               30
                                                        10.0 ABBREVIATIONS                                71
 4.15 HEALTH BEHAVIOURS                            32
                                                        11.0 DATA NOTES                                   71
 4.16 SCREENING, HEALTH CHECKS & ACCESS            34

                                                                                                               3
1.0 INTRODUCTION

The G21 Region Profile 2019 provides an evidence-based resource for planning,
priority project identification and implementation, and advocacy for regional
growth, health and wellbeing in the G21 region. It aims to provide stakeholders with
an understanding of the region’s challenges and opportunities across a host of social,
economic, environmental and cultural domains. This Profile represents an update of
the previous G21 Region Profile prepared in 2014.

The G21 region comprises five local government areas (LGAs): Colac Otway, Golden
Plains, Greater Geelong, Queenscliffe and Surf Coast. The profile largely presents key
region-level data and analysis however reference to localised characteristics is also
made where applicable or in circumstances where regional level data is not available.
Individual profiles for each of the G21 LGAs have also been prepared to enable a more
detailed examination of local area information.

A broad range of region-level demographic, socio-economic, health, community,
environmental and economic data is presented in the profile, including updated data
that is relevant to many aspects of the key G21-Geelong Region Alliance planning
documents, particularly the current Geelong Region Plan which has planning horizons
to 2050, the G21 Regional Growth Plan and the G21 Economic Development Strategy.

While there are considerable interconnections between each data domain, the profile
has been arranged into 5 key sections:

PLACE
A broad description of the physical assets of the region, including information about
the region’s housing, facilities and services.

PEOPLE
Demographic information about the current population and examines population
change and projections. It also includes information about the population’s socio-
economic status, income, education, employment, and health and wellbeing status.

ECONOMY
Information about industries of employment and trends in this area, labour force
characteristics, Gross Regional Product and identifies emerging industries and
priority projects.

ENVIRONMENT
Information about natural environmental features, climate, water and climate change.

CULTURE
Information about participation in and attendance at cultural offerings and examines
the emerging role of the creative industries in the region.

This profile is supported by an extensive series of data tables provided in the G21
Region Profile – Data Tables. References to relevant tables are provided at the end of
each Chapter.

4
5

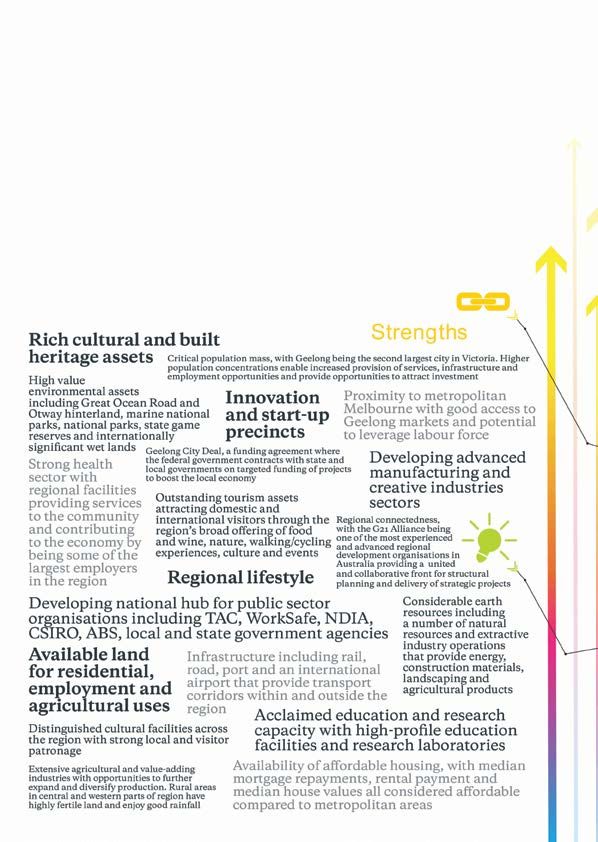
1.0 REGIONAL STRENGTHS
& CHALLENGES

6

7
PLACE

8
3.0 PLACE

The G21 region is located in regional Victoria, to the         Other major towns in the G21 region include Colac, the
west and south-west of metropolitan Melbourne.                 coastal towns of Anglesea, Apollo Bay, Lorne, Ocean
The region comprises the LGAs of Colac Otway,                  Grove and Torquay, and the inland rural centres of
Golden Plains, Greater Geelong, Queenscliffe and               Bannockburn and Winchelsea. Colac is the major
Surf Coast. It is bounded by Pyrenees Shire, the City          service centre for the smaller settlements and rural
of Ballarat and Moorabool Shire in the north, the              areas in the western part of the region. Population
City of Wyndham and Port Phillip Bay in the east,              and economic growth have taken place in many of the
Bass Strait in the south and Corangamite Shire in the          region’s towns, particularly Bannockburn, Torquay and
west. The traditional owners of the G21 region are the         several of the coastal settlements in the region’s east.
Wadawurrung and Coladjin people.
                                                               The G21 region encompasses a total land area of
In 2017 the G21 region had an estimated population of          approximately 8,950 square kilometres and includes
324,067 persons, having increased by approximately             large areas of land used for farming as well as National
52,209 persons since 2011. The G21 Regional Growth             Parks, Marine National Parks and other conservation
Plan outlines an expectation for the region’s population       areas. Key rural uses in the region include the timber
to reach 500,000 persons by 2050.                              industry, grazing, cropping, dairying, mining,
                                                               viticulture and intensive agriculture. The expansive
Greater Geelong, with a 2017 population of
                                                               rural areas in the central and western parts of the
approximately 245,751 persons, is home to more than
                                                               region are highly productive in agricultural terms and
three-quarters of the region’s residents. Geelong, as the
                                                               benefit from relatively high rainfall compared to other
second largest city in Victoria, plays a crucial role in the
                                                               parts of Victoria.
region and is the principal service centre for industry
and business, health and education, and a wide range           The region is rich in natural features and highly-valued
of higher-order commercial and community facilities            landscapes, such as the Great Ocean Road, as well as
and services. Greater Geelong continues to be the main         many coastal reserves and the Otway Ranges. These
location for population growth in the region.                  areas underpin the region’s strong tourism appeal.

KEY STATISTICS
MEASURE									G21 REGION		VICTORIA

HOUSING

►► NUMBER OF DWELLINGS								147,040
►► OCCUPANCY RATE								81.7%			88.9%
►► FULL HOME OWNERS								34.2%			30.7%
►► RENTERS									23.5%			26.7%
►► MEDIAN MORTGAGE REPAYMENTS (PER MONTH, 2016)					$1,540			$1,700
►► MEDIAN RENT (PER WEEK, 2016)							$280			$325
►► MORTGAGE STRESS								8.7%			10.2%

TRANSPORT

►► PEOPLE WHO LIVE WITHIN 400M OF A PUBLIC TRANSPORT NETWORK			                       64.9%			                 73.9%
►► HOUSEHOLDS OWNING TWO OR MORE VEHICLES					59.6%			56.1%
►► TRAVEL TO WORK BY TRAIN							1.8%			5.8%
►► TRAVEL TO WORK BY BICYCLE							0.8%			1.3%
►► TRAVEL TO WORK BY WALKING							2.8%			3.2%

Note: Data collected from a range of sources

                                                                                                                       9
MAP OF G21 REGION

The region also includes the Bass Strait coastline, Port   Overall, the region’s economy is diverse and
Phillip Bay and Corio Bay coastlines, internationally-     includes primary agriculture and food processing,
significant wetlands for migratory birds, Great Otway      traditional and advanced manufacturing, world-
National Park, Brisbane Ranges National Park, Port         renowned education and research institutions,
Phillip Heads Marine National Park, You Yangs              iconic tourism attractions, a rapidly-developing
Regional Park, Enfield State Park, Steiglitz Historic      health sector, a regional hub for public services, and
Park, Lake Connewarre State Game Reserve, Barwon           a developing creative industries sector. Many new
Bluff Marine Sanctuary, and Lorne-Queenscliff Coastal      and emerging industries mean the regional economy
Reserve. The region’s tourism appeal has developed         is well-positioned to transition from a traditional
in recent years with the attraction of major events,       manufacturing-based economy to a diverse knowledge-
including Lorne Pier to Pub, Rip Curl Pro Bells Beach,     based economy.
Australian International Airshow, Cadel Evans Great
Ocean Road Race and the Festival of Sails.

10
3.0 PLACE

3.1 G21 - A GROWING REGION
The G21 region is growing in terms of population, new        In order to manage the growth and land use pressures
dwellings and economic activity. The Geelong Region          in the G21 region, The G21 Regional Growth Plan
Plan: A Sustainable Growth Strategy set an estimated         identifies where future residential and employment
population target of 500,000 by 2050 and current             growth will occur. The plan designates Lara, Leopold,
forecasts are consistent with this target. A key direction   Ocean Grove and Drysdale/Clifton Springs as ‘urban
of the plan is the creation of sustainable urban             growth areas’ or ‘district towns’. Armstrong Creek is
settlements, focusing on consolidating residential           nominated as a ‘growth area’ and Lovely Banks and
development within easy to access service hubs and           Batesford, now known as the Northern and Western
providing more diversity in housing styles and sizes         Geelong Growth Areas, recently had framework plans
to meet the current and future needs of the region’s         endorsed by the City of Greater Geelong Council. The
population. Another key objective of the plan is to          new Northern and Western growth areas will be the
reduce the impact of population growth on the region’s       largest urban growth project in regional Victoria and
natural environment and on its productive agricultural       will eventually house a population greater than that of
areas and valued landscapes.                                 Ballarat.

REGIONAL GROWTH PLAN – PLANNED GROWTH LOCATIONS

                                                                                    G21 Regional Growth Plan, 2013
                                                                                                                     11
3.0 PLACE
3.2 HOUSING
Population growth and household formation patterns For G21 renters, the median rent was $280 per week
create the underlying demand for housing. This is compared with the Victorian benchmark of $325 per
then realised through the housing market and the week. Rents were highest in Surf Coast ($360/week) and
choices households make, with affordability being a key lowest in Colac Otway ($210/week). The proportion of
constraint. households experiencing rental stress in the G21 region
was higher than the Victorian average (G21: 31.3%; Vic
HOME OWNERSHIP 27.2%). The LGA most likely to experience rental stress
Home ownership structure throughout the G21 region was Queenscliffe (35.1%) and the least likely was Surf
was broadly in line with the Victorian position at the Coast (23.5%).
2016 Census. However, G21 households are more likely In March 2018, according to the DHHS Rental Report,
to fully-own their home (G21: 34.2%; Vic: 30.7%). The a high share of affordable rental dwellings were
share of G21 region households purchasing their home identified in Colac Otway (56.3% of rentals considered
with a mortgage approximated the State average (G21: affordable), Golden Plains (31.3%) and Greater Geelong
33.6%; Vic 33.5%), while the share renting in the region (21.1%) compared with the State average (12.6%);
was lower than the State average (G21: 23.5%; 26.7%). conversely, Surf Coast (5.6%) had a very low share of
Home ownership (including dwellings full-owned and affordable rentals. No affordable rentals were recorded
being purchased) was highest in Golden Plains (85%) in Queenscliffe.
and lowest in Colac Otway (69%).
DWELLING OCCUPANCY RATES
HOUSING COST
In 2016, the G21 region had an estimated total of
Median mortgage repayments for the G21 region were 147,040 private dwellings, including 26,840 dwellings
$1,540 per month in 2016, approximately 9.6% below or 18.3% which were unoccupied; the Victorian
Victoria’s median of $1,700. Mortgage payments were average for unoccupied dwellings was 11.1%. This
highest in Surf Coast ($1,840/month) and lowest in situation reflects the prevalence of holiday homes
Colac Otway ($1,300/month). An estimated 8.7% of G21 in coastal areas in the G21 region. Typically, coastal
households experienced mortgage stress in 2016, which holiday homes are unoccupied at the time of the ABS
was below the Victorian benchmark of 10.2%. The LGA Census which is undertaken in August. The share
most likely to experience mortgage stress was Colac of unoccupied dwellings was particularly high in
Otway (11.6%), while the least likely was Surf Coast Queenscliffe (53.6%), Surf Coast (40.3%) and Colac
(7.9%). Otway (25.8%). Golden Plains (9.4%) was the only G21
LGA where the share of unoccupied dwellings was
below the Victorian average.
SELECTED HOUSING DATA SNAPSHOTS
ABS, Census of Population and Housing, 2016; Department of Health and Human Services, Rental Report, March 2017
123.0 PLACE
DWELLING STRUCTURE An estimated 3,680 dwellings were occupied through
the public housing system in the G21 region,
In 2016, separate houses accounted for 86.5% of
representing a 12.6% share of all rental dwellings. This
occupied dwellings in the G21 region, significantly
share was higher than the Victorian average of 10.1%.
higher than the Victorian average of 72.3%. Golden
The share of public housing rentals was highest in
Plains (98.6%) was the LGA with the highest
Greater Geelong (13.6%) and Colac Otway (15.3%).
proportion of separate houses, while Greater Geelong
(84.6%) had the lowest proportion. This pattern of According to the Department of Health and Human
dwelling structure reflects the largely low-density form Services, the total number of social housing applicants
of development throughout the region. In 2016, semi- on the Victorian Housing Register for the Barwon Area
detached housing accounted for 9.8% of occupied in December 2018 was 2,699.
dwellings in the G21 region, while flats, units and
apartments accounted for only 2.9% of dwellings. RESIDENTIAL AGED CARE
The G21 region was most likely to contain 3-bedroom The provision of residential aged care places in the
dwellings, slightly higher than the Victorian average G21 region (89.8 per 1,000 persons aged 70 years and
(G21: 45.2%; Vic 41.8%). It also had a marginally higher over) was above the Victorian average (85.1) estimated
share of 4-bedroom dwellings compared to the State at June 2016. In 2016, the G21 region accommodated a
average (G21: 23.5%; Vic 22.8%). total of approximately 3,260 residential aged-care beds,
with Greater Geelong accounting for the majority (79%)
SOCIAL HOUSING of these beds.
Social housing is made up of two types of housing,
Despite having only 90 residential aged-care beds in
public housing and community housing. It is for people
2016, Queenscliffe had the highest share of beds per
on low incomes who need housing, especially those
1,000 persons aged 70 years or over (116.7), while Surf
who have recently experienced homelessness, family
Coast had the lowest provision (70.9).
violence or have other special needs. Public housing is
a form of long-term rental social housing managed by
the State Government. Community housing is secure,
affordable, long term rental housing managed by not-
for-profit organisations for people on low incomes or
with special needs.
RESIDENTIAL CARE PLACES PER 1,000 POPULATION AGED 70+ YEARS (2016)
ABS, Census of Population and Housing, 2016; Department of Health and Human Services, Rental Report, March 2017
133.0 PLACE
3.3 FACILITIES & SERVICES On an LGA basis, Greater Geelong residents have a
relatively high level of access to public transport, with
Community access to facilities and services in the G21 76.9% of residents living within 400m. This access is
region is measured by community strength indicators influenced by the critical mass of population within
from a variety of sources and in relation to the Victorian Greater Geelong’s urban areas which support a greater
benchmark. level of public transport than other LGAs which have
considerably lower levels of accessibility as evidenced
The G21 region average for ability to access community
by the proportion of residents living within 400m of
services and resources was higher than the average for
public transport:
Victoria (G21 88.2%; Vic 85.2%). Queenscliffe had the
highest share of residents who responded positively • Queenscliffe: 66.9%
(95.3%) while Golden Plains had the lowest share • Colac Otway: 41.2%
(81.7%).
• Surf Coast: 33.2%
The prevalence of community and support groups was • Golden Plains: 2.4%.
considered to be above the State average (61.3%) in
Strong population growth throughout the G21 region
Queenscliffe (84.8%), Colac Otway (76.8%) and Surf
and improved linkages with metropolitan Melbourne
Coast (70.2%), and below the State average in Golden
have contributed to significant growth in the number
Plains (55.2%) and Greater Geelong (60.7%).
of rail patrons on the Geelong V/Line line. According
Many areas on the southern coast of the G21 region to data published in the V/Line Annual Report 2016/17,
and along the Bellarine Peninsula have large increases between 2012/13 and 2016/17 rail patronage on the
in temporary populations during holiday seasons. Geelong line increased by an average 18.3% per annum;
Population levels increase significantly in areas such this compares with a 7.2% per annum increase on the
as Lorne (where the peak population level is 705% Ballarat line, 1.7% per annum increase on the Seymour
above the level of permanent population), Aireys Inlet/ line, and declines in patronage on the Bendigo and
Fairhaven/Moggs Creek (633%), Anglesea (566%), Traralgon lines.
Indented Head (497%), and Portarlington (440%).
Latest figures for the Geelong line show patronage
Surges in temporary population in these places can
increased further in 2017/18 to 8.67 million trips, up
cause strain on community facilities, utilities and
from 3.89 million in 2012/13.
services.
According to ABS Census 2016 data relating to journey
3.4 TRANSPORT to work patterns for G21 residents, a large number
of residents travelled long distances to their place of
PUBLIC TRANSPORT work each day. Approximately 5,930 workers travelled
Approximately three-quarters of the region’s daily to central Melbourne CBD and a further 2,600
population live in Greater Geelong and these residents travelled daily to other inner Melbourne suburbs.
have relatively good access to public transport and a The total number of workers living in the G21 region
range of facilities and services. However, many other who commuted to work in Greater Melbourne was
areas in the G21 region have much lower population 17,096, while the number of workers commuting in the
densities and are characterised by small, dispersed opposite direction from Greater Melbourne to the G21
settlements with more limited provision of local region was 6,493. Many G21 workers also travelled long
facilities and services, including public transport. One distances across Victoria.
of the four strategic objectives set out in the G21 Region There is an overall need for public transport services
Public Transport Strategy is to achieve a base level of in the G21 region to be upgraded to improve travel
service for all residents across the region. times, capacity and frequency of services travelling to
The DHHS LGA profiles provide an estimate of Melbourne, as well as connectivity within the region.
residents who live within 400m of a public transport Improving Regional Rail Connections is a G21 -
network. Throughout Victoria 73.9% of people live Geelong Region Alliance Priority Project.
within 400m of a public transport network. The
weighted average for residents of the G21 region is
64.9%, indicating G21 residents have a comparably
lower level of access to public transport.
143.0 PLACE
PRIVATE MOTOR VEHICLES TRAVEL TO WORK
Motor vehicle ownership in the G21 region in 2016 was Workers in the G21 region primarily use motor vehicles,
generally higher than the Victorian average, with a either as a driver or passenger, as their mode of
greater proportion of households owning two vehicles transport to work according to the ABS 2016 Census
(G21: 40.3%; Vic: 37.9%), three vehicles (G21: 12.6%; (74.4% of employed persons) which is significantly
Vic: 11.9%), and four or more vehicles (G21: 6.7%; Vic: higher than the Victorian average (67.7%).
6.4%). In total, 59.6% of G21 households own two or
Compared with the Victorian average, G21 workers
more vehicles compared with the Victoria average of
were less likely to travel to work by train (G21: 1.8%; Vic:
56.2%.
5.8%), by bicycle (G21: 0.8%; Vic: 1.3%) or by walking
Car ownership in the G21 region has increased in the (G21: 2.8%; Vic: 3.2%).
period 2006 to 2016, with the proportion of households
The comparatively limited access to public transport
owning two motor vehicles increasing by +0.7
throughout the G21 region is a key reason for the
percentage-points, three motor vehicles increasing by
relatively high reliance on the motor vehicle for the
+1.2 percentage-points, and four or more increasing by
purpose of commuting to and from work. However
+1.4 percentage-points. Within the G21 region, motor
significant growth in rail patronage along the Geelong
vehicle ownership is the highest in Golden Plains and is
rail line has occurred in recent years, with much of
the lowest in Queenscliffe.
this growth in rail patronage influenced by Geelong
residents commuting to Melbourne for work.
RELEVANT DATA TABLES
NO. DESCRIPTION NO. DESCRIPTION
1.1 Population Density (2017) 1.23 Landlord type (%) - rented occupied
private dwellings by LGA (2016)
1.2 Median monthly housing loan repayment (2006-16)
1.24 Public housing waiting list (Mar 2018)
1.3 Monthly housing loan repayment (2006-16)
1.25 Public housing transfer list (Mar 2018)
1.4 Monthly housing loan repayment by LGA (2016)
1.26 Population aged 70+ years in residential aged care (June 2016)
1.5 Households experiencing mortgage stress (2016)
1.27 Population aged 70+ years in community aged care (June 2011)
1.6 Median weekly rent (2006-16)
1.28 Housing suitability (2016)
1.7 Weekly rent (2006-16)
1.29 Indicators of community strength (%) (2008-15)
1.8 Weekly rent by LGA (2016)
1.30 Indicators of community strength (%) (2008-2015)
1.9 Affordable rental housing (Mar 2017)
1.31 Access to services summary data (2015)
1.10 Households experiencing rental stress (2016)
1.32 Internet connection (2006-16)
1.11 G21 occupied private dwellings by dwelling structure (2016)
1.33 Internet connection by LGA (2006-16)
1.12 Occupied private dwellings by dwelling structure (2016)
1.34 Internet connection by indigenous status of household (2016)
1.13 Occupied private dwellings by structure and LGA (2016)
1.35 Internet connection by indigenous status
1.14 Bedrooms in occupied private dwellings - number (2006-16)
of household and LGA (2016)
1.15 Bedrooms in occupied private dwellings - proportion (2006-16)
1.36 Method of travel to work (2006-16)
1.16 Unoccupied private dwellings (2006-16)
1.37 Method of travel to work by LGA (2006-16)
1.17 Unoccupied private dwellings (2006-16)
1.38 Number of persons living* in G21 LGA’s and
1.18 Tenure type (2006-16) working in Greater Melbourne (2016)
1.19 Tenure type by LGA (2006-16) 1.39 Number of persons living* in Greater Melbourne
and working in G21 LGA’s (2016)
1.20 Landlord type (no.) - rented occupied
private dwellings (2011-16) 1.40 Population who live near public transport (2015)
1.21 Landlord type (%) - rented occupied private dwellings (2011-16) 1.41 Number of motor vehicles per dwelling (2006-16)
1.22 Landlord type (no.) - rented occupied 1.42 Number of motor vehicles per dwelling by LGA (2006-16)
private dwellings by LGA (2016)
1.43 V/line rail patronage by line (2012/13-16/17)
15PEOPLE 16
4.0 PEOPLE

KEY STATISTICS
MEASURE								G21 REGION		VICTORIA

POPULATION

►► 2017 POPULATION							324,067
►► ANNUAL POPULATION GROWTH RATE (2011-17)				                         2.1%
►► % POPULATION AGED 65 YEARS OR OVER (2016)				                       18.5%			   15.2%
►► SAME-SEX COUPLES							0.7%			1.0%
►► FAMILIES WITH CHILDREN							43.4%			47.0%
►► COUPLES WITH NO CHILDREN						39.4%			36.0%
►► ONE PARENT FAMILIES							15.8%			15.1%
►► INDIGENOUS PERSONS							1.0%			0.8%
►► NEW SETTLERS TO AUSTRALIA (PER 100,000 PERSONS, 2015)			            560			     682
►► POPULATION BORN IN AUSTRALIA						78.5%			64.9%

SOCIO-ECONOMICS

►► SEIFA SCORE (IRSD)							1004
►► LOW INCOME EARNERS (LESS THAN $400 PER WEEK)				                    32.6%			   33.4%
►► YEAR 12 COMPLETION RATE						50.6%			59.4%
►► POST-SCHOOL QUALIFICATIONS						49.7%			50.4%
►► UNEMPLOYMENT RATE (DECEMBER 2017)					5.5%			6.0%
►► LABOUR FORCE PARTICIPATION RATE					62.3%			64.5%
►► HOMELESSNESS								0.3%			0.4%

SAFETY

►► PERCEPTION OF SAFETY DAY						95.9%			92.5%
►► PERCEPTION OF SAFETY NIGHT						58.6%			55.1%
►► FAMILY VIOLENCE INCIDENT RATE (PER 100,000 PERSONS, APRIL 2018)		   1,161			   1,165

HEALTH

►► EXCELLENT/VERY GOOD SELF-REPORTED HEALTH				45.6%			40.2%
►► PREMATURE DEATHS (PER 100,000 PERSONS)					241			259
►► CURRENT SMOKER (2014)							12.6%			13.1%
►► CONSUMES ≥ FIVE SERVES OF VEGETABLES & FRUIT PER DAY			             9.4%			    7.4%
►► TAKES SUFFICIENT PHYSICAL ACTIVITY					42.6%			41.4%
►► CONSUMES ALCOHOL AT RISKY OR HIGH-RISK LEVELS – SHORT TERM		        47.5%			   30.9%
►► CONSUMES ALCOHOL AT RISKY OR HIGH-RISK LEVELS – LONG TERM		         61.6%			   62.2%
►► DAILY CONSUMPTION OF SOFT DRINK					14.9%			12.4%
►► OVERWEIGHT MALES							42.7%			38.4%
►► OVERWEIGHT FEMALES							21.5%			24.3%
►► OBESE MALES								17.2%			20.4%
►► OBESE FEMALES							21.5%			17.0%

Note: Data collected from a range of sources

                                                                                          17
4.0 PEOPLE
4.1 POPULATION
POPULATION GROWTH
In 2017, the G21 region had an estimated population of persons in 2006 to 18,270 persons in 2017,
approximately 324,067 persons, accounting for 5.1% of representing an average of 5.3% growth per year;
Victoria’s population. Between 2011 and 2017, the G21 • Leopold, which increased from 8,440 persons in
region’s population increased by +37,650 persons at an 2006 to 12,390 persons in 2017, representing an
average rate of 2.1% per year. This compares with an average of 3.5% growth per year; and
average rate of population growth for Victoria of 2.2 %
• Lara, which increased from 10,350 persons in 2006
per year during that period. In the last two years the
to 14,170 persons in 2017, representing an average
population growth rate for G21 region has been 2.5%
of 3.5% growth per year.
per annum, tracking above the Victorian rate of 2.3%
per annum. The G21 Regional Growth Plan attributes the region’s
expanding population to the following key factors:
Approximately 76% of the G21 region population live
in Greater Geelong which has an estimated resident • People moving from Melbourne and other regions
population of 245,750 persons. A further 10.6% of in Victoria;
the population live in coastal townships between • Natural population increases (i.e. births exceeding
Queenscliff and Apollo Bay, while Colac accounts for deaths);
6.6% of the region’s population. • Migration from other States and countries;
Greater Geelong has been the main location for • More people choosing to remain in the region; and
population growth in recent years in terms of volume • People permanently moving to coastal holiday
with a large proportion of this growth occurring on the homes.
fringes of urban Geelong.
POPULATION PROJECTIONS
In terms of population growth rates, Golden Plains
has experienced the highest proportional growth rate Demographic and spatial consultants .id prepare
in recent years, increasing by 2.9% per year between population projections through to 2036 for all LGAs
2011 and 2017, closely followed by Surf Coast with in the G21 region except Queenscliffe. Population
2.8% per year and by Greater Geelong with 2.1% per numbers for the 2016 base year are derived from
year. More limited population growth has occurred in Estimated Resident Population from the Australian
Colac Otway which experience growth of 0.4% per year, Bureau of Statistics. A series of further factors are
while population numbers declined in the Borough of considered in determining population projections.
Queenscliffe at an average rate of -0.5% per year. These include demographic changes such as births,
deaths and migration rates applied to the base
Examples of small localities that experienced strong population. At the same time, scrutiny of urban
rates of population growth between 2006 and 2017 development drivers is undertaken (residential
include: development opportunities, vacancy rates etc.). The
• Bannockburn, which increased from 2,730 persons combination of varied assumptions about these inputs
in 2006 to 5,320 persons in 2017, representing an results in the forecast population. The table below
average of 6.2% growth per year; summarises the forecast population change for each
LGA.
• Torquay-Jan Juc, which increased from 10,360
FORECAST POPULATION CHANGE 2016 - 2036
forecast.id.
Note: NA = Not available
184.0 PEOPLE
The .id projections indicate that in percentage terms, conservative estimate of projected population growth
average annual population growth will be strongest for Queenscliffe.
in Surf Coast at 2.05% (15,272 people), followed by
Golden Plains at 1.98%. (10,520 people). However, POPULATION GROWTH COMPARISONS
Greater Geelong will continue to be the main driver for Greater Geelong is the regional city serving the G21
overall population growth in the G21 region with a total region and will continue to be a major location for
population increase of 87,174 between 2016 and 2036. population growth. Between 2011 and 2017, Greater
The continued development of greenfield residential Geelong’s population increased by 28,960 persons
areas in Armstrong Creek and the future Western and this growth is comparable to that experienced by
and Northern residential growth fronts on the urban a number of Melbourne’s growth area municipalities.
edges of Geelong are expected to support high rates of For instance, population growth in Greater Geelong
residential development and population growth in the over this period was greater than that which occurred
municipality through the forecast period. in Cardinia Shire (+26,690 persons), although less than
Although .id has not prepared population forecasts for the growth experienced by the City of Melton (+36,250
Queenscliffe, the Victoria in Future data series prepared persons).
by the Victorian State Government indicates minimal Compared to Victoria’s regional cities, Greater
growth for the LGA at just +0.1% annual average Geelong’s population growth over the period 2011
growth rate. It should be noted however that since the to 2017 was almost three times higher than Greater
Victoria in Future projections have under-estimated Bendigo (+11,620 residents) which was the second
the recent rate of population growth throughout fastest-expanding regional city in population terms.
the G21 region, this data may represent a fairly
TOTAL POPULATION GROWTH (2011-17)
ABS, Regional Population Growth, Cat. No. 3218.0 (rounded totals)
194.0 PEOPLE
4.2 AGE STRUCTURE Exploring the median age of selected towns within
the G21 region provides further evidence of an ageing
Age structure data for 2016 indicates the G21 region,
population with large increases in the median age in
on average, has an older population than Victoria and
areas such as:
regional Victoria. According to the 2016 Census, 18.1%
of G21 residents were aged 65 years and over, and this • Linton: 52 years, +7 years since 2006
compares to the Victorian average of 15.6% and the • Winchelsea: 48 years, +6 years since 2006
regional Victorian average of 17.6%.
• East Geelong: 41 years, +5 years since 2006
In 2016, the median age of residents in Queenscliffe • Anglesea: 51 years, +5 years since 2006
(60 years), Colac Otway (45 years), Surf Coast (42
• Lorne: 54 years, +5 years since 2006
years), Greater Geelong (40 years) and Golden Plains
(39 years) were all higher than the Victorian average 4.3 GENDER DISTRIBUTION
(37 years). The median ages of Queenscliffe and Colac
Gender distribution in the G21 region is generally
Otway were also higher than that of regional Victoria
comparable to the Victorian average, with an overall
(43 years). Queenscliffe has the highest median age of
distribution of 51.2% females and 48.8% males (ABS
any LGA in Victoria.
Census, 2016).
Resident population in the G21 region is, on average,
At the LGA level, Golden Plains in 2016 had the highest
getting older: 31.4% of the population in 2016 were in
proportion of males (50.8%), while Queenscliffe had the
the over-55 years age group, representing an increase of
highest proportion of females (53.5%). At the town or
2.1 percentage-points since 2011. This figure compares
suburb level, Bannockburn had the highest proportion
to the Victorian average of 27.0%, which only increased
of males (50.1%), while East Geelong and Drysdale-
by 1.4 percentage-points since 2011.
Clifton Springs had the highest proportion of females
Key differences in the age of the resident populations in (both 52.3%).
the G21 region and in Victoria are highlighted below:
Gender by age distribution in the G21 region also
• A higher proportion of persons age 0-19 years old generally follows the trend for Victoria, and this
(G21: 24.7%; Vic: 24.3%); indicates consistent proportions of males to females
• A lower proportion of persons aged 20-55 years throughout all age cohorts. In broad terms, males
(G21: 37.8%; Vic: 41.8%); and tend to slightly outnumber females in the younger age
• A higher proportion of persons age 55 years and cohorts, with this distribution changing as people age.
older (G21: 31.4%; Vic: 27.0%). For instance, in the G21 region 63.5% of the population
aged 85 years or over are female.
MEDIAN AGE IN YEARS (2016)
ABS, Census of Population and Housing, 2016
204.0 PEOPLE
4.4 LESBIAN, GAY, BISEXUAL, TRANS/ 4.5 FAMILY STRUCTURE
TRANSGENDER & INTERSEX (LGBTI) The G21 Region’s household and family structure is an
POPULATION important demographic indicator as it reveals the area’s
The ABS Census in 2016 recorded 905 same-sex couples residential role and function and provides key insights
in the G21 region, accounting for 0.7% of all couples. into the level of demand for services and facilities as
This figure compares to 1.0% of all couples in Victoria. most are related to age and household types.
Overall, little variation is evident within the G21 region In 2016, families with children in the G21 region
of those identifying as in same-sex couples in ABS accounted for 43.4% of all families and this was the
Census data, with shares ranging from 0.5% in Golden highest share of all families; however, this share was
Plains to 0.7% in Geelong and Surf Coast. Due to its lower than the Victorian average of 47.0%. (G21: 43.4%;
large population in a regional context, Greater Geelong Vic: 47.0%). In the G21 region the share of families with
accounts for the majority of same-sex couples in the children declined slightly from 44.1% in 2006.
G21 region (77%).
The remaining households in the G21 region in 2016
A significant increase in the number and share of comprised couples with no children (G21: 39.4%; Vic:
persons in couples identified as same-sex has occurred 36.0%), one-parent families (G21: 15.8%; Vic: 15.1%),
over the past decade, with the number of persons in and other families (G21: 1.4%; Vic: 1.9%). Variations of
same-sex couples in the G21 region more than doubling note within the G21 region are as follows:
since 2006, when 409 persons identified themselves
as being in a same-sex couple. The share of same-sex • 60.3% of couples in Queenscliffe have no children
couples in the G21 region increased from 0.4% in 2006 reflecting the older demographic in Queenscliffe.
to 0.7% in 2016. • 51.4% of couples in Golden Plains live with
This data takes into account same-sex couples within children, indicating Golden Plains is more heavily
the same household and does not account for same-sex populated by younger families.
couples living in different households. • Lone-parent families were most prevalent in
Greater Geelong (17.1%) and Colac Otway (15.6%).
SHARE OF SAME-SEX COUPLES (2006-16)
ABS, Census of Population and Housing, 2016
214.0 PEOPLE
4.6 INDIGENOUS POPULATION
The traditional Aboriginal people of the G21 region of the Indigenous population were aged between 0-24
are the Wadawurrung and Coladjin people. In the years, significantly higher than the 31% for the total
2016 Census, approximately 3,060 in the G21 region G21 population. Conversely, only 12% of the Indigenous
identified as Indigenous, representing a 1% share of population in the G21 region in 2016 were aged 55 years
the region’s total population. This share is slightly or older compared to 31% of the total G21 population.
higher than the Victorian average of 0.8% and slightly
This variation in age structure is consistent with trends
lower than the regional Victorian average of 1.6%.
at a State level. For example, the Indigenous population
Approximately 80% of these residents were living in
in Victoria aged 0-24 years accounts for 52% of the total
Greater Geelong, while Colac Otway had the highest
Indigenous population compared with 31% of the total
proportion of its population identifying as Indigenous
Victorian population.
(1.2%).
The under-representation of Indigenous people in the
Between 2011 and 2016, the G21 region experienced an
older aged cohorts is consistent with life expectancy
increase of approximately 800 persons identifying as
figures that are significantly lower than for the non-
Indigenous.
Indigenous population. In the G21 region, the life
Compared to the total population, the age structure of expectancy of Indigenous persons is estimated to be
the Indigenous population is skewed towards younger 67.2 years for males and 72.9 years for females born
age cohorts. For instance, in 2016 an estimated 54% between 2005 and 2007, and this compares with 78.7
years for non-indigenous males and 82.6 years for non-
indigenous females.
SHARE OF INDIGENOUS POPULATION (2016)
AGE STRUCTURE OF G21 INDIGENOUS AND TOTAL POPULATION (2016)
ABS, Census of Population and Housing, 2016
224.0 PEOPLE
4.7 CULTURAL DIVERSITY RELIGION
The G21 region is becoming increasingly diverse in Christianity is the most common religion according
a cultural sense, as illustrated by the decline in the to the ABS Census 2016 and accounted for 52.4%
share of persons born in Australia from 80.4% in 2011 of the population. However, consistent with trends
to 78.5% in 2016. Despite this decline, the share of throughout Australia, this share has declined
Australia-born residents remains significantly above significantly from 64.6% in 2006. Conversely, the share
the Victorian average of 64.9% in 2016. of the population identifying as having ‘no religion’
increased from 21.9% in 2006 to 35.3% in 2016.
After Australia, the second most common country
of birth in the G21 region is the United Kingdom
4.8 INDEX OF RELATIVE SOCIO-
which accounted for 4.2% of residents in 2016. Other
countries of origin include New Zealand which
ECONOMIC DISADVANTAGE (IRSD)
accounts for 1.0% of the population, India with 0.8% of The Index of Relative Socio-Economic Disadvantage
the population, and China with 0.5% of the population. (IRSD) is one index in the ABS Socio Economics
Indexes for Areas (SEIFA) which summarises a range
The rate of new arrivals, according to Department of
of information relating to the economic and social
Health and Human Services data for 2015, indicates
conditions of people and households within an area.
the G21 region attracts fewer new settlers to Australia
The IRSD provides a useful snapshot of an area’s
(560 persons per 100,000 population) compared to
relative socio-economic disadvantage. A score of 1000
the average for Victoria (682 persons per 100,000
reflects the average across Australia.
population). This situation is not unusual with many
new settlers attracted to major cities in Australia for IRSD scores for the G21 region in 2016 indicate that
work and lifestyle opportunities. Nevertheless, the Surf Coast (1077), Queenscliff (1074) and Golden Plains
G21 region is attracting new arrivals from abroad (1035) all have relatively low levels of socio-economic
significantly above the average for regional Victoria disadvantage. Greater Geelong (994) has a slightly
(149 persons per 100,000 population). higher level of disadvantage compared to other areas in
the State, while Colac Otway (961) has a relatively high
Of note, new arrivals settling in Greater Geelong on a
level of socio-economic disadvantage.
range of humanitarian visas account for 30% of new
settlers which is significantly higher than the average The level of socio-economic disadvantage at a township
share for Victoria of 9% in 2015. level varies significantly throughout the G21 region.
Norlane (723), Corio (832), Colac (906) and Linton (928)
In line with a low share of the population being born
are all considered to be among the highest decile of
outside Australia, only a small proportion of the G21
socio-economic disadvantage in Victoria. Conversely,
population does not speak English or does not speak
Barwon Heads (1092), Torquay (1091), Queenscliff
English well compared with the Victorian average (G21:
(1074) and Point Lonsdale (1071) are considered to have
1.4%; Vic: 4.5%).
very low levels of socio-economic disadvantage.
NEW SETTLER ARRIVALS/100,000 POPULATION (2015)
DHHS, LGA Profiles, 2015,
234.0 PEOPLE
IRSD SCORE VICTORIAN PERCENTILES (2016)
The Index of Relative Socio-Economic Disadvantage
(IRSD) is one index in the ABS Socio Economics
Indexes for Areas (SEIFA) which summarises a range
of information relating to the economic and social
conditions of people and households within an area.
A SEIFA percentile is determined by dividing the
distribution of SEIFA scores into 100 equal groups.
The lowest scoring 1% of areas are given a percentile
of 1 (indicating a very high level of disadvantage), and
so on up to the highest 1% of areas which receive a
percentile number of 100 (indicating a very low level of
disadvantage).
ABS, SEIFA, 2016
244.0 PEOPLE
4.9 INCOME
MEDIAN INCOME LOW INCOME EARNERS
In 2016, median weekly household incomes in Golden In 2016, G21 residents were marginally less likely to
Plains ($1,442) and Surf Coast ($1,569) exceeded the be low-income earners, with 32.6% of the working
Victorian median ($1,417). Although the median population (aged 15 years and over) earning less than
household incomes in Greater Geelong ($1,242) and $400 a week compared with 33.4% for Victoria. With
Queenscliffe ($1,176) were below the Victorian median, the exception of Golden Plains, where 33.9% of persons
they were above the median for regional Victoria earned less than $400 a week, all LGAs had a lower
($1,124). The median weekly household income in share of persons earning less than $400 a week.
Colac Otway ($1,057) was the lowest in the G21 region
and below benchmarks for Victoria ($1,417) and Relevant features of those earning less than $400 a
regional Victoria ($1,124). Since 2006, the median week include the following:
household incomes in the G21 region have increased • Female residents: Females in the G21 region are
by 3.1% or greater per year, virtually in line with the marginally less likely to have an income lower than
Victorian average of 3.3% per year since 2006. $400 a week than the Victorian average (G21: 37.4%;
Similar to household incomes, median personal Vic: 38.3%). This is a significant change since 2011,
incomes in Queenscliffe ($671 per week) and Surf Coast when females in the G21 region were more likely
($722) exceeded the Victorian median ($644). However, than the average Victorian female to be earning less
between 2006 and 2016 all LGAs in the G21 region than $400 a week. One exception to this trend (and
have benefited from strong growth in median personal only to a marginal degree) relates to females aged
incomes above that of the median for Victoria over this 30-34 years, where G21 females earning less than
period. $400 a week account for 28.6% of females in this
age cohort, while the average for Victoria is 27.6%.
MEDIAN PERSONAL WEEKLY INCOME (2006-2016)
Census of Population and Housing 2016, ABS
254.0 PEOPLE
• Male residents: A similar trend exists for males in
the G21 region, where marginally fewer males earn
4.10 EDUCATION
less than $400 per week compared to Victorian
YEAR 12 COMPLETION
males (G21: 27.4%; Vic 28.5%).
• Younger residents: Persons aged between 15-19 In 2016, 50.6% of the G21 population (aged 15 years
years in the G21 region are the most likely to and over) reported Year 12 as their highest level of
earn less than $400 per week, for both genders; secondary school completed which is above the 45.1%
marginally lower than the Victorian average for this recorded in 2011 and significantly higher than the
age cohort (G21: 88.3%; Vic: 89.2%). 39.9% recorded in 2006. However, the completion of
Year 12 in the G21 region was below the average for
• Older residents: The share of persons earning
Victoria (59.4%) and above the average for regional
under $400 per week declines between age groups
Victoria (43.5%). In 2016, females were more likely
15-19 years through to the beginnings of early
to have completed Year 12 than males (F: 53.0%, M:
retirement age 50-54 years, after which the share of
47.6%).
persons earning under $400 accelerates.
• Indigenous residents: Median personal income The proportion of the population (aged 15 years
for Indigenous persons is lower than that of non- and over) in Queenscliffe (60.4%) and Surf Coast
Indigenous persons in all areas of the G21 region (59.7%) who had completed Year 12 or equivalent was
(excluding consideration of Queenscliffe where marginally above the Victorian average (59.4%). Colac
no Indigenous residents were recorded in the 2016 Otway (39.9%) had the lowest proportion, followed by
Census). Excluding Queenscliffe, the median Golden Plains (43.8%) and Greater Geelong (50.9%).
personal incomes of Indigenous persons ranged The G21 Indigenous population aged 15 years and over
from 16% in Golden Plains to 28% in Surf Coast had a lower proportion of persons who had completed
below the median of the total population within the Year 12 or equivalent (34.4%) compared with the
respective LGAs. region’s total population (50.6%).
SHARE OF POPULATION (15+ YEARS) COMPLETED YEAR 12 (2006-16)
ABS, Census of Population and Housing, 2016
264.0 PEOPLE
POST-SCHOOL QUALIFICATIONS Colac Otway and 70% from Greater Geelong
continuing their education post-secondary school.
Post-school qualifications in the G21 region were less
The average for Victoria is 75%.
common than those of the Victorian average, with
fewer G21 residents aged 15 years or over stating they • A low share of school leavers enrolled in university,
had Certificate level or higher compared to the state with 19% from Colac Otway, 21% from Surf Coast
average. (G21: 49.7%; Vic: 50.4%). and 51% from Greater Geelong being below the
54% average for Victoria.
By gender, 52.1% of G21 males hold a certificate level
• A high share of school leavers are employed in full-
or higher qualification, compared with 47.5% of G21
time and part-time work, with 50% of school leavers
females; both groups are marginally below their
in Colac Otway and Surf Coast in employment and
respective Victorian State averages (52.4% and 48.6%
25% in Greater Geelong. The Victorian average is
respectively). Surf Coast and Queenscliffe are the
20%.
only two areas in the G21 region to exceed the State
averages in post-school qualifications in both gender • Part-time employment accounts for a high share
categories. Notably, Queenscliffe is the only area in of school leavers in employment, including 38%
which postgraduate degree-level qualifications are school leavers in Surf Coast, 22% in Colac Otway
more commonly held than the State average. and 16% in Greater Geelong. The average for
Victoria is 13%.
YOUTH ENGAGEMENT & SCHOOL LEAVERS
4.11 EMPLOYMENT
OnTrack is a survey undertaken one-year post-
schooling by Department of Education and Training
CHARACTERISTICS
and records the primary activity in which a former
UNEMPLOYMENT
student is engaged. Data from 2016 is available for
Colac Otway, Greater Geelong and Surf Coast. Based on information contained in the Small
Area Labour Market publications prepared by the
Results of the 2016 OnTrack survey indicate the Department of Jobs and Small Business, in December
following in relation to persons who completed Year 12 2017, the G21 region is estimated to have approximately
in 2016: 9,180 unemployed persons and an unemployment rate
• A low share of school leavers remained in of 5.5%, which is below the State average of 6.0% and
education, with 44% from Surf Coast, 47% from marginally above the regional Victorian average of
5.4%.
UNEMPLOYMENT RATE
DJSM, Small Area Labour Markets, LGA Profiles
274.0 PEOPLE
The unemployment rate varies throughout the G21 females in the region (56.2%) was higher than the
region. In December 2017, Greater Geelong had the Victorian average for Indigenous females (54.1%).
highest unemployment rate at 6.4% which is above
The top five employing industries in the G21 region
the Victorian average of 6.0%. Due to the size of its
in 2016 comprised Health Care and Social Assistance
labour market, Greater Geelong accounted for 86%
(14.7% of all employment; 20,390 people), Retail Trade
of unemployed persons within the G21 region in
(11.2%, 15,546 people), Construction (10.0%, 13,788
December 2017.
people), Education and Training (9.6%, 13,296 people)
All of the remaining LGAs in the region recorded and Manufacturing (7.8%, 10,762 people). Demand for
less than 5% unemployment, which means they can workers in all of these industries broadly correlates
generally be considered to be at ‘full employment’. to factors such as population growth, an ageing
population, residential development, and a developing
While unemployment does not appear to be a major
education sector.
issue at a regional and LGA level, areas of significantly
higher unemployment exist in the region including the Between 2011 and 2016, a large decline in the share of
following localities (SA2s), all of which are located in local residents employed in Manufacturing occurred,
Greater Geelong: decreasing from 11.1% in 2011 to 7.8% in 2016. This
decline is both a State-wide and nation-wide trend
• Corio-Norlane:
that has impacted many communities throughout
unemployment rate of 19.2% in December 2017
Australia. Wholesale Trade is another industry that has
• Newcomb-Moolap: experienced a decline in its share of employment, from
unemployment rate of 10.2% in December 2017 3.4% in 2011 to 2.3% in 2016.
• Portarlington: The major employing industries of males in the
unemployment rate of 8.4% in December 2017 G21 region in 2016 were Construction (17.4%) and
Manufacturing (11.6%). For females in the G21 region
• North Geelong – Bell Park:
the major employing industries were Health Care and
unemployment rate of 7.8% in December 2017
Social Assistance (24.6%), Retail Trade (13.6%), and
LABOUR FORCE PARTICIPATION Education and Training (13.6%).
The labour force includes those persons currently
PART-TIME EMPLOYMENT
employed, those looking for work, and those who are
In 2016, employed workers in the G21 region were more
unemployed. The labour force participation rate is the
likely to work part-time compared to the Victorian
share of the labour force expressed as a percentage of
average (G21: 41.2%; Vic: 36.8%). G21 females have a
the total population aged 15 years or over.
high propensity to work part-time (57.5%) compared to
Based on ABS Census data for 2016, the labour force G21 males (23.3%). Part-time employment for females
participation rate for the G21 region was 62.3%; this in the G21 region was higher than the Victorian average
is slightly below the Victorian average of 64.5%. (50.5%), while the share of males working part-time was
Interestingly though, since 2006 the labour force broadly in line with the Victoria average (22.3%).
participation in the G21 region has increased by
0.7 percentage-points, while the Victorian average OCCUPATION
increased by 0.1 percentage-points over the same
In 2016, workers in the G21 region were most likely to
period.
be employed as:
Within the G21 region, labour force participation rates
• Professionals - 20.3% (Vic: 23.3%);
for Golden Plains (67.4%) and Surf Coast (66.5%) in
• Technicians and Trade Workers - 15.1% (Vic:
2016 were above the Victoria average (64.5%). Colac
13.1%); and
Otway (62.2%) and Greater Geelong (61.6%) were
below the Victorian average. Queenscliffe had a very • Community and Personal Service Workers - 12.5%
low participation rate (46.8%) which reflects the older (Vic: 10.6%).
demographic in this LGA. G21 workers were least likely to be employed in the
following occupations:
The labour force participation rate for Indigenous
residents of the G21 region was 57.9% in 2016. The • Machinery Operators and Drivers - 5.9% (Vic:
participation rate for Indigenous males (59.0%) was 5.8%);
slightly lower than the average rate for Indigenous • Sales Workers – 10.0% (Vic: 9.7%); and
males in Victoria (61.5%), while the rate for Indigenous • Clerical and Administrative Workers - 11.9% (Vic:
13.3%).
28While the share of the labour force employed as
Professionals is below the Victoria average, this is
4.13 GAMBLING
changing with the share of G21 professionals increasing The G21 region had 1,519 Electronic Gaming Machines
from 17.8% of the employed labour force in 2006 to in 37 venues in 2017. This is a decrease of 72 machines
20.3% in 2016. Community and Personal Service since 2013 and one less venue.
Workers also experienced a significant increase from
Net gaming machine expenditure in the G21 region for
9.6% in 2006 to 12.5% in 2016. The increase in these
2017 was $125.8 million which represents an increase
occupations is reflective of a State-wide trend where
of approximately $6.0 million since 2013. Per capita
more workers are employed as professionals and where
expenditure on Electronic Gaming Machines for
strong growth in the health and welfare sectors is
persons aged 18 years or over was approximately $555 in
leading to an increase in the share of workers employed
2017, representing a 2.4% increase from approximately
in community and personal services.
$540 in 2013 which is higher than the Victorian average
of $542 per capita for persons aged 18 years.
4.12 HOMELESSNESS
In the G21 region, Greater Geelong had the highest
According to the 2016 ABS Census, an estimated 883
expenditure on gaming machines in 2017, with $114.1
persons were homeless in the G21 region in 2016 and
million across 26 venues, at an average of $615 per
this represents an increase of 164 persons or 23% since
person aged 18 years or over. Surf Coast had the lowest
2011. Growth in the number of homeless persons in the
per capita expenditure on gaming machines at $130
G21 region between 2011 and 2016 equated to 4.2% per
per resident aged over 18 years. Golden Plains does not
year, more than double the rate of population growth of
have any venues with Electronic Gaming Machines
2.0% per year over the period.
and thus had no revenues for either 2013 or 2017. Data
In 2016, homeless persons accounted for 0.3% of reflects the location of Electronic Gaming Machines
the total G21 population and this is lower than the and revenues and not the location of residents
Victorian average of 0.4%. Greater Geelong accounted incurring the expenditures.
for the largest incidence of homelessness in the G21
region, accounting for 85% of homeless persons. All
LGAs in the G21 region had lower rates of homelessness
than the Victorian average.
OVERVIEW OF ELECTRONIC GAMING MACHINE PROVISION AND EXPENDITURE, 2012/13 AND 2016/17
Victorian Commission for Gambling and Liquor Regulation, Electronic Gaming Machine LGA Level Expenditure, 2012/13 and 2016/17
294.0 PEOPLE
4.14 CRIME & SAFETY
CRIME Greater Geelong also had a marginally higher crime
Crime rates vary significantly across the region. rate for drug offences than the Victorian average
Queenscliffe, Golden Plains and Surf Coast all had (Geelong 469; Victoria 458).
significantly lower crime rates across all categories Between 2017 and 2018, crime rates declined in general
compared to the State average and those of Colac across the G21 region, particularly in ‘property and
Otway and Greater Geelong. Both Colac Otway and deception’ and ‘drug-related’ offences.
Greater Geelong have crime rates above the Victorian
average for the following categories (per 100,000 PERCEPTION OF SAFETY IN THE COMMUNITY
persons): The 2015 VicHealth Indicators Survey provides an
• Crimes against the person: Colac Otway: 1,544; estimate of how safe residents feel within their
Greater Geelong: 1,361; Vic: 1,301 community when walking alone both during the day
and at night. The night time perception of safety in
• Crimes against property: Colac Otway: 4,796;
the G21 region ranged from 55% in Greater Geelong to
Greater Geelong: 6,121; Vic: 4,707
78% in Queenscliffe. The average for Victoria is 55%.
• Other crime: Colac Otway: 1,947; Greater Geelong: All LGAs in the G21 region felt safer than the Victorian
1,740; Vic: 1,721 average when walking alone during the day.
CHANGE IN CRIME RATE (MARCH 2017 - APRIL 2018)
Crime Statistics Agency
Note: Green denotes declining crime rate; red denote increasing crime rate
CRIME RATES (MARCH 2017-APRIL 2018)
Crime Statistics Agency
30You can also read