Marine Robots Mapping the Present and the Past: Unraveling the Secrets of the Deep - MDPI
←
→
Page content transcription
If your browser does not render page correctly, please read the page content below
remote sensing
Article
Marine Robots Mapping the Present and the Past:
Unraveling the Secrets of the Deep
Nadir Kapetanović 1, * , Antonio Vasilijević 1 , Ðula Nad̄ 1 , Krunoslav Zubčić 2
and Nikola Mišković 1
 1   Laboratory for Underwater Systems and Technologies (LABUST), Faculty of Electrical Engineering
     and Computing, University of Zagreb, Unska 3, 10000 Zagreb, Croatia; antonio.vasilijevic@fer.hr (A.V.);
     dula.nad@fer.hr (Ð.N.); nikola.miskovic@fer.hr (N.M.)
 2   Department of Underwater Archaeology, Croatian Conservation Institute, Cvijete Zuzorić 43,
     10000 Zagreb, Croatia; kzubcic@hrz.hr
 *   Correspondence: nadir.kapetanovic@fer.hr

 Received: 15 October 2020; Accepted: 24 November 2020; Published: 28 November 2020

 Abstract: Underwater cultural heritage sites are subject to constant change, whether due to natural forces
 such as sediments, waves, currents or human intervention. Until a few decades ago, the documentation
 and research of these sites was mostly done manually by diving archaeologists. This paper presents
 the results of the integration of remote sensing technologies with autonomous marine vehicles in order
 to make the task of site documentation even faster, more accurate, more efficient and more precisely
 georeferenced. It includes the integration of multibeam sonar, side scan sonar and various cameras
 into autonomous surface and underwater vehicles, remotely operated vehicle and unmanned aerial
 vehicle. In total, case studies for nine underwater cultural heritage sites around the Mediterranean region
 are presented. Each case study contains a brief archaeological background of the site, the methodology
 of using autonomous marine vehicles and sensors for their documentation, and the results in the form of
 georeferenced side-scan sonar mosaics, bathymetric models or reconstructed photogrammetric models.
 It is important to mention that this was the first time that any of the selected sites were documented
 with sonar technologies or autonomous marine vehicles. The main objective of these surveys was to
 document and assess the current state of the sites and to establish a basis on which future monitoring
 operations could be built and compared. Beyond the mere documentation and physical preservation,
 examples of the use of these results for the digital preservation of the sites in augmented and virtual
 reality are presented.

 Keywords: marine robotics; autonomous surface vehicle; autonomous underwater vehicle; remotely
 operated vehicle; multibeam sonar; side-scan sonar; bathymetry; photogrammetry

1. Introduction
     Knowledge about the Earth and its evolving environment is becoming increasingly important.
However, we learn more about the stable surfaces of other planets than about our own planet.
Rovers that have been traveling around Mars for years, landers on the remote Titan, and even the
international missions to the Moon cannot hide the fact that the environment of the ocean floor is still
completely mysterious, yet is only a few kilometers from our coasts. The oceans and seas are difficult
to reach for direct observation. Only in the last 20 to 30 years have we succeeded in exploring and
mapping the Earth’s seabed, mainly through technological advances such as acoustic remote sensing.
     Sometimes, new technologies take time to reach their full potential. Hence, technology is often
a bridge between different disciplines. This paper presents a case study of nine UCHs that bridges
the gap between the methods used exclusively in maritime archaeology, marine robotics and remote

Remote Sens. 2020, 12, 3902; doi:10.3390/rs12233902                        www.mdpi.com/journal/remotesensing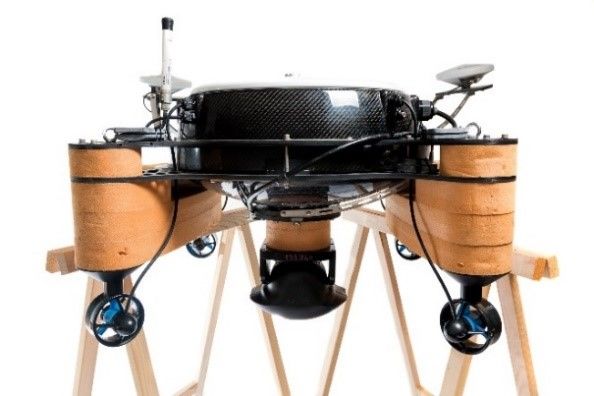
Remote Sens. 2020, 12, 3902                                                                       2 of 39

sensing. The challenges in these areas are described here along with their possible solutions. Methods
for recording and documentation of underwater cultural heritage sites (UCH) have developed
considerably over the last two decades. The combined use of optical and acoustic technologies makes
it possible to provide a high-quality digital 3D reconstruction of large and complex underwater
scenarios [1,2]. These technologies create the possibility to study the UCH in onshore laboratories in
a non-intrusive way [3]. The resulting digital reconstructions are often accepted for archaeological
purposes and especially for documentation and monitoring activities [4,5]. These tools can be used to
predict how sites have changed both recently and far in the past, but also how they might change in
the future. These tangible results can be used as effective tools for public engagement.
     Nothing has made as much progress in underwater archaeology as the equipment used for site
and environment imaging. Recently, photogrammetry, photomodeling, simultaneous localisation
and navigation (SLAM), organized light processing, multibeam and numerous other acoustic
remote sensing techniques have been applied to underwater sites in the Mediterranean Sea [1,6–8].
However, even as archeologists strive to replace the laborious manual documentation process with
more effective processes, no particular system has shown enough simple advantages to be generally
accepted or recognized as the current standard for digital site reporting. Price, precision, durability
and time issues in post-processing are usually of paramount importance. A common challenge for
archeologists, who usually lack the expertise to process the data themselves, is the opportunity
to incorporate multibeam sonar point clouds and photomosaics to produce publication-quality
archaeologically relevant charts and maps.
     Marine robotics is developing into a powerful tool for remote sensing in shallow seas and offers
a wide range of possibilities for surveying without site disturbance (2.5D modelling of a site or
landscape without excavation) [9]. Marine robots are generally not faced with the technical difficulties
of underwater activities in these near-shore archaeological underwater environments, but potentially
encounter a much greater challenge when they must cooperate with human divers [10]. Archaeologist
scuba divers incorporate high versatility, intelligent coordination and a wide range of manual skills to
reduce operating costs. However, these human advantages tend to disappear as the area to be explored
becomes larger and deeper or the time for field operations becomes shorter.
     Furthermore, robots can endure longer surveying missions without the fatigue that humans tend
to experience, they can move faster and deeper, they do not risk human injury or fatalities, and their
deployment is more cost-effective in the long run. They can also operate very well in cold and poorly
visible/turbid environments and usually have a range of localisation and surveying sensors with
a much greater range than that of a human and/or digital single lens reflex camera (DSLR).
     A few decades ago, precise underwater localization was a great challenge and a big stepping
stone to the use of autonomous underwater robots for detailed, precise surveying missions.
However, the development of navigation systems for autonomous marine vehicles based on
a combination of measurements from inertial measurement unit (IMU), Global Positioning System
(GPS) and Doppler Velocity Logger (DVL) has greatly improved the precision of underwater
localization [11]. In addition, underwater vehicles with integrated acoustic localization aiding systems
like ultra-short baseline (USBL) offer a way for underwater exploration to go much deeper and longer
than divers [12].
     Underwater robot localization equipment and algorithms have been significantly improved,
which means that the experts using the robots can acquire acoustic/visual data with precise placemarks
and feed it directly into commercially available bathymetry and/or photogrammetry software. All of
the technological improvements mentioned above have led to a significant increase in the use of
robotic systems for surveying underwater sites, either with or instead of divers. These robotic
systems include remotely operated vehicles (ROVs), autonomous surface vehicles (ASVs), autonomous
underwater vehicles (AUVs) and unmanned aerial vehicles (UAVs) for inspections in shallow water.
The applications of these vehicles range from underwater/maritime archaeology, biology, geology,
security and many others.
Remote Sens. 2020, 12, 3902 3 of 39
This article contains case studies of the authors’ recent activities regarding the use of autonomous
marine vehicles for the survey of underwater archaeological sites. It presents a total of nine case
studies on the use of marine robotics for survey applications at UCH sites in the Mediterranean.
The methodology used for data collection is described for each site, as each of them had its own
specificities. Depending on the site, the authors used all or some of the autonomous marine vehicles
(ASV, AUV, ROV, UAV) for data collection. The results of the post-processed collected data are
presented in the form of bathymetric maps/2.5D models and/or side-scan images and/or visual
images taken by the AUV and/or ROV and/or UAV, as well as photogrammetry models and/or
orthogonal photomosaics generated from the visual data. It is important to emphasize that this was
the first time any of the underwater archaeological sites presented in this paper were recorded using
modern UCH documentation methods, including visual and acoustic remote sensing techniques,
as well as autonomous marine vehicles.
The long-term research objective of the authors is to develop artificial intelligence-based fully
autonomous survey mission planning algorithms for survey applications in maritime archaeology.
These missions can be performed by various marine vehicles, e.g., ASV, AUV, or ROV tethered to
an ASV. Research objective for this paper was to examine best practices of autonomous systems and
various sensors use for high-resolution georeferenced UCH site documentation and future preservation.
This paper presents the results of authors’ work in technical and research areas, including:
1. the design and development of a small size robust ASV for bathymetric surveys;
2. design of UCH site visual and acoustic documentation methodology with an ASV, AUV,
ROV and UAV. The integration of remote sensing technologies with autonomous marine vehicles
made the task of site documentation even faster, more accurate, more efficient and precisely
georeferenced. It includes the integration of multibeam sonar, side scan sonar and various
cameras into autonomous surface and underwater vehicles, remotely operated vehicle and
unmanned aerial vehicle. In total, case studies for nine UCH sites around the Mediterranean
region are presented. Each case study contains a brief archaeological background of the site,
the methodology of using autonomous marine vehicles and sensors for their documentation,
and the results in the form of georeferenced side-scan sonar mosaics, bathymetric models or
reconstructed photogrammetric models.
3. a discussion of the potential of using intelligent buoys/ASVs for the purpose of underwater diver
localization and augmented reality UCH site guides, and
4. a discussion of the UCH site documentation and preservation transgression from physical (in situ)
to the virtual reality realm.
The rest of this article is structured as follows: A general overview of the authors’ activities so far,
including research, technical projects and the publications contained therein, is presented in Section 2.
The autonomous marine vehicles and their sensors used for on-site underwater site recordings are
presented in Section 3. Section 4 describes the processing pipeline for various types of data recorded at
the chosen UCH sites. Remote sensing results of nine UCH sites surveys are presented in Section 5.
The Section 6 brings new directions in the documentation, promotion and preservation of archeological
underwater sites by transferring them into the realm of virtual reality. Concluding remarks are given
in Section 7.
2. Prior Work
The Laboratory for Underwater Systems and Technologies (LABUST) has participated in many
research and technical projects that have pushed the boundaries of the state-of-the-art in marine robotics
and remote sensing applications in numerous scientific fields. For example, in the projects TRITON [13],
ADRIAS [14] and BLUEMED [4,5], they have used marine robotics as a remote sensing tool for
maritime archaeology; marine ecology in the projects subCULTron [15] and e-UReady4OS [12,16];
Maritime safety in the MORUS project [17]; Maritime inspection in the HEKTOR project; Promotion
of diver safety and augmenting their performance in the projects CADDY [10] and ADRIATIC [18].Remote Sens. 2020, 12, 3902 4 of 39
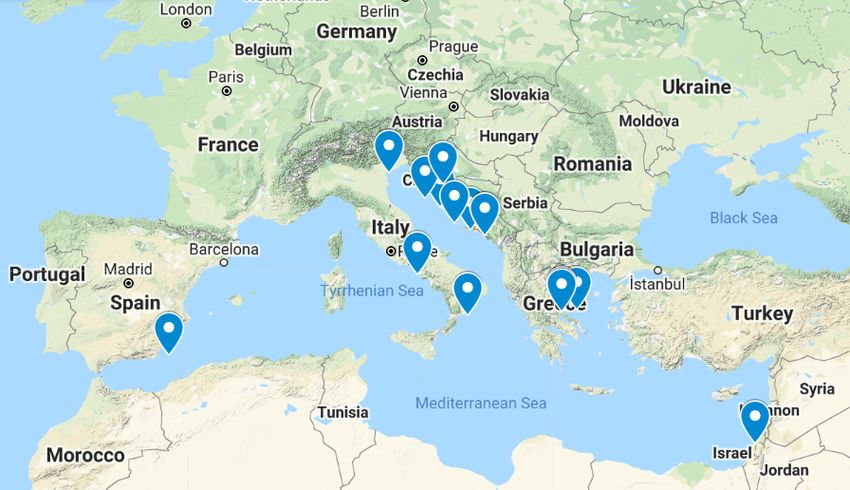
An overview of the geographical distribution of the sites where LABUST’s marine robots were used
for remote sensing is shown in Figure 1.
Figure 1. Google Map of locations at which Laboratory for Underwater Systems and Technologies
(LABUST) used marine robots in remote sensing missions.
The long-term research goal of the authors is to develop the current unmanned survey/inspection
missions by marine vehicles into missions that are performed by the marine vehicles in a fully
autonomous manner controlled by artificial intelligence. This of course means that online sensor
data processing must be developed to enable the vehicle to perceive its environment (as published
in [19–21]), as well as mission and path planning algorithms, so that the behaviour of the vehicle is
responsive to the new information about its environment, as published in [15,22–25]. For successful,
fully autonomous reconnaissance missions, it is of utmost importance that the marine vessels estimate
their position accurately, as published by the authors in [12,26,27].
3. Equipment
An autonomous surface vehicle (ASV) mounted with a multibeam sonar, which has been used for
remote sensing survey missions, is described in more detail in Section 3.1. Specifications of the side-scan
sonar-mounted autonomous underwater vehicles (AUV) are given in Section 3.2. The remotely
operated vehicle (ROV) that was used for remote visual inspection of the sites at the seafloor is
described in Section 3.3. The unmanned aerial vehicle (UAV) used for shore inspection close to the
survey sites is briefly described in Section 3.4.
3.1. Autonomous Surface Vehicle
An ASV equipped with a Norbit WBMS 400/700KHz multibeam echosounder/sonar (MBES)
and accompanying Applanix navigation system together with a high-precision Trimble GPS antennae
was used to collect the acoustic data. This is one of the many application dependent versions of
the so-called dynamic positioning platforms (PlaDyPos or H2Omni-X), see Figure 2a. The surface
vehicle has been developed by LABUST and is used for a variety of applications, from support to
underwater archaeology [5], as a dive monitoring platform that allows divers to navigate and monitor
from the surface [28], as communication router between underwater and aerial vehicles [29], used in
ASV swarms for long-term monitoring of the underwater environment [15], for mapping (obtaining
photomosaic and bathymetry) of shallow water areas [2] and for mine countermeasures [30].Remote Sens. 2020, 12, 3902 5 of 39
(a)
(b)
Figure 2. (a) Autonomous surface vehicle (ASV) PlaDyBath with sonar mounted below, Trimble Global
Positioning System (GPS) antennae in the back and a WiFi antenna on the left. (b) ASV PlaDyBath
during a monitoring mission.
The ASV is fully actuated with four electric thrusters that make up the X configuration.
This configuration allows horizontal movement in any orientation. The ASV has a diagonal length
of 1 m, is 0.35 m high and weighs about 20–30 kg depending on the payload configuration in the
experiments. The maximum speed under ideal conditions is 1 m/s. Such a configuration of the vessel
is very well suited for research purposes due to its simple deployment procedure, robustness under
real environmental conditions and low energy consumption [28,31].
For acoustic remote sensing applications, however, the ASV was converted into a catamaran shape
for better hydrodynamic performance, as shown in Figure 2a. This version of the surface platform is
called Platform for Dynamic Bathymetric Imaging (PlaDyBath or H2Omni-H), as shown in Figure 2a.
While ASV PlaDyBath performs its current survey mission autonomously for one part of the UCH,
the operator is able to process MBES data collected during the previously surveyed UCH site part.
These data are processed in low resolution using Qimera software to monitor data quality and coverage.
As soon as the batteries are exhausted, the vehicle is lifted onto the working boat, the batteries are
changed and high-quality sonar recordings are transferred to the ASV operator’s computer. The ASV
PlaDyBath was used for the surveying and 3D modeling of underwater cultural heritage sites (UCH)
around the Mediterranean Sea, as shown in Figure 2b.
Mission planning and control were carried out with the open-source software Neptus, developed
by the Laboratório de Sistemas e Tecnologia Subaquática (LSTS) of the University of Porto, Portugal.
It is a distributed command and control infrastructure for the operation of all types of unmanned
vehicles. Neptus supports the different phases of a typical mission life cycle: planning, simulation,
execution and post-mission analysis. Neptus can be adapted by operators to mission-specific
requirements and extended by developers through a comprehensive plug-in framework. Neptus
communicates with the vehicle’s hardware via so-called IMC messages, also developed by LSTS.
In the case of PlaDyBath ASV, these mission-specific IMC messages are bypassed by a robot operating
system (ROS) on-board the high-level computer, which in turn communicates with middleware
microcontrollers to control the vessel’s motors. The sonar is switched on both physically and via the
network interface by the operator, who is connected to the vehicle via WiFi. The WBMS software used
for sonar data acquisition on board the vessel was also controlled via a remote desktop over WiFi.
Multibeam Sonar
The Norbit iWBMSc multibeam sonar is the main sensor for bathymetric data acquisition,
as shown in Figure 2a. The sonar is integrated with the latest GNSS-assisted inertial navigation system
(Applanix SurfMaster), has 80 kH bandwidth, roll stabilization, an Ethernet interface and an integrated
sound velocity measurement unit. The basic sonar features are 5–210° swath, adjustable swath tilt
angle, 256–512 beams, 200–700 kHz frequency range, nominal frequency at 400 kHz, range 0.2–275 mRemote Sens. 2020, 12, 3902 6 of 39
(160 m typical at 400 kHz). The ping rate goes up to 60 Hz or can be set to adaptive. The resolution
longitudinal × transverse standard is 0.9 × 1.9° at 400 kHz and 0.5 × 1.0° at 700 kHz. The output data
of this sonar are range and bearing measurements as well as backscatter data. In parallel, the Applanix
module logs the navigational information (position and orientation in 3D). In the postprocessing phase,
range and bearing measurements are merged with navigation data to generate the bathymetric point,
which is then interpolated into a 2.5D surface.
3.2. Autonomous Underwater Vehicle
An autonomous underwater vehicle (AUV) is a type of mobile robot that, as the name suggests,
is propelled through the water. The difference between an AUV and a ROV, both of which are
controllable in all three dimensions, is that an AUV is controlled completely autonomously by its
onboard computer. Lightweight autonomous underwater vehicle (LAUV) Lupis (see Figure 3a) has
been purchased by LABUST from OceanScan—Marine Systems and Technology, Lda. The LAUV
system was originally developed by the Laboratório de Sistemas e Tecnologia Subaquática (LSTS) from
Porto University and was developed in cooperation with OceanScan—Marine Systems & Technology,
Lda. The complete LAUV system includes all the equipment necessary for communication with the
vehicle, the guidance and control software, external navigation aids and a set of optional devices
to facilitate various operations. LAUV Lupis is a lightweight, modular platform prepared for the
integration of a number of different sensors and sonars. The vehicle is designed for cost-effective
oceanographic, environmental and inspection surveys to meet a wide range of applications. On the
software side, LAUV Lupis uses the same LSTS toolchain (DUNE, IMC, and Neptus), as does the
ASV PlaDyBath.
(a) (b)
Figure 3. (a) Lightweight autonomous underwater vehicle (LAUV) Lupis. (b) Blueprint of LAUV
Lupis’ sections and components.
LAUV Lupis is equipped with (see Figure 3b): (1) Environmental sensors (sound speed,
fluorescence, temperature, conductivity, pressure turbidity...), (2) Emergency pinger, (3) Forward
looking sonar (FLS), (4) Acoustic transducers (USBL and Acoustic modem), (5) Illumination
module, (6) Multi-beam echo-sounder, (7) DVL, (8) IMU, (9) Acoustic modem (electronics),
(10) On-board CPU & solid-state hard disk, (11) Batteries, (12) Communication and Navigation boards
(Wi-Fi, GPS, Global System for Mobile Communications (GSM), Iridium, Compass), and (13) Camera,
(14) Ballast weights, (15) Handle, (16) Side-scan sonar (SSS) transducers, (17) Flexible antennas mast
(Wi-Fi, GPS, GSM, Iridium), and (18) Batteries charging connector, (19) Thruster and controllers,
(20) Magnetic coupling, (21) Flexible fins, (22) Propeller.
Side-Scan Sonar
Instead of measuring the depth to the sea floor, as multibeam sonar does, the side-scan sonar
provides details about the composition and structure of the sea floor. This is based on the intensity
analysis of the echoes reflected from the seafloor. Normally, harder materials have a higher reflectivity
than softer materials.
Klein’s UUV-3500 side-scan sonar ,which is mounted on LAUV Lupis, is a high resolution dual
frequency side-scan sonar that uses wideband signal processing techniques to achieve high-resolution
imagery, even at long range. Low power consumption is achieved by using long frequency
modulated chirp transmissions, while the integrated hardware signal processing generates acousticRemote Sens. 2020, 12, 3902 7 of 39
images with high fidelity. The sonar consists of sonar electronics and a pair of sonar transducers.
The sonar electronics are packaged as an integrated part of an AUV electronics assembly. The sonar
transducers are mounted on the outside of the AUV and configured with penetrators through the hull.
The specifications of the side-scan sonar are given in Table 1. Output sonar data are loaded from AUV
Lupis logs into Neptus Mission Review and Analysis software. It is possible to review the low and
high frequency sonar logs in a waterfall fashion. Neptus applies time-varying gain (TVG) to correct
range-intensity dependence. It also merges navigation estimation data (corrected with GPS fixes after
the surfacing) with raw sonar data to produce georeferenced sonar imagery.
Table 1. Side-scan Sonar Specifications.
Parameter Value
Center Frequencies (fc): 400 KHz LF and 775 KHz HF
Transmit Pulse: Wideband Chirp; 1, 2, 4, 8 msec
Sonar Range: 15, 20, 30, 40, 50, 60, 75, 100, 125, 150, 175, 200 m
Across Track Resolution: varies with pulse length—1.2 cm, 2.4 cm, 4.8 cm, 9.6 cm, 19.2 cm
Horizontal Beamwidth @fc: 0.34 degrees (LF and HF)
Maximum Range: 100 @ HF; 200 m @ LF (conditions permitting)
Depth Limit: 300 m
Dual Frequency: Max is 6.7 GB/h; Min is 0.4 GB/h. Single Frequency: Max is
Local Data Storage Optional:
3.4 GB/h; Min is 0.2 GB/h
Operating Temperature: −2–50 ◦ C [28–122 ◦ F]
3.3. Remotely Operated Vehicle
BlueROV2 (shown in Figure 4a) is a very powerful, flexible and affordable small-size ROV.
The 6-thruster vector configuration, coupled with strong static stability, ensures a vehicle that is
smooth and stable, yet easy to handle. BlueROV2 offers top-class mini ROV capabilities at the cost of
the simplest commercial ROVs.
(a) (b)
Figure 4. (a) BLUEROV2 and its wireless controller. Courtesy of BlueRobotics. (b) Adjusting the
neutral buoyancy and balancing the additional underwater lamps.
Its main features are: live 1080p HD video, highly controllable thrust vector configuration,
stable and optimized for inspection class and research class missions, simple user interface,
highly expandable with three free cable penetrations and additional mounting points, standard
100 m depth and up to 300 m tether, six T200 thrusters and basic electronic speed control (ESC) for
a high thrust-to-weight ratio, quick-change batteries for all-day use, very flexible top case for a clean
connection of BlueROV2 to a computer.
The vehicle is delivered in the form of a set and is partially assembled to make its use as easy
and comfortable as possible. It consists of many other NIDO products, including T200 thrusters,
3.4 and 4 series waterproof enclosures, Bar30 pressure sensors, fathom-X tether interface (FXTI) andRemote Sens. 2020, 12, 3902 8 of 39
fathom-tether interface electronics. Many of these products have been on the market for a long time
and have proven themselves in thousands of successful field hours.
3.4. Unmanned Aerial Vehicle
The unmanned aerial vehicle (UAV) DJI Phantom 4 (see Figure 5) has two collision avoidance
sensors at the front and rear of the drone and others below and at the edges. The camera starts
recording at launch so that the drone can find a homing location when it is ready to return home.
The camera hangs below the drone on a gimbal device that keeps it stable in all conditions in which it
flies. The arms also have lights so that the drone can be quickly detected in the air.
Figure 5. UAV DJI Phantom 4.
Inside the Phantom 4 shield is the high capacity battery with 5.87 Ah. This allows it to fly for up
to half an hour. The Phantom 4 has a highly efficient system to avoid obstacles. In addition, sensors are
mounted on the back and sides to detect possible dangers. The Phantom 4 has a remote controller with
a built-in screen with a 5.5-inch monitor and a resolution of 1080p. The remote control connects to the
drone at a distance of up to 7 km and can transmit the full HD video to the screen. The Phantom 4
features a 20-megapixel sensor with 12 levels of dynamic range, allowing for more precise shooting,
even in extreme light. The automatic shutter prevents camera blur and makes shooting easier.
4. Data Acquisition and Processing Pipeline
4.1. Multibeam Sonar Data
When surveying with MBES, one should be aware of the physical limitations of sonar beam
resolution, as well as the performance limit of spatial resolution of samples seafloor patches. The size
of the “footprint” δb × δb which MBES beam ensonifies for beam width angle α at depth h can be
estimated as:
α
δb = 2h tan . (1)
2
If we take that the mean across and alongtrack beam with Norbit WBMSc sonar is 1°, we obtain
δb = 0.02h. Furthermore, spatial resolution of the MBES δs , i.e., the distance between adjacent sonar
beams at the assumed flat seafloor, can be estimated as:
ψ
δs = 2h tan (2)
2N
for a given swath angle ψ, number of beams N and depth h. For a swath angle ψ = 90° and N = 256,
which were used in most of the surveys, we obtain δs = 0.006h. We used these equations to determine
the upper bound of the bathymetric model interpolation grid cell size.Remote Sens. 2020, 12, 3902 9 of 39
The autonomous surface vehicle (ASV) PlaDyBath’s survey path designed lawnmower-shaped
survey missions along and across the area of interest. In order to have as much quality coverage as
possible, it is needed to overlap the adjacent lawnmower lanes with percentage k ∈ (0, 1]. The distance
between the lawnmower lanes d for a given overlap percentage can be estimated for the assumed
approximately flat seafloor as:
k ψ
d = 2 1− h tan . (3)
2 2
During the acquisition phase, there were issues with swath width angle of ψ = 120°, especially at
700 kHz frequency. This was due to the fact that the floater foams on port and starboard of the ASV
blocked some of sonar beams or the sonar was not submerged deep enough below the ASV. This was
solved by using the 400 kHz frequency for higher range, but with reduced swath angle at ψ = 90°.
With swath angle of 90° and overlap k = 0.5, the distance between the lawnmower lanes was easily
computed as d = 1.5h.
Norbit’s WBMS software was used for logging raw MBES data, both for the point cloud as well
as backscatter data. QPS Qimera was used for processing the raw sonar data. In order to process
the data in Qimera, the .son format of raw sonar data decoupled from the navigation data had to be
exported to .s7k format which was then loaded into Qimera. Applanix INS logged the navigation data
into .pos format files that could be directly imported into Qimera. Based on the Applanix datasheet,
the orientation data uncertainty was set to 0.3° for heading and 0.08° for roll and pitch. The heading
and roll/pitch precisions were based on patch tests performed by the instructions given by Norbit.
The precision of GPS position data was on the order of 10 cm when only Trimble antennae were used
connected to the Applanix INS. This precision was improved to the order of 1 cm if NTrip client was
connected through a 4G modem, when we obtained access to the local base station system. Both GPS
and INS data were used to merge sonar data with navigation data and generate the bathymetric model.
The bathymetric models were georeferences in UTM system.
Raw sonar pings had to be filtered for outliers in Qimera. This was done by limiting the range
of depth values appropriate for the location as was read from the WBMS software. Swath Editor
was used to select accrostrack ourliers for several tens of pings at the same time, while Slice Editor
was used to filter our the pings on the outside of the delimited UCH area, as well as ping which was
recorded while the ASV was turning from one lawnmower lane to the next. The turning motion causes
the so-called fan-out effect, where the inside of the turning curve is sampled much more that the
sparsely sample outside part of the turning path. This unevenly sampled data were not desired so it
was deemed as outliers.
Interpolation was done using the default interpolant from Qimera. NOAA CUBE interpolation
was also used but it did not show better results. The grid cell size for the interpolation was based
on calculations of δs , which was the lower limit of this parameter. Since Applanix INS does not have
a heave sensor integrated, waves from the surface were translated directly to the bathymetric model.
This was solved using the Wobble Analysis tool in Qimera as well as additional spline interpolation
for larger areas with less details.
One of the objectives of the BLUEMED project was to generate an optoacoustic 3D model,
which would merge high-resolution textured photogrammetric models with lower-resolution
georeferenced bathymetric models. To this end, at every BLUEMED UCH site, a team of divers
from University of Calabria would put a couple of acoustic markers that needed to be detected in the
backscatter data of the MBES. This was needed to enable easy collocation of the photogrammetric and
the bathymetric model. Unfortunately, for reasons unknown to us, the acoustic markers could not be
detected in the backscatter data of the MBES so feature-based collocation algorithms had to be used in
order to align these models.Remote Sens. 2020, 12, 3902 10 of 39
4.2. Side-Scan Sonar Data
Survey missions for the LAUV Lupis mounted with the side-scan sonar were planned in a form of
the lawnmower pattern at constant altitude from the seafloor. Distance between adjacent lawnmower
lanes was determined with the assuming that the seafloor is locally approximately flat, and that the
maximum slant range is ten times larger than the operating altitude. Since all UCH sites except for
one were at depth of 6–30 m operating altitude was 2–3 m for safety reasons, so that the AUV does
not collide with the artefacts at the seafloor if the amphorae/anchor mounds rose too suddenly from
the flat surrounding. Assuming locally flat seafloor, the lawnmower lane width was set in the range
15–30 m. In some cases, we obtained significant surface returns because the AUV was relatively close
to the surface, especially at Baiae UCH site where the depth was 8 m at most. The side-scan sonar was
pinging at both low and high frequency so that we could detect the differences in the resolution and
object detection methods. For the analysis, we of course used only high frequency data.
We do not have a direct access to the raw side-scan sonar data. Neptus Mission Review and
Analysis software downloads the mission logs from the LAUV Lupis either over WiFi or from the
USB located in the nose part of the vehicle. It then processes raw side-scan sonar data, merges it with
the navigation estimation data, and presents it in the waterfall view. The position data represent the
filtered dead reckoning estimation augmented with the DVL and GPS measurements when available.
The path of the vehicle is corrected in the post-processing phase from the last stable GPS fix after
resurfacing to the beginning of the dive. There is also an option for adjusting the time varying gain
(TVG) as needed. Except for TVG, the brightness of side-scan sonar imagery can be equalized using
the contrast limited adaptive histogram equalization algorithm (CLAHE) [32], as shown by the authors
in [21]. Finally, side-scan sonar and all other navigation and control log data can be exported from
Neptus in many formats: .kml, .mat, .csv, just to name a few.
AUV localization precision is on the order of 0.5–1 m, since a now very precise GPS sensor gives
the upper bound on localization precision. When underwater, the localization uncertainty increases
significantly as dead reckoning only accumulates error, but is corrected by the DVL as soon as it obtains
the bottom lock
4.3. Visual Data
Visual surveys of some of the UCH sites and their surroundings both underwater (by BlueROV
and/or AUV Lupis) and above sea surface (by DJI Phantom UAV). Camera onboard AUV Lupis has
1.4 MP and is fixed to capture things directly below the vehicle, so it cannot be used for the detailed
full 3D modelling of a site. However, since it is synchronized with an external flash, it can be used
for creating orthophotos or photomosaics. Images from AUV Lupis have timestamps and can be
correlated with its position estimation data to further simplify photo alignment of photogrammetric
software. BlueROV was used for capturing oblique HD images of some UCH sites and creation
of 3D photogrammetric models. It does not have any underwater localization system, not even
dead reckoning, so its images were fed “as is” into photogrammetric software after batch automatic
brightness filtering in Photoshop. UAV DJI Phantom captures images in 20 MP resolution. It was used
for capturing the shoreline in the vicinity of the UCH sites. It has a GPS sensor so it embeds it into
metadata of the images that photogrammetric software can read later on. The precision of UAV’s GPS
is 1–2 m.
Agisoft Metashape was the software used for photogrammetric processing of images captures
by all three vehicles. Photo alignment, point cloud generation and mesh processes were all set to
high settings to get as detailed models as possible given the quality of the input images. The use of
underwater robots for photogrammetric recording purposes was a use case to prove how effective these
systems can be compare to diver photographers, especially at depths of more than 50 m. The quality of
the models is graded rather subjectively, since there are no precise models which could be used
as benchmarks.Remote Sens. 2020, 12, 3902 11 of 39
5. Results
LABUST has always had a close partnership with maritime archaeologists. On one side,
these interdisciplinary collaborations give the archaeologists the state-of-the art technology to survey
the underwater sites, and on the other side, we as roboticists obtain application-oriented case studies
for marine robotics control, path planning and sensor data processing algorithms. These collaborations
include scanning the Senj (Croatia) fortress’ well in 2007, inspecting the Ninnucia shipwreck (sunk in
1942) close to Rogoznica (Croatia) in 2008, surveying the Giuseppe Garibaldi shipwreck close to Cavtat
(Croatia) in 2009, Roman villa rustica and the shipwreck Viribus Unitis close to Pula (Croatia) in
2010, side-scan sonar large-scal missions in search of new archaeological sites around Hvar island
(Croatia) in 2010, inspecting the aquatorium of Kornati national park (Croatia) 2010–2012, work at
Gnalić shipwreck (Gagliaana grossa from 1583) in 2011–2013, as well as the underwater archaeological
site at Valgjärv (Estonia) in 2014.
This section presents the results of our more recent underwater archaeology endeavors. Section 5.1
brings the results of optoacoustic suvey of the ancient Caesare Maritima’s harbour (Israel) done in 2014.
Underwater archaeological sites surveyed in the scope of BLUEMED project (2016–2019) are given
in the following subsections, namely Underwater archaeological park of Baiae (Italy) in Section 5.2,
amphorae cage and ancient dolii sites close to Cavtat (Croatia) in Section 5.3, four ancient Greek
shipwreck from the Western Pegaseticos in Section 5.4. Finally, the survey results of S.M.S. Szent Istvan
shipwreck (sunk in 1918) made in 2019 are presented in Section 5.5. Parts of the results presented in
this Section are published by the authors in [2,4,5,33].
5.1. Caesarea Maritima
In the last decade of the first century BCE, the building of Caesarea Maritima (shown on a map in
Figure 6) was a bold effort in line with the prestige of its ruler, Herod I of Judea, and the influence of
its founder, the Roman emperor Caesar Augustus. The word Caesarea comes from the Caesars family
identity. The most prominent characteristic of the new city was a large artificial harbor occupying
an region of about 200,000 square meters [34]. It involved large artificial breakwaters built from
hydraulic cement and brought up from the seafloor. The ruins of Caesarea are the core of a national
park adjacent to Qesarya’s modern city. The sunken remains of the breakwaters and quays are covered
in sand and scattered far apart, providing researchers with a daunting challenge attempting to recreate
Herod’s initial scheme.
Figure 6. The location of the Caesarea Maritima underwater archaeological site.
At Caesarea, three modern techniques have recently been introduced with inconsistent yet
nevertheless important results: multibeam, sub-bottom sampling, and magnetic sampling [35].
The promise of the two latter technologies is their ability to record features below the visible site’s
highly disturbed surface which is essential for understanding the original structures.Remote Sens. 2020, 12, 3902 12 of 39
5.1.1. Methodology
The autonomous surface vehicle PlaDyPos built at LABUST started the first fused multibeam and
photographic images of the sunken port systems in the summer of 2014. The purpose was to construct
Caesarea’s first full-scale, fully georeferenced underwater site map with a degree of precision and
information usually seen only in small-scale underwater excavations. The field studies in PlaDyPos
concentrated on parts of both Caesarea Maritima’s inner and outer Herodian harbours. Moreover,
the ruins of a Roman pier at neighboring Sdot Yam were mapped to the south.
Two types of data were gathered during the trials at Caesarea Maritima: a georeferenced point
cloud of the seabed and archaeological features using the Norbit MBES, and visual imagery using
a low-light mono camera, the Bosch FLEXIDOME IP starlight 7000 VR, in a custom waterproof
enclosure. A GoPro Hero3 camera was also mounted onto the vehicle in a protective housing to capture
extra footage for many tasks. It acquired the georeferenced point cloud by conducting pre-programmed
lawnmower missions around the site area.
5.1.2. Results
The first objective was a survey of the base of a Roman Round Tower and Crusader Square
Tower. Once replicated as a digital 2.5D image (Figure 7a), the sand and debris turn into identifiable
architecture. The findings are ideal for visualization of GIS, such as utilizing Google Earth as seen in
Figure 8a.
(a) (b)
Figure 7. (a) 2.5D visualization of a Roman and Crusader towers foundations at Caesarea [2]. Based on
multibeam echosounder/sonar (MBES) data collected by the ASV PlaDyPos. (b) Digital reconstruction
of a 250 m section of Herod’s southern breakwater [2]. Based on MBES data collected by the
ASV PlaDyPos.
(a) (b)
Figure 8. (a) Google Earth image of Caesarea’s inner harbor with an overlaid bathymetry map [2].
Based on MBES data collected by the ASV PlaDyPos. (b) Partial bathymetry map of the southern
breakwater in Caesarea’s outer harbor [2]. Based on MBES data collected by the ASV PlaDyPos.
Herod’s outer harbor became more open and deeper, with the area being studied reaching
a depth range of 3–8 m. Three surveys were carried out over a distance of 250 m of the collapsedRemote Sens. 2020, 12, 3902 13 of 39
southern breakwater and the findings were compiled to create a 2.5D reconstruction (Figure 7b) and
a microbathymetry map (Figure 8a).
The optical data were used to generate offline a photomosaic of the region being surveyed.
We validated freely available tools such as Microsoft ICE for picture stitching, as well as in-house
applications built at LABUST. Image stitching software uses only the optical data, so the mosaics
generated in subsequent processing must be matched with the telemetry data. LABUST has built tools
for fusing both picture stitching and georeferencing optical and telemetry images. Figure 9a displays
a photomosaic of one of the GIS (Google Earth) overlays of a mission transect. The degree of detail is
shown in Figure 9b, showing a close-up of the region depicted in Figure 9a.
(a) (b)
Figure 9. Photomosaic from Caesarea’s inner harbor. (a) Mosaic overlaid on Google Earth (b) Detail of
the area enclosed by the white box in (a) [2]. Based on visual data collected by the ASV PlaDyPos.
5.1.3. Discussion
The precision of the navigation data at Caesarea Maritima was in the order of 10 cm. Since the
beam of the MBES is around 1°, this means that its minimum trace on the seafloor is 0.01h at the depth
h. This means that for the depths of Caesarea ancient port in the range 3–8 m, the best resolution
of sonar data was 3–8 cm. The interpolation grid size in QPS Qimera was 10 × 10 cm, since higher
resolution was not required by the archaeologists. The main issue with the documentation procedure
of this UCH site is the fact that this marine environment is very shallow and dynamic. It is easily
possible that each storm ruffles the sediment, thus changing the bathymetry of the area, covering
previously uncovered walls and artefacts which were once exposed at the seafloor, while uncovering
others. It would be thus useful to use a sub-bottom profiler which would penetrate the sediment and
the underlying structures to uncover the true state and shape of this buried underwater UCH.
5.2. Baiae Site
Baiae, ancient city of Campania, Italy, is located on the west coast of the Puteoli Gulf (Pozzuoli)
and lies 16 km west of Naples, as shown in Figure 10. Baiae was called after Ulysses’ helmsman Baios
according to custom. Because of its curative sulfur springs, the city is known as Aquae Cumanae in
178 BC. The mild climate of Baiae, the thermal springs and luxuriant vegetation made it a popular
resort during the Roman Republic’s later years. Many splendid villas, including those of Julius Caesar
and Nero, were established at Baiae. Owing to nearby seismic activity (bradyseism), more than 100 m
of the ancient site is now underwater in the harbor.Remote Sens. 2020, 12, 3902 14 of 39
Figure 10. The location of the Baiae underwater archaeological site.
5.2.1. Methodology
In 2018, our team went to Baiae to record the underwater archaeological site at depths of 6–8 m.
This was done under Interreg Mediterranean co-funded project BLUEMED. Survey operations at Baiae
pilot site were conducted by our team on 14-18.5.2018. The main emphasis of this operation was to
gather as much bathymetric data of the site as possible, so the ASV PlaDyBath was mostly deployed
for survey missions. For this reason, the ROV has not been used for visual inspection of the pilot site,
and UAV was not used, since we did not have an official permission for operating it in the Baia port
area. The boundary of the survey area has been determined based on a GIS map provided by the local
diving center. Detailed survey missions were planned based on the georeferenced mosaic of side-scan
sonar imagery recorded by LAUV Lupis, see Figure 11.
Figure 11. Side-scan sonar imagery mosaic recorded by LAUV Lupis.
A boat was rented from the local diving center for the bathymetry and photogrammetry data
collecting operations by the surface and underwater autonomous marine vehicles. It was quite
spacious, so deployment and recovery of the autonomous vehicles by the crane were not problematic.
The autonomous surface vehicle (ASV) PlaDyBath’s survey path was designed lawnmower-shapedRemote Sens. 2020, 12, 3902 15 of 39
survey missions along and across the area of interest in the Baiae bay. The missions were planned
with 90–120° field of view angle of the Norbit multibeam sonar used for bathymetry, having in mind
to cover the whole area with complete overlap between any two adjacent along-track survey lines,
and having across-track survey lines to maximize the amount and quality of the bathymetry data as
much as possible, and to avoid holes in the bathymetry map. As soon as one mission would finish,
the sonar data and position/attitude data were transferred from the ASV to a laptop, and bathymetry
data were processed. Meanwhile, another mission was started, so data collection and processing were
parallelized as much as possible.
5.2.2. Results
The georeferenced side-scan sonar mosaic shown of the Baiae underwater archaeologycal park
is shown in Figure 11. Results of multibeam sonar data postprocessing in QPS Qimera software are
shown in Figure 12. Bathymetry map of the whole survey Baiae area is given in Figure 12a, with details
of the sunken Vila dei Pisoni in Figure 12b, and details of the sunken Vila Protiro in Figure 12c. It is
notable that the walls of these villas can clearly be distinguished from the surrounding seafloor.
(a)
(b) (c)
Figure 12. (a) Results of the whole Baia pilot site’s bathymetry. (b), Details of the submerged Villa dei
Pisoni. (c) Details of the submerged Villa Protiro. 2.5 bathymetric models are based on MBES data
collected by the ASV PlaDyBath.
5.2.3. Discussion
Surveys at Baiae site were hazardous for the ASV close to the steep cliff of the cape on the
north-eastern corner of the UCH area, as well as due to the busy marina just north-west of the site.
Even though the UCH area is delimited with bouys, many vessel do not abide and sail right through
the marine protected area. Moreover, the AUV operations were done from the surface with more denseRemote Sens. 2020, 12, 3902 16 of 39
lawnmower survey missions, because of potential safety risk and possible collisions with other vessels
during the resurfacing.
The precision of position in bathymetric model of Baiae site is on the order of 10 cm because there
we were not given access to the local base stations for georeferencing corrections through NTrip client.
Since the beam of the MBES is around 1°, this means that its minimum trace on the seafloor is 0.01h at
the depth h. This means that for the depths of ancient Roman Baiae site in the range 6–8 m, the best
resolution of sonar data was 6–8 cm. The interpolation grid size in QPS Qimera was 10 × 10 cm, since
higher resolution was not required by the archaeologists, and all the walls and masonry details of
villas are visible in bathymetric maps. In the initial bathymetric interpolated model, there were waves
which translated from the surface to the sonar data. This is a consequence of the INS system not having
a heave sensor. However, Qimera’s Wobble Analysis tool and further spline interpolation solved this
problem in the post-processing phase.
One of the most important wider social impacts our survey work had on the local Baiae community
was the deisgn of DryDive mobile application, which our colleagues from University of Calabria made
using, in part, our recorded data in the scope of Horizon 2020 i-MARECULTURE project.
5.3. Cavtat Sites
The Adriatic Sea is teeming with undiscovered ancient shipwrecks and untold treasures.
Two remarkable underwater sites in Croatia, one with around 700 amphorae and the other one
with dolii are located in front of Cavtat, a town south of Dubrovnik, as shown in Figure 13.
Figure 13. The location of the Cavtat underwater archaeological site.
5.3.1. Merchant—Ancient Greek Sailing Boat with Dolii
One special feature, though, is the underwater site officially discovered in 1996, representing the
only preserved site of large ancient ceramic vessels for cargo-dolia (Greek: Pithos, Latin: dolium) on
the eastern Adriatic coast. It is an intact location at the depth of around 20 m. The site covers 10 × 20 m
area. Traces of the sunken boat have not been noted, though dolia’s discovery may simply illustrate
the unproven shipwreck. Throughout the 2nd and 1st centuries B.C., dolia was also found on Roman
warships in the Antiquity. These became the primary way of shipping goods in the 1st century, and the
features of ancient tankers were taken over by vessels that transported them. Their capacities ranged
between 1500 and 3000 L. Cavtat’s dolia dates back to the 1st century and its estimated capacity ranged
from 1200 to 1400 L.
5.3.2. Amphorae Cage
An ancient Greek shipwreck believed to hold a cargo worth around $5–8 million in today’s
value has recently been protected with a large cage to shield the ship’s cargo from scuba looters who
would be tempted to steal the objects. The wreck of these 700 vases was a Greek trade vessel of theRemote Sens. 2020, 12, 3902 17 of 39
second century bearing a shipment of earthenware amphoras of olive oil and wine, which sunk just
off the coast of a small town of Cavtat, 20 km south of Dubrovnik, Croatia. In 1999, Boris Obradovic,
the director of a nearby Scuba Diving center discovered the wreck and now guides more seasoned
scuba divers down to the debris. The wooden ship is almost entirely decomposed, but oddly enough,
the ceramic amphora is holding the wine and olive oil, which are still intact and lined in the ships’
holds row after row. This freight that has considerable historical importance and interest on the black
market is worth quite a bit of money, prompting the Croatian authorities to cover the wreck with
a huge heavy duty metal frame. The cage itself is about 20 m long and 10 m high, and has a big hinged
door that can be locked closed.
5.3.3. Methodology
In 2018, LABUST team went to Cavtat to record the dolia and amphorae cage sites, which
are only a few hundred meters apart. This was done under Interreg Mediterranean co-funded
project BLUEMED. The team worked from a catamaran work boat anchored close to the underwater
archaeological sites. The deployment of the bulky ASV was simplified by using a mobile manual crane
operated from the spacious flat stern of the catmaran work boat. This enabled the multibeam sonar
mounted ASV to perform survey missions and record bathymetric data more easily, thus losing less
time during the battery changes.
BLUEROV2 was used for visual data collection, mainly at the dolia site. Easily deployable,
and manually controlled, ROV has been shown to be very useful, especially since there is a direct
visual link through the tether back to the operator’s screen.
One of the goals of this Cavtat trial was to gather dataset for photogrammetry of the Supetar
islet close to these two underwater archaeological sites. The UAV took HD photos of the island in
a crosshatch coverage plan, with 70% across- and along-track overlap between adjacent photos, at an
altitude of 40 m for safety reasons.
5.3.4. Results
Precise positions of both sites were determined from the georeferenced side-scan sonar imagery
of the area, recorded by the LAUV Lupis, as shown in Figure 14. The resulting bathymetric map of the
area is given in Figure 15.
(a)
(b)
Figure 14. Side-scan sonar imagery of the sites. (a) Dolii site. (b) Amphorae cage site.Remote Sens. 2020, 12, 3902 18 of 39
Figure 15. Bathymetry map of the underwater archeological sites in front of Cavtat, Croatia. Moreover,
the 2.5 bathymetric model is based on MBES data collected by the ASV PlaDyBath.
In the post-processing phase, a 3D model of one dolium was generated from downsampling
a 25 fps HD video from ROV’s logs, as shown in Figure 16b. The biggest problem with the use of
frames extracted from the recorded video is motion blur, which renders 3D models of relatively less
quality compared to the ones generated from still photographs of a DSLR camera with an external
high-power flash. Nonetheless, this opens a possibility to document an underwater archaeological site
much faster and with much less logistics compared to the case when divers record the site. The result
of the photogrammetry post-processing of the Supetar islet aerial photos is given in Figure 17b.
(a) (b)
(c)
Figure 16. (a) Operating BLUEROV2 at dolia site in Cavtat, Croatia, with a direct HD video feedback
on a high-contrast screen.(b) Photogrammetric 3D reconstruction of a dolium based on frames from
remotely operated vehicles (ROV)’s camera. (c) 3D reconstruction of the island Supetar in front of
Cavtat bay, close to the diving locations of the amphorae cage and dolia locations.Remote Sens. 2020, 12, 3902 19 of 39
(a) (b)
Figure 17. Knowledge Awareness Center opened in Konavle near Cavtat, Croatia. (a) Presentation of
the so called underwater cultural heritage sites (UCH) site dry dive experience through virtual reality.
(b) Interactive content presentation, e.g., 3D reconstructed model of an amphora at Cavtat Amphorae
cage site that offers information on a 4K ultra HD TV and interaction over a touchscreen.
5.3.5. Discussion
The precision of the navigation data at Cavtat site was on the order of 1 cm, since corrections
w.r.t. the local CROPOS base station system were available through NTrip client connected over a 4G
modem onboard the ASV. Since the beam of the MBES is around 1°, this means that its minimum trace
on the seafloor is 0.01h at the depth h. This means that for the depths of the amphorae cage and dolii
site in the range 20–25 m, the best resolution of sonar data was 0.2 m. The interpolation grid size in
QPS Qimera was 20 × 20 cm, since higher resolution was not required by the archaeologists, and all
the walls and masonry details of villas are visible in bathymetric maps.
One of the most important results of our surveys at Cavtat UCH sites was the opening of
a Knowledge Awareness Center (KAC) in Konavle near Cavtat in January 2020. This was done in the
scope of BLUEMED project, as shown in Figure 17. There, our findings were presented in various
forms. One form of knowledge presentation was a virtual reality (VR) set that was build based on our
bathymetric model and merged with high-resolution photogrammetric model done by our colleagues
from University of Calabria led by Prof. Fabio Bruno.
5.4. Western Pagaseticos Sites
Four underwater archaeological sites were surveyed by our autonomous vehicles in the Westerns
Pagaseticos, Greece, a map of which is shown in Figure 18.
Figure 18. The locations of the underwater archaeological sites in Western Pagaseticos.Remote Sens. 2020, 12, 3902 20 of 39
5.4.1. Alonissos—Peristera Shipwreck
This shipwreck was found in the early 1990s. The uncovered pieces of the wooden ruin of Peristera
have been rotting away for a long time, but the remaining cargo has a fantastic 4000 amphorae seascape.
The ship, claimed by historians to be a huge Athenian barge holding wine-filled amphoras, presumably
sunk at the end of the fifth century B.C. The hull still lies submerged at around 30 m, and archaeologists
believe it is the biggest ship of its type found beneath the sea.
At this site, the team first obtained a georeferenced mosaic of the collected side-scan sonar data
collected by the AUV Lupis around the pilot site given in Figure 19a. The ASV was used to gather
bathymetric data of the pilot site in more detail, with a narrow angle of view of the sonar, and high
percentage of swath overlap between neighbouring survey lawnmower lanes. A wider sonar angle of
view, but again with a high percentage of overlap between consecutive survey lanes, were used to
gather bathymetric data of the pilot site’s surrounding area. The overlay of all survey missions planned,
as well as wide areas, detailing the bathymetry map of the pilot site itself are given in Figure 19b.
UAV DJI Phantom 4 UAV was used to gather photos of the Peristera island part just in front of
the pilot site. It was programmed to execute a crosshatch mission at altitude of 40 m, and a 70% along-
and across-track overlap between photos. Results of the 3D reconstruction of the Peristera island part
are given in Figure 19c, based on 381 photos.
(a) (b)
(c)
Figure 19. (a) Side-scan sonar mosaic of the Peristera site georeferenced and shown in Google Earth,
based on SSS data collected by LAUV Lupis. (b) Results of bathymetry of the area surrounding the
Peristera pilot based on MBES data collected by ASV PlaDyBath. (c) 3D reconstruction of the part of
Peristera island in front of the pilot site locations, based on visual data collected by UAV DJI Phantom 4.
Merging of the low-resolution acoustic model of the seafloor with the high-resolution textured
photogrammetry model is shown in Figure 20, which is one of the results stemming from the
aforementioned BLUEMED project and collaboration with our partners from University of Calabria
led by Fabio Bruno [4,5]. The reason why this merger was performed is that one of the BLUEMED
project goals was to preserve the underwater cultural heritage sites in a digital form, so that visitors of
the museum in the vicinity of the site can experience the diving visit to the site by wearing a virtual
reality set. This allowed for the low-resulotion acoustic model of the area to provide the georeferenced
collocation to the high-resolution textured photogrametric model of the site, but also the general
features for the UCH’s surrounding area.You can also read