UTAH BUREAU OF LAND MANAGEMENT - Air Resource Management Strategy 2020 Monitoring Report
←
→
Page content transcription
If your browser does not render page correctly, please read the page content below
UTAH BUREAU OF LAND
 MANAGEMENT
Air Resource Management Strategy
 2020 Monitoring Report
 (Data through 2019)

 8
Table of Contents
TABLE OF CONTENTS ............................................................................................................................................2
LIST OF TABLES .......................................................................................................................................................5
LIST OF FIGURES .....................................................................................................................................................8
ACRONYMS.............................................................................................................................................................. 10
1. INTRODUCTION ............................................................................................................................................ 11
1.1. UPDATES, ADDITIONS, AND CHANGES FROM PREVIOUS REPORT.......................................... 11
2. REGULATORY ANALYSIS ........................................................................................................................... 11
 2.1. REGULATIONS AND POLICY ........................................................................................................................ 12
 Clean Air Act ...................................................................................................................................................... 12
 Federal Land Policy and Management Act ........................................................................................................ 12
 National Environmental Policy Act .................................................................................................................... 12
 Additional Guidance ........................................................................................................................................... 13
 2.2. REGULATED VALUES .................................................................................................................................. 13
 2.2.1. Criteria Air Pollutants....................................................................................................................... 13
 2.2.2. Hazardous Air Pollutants (HAPs) ..................................................................................................... 15
 2.2.3. Air Quality Related Values ................................................................................................................ 16
 2.2.4. Greenhouse Gases ............................................................................................................................. 16
 2.2.5. NOISE ..................................................................................................................................................... 16
 2.3. AIR RESOURCE MANAGEMENT ................................................................................................................... 17
 2.3.1. Smoke Management Airsheds ............................................................................................................ 17
 2.3.2. Class I & II Airsheds ......................................................................................................................... 18
 2.3.3. Nonattainment Areas (NAA) .............................................................................................................. 19
 2.4. ADMINISTRATIVE RULES AND IMPLEMENTATION PLANS ............................................................................ 20
 2.4.1. State ................................................................................................................................................... 20
 2.4.2. Tribal/Federal ................................................................................................................................... 21
3. AIR QUALITY CONDITIONS AND TRENDS ............................................................................................ 21
 3.1. EMISSIONS .................................................................................................................................................. 21
 Criteria Pollutant Emissions............................................................................................................................... 21
 HAP Emissions ................................................................................................................................................... 22
 3.2. AIR QUALITY INDEX AND AIR POLLUTANT CONCENTRATIONS................................................................... 23
 3.3. AIR QUALITY RELATED VALUES (AQRV).................................................................................................. 26
 3.3.1. Visibility ............................................................................................................................................ 26
 3.3.2. Deposition ......................................................................................................................................... 28
4. NOISE, EXISTING CONDITIONS ................................................................................................................ 29
 4.1. Soundscape ............................................................................................................................................ 29
 4.2. Sound Levels for Different Sources........................................................................................................ 30
 4.3. Noise Mitigation .................................................................................................................................... 32
5. GREENHOUSE GAS ....................................................................................................................................... 32
 5.1. Emissions and Sequestration ................................................................................................................. 33
 5.2. Atmospheric Concentrations of Greenhouse Gases ............................................................................... 35
 5.3. Foreseeable Greenhouse Gas Emissions Estimates .............................................................................. 36
6. CLIMATE AND CLIMATE CHANGE ......................................................................................................... 42
 6.1. Climate Normals .................................................................................................................................... 44
 6.2. Climate Trends....................................................................................................................................... 44
 6.3. Climate Change ..................................................................................................................................... 53

 8
7. BLM MONITORING ACTIVITIES .............................................................................................................. 55
8. AIR RESOURCE DEVELOPMENTS ............................................................................................................ 55
 8.1. GUIDANCE ON ASSESSING GHG EMISSIONS IN NEPA ................................................................................ 55
 8.2. NAAQS REVIEW ........................................................................................................................................ 56
 8.3. NONATTAINMENT AREAS (NAA) ............................................................................................................... 56
REFERENCES .......................................................................................................................................................... 57
APPENDIX A (CEDAR CITY FIELD OFFICE) ................................................................................................... 61
 OVERVIEW ............................................................................................................................................................... 61
 CRITERIA AIR POLLUTANT EMISSIONS ..................................................................................................................... 61
 GREENHOUSE GAS EMISSIONS ................................................................................................................................. 61
 GREENHOUSE GAS EMISSIONS FROM OIL AND GAS WELLS ..................................................................................... 62
 CLIMATE CONDITIONS ............................................................................................................................................. 62
APPENDIX B (FILLMORE FIELD OFFICE) ...................................................................................................... 64
 OVERVIEW ............................................................................................................................................................... 64
 CRITERIA AIR POLLUTANT EMISSIONS ..................................................................................................................... 65
 GREENHOUSE GAS EMISSIONS ................................................................................................................................. 65
 GREENHOUSE GAS EMISSIONS FROM OIL AND GAS WELLS ..................................................................................... 65
 CLIMATE CONDITIONS ............................................................................................................................................. 66
APPENDIX C (KANAB FIELD OFFICE AND GRAND STAIRCASE ESCALANTE NM) ............................ 68
 OVERVIEW ............................................................................................................................................................... 68
 CRITERIA AIR POLLUTANT EMISSIONS ..................................................................................................................... 68
 GREENHOUSE GAS EMISSIONS ................................................................................................................................. 69
 GREENHOUSE GAS EMISSIONS FROM OIL AND GAS WELLS ..................................................................................... 69
 CLIMATE CONDITIONS ............................................................................................................................................. 70
APPENDIX D (MOAB FIELD OFFICE)................................................................................................................ 72
 OVERVIEW ............................................................................................................................................................... 72
 CRITERIA AIR POLLUTANT EMISSIONS ..................................................................................................................... 72
 GREENHOUSE GAS EMISSIONS ................................................................................................................................. 72
 GREENHOUSE GAS EMISSIONS FROM OIL AND GAS WELLS ..................................................................................... 73
 CLIMATE CONDITIONS ............................................................................................................................................. 73
APPENDIX E (MONTICELLO FIELD OFFICE AND BENM) .......................................................................... 75
 OVERVIEW ............................................................................................................................................................... 75
 CRITERIA AIR POLLUTANT EMISSIONS ..................................................................................................................... 75
 GREENHOUSE GAS EMISSIONS ................................................................................................................................. 75
 GREENHOUSE GAS EMISSIONS FROM OIL AND GAS WELLS ..................................................................................... 76
 CLIMATE CONDITIONS ............................................................................................................................................. 77
APPENDIX F (PRICE FIELD OFFICE) ................................................................................................................ 78
 OVERVIEW ............................................................................................................................................................... 78
 CRITERIA AIR POLLUTANT EMISSIONS ..................................................................................................................... 79
 GREENHOUSE GAS EMISSIONS ................................................................................................................................. 79
 GREENHOUSE GAS EMISSIONS FROM OIL AND GAS WELLS ..................................................................................... 80
 CLIMATE CONDITIONS ............................................................................................................................................. 80
APPENDIX G (RICHFIELD FIELD OFFICE) ..................................................................................................... 81
 OVERVIEW ............................................................................................................................................................... 81
 CRITERIA AIR POLLUTANT EMISSIONS ..................................................................................................................... 81
 GREENHOUSE GAS EMISSIONS ................................................................................................................................. 82
 GREENHOUSE GAS EMISSIONS FROM OIL AND GAS WELLS ..................................................................................... 83

 8
CLIMATE CONDITIONS ............................................................................................................................................. 84
APPENDIX H (SALT LAKE FIELD OFFICE) ..................................................................................................... 85
 OVERVIEW ............................................................................................................................................................... 85
 CRITERIA AIR POLLUTANT EMISSIONS ..................................................................................................................... 85
 GREENHOUSE GAS EMISSIONS ................................................................................................................................. 86
 GREENHOUSE GAS EMISSIONS FROM OIL AND GAS WELLS ..................................................................................... 87
 CLIMATE CONDITIONS ............................................................................................................................................. 87
APPENDIX I (ST. GEORGE FIELD OFFICE) ..................................................................................................... 90
 OVERVIEW ............................................................................................................................................................... 90
 CRITERIA AIR POLLUTANT EMISSIONS ..................................................................................................................... 90
 GREENHOUSE GAS EMISSIONS ................................................................................................................................. 91
 GREENHOUSE GAS EMISSIONS FROM OIL AND GAS WELLS ..................................................................................... 91
 CLIMATE CONDITIONS ............................................................................................................................................. 91
APPENDIX J (VERNAL FIELD OFFICE) ............................................................................................................ 93
 OVERVIEW ............................................................................................................................................................... 93
 CRITERIA AIR POLLUTANT EMISSIONS ..................................................................................................................... 93
 GREENHOUSE GAS EMISSIONS ................................................................................................................................. 94
 GREENHOUSE GAS EMISSIONS FROM OIL AND GAS WELLS ..................................................................................... 94
 CLIMATE CONDITIONS ............................................................................................................................................. 94
APPENDIX K (SINGLE WELL GHG EMISSIONS ESTIMATES) ................................................................... 96
 OVERVIEW ............................................................................................................................................................... 96
 GREEN RIVER DISTRICT DIRECT EMISSIONS ............................................................................................................ 96
 CANYON COUNTRY DISTRICT DIRECT EMISSIONS ................................................................................................... 97
 COLOR COUNTRY, PARIA RIVER, AND WEST DESERT DISTRICT DIRECT EMISSIONS ............................................... 97
 GHG COMBUSTION EMISSIONS FROM PRODUCED OIL AND GAS. ............................................................................ 97

 8
List of Tables
Table 1 Primary Criteria Pollutant NAAQS. .............................................................................................. 14
Table 2 HAP Reference Exposure Levels and Reference Concentrations (RfCs) ...................................... 15
Table 3 PSD Increments (µg/m3) ............................................................................................................... 19
Table 4, 2017 Statewide Criteria Air Pollutant Emissions (tpy) by Source................................................ 22
Table 5 2017 Emissions Inventory of Hazardous Air Pollutants (HAPs) ................................................... 22
Table 6 Total Cancer Risk and Noncancer Respiratory Hazard from Existing Hazardous Air Pollutant
Emissions .................................................................................................................................................... 23
Table 7 AQI Index Summary Statistics by County..................................................................................... 24
Table 8 County-level Design Value History for the PM2.5 Annual NAAQS (12 µg/m3) ........................... 24
Table 9 County-level Design Value History for the PM2.5 24-hour NAAQS (35 µg/m3) .......................... 25
Table 10 County-level Design Value History for the NO2 1-Hour NAAQS (100 ppb) ............................. 25
Table 11 County-level Design Value History for the NO2 Annual NAAQS (53 ppb) ............................... 25
Table 12 County-level Design Value History for the Ozone NAAQS (0.070 ppm) .................................. 26
Table 13 Nitrogen and Sulfur Deposition Conditions at National Park Service Managed Areas in Utah .. 29
Table 14 Sound Level Corrections to Account for Different Communities Attitudes on Noise ................ 31
Table 15 Average Sound Level for Various Activities. .............................................................................. 31
Table 16 The Sound Level Increase from Adding Two or More Noise Levels .......................................... 32
Table 17 Greenhouse Gases and Their Global Warming Potentials ........................................................... 33
Table 18. Annual State, National, and Global GHG Emissions (CO2e) in Million Metric Tons (MMT) per
Year ............................................................................................................................................................. 33
Table 19. Gross Fossil Fuel Emissions from Federal Lands (MMT CO2e) ................................................ 34
Table 20. 2019 Baseline Annual GHG Emissions (MT CO2e/yr.) from Existing Oil and Gas Wells. ....... 34
Table 21. Global Atmospheric Concentration and Rate of Change of Greenhouse Gases ......................... 35
Table 22 2020 to 2050 Average Annual Long-term Foreseeable Oil and Gas Emissions.......................... 39
Table 23 2020 to 2050 Aggregate Long-term Foreseeable Oil and Gas Emissions. .................................. 40
Table 22. Current Climate Conditions and Trends in Utah ........................................................................ 45
Table 23, 2017 Criteria Air Pollutant Emissions (tpy) by Source for the Cedar City FO .......................... 61
Table 24 Existing Greenhouse Gas Emissions (MT CO2e) by Sector in the Cedar City Field Office ....... 61
Table 25 Average (1981-2010) Temperatures in the Cedar City FO.......................................................... 62
Table 26 Average (1981-2010) of Maximum Temperatures in the Cedar City FO .................................... 62
Table 27 Average (1981-2010) of Minimum Temperatures in the Cedar City FO .................................... 62
Table 28 Average (1981-2010) Precipitation for the Cedar City FO.......................................................... 63
Table 29 Prevailing Wind Directions in the Cedar City FO ....................................................................... 64
Table 30 Average Wind Speed (mph) in the Cedar City FO ...................................................................... 64
Table 31 2017 Criteria Air Pollutant Emissions (tpy) by Source for the Fillmore FO ............................... 65
Table 32 Existing Greenhouse Gas Emissions (MT CO2e) by Sector in the Fillmore Field Office ........... 65
Table 33 Average (1981-2010) Temperatures in the Fillmore FO ............................................................. 66
Table 34 Average (1981-2010) of Maximum Temperatures in the Fillmore FO ....................................... 66
Table 35 Average (1981-2010) of Minimum Temperatures in the Fillmore FO ........................................ 66
Table 36 Average (1981-2010) Precipitation for the Fillmore FO ............................................................. 66
Table 37 Prevailing Wind Directions in the Fillmore FO ........................................................................... 68
Table 38 Average Wind Speed (mph) in the Fillmore FO .......................................................................... 68
Table 39, 2017 Criteria Air Pollutant Emissions (tpy) by Source for Kanab FO and GSENM.................. 69
Table 40 Existing Greenhouse Gas Emissions (MT CO2e) by Sector in the Kanab Field Office and Grand
Staircase Escalante National Monument..................................................................................................... 69
Table 41 Average (1981-2010) Temperatures in the Kanab FO and GSENM-KEPA ............................... 70
Table 42 Average (1981-2010) of Maximum Temperatures in the Kanab FO and GSENM-KEPA ......... 70
Table 43 Average (1981-2010) of Minimum Temperatures in the Kanab FO and GSENM-KEPA .......... 70
Table 44 Average (1981-2010) Precipitation for Kanab FO and GSENM-KEPA ..................................... 70

 8
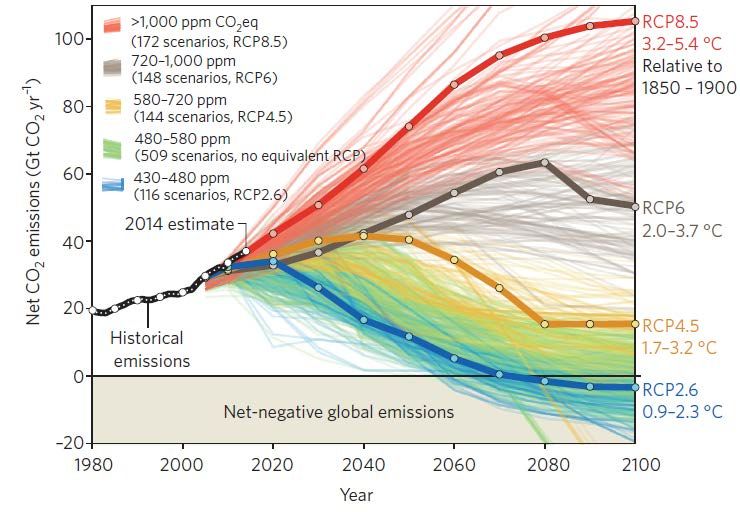
Table 45 Prevailing Wind Directions in the Kanab FO and GSENM-KEPA............................................. 72
Table 46 Average Wind Speed (mph) in the Kanab FO and GSENM-KEPA............................................ 72
Table 47 2017 Criteria Air Pollutant Emissions (tpy) by Source for the Moab FO ................................... 72
Table 48 Existing Greenhouse Gas Emissions (MT CO2e) by Sector in the Moab Field Office................ 73
Table 49 Average (1981-2010) Temperatures in the Moab FO.................................................................. 73
Table 50 Average (1981-2010) of Maximum Temperatures in the Moab FO ............................................ 73
Table 51 Average (1981-2010) of Minimum Temperatures in the Moab FO ............................................ 74
Table 52 Average (1981-2010) Precipitation for the Moab FO.................................................................. 74
Table 53 Prevailing Wind Directions in the Moab FO ............................................................................... 74
Table 54 Average Wind Speed (mph) in the Moab FO .............................................................................. 75
Table 55 2017 Criteria Air Pollutant Emissions (tpy) by Source for the Monticello FO and BENM ........ 75
Table 56 Existing Greenhouse Gas Emissions (MT CO2e) by Sector in the Monticello Field Office ....... 75
Table 27 2020 to 2050 Average Annual Long-term Foreseeable Oil and Gas Emissions.......................... 76
Table 28 2020 to 2050 Aggregate Long-term Foreseeable Oil and Gas Emissions. .................................. 77
Table 57 Average (1981-2010) Temperatures for the Monticello FO and BENM ..................................... 77
Table 58 Average (1981-2010) of Maximum Temperatures for the Monticello FO and BENM ............... 78
Table 59 Average (1981-2010) of Minimum Temperatures for the Monticello FO and BENM ............... 78
Table 60 Average (1981-2010) Precipitation for the Monticello FO and BENM ...................................... 78
Table 61 2017 Criteria Air Pollutant Emissions (tpy) by Source for the Price FO..................................... 79
Table 62 Existing Greenhouse Gas Emissions (MT CO2e) by Sector in the Price Field Office................. 79
Table 63 Average (1981-2010) Temperatures in the Price FO ................................................................... 80
Table 64 Average (1981-2010) of Maximum Temperatures in the Price FO ............................................. 80
Table 65 Average (1981-2010) of Minimum Temperatures in the Price FO.............................................. 80
Table 66 Average (1981-2010) Precipitation for the Price FO ................................................................... 80
Table 67 Prevailing Wind Directions in the Price FO ................................................................................ 81
Table 68 Average Wind Speed (mph) in the Price FO ............................................................................... 81
Table 69 2017 Criteria Air Pollutant Emissions (tpy) by Source for the Richfield FO .............................. 82
Table 70 Existing Greenhouse Gas Emissions (MT CO2e) by Sector in the Richfield Field Office .......... 82
Table 27 2020 to 2050 Average Annual Long-term Foreseeable Oil and Gas Emissions.......................... 83
Table 28 2020 to 2050 Aggregate Long-term Foreseeable Oil and Gas Emissions. .................................. 84
Table 71 Average (1981-2010) Temperatures in the Richfield FO ............................................................ 84
Table 72 Average (1981-2010) of Maximum Temperatures in the Richfield FO ...................................... 85
Table 73 Average (1981-2010) of Minimum Temperatures in the Richfield FO ....................................... 85
Table 74 Average (1981-2010) Precipitation for the Richfield FO ............................................................ 85
Table 75, 2017 Criteria Air Pollutant Emissions (tpy) by Source for the Salt Lake FO............................. 86
Table 76 Existing Greenhouse Gas Emissions (MT CO2e) by Sector in the Salt Lake Field Office.......... 87
Table 77 Average (1981-2010) Temperatures in the Salt Lake FO ............................................................ 87
Table 78 Average (1981-2010) of Maximum Temperatures in the Salt Lake FO ...................................... 87
Table 79 Average (1981-2010) of Minimum Temperatures in the Salt Lake FO....................................... 88
Table 80 Average (1981-2010) Precipitation for the Salt Lake FO ............................................................ 88
Table 81 Prevailing Wind Directions in the Salt Lake FO ......................................................................... 90
Table 82 Average Wind Speed (mph) in the Salt Lake FO ........................................................................ 90
Table 83, 2017 Criteria Air Pollutant Emissions (tpy) by Source for the St George FO ............................ 90
Table 84 Existing Greenhouse Gas Emissions (MT CO2e) by Sector in the St George Field Office ......... 91
Table 85 Average (1981-2010) Temperatures in the St George FO ........................................................... 91
Table 86 Average (1981-2010) of Maximum Temperatures in the St George FO ..................................... 91
Table 87 Average (1981-2010) of Minimum Temperatures in the St George FO...................................... 92
Table 88 Average (1981-2010) Precipitation for the St George FO ........................................................... 92
Table 89 Prevailing Wind Directions in the St George FO ........................................................................ 92
Table 90 Average Wind Speed (mph) in the St George FO ....................................................................... 92
Table 91 2017 Criteria Air Pollutant Emissions (tpy) by Source for the Vernal FO .................................. 93

 8
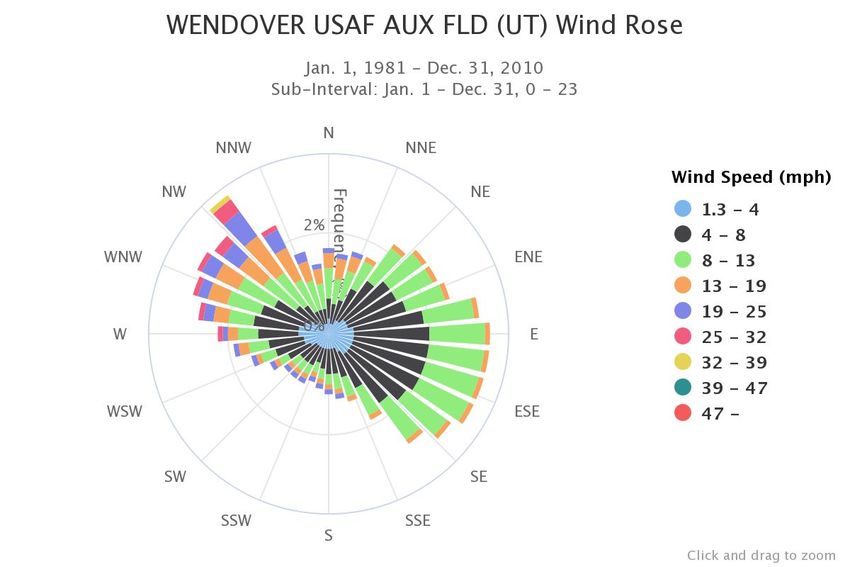
Table 92 Existing Greenhouse Gas Emissions (MT CO2e) by Sector in the Vernal Field Office .............. 94
Table 93 Average (1981-2010) Temperatures in the Vernal FO ................................................................ 94
Table 94 Average (1981-2010) of Maximum Temperatures in the Vernal FO .......................................... 95
Table 95 Average (1981-2010) of Minimum Temperatures in the Vernal FO ........................................... 95
Table 96 Average (1981-2010) Precipitation for the Vernal FO ................................................................ 95
Table 97 Prevailing Wind Directions in the Vernal FO.............................................................................. 96
Table 98 Average Wind Speed (mph) in the Vernal FO............................................................................. 96
Table 99 Single Well GHG Emissions Based on the Monument Butte FEIS Alternative B Inventory ..... 96
Table 100 Single Well GHG Emissions Based on the Moab MLP FEIS Inventory ................................... 97
Table 101 Single Well GHG Emissions Based on the GSENM Kanab DEIS Inventory ........................... 97
Table 112. Ten-Year (2010-2019) Average Annual Production and Associated GHG Combustion
Emissions, and Single Well Emissions Estimate ........................................................................................ 98

 8
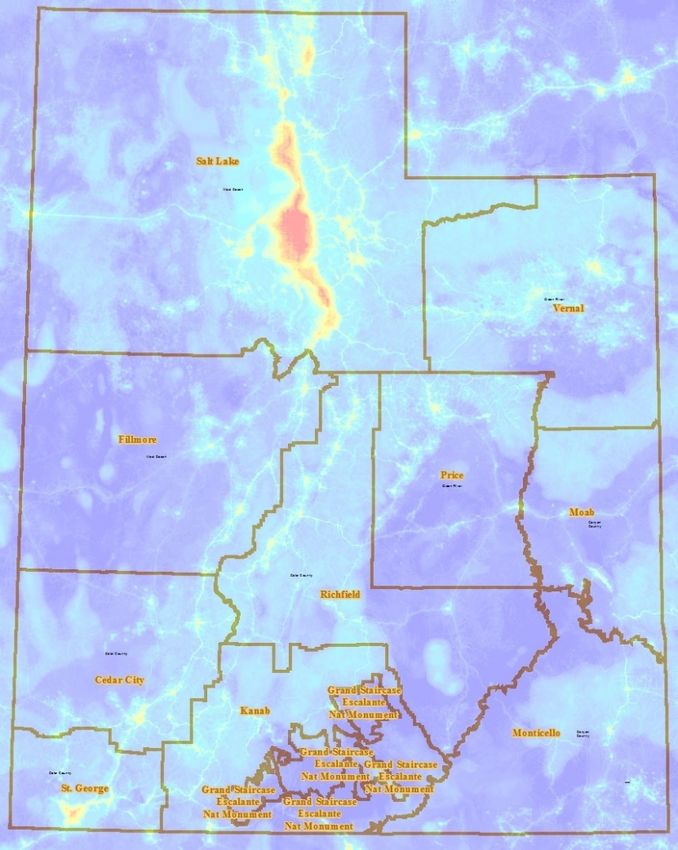
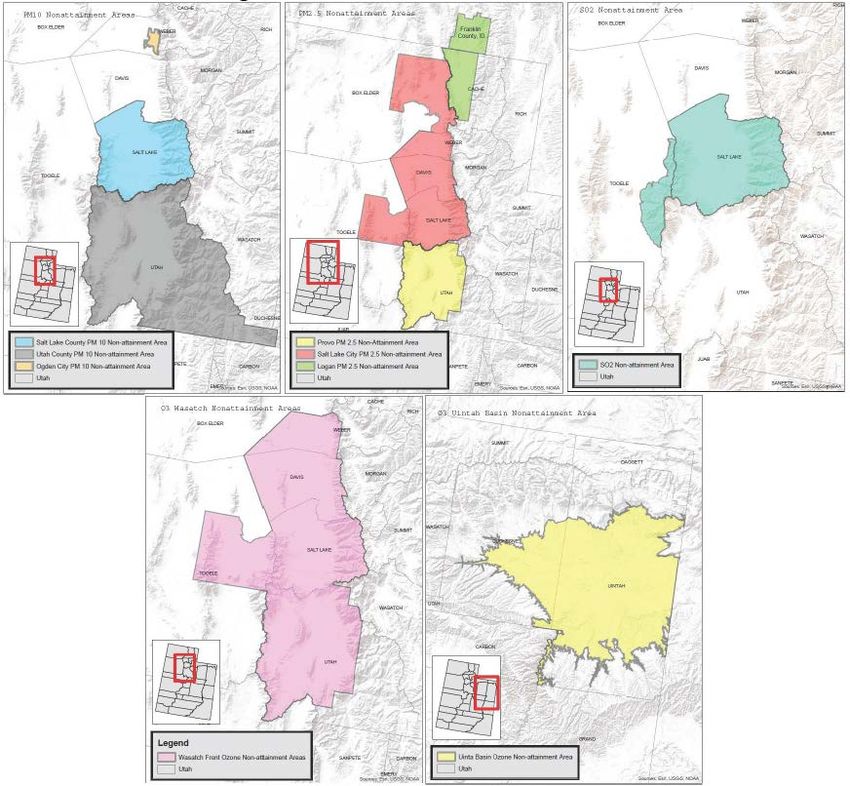
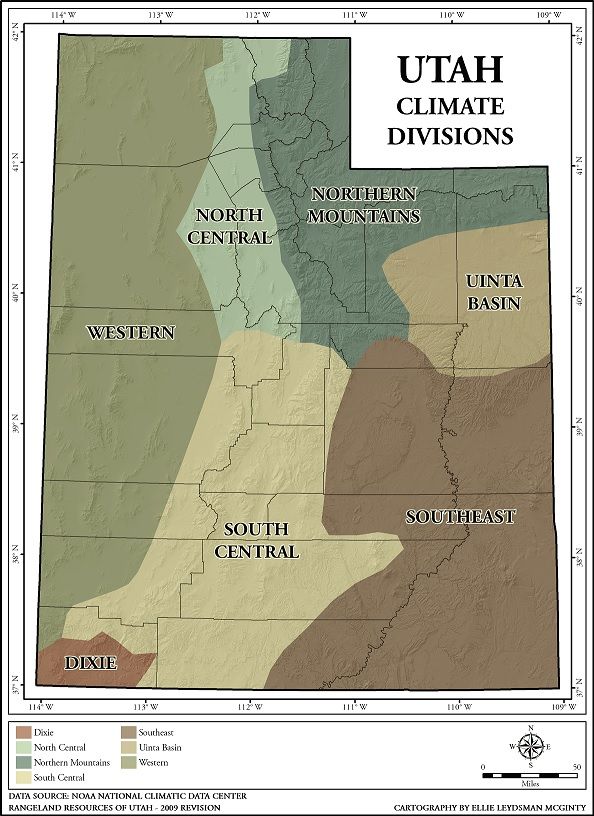
List of Figures
Figure 1 Utah Smoke Management Airsheds ............................................................................................. 18
Figure 2, PM10, PM2.5, SO2, and O3 nonattainment Areas in Utah. Source: Utah Division of Air Quality
2018 Annual Report .................................................................................................................................... 20
Figure 3, Visibility Trends at Bryce Canyon NP ........................................................................................ 27
Figure 4, Visibility Trends at Canyonlands NP .......................................................................................... 27
Figure 5, Visibility Trends at Capitol Reef NP........................................................................................... 28
Figure 6, Visibility Trends at Zion NP ....................................................................................................... 28
Figure 7 Sounds scape map of existing noise levels in Utah. Warmer colors represent louder noise
(approximately 60 L50 dBA) and colder colors represent quieter noise levels (approzimately 20 L50 dBA).
 .................................................................................................................................................................... 30
Figure 8. Atmospheric concentrations of GHG's and the Annual Greenhouse Gas Index from 1700 to 2018.
(NOAA/ESRL, 2019) ................................................................................................................................. 36
Figure 9 Projected GHG emissions in Utah through the year 2050, from The Utah Roadmap: Positive
solutions on climate and air quality (Gardner, 2020).................................................................................. 37
Figure 10 U.S. energy related GHG emissions projections for a range of low to high economic growth.
Source: EIA Annual Energy Outlook 2020. ............................................................................................... 38
Figure 11 Global energy related GHG emissions projections through 2050. Source: EIA International
Energy Outlook 2019. ................................................................................................................................. 38
Figure 12 Estimated future GHG emissions from oil and gas wells in Utah, based on EIA projected oil and
gas production for the Rocky Mountain region (EIA, 2020). ..................................................................... 39
Figure 13 GHG emissions pathways for lead to to radiative forcing of 8.5 W/m2 (red), 6.0 W/m2 (gray), 4.5
W/m2 (yellow), and 2.6 W/m2 (blue) by the year 2100. Source of figure: (Fuss, et al., 2014) ................... 41
Figure 14, NOAA National Centers for Environmental Information Climate Divisions ........................... 44
Figure 15, Utah Western Climate Division 1 Precipitation Trend .............................................................. 46
Figure 16, Utah Dixie Climate Division 2 Precipitation Trend .................................................................. 46
Figure 17, Utah North Central Climate Division 3 Precipitation Trend ..................................................... 47
Figure 18, Utah South Central Climate Division 4 Precipitation Trend ..................................................... 47
Figure 19, Utah Northern Mountains Climate Division 5 Precipitation Trend........................................... 48
Figure 20, Utah Uinta Basin Climate Division 6 Precipitation Trend ........................................................ 48
Figure 21, Utah Southeast Climate Division 7 Precipitation Trend............................................................ 49
Figure 22, Utah Western Climate Division 1 Temperature Trend .............................................................. 49
Figure 23, Utah Dixie Climate Division 2 Temperature Trend .................................................................. 50
Figure 24, Utah North Central Climate Division 3 Temperature Trend ..................................................... 50
Figure 25, Utah South Central Climate Division 4 Temperature Trend ..................................................... 51
Figure 26, Utah Northern Mountains Climate Division 5 Temperature Trend........................................... 51
Figure 27, Utah Uinta Basin Climate Division 6 Temperature Trend ........................................................ 52
Figure 28, Utah Southeast Climate Division 7 Temperature Trend............................................................ 52
Figure 29. Seasonal average time series of maximum 2-m air temperature for historical (black), RCP4.5
(blue), and RCP8.5 (red). Solid lines are the average and shaded areas represent the standard deviation. 54
Figure 30. Seasonal average time series of minimum 2-m air temperature for historical (black), RCP4.5
(blue), and RCP8.5 (red). Solid lines are the average and shaded areas represent the standard deviation. 54
Figure 31. Monthly averages of precipitation for four time periods for the RCP4.5 (left) and RCP8.5 (right)
simulations. The average of 30 CMIP5 models is indicated by the solid lines and their standard deviations
are indicated by the respective shaded envelopes. Triangle, diamond and square symbols indicate the
percent of models that simulate future minus present changes that are of the same sign and statistically
significant. A two-sided Students t-test is used to establish statistical significance (ρ ≤ 0.05). ................. 55
Figure 32 Wind Rose for Cedar City, UT ................................................................................................... 63
Figure 33 Wind Rose for Milford, UT ........................................................................................................ 64
Figure 34 Wind Rose for Dugway Proving Ground ................................................................................... 67

 8
Figure 35 Wind Rose for the Milford Airport............................................................................................. 68
Figure 36, Wind Rose for the Bryce Canyon Airport ................................................................................. 71
Figure 37, Wind Rose for the Page AZ Airport .......................................................................................... 71
Figure 38 Wind Rose for the Moab Canyonlands Airport .......................................................................... 74
Figure 39, Wind Rose for the Price Airport ................................................................................................ 81
Figure 40 Wind Rose for the Salt Lake Airport .......................................................................................... 88
Figure 41 Wind Rose for the Wendover Airfield ....................................................................................... 89
Figure 42 Wind Rose for Dugway Proving Ground ................................................................................... 89
Figure 43 Wind Rose for the St George Airport ......................................................................................... 92
Figure 44 Wind Rose from the Vernal Airport ........................................................................................... 95

 8
Acronyms
Air Quality Index (AQI), 21 methane (CH4), 30
Air Quality Related Values (AQRVs), 14 National Ambient Air Quality Standards
Air Resource Management Strategy (ARMS), 9 (NAAQS), 9
Ammonia (NH3), 19 National Center for Environmental Information
Annual Greenhouse Gas Index (AGGI), 33 (NCEI), 40
applications for permit to drill (APD), 32 national emission standards for hazardous air
A-weighted noise level (dBA), 27 pollutants (NESHAP), 13
benzene, toluene, ethyl benzene, isomers of National Emissions Inventory (NEI), 19
 xylene (BTEX), 13 National Environmental Policy Act (NEPA), 9,
Bureau of Land Management (BLM), 9 10
carbon dioxide (CO2), 30 National Park (NP), 16
carbon dioxide equivalent (CO2e), 14 nitrogen dioxide (NO2), 11
Carbon monoxide (CO), 11 Nitrogen oxides (NOx), 11
Clean Air Act (CAA), 9 nitrous oxide (N2O), 30
community tolerance level (CTL), 29 Nonattainment Areas (NAA), 17
decibel (dB), 27 ozone (O3), 11
deciview (dv), 25 particulate matter (PM), 11
Deposition Analysis Threshold (DAT), 14 Prevention of Significant Deterioration (PSD), 14
Energy Information Administration (EIA), 35 reference concentrations (RfC), 13
Environmental Protection Agency (EPA), 9 reference exposure levels (REL), 13
Federal Implementation Plan (FIP), 18 Representative Concentration Pathways (RCP),
Federal Land Managers’ Air Quality Related 39
 Values Work Group (FLAG), 11 State Implementation Plans (SIP), 18
Federal Land Policy and Management Act Sulfur dioxide (SO2), 12
 (FLPMA), 10 Toxic Screening Levels (TSLs), 13
Fourth National Climate Assessment (NCA4), 51 Tribal Implementation Plan (TIP), 18
global warming potential (GWP), 30 U.S. Geological Survey (USGS), 31
Greenhouse gases (GHGs), 14 United Nations Framework Convention on
Hazardous air pollutants (HAP), 13 Climate Change (UNFCCC), 30
Intergovernmental Panel on Climate Change Utah Division of Air Quality (UDAQ), 9
 (IPCC), 30 Utah Division of Oil Gas and Mining (UDOGM),
IPCC Fifth Assessment Report (AR5), 30 32
Lead (Pb), 12 Utah State University (USU), 53
maximum achievable control technology volatile organic compounds (VOCs), 11
 (MACT), 13

 8
1. Introduction
The Utah Bureau of Land Management (BLM) has prepared this air monitoring report in accordance with
its 2018 Air Resource Management Strategy (ARMS) (BLM, BLM Utah Air Resource Management
Strategy, 2018), and to compile existing environment conditions for use in impact assessments. The BLM
authorizes activities that can affect air resources by releasing pollutants into the atmosphere. Air monitoring
is an important element of the ARMS. The report assists the BLM in managing air resources by establishing
current conditions and monitoring trends for National Environmental Policy Act (NEPA) analysis.
Additionally, the report is used to promote education, awareness, and transparency of air resources on
public lands. Air pollution does not stop at government or jurisdictional boundaries and engaging the public,
various levels of government, and tribes through cooperative airshed management is a key to protecting air
quality.
 1.1. Updates, additions, and changes from previous report
This section provides a list of updates, additions, and changes to the air monitoring report since the previous
report.
 • Changed the year on the report to be the year the report is published rather than the monitoring
 year.
 • Moved some sections to better organize information in the report.
 • Added information about noise resources to the report.
 • The 2017 Statewide Emissions Inventories (UDAQ, 2019) was made public and replaces the 2014
 Emissions Inventories included in the previous report.
 • Sections 2.4.1 and 2.4.3 from last year’s report were combined as both cover State of Utah air
 quality rules and regulations.
 • Split the climate and greenhouse gases section into two separate sections.
 • Removed the section on drought since information provided in the report can become outdated
 quickly due to changes in large-scale meteorological patterns.
 • Added climate projection information from the 5th Climate Model Intercomparison Program.
 • Added greenhouse gas emissions projections for the oil and gas industry in Utah, based on U.S.
 Energy Information Administration oil and gas production growth projections.
 • Removed section about anticipated information that may be included in next year’s report.
 • Removed list of scientific reports that were published over the last year. New scientific findings
 are now incorporated into the report when relevant.
 • Added an appendix of acronyms.

2. Regulatory analysis
Congress gave the Environmental Protection Agency (EPA) regulatory authority for cleaning up air
pollution. Under the Clean Air Act (CAA), EPA sets limits on certain air pollutants, including setting limits
on how much can be in the air anywhere in the United States. The CAA also gives EPA the authority to
limit emissions of air pollutants coming from sources like chemical plants, utilities, and steel mills (EPA,
2007).
The Utah Division of Air Quality (UDAQ) is responsible to ensure that air in Utah meets health and safety
standards established under the CAA. To fulfil this responsibility, the UDAQ is required by the federal
government to ensure compliance with the EPA’s National Ambient Air Quality Standards (NAAQS)
statewide. Additionally, the state ensures compliance with visibility standards through regional haze rules.
The UDAQ enacts rules pertaining to air quality standards, develops plans to meet the federal standards
when necessary, issues preconstruction and operating permits to stationary sources, and ensures compliance
with state and federal air quality rules (UDAQ, 2020).

 11
EPA’s Tribal Authority Rule gives Tribes the ability to develop air quality management programs, write
rules to reduce air pollution and implement and enforce their rules in Indian Country. While state and local
agencies are responsible for all CAA requirements, Tribes may develop and implement only those parts of
the CAA that are appropriate for their lands (EPA, 2007).
While the EPA, State, and Tribes have regulatory authority to control air pollution emissions, it is the
mission of the BLM to sustain the health, diversity, and productivity of the public lands for the use and
enjoyment of present and future generations. Section 2.1 lists the laws, policy, and guidance that directs
BLM how to achieve this mission with respect to air resources.
 2.1. Regulations and Policy

Clean Air Act
The CAA of 1963 [42 U.S.C. § 1857 et seq.], as amended and recodified [42 U.S.C. § 7401 et seq.] is the
primary Federal legislation and provides the framework for protecting and enhancing the quality of the
Nation’s air resources so as to promote the public health and welfare and the productive capacity of its
population (Section 101(b)(1)). The Act focuses on reducing both criteria air pollutants and hazardous air
pollutants. As required by the CAA, EPA has established NAAQS for criteria pollutants (Section 109
(a)(1)(A)). Compliance and enforcement of these Federal requirements is delegated to applicable Tribal,
State and local regulatory agencies (Sections 107(a), 301(d), 302). The CAA also allows these agencies to
establish regulations which are more, but not less, stringent than the Federal requirement (Section 116)
(EPA, 2007). The BLM has no authority to determine how air quality standards will be achieved nor to
determine area designations.
Federal Land Policy and Management Act
Federal Land Policy and Management Act (FLPMA) of 1976 [43 U.S.C. §§ 1701-1785], often referred to
as the BLM’s “Organic Act,” provides the majority of the BLM’s legislated authority, direction policy, and
basic management guidance. This Act outlines the BLM’s role as a multiple use land management agency
and provides for management of the public lands under principles of multiple use and sustained yield. The
Act directs public lands to be managed “in a manner that will protect the quality of scientific, scenic,
historical, ecological, environmental, air and atmospheric, water resource, and archeological values” (Sec.
102. [43 U.S.C. 1701] (a) (8)). To meet this responsibility, the BLM is to require “compliance with
applicable pollution control laws, including State and Federal air, water, noise, or other pollution standards
or implementation plans” (Sec. 202. [43 U.S.C. 1712] (a)(8)). This means that the BLM can reasonably rely
on compliance with existing air pollution control regulations to insure protection of regulatory air quality
standards (e.g. NAAQS). In addition, BLM can reasonably rely on Federal or delegated State air pollution
control agencies to determine compliance with these regulations, and to enforce these regulatory air quality
standards. FLPMA also gives the BLM authority to halt any BLM authorized activity that is found in
violation of state of Federal air quality regulations, thus ensuring that the BLM can provide compliance
with applicable air quality standards, regulations, and implementation plans (Sec. 302. [43 U.S.C. 1732]
(a)(c)).
National Environmental Policy Act
The National Environmental Policy Act (NEPA) of 1969 [42 U.S.C. 4321 et seq.]: NEPA ensures that
information on the potential environmental and human impact of Federal actions is available to public
officials and citizens before decisions are made and before actions are taken. One of the purposes of the
Act is to “promote efforts which will prevent or eliminate damage to the environment and biosphere,” and
to promote human health and welfare (Section 2). This Act requires that agencies prepare a detailed
statement on the environmental impact of the proposed action for major Federal actions expected to
significantly affect the quality of the human environment (Section 102 (C)). In addition, agencies are
required, to the fullest extent possible, to use a “systematic, interdisciplinary approach” in planning and
decision-making processes that may have an impact on the environment (Section 102(A)).

 12
Additional Guidance
Other guidance and policy are useful for the BLM in managing air resources. While this guidance is not
required by law it can be useful for managing and analyzing air resources. Such guidance includes, but is
not limited to, Council on Environmental Quality guidance on NEPA analysis, the Federal Land Managers’
Air Quality Related Values Work Group (FLAG), BLM Utah ARMS, and BLM Guidance for Conducting
Air Quality General Conformity Determinations (BLM IM2013-025, 2012) (BLM IB 2014-084, 2014).
 2.2. Regulated Values
 2.2.1. Criteria Air Pollutants
The EPA has established NAAQS for six common air pollutants (also known as "criteria air pollutants").
These pollutants are found all over the U.S. Concentrations of air pollutants greater than the national
standards represent a risk to human health and the environment. Criteria pollutants include carbon
monoxide, nitrogen dioxide, ozone, particulate matter, sulfur dioxide, and lead, and are discussed below.
Periodically, the EPA reviews the latest science to ensure that NAAQS appropriately protect human health
and safety and to update the standards when necessary. Indicators for assessing environmental impacts from
criteria air pollutants include emissions (mass per unit of time) and concentrations (mass per volume, or
number of molecules over total molecules).
Carbon Monoxide
Carbon monoxide (CO) is a colorless, odorless gas emitted from combustion processes. The greatest
sources of CO to outdoor air are cars, trucks and other vehicles or machinery that burn fossil fuels. CO can
cause harmful health effects by reducing oxygen delivery to the body's organs (like the heart and brain) and
tissues. At extremely high levels, CO can cause death (EPA, 2018).
Nitrogen Oxides
Nitrogen oxides (NOx) are a group of highly reactive gasses. NOx include nitrogen dioxide (NO2), nitrous
acid, and nitric acid. While EPA’s NAAQS cover this entire group of NOx, NO2 is the component of greatest
interest and the indicator for the larger group of nitrogen oxides. NO2 forms quickly from emissions from
cars, trucks and buses, power plants, and off-road equipment. In addition to contributing to the formation
of ground-level ozone, and fine particle pollution, NO2 is linked with a number of adverse effects on the
respiratory system (EPA, 2018).
Ozone
Ground-level ozone (O3) is a secondary pollutant. It is formed by a chemical reaction between NOx and
volatile organic compounds (VOCs) in the presence of sunlight (photochemical oxidation). Precursor
sources of NOx and VOCs include motor vehicle exhaust, industrial emissions, gasoline vapors, vegetation
emissions (i.e., terpenes), wood burning, and chemical solvents. Abundant solar radiation drives the
photochemical process and creates ground-level O3. Ozone is generally considered a summertime air
pollutant (BLM 2012), but in certain parts of the country has become a wintertime issue due to highly
concentrated precursor pollutants in low level temperature inversions and additional photochemical
reaction from snow reflecting solar radiation back into the atmosphere.
Ozone is a regional air quality issue because, along with its precursors, it can transport hundreds of miles
from its origins, and maximum O3 levels can occur at locations many miles downwind from the sources.
Primary health effects from O3 exposure range from breathing difficulty to permanent lung damage. High
concentrations of ground-level O3 contributes to plant and ecosystem damage (BLM 2012).
Particulate Matter (PM10 AND PM2.5)
Airborne particulate matter (PM) consists of tiny coarse-mode (PM10) or fine-mode (PM2.5) particles or
aerosols combined with dust, dirt, smoke, and liquid droplets. PM2.5 have diameters that are generally 2.5
micrometers or smaller and derive primarily from the incomplete combustion of fuel sources and
secondarily formed aerosols. PM10 have diameters that are generally 10 micrometers or smaller and derive
primarily from crushing, grinding, or abrasion of surfaces. Sources of particulate matter include industrial
processes, power plants, vehicle exhaust, fugitive dust, construction activities, home heating, and fires.

 13
Many scientific studies have linked breathing PM to serious health problems, including aggravated asthma,
increased respiratory symptoms, difficult or painful breathing, chronic bronchitis, decreased lung function,
and premature death. Particulate matter is a major cause of reduced visibility. It can stain and damage stone
and other materials, including culturally important objects, such as monuments and statues (BLM 2012).
Sulfur Dioxide
Sulfur dioxide (SO2) is one of a group of highly reactive gasses known as “oxides of sulfur.” The largest
sources of SO2 emissions are from fossil fuel combustion at power plants (73 percent) and other industrial
facilities (20 percent). Smaller sources of SO2 emissions include industrial processes such as extracting
metal from ore, and the burning of high sulfur containing fuels by locomotives, large ships, and non-road
equipment. SO2 is linked with a number of adverse effects on the respiratory system (EPA, 2018).
Lead
Lead (Pb) is a metal found naturally in the environment as well as in manufactured products. The major
sources of lead emissions have historically been from fuels in on-road motor vehicles (such as cars and
trucks) and industrial sources. As a result of EPA's regulatory efforts to remove lead from gasoline,
emissions of lead from the transportation sector declined by 95% between 1980 and 1999, and levels of
lead in the air decreased by 94% during the same period. Major sources of lead emissions to the air today
are ore and metals processing and piston-engine aircraft using leaded aviation gasoline (EPA, 2018).
National Ambient Air Quality Standards (NAAQS)
NAAQS have been established for the six criteria air pollutants to protect human health and welfare. The
UDAQ is responsible to ensure compliance with the NAAQS within the state of Utah. Table 1 shows current
NAAQS for the EPA designated criteria pollutants (EPA, 2018).
Table 1 Primary Criteria Pollutant NAAQS.
 Primary/ Averaging
 Pollutant Level* Form
 Secondary Time
 Carbon Monoxide 8 hours 9 ppm
 primary Not to be exceeded more than once per year
 (CO) 1 hour 35 ppm
 primary and Rolling 3-
 Lead (Pb) 0.15 μg/m3 Not to be exceeded
 secondary month average
 98th percentile of 1-hour daily maximum
 primary 1 hour 100 ppb
 Nitrogen Dioxide concentrations, averaged over 3 years
 (NO2) primary and
 1 year 53 ppb Annual Mean
 secondary
 primary and Annual fourth-highest daily maximum 8-
 Ozone (O3) 8 hours 0.070 ppm
 secondary hour concentration, averaged over 3 years
 Fine Particulate primary 1 year 12.0 μg/m3 Annual mean, averaged over 3 years
 Matter (PM2.5) secondary 1 year 15.0 μg/m3 Annual mean, averaged over 3 years
 primary and
 24 hours 35 μg/m3 98th percentile, averaged over 3 years
 secondary
 Coarse Particulate primary and Not to be exceeded more than once per year
 24 hours 150 μg/m3
 Matter (PM10) secondary on average over 3 years
 99th percentile of 1-hour daily maximum
 Sulfur Dioxide primary 1 hour 75 ppb
 concentrations, averaged over 3 years
 (SO2)
 secondary 3 hours 0.5 ppm Not to be exceeded more than once per year
 * Units of measure for the standards are parts per million (ppm) by volume, parts per billion (ppb) by volume,
 and micrograms per cubic meter of air (µg/m3).

Volatile Organic Compounds
VOCs are any compound of carbon, excluding carbon monoxide, carbon dioxide, carbonic acid, metallic
carbides or carbonates and ammonium carbonate, which participates in atmospheric photochemical
reactions, except those designated by EPA as having negligible photochemical reactivity (EPA, 2018).

 14
You can also read