Technical Manual 1002 Guidance on Preparing an Air Quality Modeling Protocol - New Jersey Department of Environmental Protection Division of Air ...
←
→
Page content transcription
If your browser does not render page correctly, please read the page content below
New Jersey Department of Environmental Protection
             Division of Air Quality

          Technical Manual 1002

 Guidance on Preparing an Air Quality
         Modeling Protocol

                   May 2021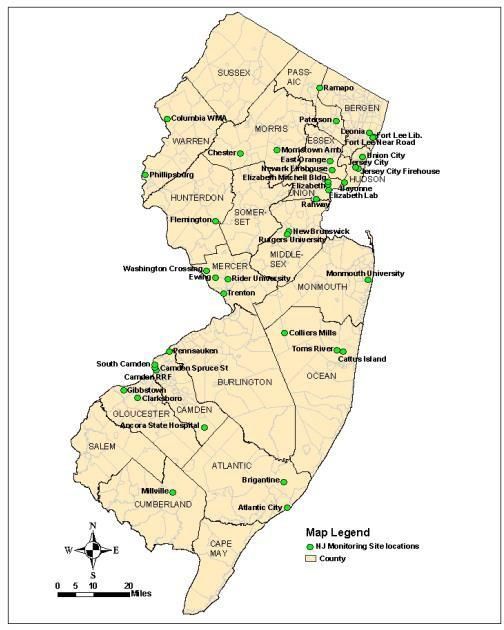
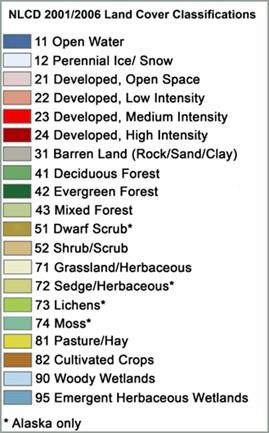
Table of Contents

1.0 Introduction .............................................................................................................................................................1
   1.1          Purpose of Document ...................................................................................................................................1
   1.2          Purpose of an Air Quality Impact Analysis ..................................................................................................2
2.0 Sources Requiring Air Quality Impact Analysis......................................................................................................3
   2.1          New Jersey Regulations and Modeling Analysis .........................................................................................3
       2.1.1        Title V Operating Permits ........................................................................................................................3
       2.1.2        Permits and Certificates for Minor Facilities and Major Facilities without an Operating Permit ............5
   2.2          Sources That Must Conduct a Modeling Analysis .......................................................................................5
   2.3          Netting Analysis and the Requirements for Modeling .................................................................................6
3.0 Regulatory Requirements ........................................................................................................................................7
   3.1          National and New Jersey Ambient Air Quality Standards ...........................................................................7
       3.1.1        National Ambient Air Quality Standards (NAAQS) ...............................................................................7
       3.1.2        New Jersey Ambient Air Quality Standards (NJAAQS) .........................................................................8
   3.2          Modeling Recommendations for Individual Criteria Pollutants...................................................................9
       3.2.1        Federal Recommendations .......................................................................................................................9
       3.2.2        New Jersey Recommendations .............................................................................................................. 10
   3.3          Prevention of Significant Deterioration (PSD) Increments ........................................................................ 10
4.0 Basic Steps of an Air Quality Impact Analysis..................................................................................................... 12
   4.1          Modeling Protocol...................................................................................................................................... 12
       4.1.1        Preliminary (Single-Source) Modeling Protocol ................................................................................... 12
       4.1.2        Multisource Modeling Protocol ............................................................................................................. 13
   4.2          Preliminary (Single-Source) Modeling Analysis ....................................................................................... 13
       4.2.1        Prediction of Insignificant Impact.......................................................................................................... 15
       4.2.2        Prediction of Significant Impact in Attainment Areas ........................................................................... 15
       4.2.3        Prediction of Significant Impact in Nonattainment Areas ..................................................................... 15
   4.3          Multisource Modeling Analysis ................................................................................................................. 16
5.0 Model Selection ..................................................................................................................................................... 18
   5.1          Screening Models ....................................................................................................................................... 18
       5.1.1        CTSCREEN Model................................................................................................................................ 18
       5.1.2        AERSCREEN Model ............................................................................................................................. 19
   5.2          Refined Models .......................................................................................................................................... 19
       5.2.1        AERMOD Model................................................................................................................................... 19
       5.2.2        CALPUFF Model .................................................................................................................................. 19
       5.2.3        CTDMPLUS Model ............................................................................................................................... 20
6.0 Project Description and Site Characteristics .......................................................................................................... 21

                                                                                      i
6.1 Project Overview........................................................................................................................................ 21
6.2 Facility Plot Plan ........................................................................................................................................ 22
6.3 Good Engineering Practice (GEP) Stack Height Analysis ......................................................................... 23
6.4 Urban/Rural Determination ........................................................................................................................ 24
6.4.1 Land Use Analysis ................................................................................................................................. 25
6.4.2 Population Density Procedure................................................................................................................ 27
6.5 Topography ................................................................................................................................................ 27
7.0 Emissions and Source Data ................................................................................................................................... 29
7.1 Emissions ................................................................................................................................................... 29
7.1.1 Partial Load and Startup/Shutdown Emissions ...................................................................................... 30
7.1.2 Fugitive Emissions................................................................................................................................. 30
7.2 Types of Emission Sources ........................................................................................................................ 30
7.2.1 Point Sources ......................................................................................................................................... 30
7.2.2 Area Sources .......................................................................................................................................... 31
7.2.3 Volume Sources ..................................................................................................................................... 31
7.2.4 Roadways and Line Sources .................................................................................................................. 32
7.2.5 Flares ..................................................................................................................................................... 32
8.0 Establish Background Air Quality Concentrations ................................................................................................ 34
8.1 Sources of Background Air Quality Data................................................................................................... 34
8.2 Use of Background Values in the Modeling Analysis ............................................................................... 37
8.2.1 Deterministic NAAQS and NJAAQS .................................................................................................... 37
8.2.2 Statistical Based NAAQS ...................................................................................................................... 37
8.2.2.1 1-Hour NO2..................................................................................................................................................................................................... 37
8.2.2.2 1-Hour SO2...................................................................................................................................................................................................... 38
8.2.2.3 24-Hour and Annual PM2.5.................................................................................................................................................................. 39
9.0 Receptor Network and Meteorological Data ................................................................................................... 41
9.1 Receptor Network ...................................................................................................................................... 41
9.2 Ambient Air ............................................................................................................................................... 41
9.3 Meteorological Data ................................................................................................................................... 42
10.0 Health Risk Assessments and Other Special Modeling Considerations .............................................................. 45
10.1 Health Risk Assessment ............................................................................................................................. 45
10.2 Cooling Towers .......................................................................................................................................... 47
10.3 Coastal Fumigation .................................................................................................................................... 47
10.4 Proximity to Major Sources ....................................................................................................................... 48
10.5 Use of Running Averages and Block Averages ......................................................................................... 48
10.6 Nitrogen Oxide to Nitrogen Dioxide Conversion ...................................................................................... 48
10.7 Treatment of Horizontal Stacks and Rain Caps.......................................................................................... 50
11.0 Air Quality Modeling Results .......................................................................................................................... 52
11.1 Modeling Submitted in Support of a New Jersey Air Permit Application ................................................. 52
ii11.2 PSD Permit Applications ........................................................................................................................... 52
11.3 Documentation ........................................................................................................................................... 53
12.0 References ....................................................................................................................................................... 54
APPENDIX A ............................................................................................................................................................. 56
Additional Issues for PSD Affected New or Modified Sources................................................................................... 56
APPENDIX B .............................................................................................................................................................. 67
Example Air Quality Analysis Checklist ..................................................................................................................... 67
APPENDIX C .............................................................................................................................................................. 69
Odor Modeling Procedures .......................................................................................................................................... 69
List of Tables
2-1 Major Facility Thresholds 4
2-2 Significant Net Emissions Increase Thresholds-------------------------------------------------- 4
3-1 National Ambient Air Quality Standards --------------------------------------------------------- 7
3-2 New Jersey Ambient Air Quality Standards------------------------------------------------------ 8
3-3 PSD Allowable Increments 11
4-1 Class I and Class II Area Significant Impact Levels ------------------------------------------- 14
4-2 Significant Air Quality Impact Levels for Increases in
Ambient Air Concentrations in Nonattainment Areas ----------------------------------------- 16
6-1 Identification and Classification of Land Use --------------------------------------------------- 25
7-1 Point Source Emission Input Data for NAAQS Compliance Demonstration -------------- 29
7-2 Suggested Procedures for Estimating σyO and σzO --------------------------------------------------------------------32
8-1 List of Pollutants Monitored at Each Site -------------------------------------------------------- 35
9-1 ASOS Meteorological Stations 43
10-1 Risk Management Guideline for Air Toxics ---------------------------------------------------- 47
A-1 Significant Monitoring Concentrations ---------------------------------------------------------- 56
A-2 Soils and Vegetation Screening Values ---------------------------------------------------------- 60
A-3 PSD Class I Significant Impact Levels and PSD Increments --------------------------------- 63
C-1 Conversion Factors for Peak-To-Mean Ratio --------------------------------------------------- 71
C-2 Published Odor Thresholds 72
iiiList of Figures
6-1 Correlation of USGS Land Cover Classifications with Auer Land Use Types ------------ 26
8-1 Locations of NJDEP Air Monitoring Sites ------------------------------------------------------ 36
9-1 Location of ASOS Meteorological Stations ----------------------------------------------------- 44
A-1 Required Receptor Locations in Brigantine Division of the E.B. Forsythe
National Wildlife Refuge 66
ivLIST OF ACRONYMS
The following are acronyms used in Technical Manual 1002.
amsl Above mean sea level
APC Air Pollution Control
AQRV Air Quality Related Value
BID Buoyancy-induced Dispersion
BPIPPRM Building Profile Input Program with the Plume Rise Model
CAA Clean Air Act
CFR Code of Federal Regulations
CMSA Consolidated Metropolitan Statistical Area
DAQ Division of Air Quality
DEM Digital Elevation Model
Department New Jersey Department of Environmental Protection
FLM Federal Land Manager
GEP Good Engineering Practice
HAP Hazardous Air Pollutant
ISC3 Industrial Source Complex (Version 3)
ISR In-stack ratio
MCHISRS Model Clearinghouse Information Storage and Retrieval System
MSA Metropolitan Statistical Area
NAAQS National Ambient Air Quality Standard
NJAAQS New Jersey Ambient Air Quality Standard
NJDEP New Jersey Department of Environmental Protection
NED National Elevation Dataset
N.J.A.C. New Jersey Administrative Code
NO2 Nitrogen dioxide
NWS National Weather Service
PM10 Particulate matter having an aerodynamic diameter less than or equal to a
nominal 10 micrometers
PM2.5 Particulate matter having an aerodynamic diameter less than or equal to a
nominal 2.5 micrometers
ppb Parts per billion
ppm Parts per million
PSD Prevention Significant Deterioration
SCRAM Support Center for Regulatory Atmospheric Modeling
SIA Significant Impact Area
SMC Significant Monitoring Concentration
SO2 Sulfur dioxide
TEOM Tapered element oscillating microbalance
TSP Total Suspended Particulates
USEPA United States Environmental Protection Agency
µg/m3 Micrograms per cubic meter
USGS United States Geological Survey
vvi
1.0 Introduction
1.1       Purpose of Document

Air dispersion modeling is the primary analytical tool for assessing air quality impacts from new
or modified pollution sources when time, expenses and coverage limit the use of ambient air
measurement. The New Jersey Department of Environmental Protection (NJDEP) Division of
Air Quality (DAQ) has produced this Technical Manual (Manual) to provide modeling guidance
for predicting the ambient air quality impact of emissions from stationary sources. This Manual
addresses modeling issues for a wide range of source types and regulatory modeling
requirements, such as Prevention of Significant Deterioration (PSD). It is intended for use by
permit applicants and their consultants who need to conduct ambient impact analyses in support
of air permit applications and other activities that require air quality impact modeling.

This Manual is not intended to describe the implications of modeling results. Such implications
are generally controlled by relevant state and federal regulations, laws, and guidance documents.
This Manual is not intended to provide an all-inclusive description of the requirements of a
modeling analysis because each modeling analysis is unique. There can be many variations in
source configuration and operating characteristics and differences in geography and climate from
one modeling application to another. There is no one single model or methodology that can
assess all the conceivable modeling situations. The purpose of this Manual is to provide a
general framework for how the modeling analysis should be conducted, and to promote
technically sound and consistent modeling techniques while encouraging the use of improved
and more accurate techniques as they become available.

Individuals responsible for conducting the air quality impact analyses should, at a minimum, be
familiar with the following United States Environmental Protection Agency (USEPA)
documents:

      •   Appendix W to 40 CFR Part 51 – Guideline on Air Quality Models

      •   AERMOD Implementation Guide, EPA-454/B-16-013

      •   AERMOD User’s Guide, EPA-454/B-16-011

      •   AERSURFACE User’s Guide, EPA-454/B-08-001 (Revised 01/16/2013)

      •   AERMET User’s Guide, EPA-454/B-16-010

      •   Guideline for Determination of Good Engineering Practice Stack Height (Technical
          Support Document for the Stack Height Regulations), EPA-450/4-80-023R

      •   Additional guidance from the USEPA Support Center for Regulatory Atmospheric
          Modeling (SCRAM) at http://www.epa.gov/scram/ . Within SCRAM is the Model
          Clearinghouse Information Storage and Retrieval System (MCHISRS) at
          http://cfpub.epa.gov/oarweb/MCHISRS . It is a database of Model Clearinghouse

                                                1
memoranda addressing the interpretation of modeling guidance for specific regulatory
applications.
As stated above, each modeling analysis is unique. Therefore, applicants should work closely
with the modeling staff at the Department to ensure that all modeling requirements are met. The
contact phone number is (609) 292-6722. Additional information can be obtained from the air
quality permit program’s webpage: http://www.nj.gov/dep/aqpp/ . Note that the results of air
dispersion modeling are used as inputs to risk assessment. New Jersey Technical Manual 1003
entitled “Guidance on Preparing a Risk Assessment for Air Contaminant Emissions” addresses
the preparation of risk assessments and is available on the Department’s webpage
http://www.state.nj.us/dep/aqpp/techman.html .
1.2 Purpose of an Air Quality Impact Analysis
An air quality impact analysis is used to establish compliance with the National Ambient Air
Quality Standards (NAAQS), the New Jersey Ambient Air Quality Standards (NJAAQS), and
the PSD allowable increments. An air quality impact analysis may also be required for:
• Assessing whether a source is causing “air pollution,” which is defined under New Jersey
Administrative Code (N.J.A.C.) Title 7 Chapter 27 Subchapter 5 (7:27-5) as the presence
in the outdoor atmosphere of one or more air contaminants in such quantities and
duration as are, or tend to be, injurious to human health or welfare, animal or plant life or
property, or would unreasonably interfere with the enjoyment of life or property. This
type of analysis usually involves a risk assessment (carcinogenic and non-carcinogenic
health effects) or an odor impact evaluation (see Appendix C, Odor Modeling
Procedures).
• Assessing Air Quality Related Values (AQRV), such as visibility, soils and vegetation
impacts that would occur as a result of the source, and general commercial, residential,
industrial and other growth associated with the source, as required by 40 CFR 52.21(o) of
the PSD regulations. This analysis should not only address impact on visibility, soils and
vegetation for the Brigantine Division of the Edwin B. Forsythe National Wildlife Refuge
Class I area, but also evaluate impacts to Class II areas that have a significant commercial
and recreational value.
22.0 Sources Requiring Air Quality Impact Analysis
2.1 New Jersey Regulations and Modeling Analysis
The New Jersey regulations that address the issue of air quality modeling are found in the
N.J.A.C. 7:27-8 (Permits and Certificates for Minor Facilities and Major Facilities without an
Operating Permit), 18 (Emission Offset Rules), and 22 (Operating Permits).
2.1.1 Title V Operating Permits
Most sources that will need to submit modeling analysis in support of their permit applications
will be those sources requiring a Title V operating permit. N.J.A.C. 7:27-22.8 sets forth the
requirements for submitting a modeling analysis for the following types of permit applications or
modifications: (1) a new major source requesting an initial Title V permit; (2) a significant
modification to an existing major facility; (3) or a minor modification to an existing major
facility.
Though there are four scenarios listed in N.J.A.C. 7:27-22.8(a) that require modeling analysis as
part of a Title V permit application or modification, only three of the principal concerns are
described in more detail below.
1. 22.8(a)1 - The criteria for determining whether an application is subject to the PSD air
quality impact analysis requirements can be found in 40 CFR Part 52.21(m). (Attainment)
2. 22.8(a)2 - An application is subject to the air quality impact analysis requirements set
forth at N.J.A.C. 7:27-18.4 if it is proposing an emissions increase, based on potential to
emit, that exceeds any of the major facility thresholds listed in Table 2-1 for at least one
pollutant. An air quality impact analysis must be conducted for an existing major facility
proposing a net emissions increase exceeding the thresholds listed in Table 2-2 below, as
determined pursuant to N.J.A.C. 7:27-18.7. (Nonattainment)
Additionally, Total Suspended Particulates (TSP) is not in Table 2-2 because the
Department assumes that if the NAAQS for particulate matter equal to or less than 10
microns (PM10) and the particulate matter equal to or less than 2.5 microns (PM2.5) are
met, then the TSP NJAAQS will also be met.
The USEPA November 17, 2016 Memo titled Draft PM2.5 Precursor Demonstration
Guidance requires that sulfur dioxide (SO2), oxides of nitrogen (NOx), VOC, and
ammonia must be evaluated in the development of all PM2.5 nonattainment area State
Implementation Plans. While New Jersey is currently attaining PM2.5 NAAQS, the
Department may require applicants to address VOC and ammonia as PM2.5 precursors.
3Table 2-1. Major Facility Thresholds
Air Contaminant Threshold Value
(tons/yr)
SO2 100
SO2 (as PM2.5 precursor) 100b
TSP 100
PM10 100
PM2.5 100a
CO 100
NOx 25
NOx (as PM2.5 precursor) 100b
VOC 25
Pb 10
a. This value reflects 40 CFR Part 51 Appendix S guidance.
b. Per revision to N.J.A.C. 7:27-18, adoption published in November 6, 2017 New Jersey Register.
Table 2-2. Significant Net Emissions Increase Thresholds
Air Contaminant Significant Net Emissions Increase
(tons/yr)
SO2 40
SO2 (as PM2.5 precursor) 40b
PM10 15
PM2.5 10a
NOx 25
NOx (as PM2.5 precursor) 40b
CO 100
Pb 0.6
a. This value reflects 40 CFR Part 51 Appendix S guidance.
b. Per revision to N.J.A.C. 7:27-18, adoption published in November 6, 2017 New Jersey Register.
3. 22.8(a)4 - New and modified sources at major facilities with operating permits may need
to submit a health risk assessment if they emit certain contaminants regarded as air
toxics. Air toxics are natural or man-made pollutants that when emitted into the air may
cause an adverse health effect (see section 10.0 for health risk assessment modeling
recommendations). The federal 1990 Clean Air Act (CAA) Amendments created a list of
air toxics, called “hazardous air pollutants” or “HAPs”, as well as regulations to limit
HAP emissions. Air toxics that must be evaluated are listed on the NJDEP Division of
Air Quality Risk Screening Worksheet (Worksheet), which can be accessed at
http://www.state.nj.us/dep/aqpp/risk.html . The Worksheet evaluates HAPs, as well as
other air toxics, such as hydrogen sulfide and ammonia. Sources that require further
review per the Department’s risk screening procedures must conduct air quality
modeling, which applies site specific parameters to the assessment. The health risk
screening procedures are described in New Jersey Technical Manual 1003 (Guidance on
Preparing a Risk Assessment for Air Contaminant Emissions) and can be downloaded
from the Department’s air quality permitting program technical manual webpage at
http://www.state.nj.us/dep/aqpp/techman.html .
42.1.2 Permits and Certificates for Minor Facilities and Major Facilities without an
Operating Permit
The criteria for submission of a modeling analysis for minor facilities and major facilities
without an operating permit are specified in N.J.A.C. 7:27-8.5 (Air Quality Impact Analysis).
N.J.A.C. 7:27-8.5(a)1 and 2 are identical to the criteria for Title V operating permits set forth at
N.J.A.C. 7:27-22.8(a)1 and 2, respectively. As is the case with N.J.A.C. 7:27-22.8(a)4, most
sources affected by N.J.A.C. 7:27-8.5(b) will be those that require further review per the
Department’s risk screening procedure due to their emissions of air toxics, as listed in the
Worksheet. N.J.A.C. 7:27-8.5(a)4 is a catchall condition for permit applications that the
Department believes may cause or contribute to a violation of an ambient air quality standard or
a PSD increment, or pose a threat to public health or welfare, but are not subject to modeling
pursuant to any other criteria.
2.2 Sources That Must Conduct a Modeling Analysis
As required by 40 CFR Part 52, N.J.A.C. 7:27-8, and N.J.A.C. 7:27-22, an air quality modeling
analysis must be conducted under the following scenarios:
1. Applications subject to PSD air quality impact analysis requirements per 40 CFR Part
52.21(m) (see Appendix A for more details).
2. Applications for a new major source or an existing minor source proposing an emission
increase that exceeds the major source thresholds listed in Table 2-1 for at least one
pollutant. An air quality impact analysis must be conducted for each pollutant whose
proposed net emissions increase exceeds the thresholds listed in Table 2-2.
3. Applications for an existing major facility (allowable emissions above the levels in Table
2-1 for at least one pollutant) must conduct an air quality impact analysis for those
pollutants whose proposed net emissions increase exceed the thresholds listed in Table 2-
2.
4. Applicants that submit an APC permit where the Department’s risk screening procedure
indicates that further evaluation is required due to their emissions of air toxics.
5. The Department may request modeling in other unique circumstances. For instance,
circumstances could involve a permit application at a new or existing major facility that
the Department believes may cause or contribute to a violation of an ambient air quality
standard or a PSD increment, or pose a threat to public health or welfare. For example, if
a proposed increase in the hourly emission rate of a criteria pollutant is of sufficient
magnitude that, in combination with the source’s stack height, it may cause or contribute
to a violation of a short-term ambient air quality standard or a PSD increment, modeling
may be required even though the annual emissions increase may not be significant.
Another example is a minor facility with insufficient annual emissions to meet the major
facility threshold values in Table 2-1, but has a proposed emission increase and stack
5parameters that suggest high air impacts. In this case, a new source proposing emissions
of 80 tons per year of PM10 would likely need to be modeled.
2.3 Netting Analysis and the Requirements for Modeling
A netting analysis is sometimes performed pursuant to N.J.A.C. 7:27-18 when obtaining an air
permit for a new or modified source. By accounting for creditable emissions reductions, the net
emissions increase at a facility for a pollutant may be reduced below levels outlined in the
Emissions Offset Rule. The methodology for calculating the net emissions increase at a facility
is described in N.J.A.C. 7:27-18.7 (Determination of a net emissions increase or a significant net
emissions increase).
A netting analysis can reduce the emissions increase at the facility below the significant net
emissions increase threshold for which an air quality impact analysis is required. An exemption
from performing a modeling analysis can be requested in such a situation. The exemption
request may be denied if the Department believes that the reduction in ambient air concentrations
from the emissions decrease will not be sufficient to prevent the proposed emissions increase
from causing or contributing to a violation of an ambient air quality standard or a PSD
increment, or posing a threat to public health or welfare. Proposed emission increases from a
source located near complex terrain, near the property boundary line of the facility, in an area
where elevated background air concentrations exist, or a stack subject to building downwash are
examples of situations where a requested exemption from modeling may be denied.
While the air dispersion modeling is dependent upon the netting analysis as described by
N.J.A.C. 7:27-18.7, it is a separate regulatory demonstration. When modeling a source for which
a netting analysis has been conducted, an applicant should include not only the proposed
emissions increases, but also the creditable emissions reductions at the source. Please note that
the modeling of negative nitrogen dioxide (NO2) emissions should only be done after
consultation with the USEPA Regional Office to ensure that decreases are not overestimated.
63.0 Regulatory Requirements
The permit applicant must demonstrate compliance with the federal and the New Jersey air
quality regulations. Below is a summary of the applicable regulatory requirements that are
related to air quality modeling procedures and results.
3.1 National and New Jersey Ambient Air Quality Standards
3.1.1 National Ambient Air Quality Standards (NAAQS)
Congress enacted the 1970 Clean Air Act (CAA) to protect the health and welfare of the public
from the adverse effects of air pollution. Subsequently, the USEPA established National
Ambient Air Quality Standards (NAAQS) for six criteria pollutants: sulfur dioxide (SO2),
particulate matter (PM10 and PM2.5), nitrogen dioxide (NO2), carbon monoxide (CO), ozone (O3),
and lead (Pb). The NAAQS include both “primary” and “secondary” standards and are
periodically updated to reflect the latest scientific findings. The primary standards are intended
to protect human health with an adequate margin of safety; whereas the secondary standards are
intended to protect public welfare from any known or anticipated adverse effects associated with
the presence of air pollutants, such as damage to materials or vegetation. Both the primary and
the secondary standards must be addressed in the modeling evaluation. Table 3-1 “National
Ambient Air Quality Standards” lists these primary and secondary standards.
Table 3-1. National Ambient Air Quality Standards
Averaging Primary Secondary
Pollutant Perioda NAAQSb NAAQSb
3
1-hour 100 ppb (188 μg/m ) ---
NO2 3 3
Annual 53 ppb (100 μg/m ) 53 ppb (100 μg/m )
3
1-hour 35 ppm (40,000 μg/m ) ---
CO 3
8-hour 9 ppm (10,000 μg/m ) ---
3
1-hour 75 ppb (196 μg/m ) ---
SO2 3
3-hour --- 0.5 ppm (1,300 μg/m )
3 3
PM10 24-hour 150 μg/m 150 μg/m
3 3
24-hour 35 μg/m 35 μg/m
PM2.5 3 3
annual 12 μg/m 15 μg/m
Ozone 8-hour 0.070 ppm 0.070 ppm
3 3
Lead Rolling 3-month 0.15 μg/m 0.15 μg/m
a. Short-term standards for 3-hour SO2 and 1- and 8-hour CO are not to be exceeded more than once per
year. The 3-month lead and annual NO2 standards are never to be exceeded. The 1-hr NO2 standard is
the 98th percentile of the yearly distribution of 1-hour daily maximum concentrations averaged over 3
years. The 1-hr SO2 standard is the 99th percentile of the yearly distribution of 1-hour daily maximum
concentrations averaged over 3 years. The 24-hr PM10 standard is not to be exceeded more than once per
year over 3 years. The 24-hr PM2.5 standard is the 98th percentile of the maximum averaged over 3 years,
and the annual PM2.5 standards are annual means averaged over 3 years.
7b. The actual form of each standard is listed first. The values in parentheses are approximations provided
for convenience.
3.1.2 New Jersey Ambient Air Quality Standards (NJAAQS)
New Jersey Ambient Air Quality Standards (NJAAQS) are listed in Table 3-2. The differences
between the New Jersey and the National standards are as follows:
• New Jersey maintains a 12-month and a 24-hour secondary standard for SO2;
• New Jersey maintains 12-month and 24-hour primary and secondary standards for Total
Suspended Particulates (TSP);
• New Jersey has no standards for PM2.5 and PM10; and
• New Jersey regulations specify its 3-hr, 8-hr, and 24-hr standards in terms of moving or
non-overlapping running hourly averages, and its 3-month and 12-month standards in
terms of moving or non-overlapping running monthly averages.
Table 3-2. New Jersey Ambient Air Quality Standards
Averaging Primary Secondary
Pollutant Perioda NJAAQSb NJAAQSb
3 3
NO2 12-Month 100 μg/m (0.05 ppm) 100 μg/m (0.05 ppm)
3 3
1-hour 40 mg/m (35 ppm) 40 mg/m (35 ppm)
CO 3 3
8-hour 10 mg/m (9 ppm) 10 mg/m (9 ppm)
3
3-hour --- 1,300 μg/m (0.5 ppm)
3 3
SO2 24-hour 365 μg/m (0.14 ppm) 260 μg/m (0.10 ppm)
3 3
12-Month 80 μg/m (0.03 ppm) 60 μg/m (0.02 ppm)
3 3
24-hour 260 μg/m 150 μg/m
TSP 3 3
12-Month 75 μg/m 60 μg/m
Ozone 1-hour 0.12 ppm 0.08 ppm
3 3
Lead 3-month 1.5 μg/m 1.5 μg/m
a: All short-term (1-hr, 3-hr, 8-hr, and 24-hr) standards except ozone are not to be exceeded more than once
per 12-month period. 3-month and 12-month standards are never to be exceeded. All averages are
calculated as running or moving averages. The 12-month TSP standards are geometric means.
b: The actual form of each standard is listed first. The values in parentheses are approximations provided
for convenience.
83.2 Modeling Recommendations for Individual Criteria Pollutants
3.2.1 Federal Recommendations:
Guidance on how to demonstrate compliance with the NAAQS is given in 40 CFR 51 Appendix
W Section 9.2.3 (NAAQS and PSD Increments). The following is additional guidance on
demonstrating NAAQS compliance for specific pollutants.
NO2
The 1-hour NO2 NAAQS is a probabilistic standard. Compliance is demonstrated as the 98th
percentile of the 1-hour daily maximum concentration averaged over 3 years, which is equivalent
to the 8th highest of the annual distribution of the daily maximum 1-hour concentrations averaged
over five years. If three years of prognostic meteorological data are modeled, then the 8th highest
of the annual distribution of the daily maximum 1-hour NO2 concentrations is averaged over
three years. And, finally, if one year of site-specific meteorological data is modeled, simply the
8th highest of the daily maximum 1-hour concentrations should be used for comparison to the
NAAQS.
The following USEPA guidance memorandums provide additional information for
demonstration with the 1-hour NO2 standard: Clarification on the Use of AERMOD Dispersion
Modeling for Demonstrating Compliance with the NO2 National Ambient Air Quality Standard
(dated September 30, 2014), and Additional Clarification Regarding Application of Appendix W
Modeling Guidance for the 1-Hour NO2 National Ambient Air Quality Standard (dated March 1,
2011).
Ozone and Secondarily Formed Particulate Matter
A modeling analysis showing compliance of an individual source with the ozone NAAQS is
generally not required. Draft guidance for assessing secondary impacts was provided in the
USEPA memorandum, Guidance on the Development of Modeled Emission Rates for Precursors
(MERPs) as a Tier 1 Demonstration Tool for Ozone and PM2.5 under PSD Permitting Program
(dated December 2, 2016).
PM2.5
Major PM2.5 sources or major modifications (as defined by the USEPA) should follow the
USEPA Implementation of the New Source Review Program for Particulate Matter Less Than
2.5 Micrometers, Final Rule (May 16, 2008 Federal Register) and 40 CFR Part 51, Appendix S,
for nonattainment compliance demonstrations. Additional guidance for demonstrating
compliance with the PM2.5 NAAQS and PSD Increments is provided in the USEPA
Memorandum Guidance for PM2.5 Permit Modeling (dated May 20, 2014).
PM10
The 24-hour PM10 NAAQS is a probabilistic standard. The standard is not to be exceeded more
than once per year over an average of 3 years. When multiple years are modeled, they
collectively represent a single period. Thus, if five years of NWS data are modeled, then the
highest sixth highest concentration for the whole period becomes the design value.
9SO2
The 1-hour SO2 NAAQS is a probabilistic standard. Compliance is demonstrated as the 99th
percentile of the 1-hour daily maximum concentration averaged over 3 years, which is equivalent
to the fourth highest of the annual distribution of daily maximum 1-hour concentrations averaged
over five years. Just as in evaluating the 1-hour NO2 impact concentrations, if three years of
prognostic meteorological data are modeled, then the 4th highest of the annual distribution of the
daily maximum 1-hour SO2 concentrations is averaged over three years. And, finally, if one year
of site-specific meteorological data is modeled, simply the 4th highest of the daily maximum 1-
hour SO2 concentrations should be used for comparison to the NAAQS.
The following USEPA guidance memorandums provide additional information for
demonstration with the 1-hour SO2 standard: Guidance Concerning the Implementation of the 1-
hour SO2 NAAQS for the Prevention of Significant Deterioration Program (dated August 23,
2010), and Additional Clarification Regarding Application of Appendix W Modeling Guidance
for the 1-Hour NO2 National Ambient Air Quality Standard (dated March 1, 2011).
Lead
On October 15, 2008, USEPA revised the lead NAAQS from 1.5 µg/m3 based on calendar
quarters to 0.15 µg/m3 based on a rolling 3-month average.
3.2.2 New Jersey Recommendations:
Many of the NJAAQS are identical to the NAAQS. However, the New Jersey rules specify its
3-hr, 8-hr, and 24-hr standards in terms of moving or running hourly averages, and its 3-month
and 12-month (annual) standards in terms of moving or running monthly averages. The NAAQS
are defined in terms of blocked averages, both for short-term (24-hours or less) and annual
averages. For example, when demonstrating compliance with a 24-hour NAAQS, pollutant
concentrations are calculated from midnight to midnight the next day. When demonstrating
compliance with a 24-hour NJAAQS, pollutant concentrations are calculated from midnight to
midnight, from 1 a.m. to 1 a.m. the next day, from 2 a.m. to 2 a.m. the next day, etc.
Initially, compliance with the NJAAQS can be based on use of block averages (similar to the
NAAQS). However, if the modeled impact based on blocked averages with representative
background concentration added exceeds 90% of the NJAAQS, compliance must then be based
on the running hourly and monthly averages for that pollutant and averaging time.
As with the ozone NAAQS, single-source ozone modeling to demonstrate compliance with the
ozone NJAAQS usually is not required due to the lack of modeling tools. Modeling of a
source’s total suspended particulate (TSP) impact generally is not required because the
Department assumes that if the PM10 and PM2.5 NAAQS are met, then the TSP NJAAQS will
also be met.
3.3 Prevention of Significant Deterioration (PSD) Increments
10The proposed emission increases from all new or modified PSD applicable sources must not
cause or contribute to an exceedance of a PSD allowable increment. The PSD allowable
increments for Class I and Class II areas are listed in Table 3-3.
Table 3-3. PSD Allowable Increments
Averaging Allowable Increments (µg/m3)
Pollutant Period Class I Area Class II Area
3-hr 25 512
SO2 24-hr 5 91
Annual 2 20
24-hr 8 30
PM10
Annual 4 17
24-hr 2 9
PM2.5
Annual 1 4
NO2 Annual 2.5 25
For any averaging period, other than an annual period, the maximum predicted increase may
exceed the allowable increment once per year at any one location. The federal guidance on how
compliance with the PSD increments is determined is found in 40 CFR 51 Appendix W Section
9.2.3, NAAQS and PSD Increments. A discussion of the additional requirements in the air
quality impact assessment for a PSD permit is presented in Appendix A.
114.0 Basic Steps of an Air Quality Impact Analysis
There are up to three major components in an air quality impact analysis – modeling protocols,
preliminary (single-source) modeling, and multisource modeling analysis. Each component is
described in the following sections.
4.1 Modeling Protocol
4.1.1 Preliminary (Single-Source) Modeling Protocol
In accordance with N.J.A.C. 7:27-8.5(d), 18.4(c), and 22.8(c), a modeling protocol must be
submitted and approved in advance by the Department before the air quality impact analysis
and/or a risk assessment is conducted. These regulations specify that the protocol address all
relevant general and site-specific factors and how the air quality impact analysis and/or risk
assessment will be conducted. N.J.A.C. 7:27-8.5(d), 18.4(c), and 22.8(c) all reference this
document and Technical Manual 1003 (Guidance on Preparing a Risk Assessment for Air
Contaminant Emissions) for guidance on preparing a modeling protocol.
The protocol should document in detail the methods the applicant proposes to conduct the
modeling analysis and present the results. The protocol must be received and approved by the
Department before a modeling analysis can be conducted and submitted. The Department will
not accept a modeling analysis that was performed without a pre-approved protocol.
In general, a modeling protocol should contain the following information:
• Project Description, including a project overview, facility plot plan, emissions, stack
parameters, and special operating and load scenarios, if necessary;
• Project Site Characteristics, including a land use analysis, attainment status, description
of the local topography, a Good Engineering Practice (GEP) stack height analysis, and
the meteorological data proposed for use in the modeling analysis;
• Regulatory Requirements, including a description of what federal and New Jersey
regulations and guidelines apply to the proposed project;
• Proposed Air Quality Analysis, including the proposed air quality model selection and
justification for use, screening analysis, and the proposed methods for refined modeling.
• Special Modeling Considerations, including the approach for addressing Class I area
modeling, such as the effects on soils and vegetation/growth analysis, near field and long-
range visibility, cooling tower modeling, coastal fumigation, health risk assessment,
fugitive emissions, deposition and odor modeling (see Appendix C, Odor Modeling
Procedures), if necessary;
• Establishing Background Air Quality, including justification of the background air
quality monitoring data to be used in the analysis; and
12• Presentation of Air Quality Modeling Results, including how maximum impacts,
significant impact areas, and compliance with ambient air quality standards and PSD
increments will be demonstrated.
Appendix B of this document contains a summary checklist that can be used to assess the
completeness of an air quality modeling protocol and analysis. The Department recommends
that this checklist be reviewed by the applicant before the documents are submitted to the
Department. The modeling protocol should be submitted at the same time the air permit
application is sent to the Department. The permit engineer assigned to the project should be
informed that a modeling protocol has been submitted to the Department. The Department will
not review protocols until an air permit application is received by the Department. Paper copies
of modeling protocols and analyses should be sent to:
Chief, Air Quality Permitting
NJDEP, Division of Air Quality
P.O. Box 420 Mailcode 401-02
401 East State Street, 2nd Floor
Trenton, NJ 08625
4.1.2 Multisource Modeling Protocol
As discussed in Section 4.3 of this chapter, a multisource modeling analysis may be necessary if
preliminary single-source modeling shows that the proposed source has a significant impact. In
this situation, the applicant should submit an additional protocol known as a multisource
modeling protocol. A multisource modeling protocol should be submitted and approved by the
Department before an applicant conducts multisource modeling of nearby sources. The
multisource modeling protocol should include how the multisource inventory was generated,
information on the sources included in the multisource modeling, and the modeling methodology
that would be employed in the multisource analysis. The same air quality models and
meteorological data used in the preliminary (single-source) modeling of the proposed source are
normally used for the multisource analysis.
4.2 Preliminary (Single-Source) Modeling Analysis
The preliminary modeling analysis evaluates only the emissions from proposed new sources, or
the net emissions increase from a proposed modification.
Per PSD and New Source Review provisions in the 1990 Clean Air Act, one of the principal
functions of the preliminary modeling analysis is to determine whether emissions from proposed
new sources or the net emissions from a proposed modification will increase ambient
concentrations of that pollutant by more than the significant impact levels listed in Table 4-1.
The highest modeled pollutant concentration for each pollutant’s NAAQS and NJAAQS
averaging time is used to determine whether a source will have a significant impact, except for 1-
hr NO2, 1-hr SO2, 24-hr PM2.5, and annual PM2.5, where at least a 3-year average of the modeled
pollutant concentrations will be used to determine the significant impact.
13When modeling a facility for which a netting analysis has been performed, the source’s proposed
emissions increases should be modeled first to determine if they will cause a significant impact.
If pollutants and averaging times from the proposed emissions increase are predicted to have
significant impact, additional refined modeling may be conducted to account for the effect of the
creditable emissions reductions at the facility. In this modeling analysis, the proposed emissions
increases should be modeled as positive emissions and the creditable emissions reductions at the
facility modeled as negative emissions.
The possibility of a significant impact in a Class I area must also be examined if the source
requires a PSD permit and is located within 100 kilometers (km) of a Class I area. In addition, if
the source is located within a 100 km of Class I area, a Class I increment demonstrated must be
included. PSD sources with large emissions that are located further than 100 km from a Class I
Area may need to examine their impact on the Class I area; This determination is made on a
case-by-case basis. Furthermore, all PSD source applicants should contact the Fish and Wildlife
Office in Denver, Colorado to determine if special Air Quality Related Values Analysis is
required for their new source or modification. Contact information is listed in Appendix A.
The only Class I area in or within 100 km of New Jersey is the Brigantine Division of the Edwin
B. Forsythe National Wildlife Refuge (see Figure A-1). If refined modeling shows that the
proposed PSD source has a significant impact in this Class I area, a multisource modeling
analysis is necessary to determine PSD increment consumption at the Class I area and possible
effects on its Air Quality Related Values (AQRVs). Further guidance on conducting a Class I
visibility and other AQRVs analyses is given in Appendix A.
Table 4-1. Class I and Class II Area Significant Impact Levels
Pollutant Averaging Significant Impact Levels (µg/m3)
Period Class I Area Class II Area
1-hour --- 7.8a
SO2 3-hr 1.0 25
24-hr 0.2 5
Annual 0.1 1
NO2 1-hour --- 10b
Annual 0.1 1
CO 1-hr --- 2,000
8-hr --- 500
PM2.5a 24-hr 0.27c 1.2
Annual 0.05c 0.2d
PM10 24-hr 0.3 5
e
Annual 0.2 1
a
Pb 3-month --- 0.01
st
a. Maximum of 5-year average 1 highest maximum concentration.
b. NESCAUM interim significance level as maximum 1st high concentration (April 21, 2010 document);
USEPAhas recommended 4ppb (~7.5 µg/m3) as maximum of 5-year average 1st highest maximum
concentration.
c. Revised 24-hour and annual PM2.5 Class I SIL per April 17, 2018 EPA guidance memo..
d. Revised annual PM2.5 Class II SIL of 0.2 µg/m3 per April 17, 2018 EPA guidance memo...
e. Annual PM10 SILs are listed because annual increments still required.
144.2.1 Prediction of Insignificant Impact
When the significant impact levels (SILs) for each applicable pollutant at each applicable
averaging time are not exceeded, a multisource modeling analysis is usually not necessary.
There are circumstances when the reviewing authority (e.g., NJDEP and/or USEPA) may require
multisource modeling even if the predicted source impacts are less than the SILs (i.e., predicted
total impacts are within a significant impact level value of the NAAQS, and specifically for
PM2.5 modeling). For PSD permits, the applicant is required to demonstrate that allowable PSD
increments are not being consumed by way of multisource modeling. See Section 3.3 of this
document for additional information. Please note that the applicant must always demonstrate
compliance with the NAAQS and NJAAQS by adding the applicable background concentrations
to the appropriate modeled concentrations.
4.2.2 Prediction of Significant Impact in Attainment Areas
If predicted impacts are above the significant impact levels in an attainment area, then a
multisource modeling protocol as described in Section 4.1.2 and a multisource modeling analysis
as described in Section 4.3 will be required, and the project’s Significant Impact Area (SIA)
must be calculated. The SIA is a circular area with a radius extending from the source to the
most distant point where approved dispersion modeling predicts a significant ambient impact
will occur. The SIA should be determined for each pollutant and averaging period that has been
assigned a significant impact level.
4.2.3 Prediction of Significant Impact in Nonattainment Areas
The requirements of N.J.A.C. 7:27-18 (Emission Offset Rule) for Lowest Achievable Emission
Rate (LAER) and emission offsets will apply to the emissions of a criteria pollutant if the facility
is in an area that is in nonattainment for that criteria pollutant and the permit application is
subject to N.J.A.C. 7:27-18 pursuant to N.J.A.C. 7:27-18.2 for that criteria pollutant (discussed
in Section 2.1.1 and Tables 2-1 and 2-2 of this document). In addition, a permit application can
be subject to the LAER and offset requirements of N.J.A.C. 7:27-18 for a given criteria pollutant
when the facility is in an area that is in attainment for that criteria pollutant and the following
occurs:
1. The permit application is subject to N.J.A.C. 7:27-18 for that criteria pollutant and the
proposed net emissions increase would result in an increase in the ambient concentration
of the criteria pollutant in an area that is in nonattainment for that criteria pollutant; and
2. The increase in the ambient concentration of the criteria pollutant is equal to or exceeds
the significant air quality impact level specified in Table 4-2.
Thus, in some cases, the preliminary modeling analysis must include an evaluation of the permit
application’s proposed net emissions increase on any nearby nonattainment areas. All areas in
the State are designated as attainment for NO2, CO, TSP, PM2.5, PM10, and lead.
15Table 4-2. Significant Air Quality Impact Levels for Increases in
Ambient Air Concentrations in Nonattainment Areas*
Averaging Time
Pollutant
Annual 24-Hour 8-Hour 3-Hour 1-Hour
SO2 3 3 3
1.0 µg/m 5 µg/m - 25 µg/m -
3 3
TSP 1.0 µg/m 5 µg/m - - -
NO2 3
1.0 µg/m - - - -
3
CO - - 500 µg/m - 2000 µg/m3
Pb - 0.1 µg/m3 - - -
3 3
PM-10 1.0 µg/m 5 µg/m - - -
* Per N.J.A.C. 7:27-18.4
The following areas are currently designated as nonattainment areas for New Jersey for the
following criteria pollutants:
Ozone
The entire state is classified as nonattainment for the 8-hr ozone standard (2008, 75 ppb), with
the New York-Northern New Jersey-Connecticut area classified as moderate and the
Philadelphia-Wilmington-Atlantic City area classified as marginal.
SO2
New Jersey is classified as nonattainment with the 1971 SO2 standard of 0.5 ppm for portions of
Warren County that include the following: the Township of Belvidere, the Township of
Harmony, portions of Liberty Township (south of UTM coordinate N4522 and west of UTM
coordinate E505), portions of Mansfield Township (west of coordinate E505), the Township of
Oxford, and the Township of White.
4.3 Multisource Modeling Analysis
When the impact from the proposed source or modification is significant in an attainment area, a
comprehensive assessment of air quality is obtained by performing a multisource modeling
analysis. The multisource modeling includes not only the facility obtaining the permit, but the
contribution from other nearby major sources as well as representative air monitoring data.
Those major sources that are located within or near the SIA of the proposed source or
modification should be included in the multisource modeling analysis. As mentioned earlier, if
the proposed source’s air quality impact requires a multisource modeling, the applicant must
submit a multisource modeling protocol for approval prior to performing the modeling analysis.
A major source is generally considered to be a facility with the potential to emit 100 or more tons
per year of the subject pollutant (0.6 ton per year or more for lead) and is located within or near
the SIA of the proposed source or modification. However, other sources with the potential to
emit less than 100 tons per year may need to be included in the modeling if they are located
within or near the SIA. For example, other sources emitting greater than 25 tons per year of NO2
and located within the SIA should be investigated for multisource modeling if the applying
source has a significant 1-hour NO2 impact. For applicants requiring a PSD permit, “near” is
16You can also read