Investigating the Effect of Sentiment in High-Frequency Financial Markets
←
→
Page content transcription
If your browser does not render page correctly, please read the page content below
School of Computer Science and Statistics

Investigating the Effect of Sentiment
in High-Frequency Financial Markets

                    Darragh Mc Kay
                       13318094

                       May 4, 2018

         Supervisor: Professor Khurshid Ahmad

      A Dissertation submitted in partial fulfilment
         of the requirements for the degree of
             MAI (Computer Engineering)
Declaration
I hereby declare that the following dissertation, except where otherwise stated, is entirely my
own work; that it has not previously been submitted as an exercise for a degree, either in
Trinity College Dublin, or in any other University; and that the library may lend or copy it or
any part thereof on request.
I have read and I understand the plagiarism provisions in the General Regulations of the
University Calendar for the current year, found at http://www.tcd.ie/calendar.
I have also completed the Online Tutorial on avoiding plagiarism ‘Ready Steady Write’, located
at http://tcd-ie.libguides.com/plagiarism/ready-steady-write.
Signed: Date:
iSummary
The aim of this dissertation is to investigate the relationship between sentiment extracted
from social media data and returns in financial time series at a firm-level for different time
frequencies, in particular examining its effect at high-frequency. In doing so it leverages
computational linguistics to automatically generate a domain-specific affect dictionary from
a corpus of tweets for the purpose of domain-specific sentiment analysis. Furthermore, this
dissertation aims to investigate the difference in the relationship between sentiment extracted
from social media and formal media.
Sentiment analysis is the identification and categorisation of opinions expressed in a piece of
text with the aim of determining the writer’s feelings toward a particular topic, product or firm
through the use of natural language processing, text analysis and computational linguistics.
A popular application of sentiment analysis is the analysis of the expectation of the price
of a financial asset based on the sentiment expressed about the asset. Thus, sentiment
analysis often plays an important role in high-frequency trading (HFT) algorithms which aim
to forecast the movement of stock prices at an incredibly high-frequency based on many
external variables, including sentiment.
To reach the research goals firm-specific Twitter data was collected over a 6 month period, for
analysis. The resulting tweets were aggregated at different frequencies and negative sentiment
values were calculated based on the text in the tweets using the Rocksteady affect analysis
system. Similarly, a financial time series for the same period was acquired and logarithmic
returns were calculated. The resultant time series were then aggregated and aligned by
date and time and examined using four different vector autoregressive (VAR) models, which
individually examine the independent effect of different exogenous variables such as negative
sentiment and media volume on financial returns.
An analysis of approximately 360,000 tweets about Ryanair, the focus of the case study,
collected between October 17th , 2017 and April 2018 found that negative sentiment plays a
small role in explaining returns of an asset. It shows that the explanatory power of sentiment
varies at different frequencies and is highest at a daily frequency due to the aggregation of
sentiment throughout the day and because changing volatility across the 6-month period made
it difficult to model at high-frequency. However, a week-by-week analysis found that negative
sentiment is indeed significant during certain weeks and is most significant during periods of
consistent volatility. It shows strong significance when volatility is consistently high such as
during a threat of strike action and also when it is consistently low such as the period leading
up to Christmas.
A comparison of sentiment in formal media versus sentiment in social media found that it
is easier to extract sentiment from formal media such as news articles and newswires due
iito their formal language and larger volume of text. However, negative sentiment extracted
from formal media was not significant in the vector autoregressive models examined but a
first-order lag of article volume was. This suggests that article volume could be used as a
proxy for investor sentiment instead.
Future research will be carried out into the investigation of when and why high-frequency
sentiment is significant, by further analysing its effect on shorter time periods and by varying
the conditions. If sentiment is to be used as part of a high-frequency trading strategy it
would need to be possible to determine when to take sentiment into account and how much
influence it should have. In addition, this work focused mostly on a firm-specific analysis in
the commercial airline industry. It would be interesting to determine whether the results are
consistent with other firms in the commercial airline industry, and how much they might differ
in another industry altogether.
iiiAbstract
High-frequency trading (HFT) is a financial trading strategy that is growing in popularity
among major trading firms. At the turn of the 21st century, HFT trades had an execution
time of several seconds, whereas by 2010 this had decreased to milli- and even microseconds.
This recent growth in HFT is paralleled by a massive increase in user-generated social media
data, where every day hundreds of thousands of opinions are shared in the form of discussion,
reviews and social media statuses. This research aims to leverage the rapid growth in social
media, specifically Twitter, to investigate the effect of sentiment in high-frequency financial
markets.
This thesis presents a system that automatically retrieves and aggregates firm-specific Twitter
data for the purpose of sentiment analysis. Leveraging computational linguistics, it computes
a domain-specific affect dictionary from the corpus of tweets for use during sentiment analysis.
It then extracts a negative sentiment time series using the Rocksteady affect analysis system at
a daily, 5-minute and 1-minute frequency. The resultant time series are then aggregated with
firm-specific financial stock returns at their respective frequencies. Finally, the time series are
examined using four different vector autoregressive (VAR) models, which individually examine
the independent effect of different sentiment variables on returns.
The analysis of the system, using Ryanair as a case study, found that sentiment extracted from
social media, specifically Twitter, plays a small but significant role in explaining the returns of
an asset but its explanatory power varies at different frequencies. The research shows that the
VAR models fit better at a daily frequency than at high-frequency due to the volatile nature
of the time series. However, a week-by-week analysis shows that high-frequency sentiment
extracted from tweets contributes significantly to modelling the returns in certain situations,
in particular during periods of consistent volatility. Thus, negative sentiment found in tweets
can be very appropriate for use in high-frequency trading strategies but the circumstances
under which it is significant need to be thoroughly examined in future work.
ivAcknowledgements
I would like to thank a number of people who have made this dissertation possible. First, I
would like to sincerely thank my supervisor Professor Khurshid Ahmad for introducing me to
the topic of sentiment analysis and financial markets as well as for all his help, guidance and
valuable time throughout the project. I would also like to include a special note of thanks to
all those involved with the Master’s programme at Trinity College Dublin, in both the
Engineering department and Computer Science department. In particular, Dr Mike Brady,
MAI coordinator in the Department of Computer Science.
I am also very grateful for all the help and encouragement I received from my friends and
classmates over the years, in particular, I would like to thank Sid Gupta for his support and
advice both in conducting the research and during the writing of the dissertation.
Finally, I would like to express my sincere gratitude to my family for their advice and endless
encouragement in my academic endeavours, without them this dissertation would certainly
not have been possible.
vContents
1 Introduction 1
1.1 Sentiment Analysis . . . . . . . . . . . . . . . . . . . . . . . . . . . . . . . 1
1.2 High-Frequency Sentiment Analysis . . . . . . . . . . . . . . . . . . . . . . 2
1.3 Twitter . . . . . . . . . . . . . . . . . . . . . . . . . . . . . . . . . . . . . 3
1.4 Research Objectives . . . . . . . . . . . . . . . . . . . . . . . . . . . . . . 3
1.5 Key Findings . . . . . . . . . . . . . . . . . . . . . . . . . . . . . . . . . . 4
1.6 Dissertation Structure . . . . . . . . . . . . . . . . . . . . . . . . . . . . . 4
2 Motivation and Existing Work 5
2.1 Media Volume . . . . . . . . . . . . . . . . . . . . . . . . . . . . . . . . . 5
2.2 Sentiment Analysis of Tweets . . . . . . . . . . . . . . . . . . . . . . . . . 6
2.3 Large-scale Sentiment Analysis . . . . . . . . . . . . . . . . . . . . . . . . 7
2.4 Sentiment Analysis Methods . . . . . . . . . . . . . . . . . . . . . . . . . . 8
2.5 Twitter-Specific Text Analysis . . . . . . . . . . . . . . . . . . . . . . . . . 9
3 Method 11
3.1 Data Retrieval . . . . . . . . . . . . . . . . . . . . . . . . . . . . . . . . . 11
3.1.1 Social Media Data Retrieval . . . . . . . . . . . . . . . . . . . . . . 11
3.1.2 Formal media Data Retrieval . . . . . . . . . . . . . . . . . . . . . 12
3.1.3 Financial Data Retrieval . . . . . . . . . . . . . . . . . . . . . . . . 13
3.2 Data Preprocessing . . . . . . . . . . . . . . . . . . . . . . . . . . . . . . 14
3.2.1 Language Detection . . . . . . . . . . . . . . . . . . . . . . . . . . 14
3.2.2 Tweet Corpus Export . . . . . . . . . . . . . . . . . . . . . . . . . 14
3.3 Content Analysis . . . . . . . . . . . . . . . . . . . . . . . . . . . . . . . . 14
3.3.1 Automatic Affect Dictionary Creation . . . . . . . . . . . . . . . . . 15
3.3.2 Sentiment Analysis . . . . . . . . . . . . . . . . . . . . . . . . . . . 16
3.4 Statistical Analysis . . . . . . . . . . . . . . . . . . . . . . . . . . . . . . . 17
4 Evaluation and Case Study 22
4.1 Ryanair Holdings PLC . . . . . . . . . . . . . . . . . . . . . . . . . . . . . 22
4.2 Text Data . . . . . . . . . . . . . . . . . . . . . . . . . . . . . . . . . . . 25
vi4.3 Correlation . . . . . . . . . . . . . . . . . . . . . . . . . . . . . . . . . . . 28
4.4 Volatility . . . . . . . . . . . . . . . . . . . . . . . . . . . . . . . . . . . . 30
4.5 Impact of Sentiment on Returns . . . . . . . . . . . . . . . . . . . . . . . . 32
4.6 Week-by-Week Analysis . . . . . . . . . . . . . . . . . . . . . . . . . . . . 36
4.7 Comparison of Formal Media and Social Media . . . . . . . . . . . . . . . . 39
5 Discussion 42
5.1 System Strengths and Limitations . . . . . . . . . . . . . . . . . . . . . . . 42
5.2 Results . . . . . . . . . . . . . . . . . . . . . . . . . . . . . . . . . . . . . 43
5.3 Conclusion . . . . . . . . . . . . . . . . . . . . . . . . . . . . . . . . . . . 45
viiList of Figures
3.1 An overview of the system implementation consisting of the three main compo-
nents; data retrieval and preprocessing, content analysis and statistical analysis
. . . . . . . . . . . . . . . . . . . . . . . . . . . . . . . . . . . . . . . . . 12
3.2 System diagram of the text analysis component that outputs a sentiment time
series from a corpus of structured text . . . . . . . . . . . . . . . . . . . . 15
4.1 Ryanair All Time Share price (light blue line) and Trade Volume (dark blue
bars) (n=5235) . . . . . . . . . . . . . . . . . . . . . . . . . . . . . . . . 24
4.2 Ryanair 1 Year Share price (light blue line) and Trade Volume (dark blue bars)
(n=312) . . . . . . . . . . . . . . . . . . . . . . . . . . . . . . . . . . . . 24
4.3 Ryanair Daily Returns over 10 years (n=2519) . . . . . . . . . . . . . . . . 25
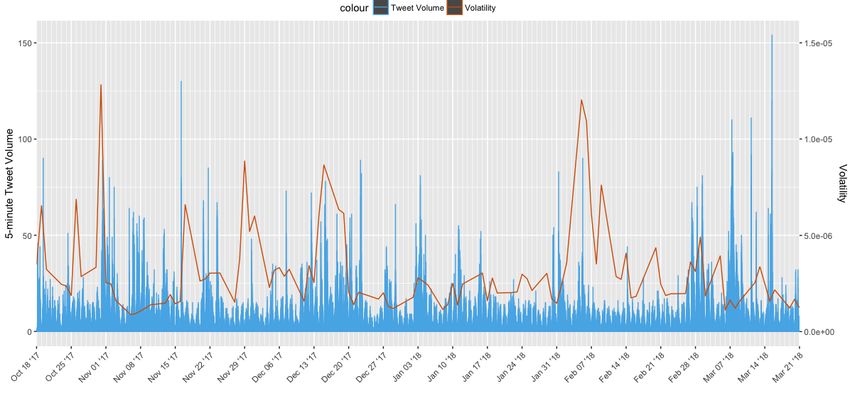
4.4 Intraday Volatility (orange, n=106) vs 5-minute tweet volume (blue, n=8184)
between October 17th 2017 and April 2017 . . . . . . . . . . . . . . . . . . 31
4.5 Intraday Volatility (orange) vs daily tweet volume (blue) between October 17th
2017 and April 2017 (n=106) . . . . . . . . . . . . . . . . . . . . . . . . . 32
4.6 Estimates of significant coefficients for lagged returns, αt , after analysis of
Model M2 on a rolling weekly basis . . . . . . . . . . . . . . . . . . . . . . 37
4.7 Estimates of significant coefficients for lagged returns, βt , after analysis of
Model M2 on a rolling weekly basis . . . . . . . . . . . . . . . . . . . . . . 38
4.8 Estimates of significant coefficients after analysis of Model M2 on a rolling
weekly basis, and N, the number of observations per period . . . . . . . . . 38
viii1 Introduction
The widespread adoption of the Internet, in recent years, has changed the way people
express their views and opinions. More than ever before, people are expressing themselves
online through blog posts, online discussion forums, product review websites and social
media sites. Through the analysis of this data, the general opinion of a product, company,
brand or public personality can be established. However, the amount of user-generated
content is much too large for a user to analyse, so to automate this various sentiment
analysis techniques can be employed. A recent, and growing, application of such sentiment
analysis techniques is mining micro-blogging data to forecast stock market behaviour, often
at high-frequency, which has yielded promising results[1, 2, 3]. Such systems are based on
the argument that a financial model that accounts for investor sentiment and media
attention can potentially be used to predict stock market variables such as returns, volatility
and volume. Investor sentiment is the view or opinion that is held or expressed by an
investor, in particular, it is the belief about future cash flows and investment risks that are
not justified by the facts at hand[4]. A common proxy for investor sentiment is sentiment
extracted from traditional media such as articles from financial news sources including the
Financial Times and Bloomberg. However, a new form of proxy for investor sentiment is
spontaneous sentiment harvested from high-frequency social media sites such as Twitter.
Spontaneous sentiment is the opinion or view that is expressed as a result of a sudden
impulse or inclination, without premeditation. This type of sentiment surfaces faster than
that which is published by news sources and traditional media, allowing for high-frequency
analysis. With 1/60th of the world’s population on Twitter, accounting for over 330 million
monthly active users, publishing more than half a billion tweets every day[5], Twitter has
emerged as the perfect source of high-frequency sentiment.
1.1 Sentiment Analysis
Sentiment analysis is the identification and categorisation of opinions expressed in a piece of
text, with the aim of determining the writer’s feelings toward a particular topic, product or
firm through the use of natural language processing, text analysis and computational
1linguistics. Sentiment analysis tools have proven particularly useful in applications such as
marketing, reputation management and financial analysis. Typically sentiment analysis tools
examine a large collection of text, often in real time, to make decisions about the writer’s
affect towards the topic in question. Such collections could include formal media such as
news articles and newswires, press releases, blogs - both personal and corporate, online
forums and message boards, online product reviews or social media streams such as Twitter
and Facebook.
The sentiment of a piece of text can be expressed numerically in several ways. The simplest
of which is a linear scale between -1 and 1 where -1 is entirely negative, 0 is neutral and 1 is
entirely positive. A more complex representation of sentiment is a 3-dimensional vector of
polarity, strength and activeness. Polarity measures how negative or positive the text is,
strength measures how strong or weak it is, and activeness measures whether it is active or
passive.
1.2 High-Frequency Sentiment Analysis
A recent application of sentiment analysis is the analysis of the expectation of the price of a
financial asset based on the sentiment expressed about the asset. Typically, asset price
dynamics are investigated based on quantitative data using historical prices and other
variables such as sentiment and media-attention. Sentiment analysis in financial markets is
most frequently used by large financial and trading institutions such as Virtu Financial,
Tradebot and Citadel LLC to perform automated high-frequency trades. Such algorithmic
trading systems aim to forecast the movement of stock prices at an incredibly high-frequency
based on many external variables, including sentiment. High-frequency trading (HFT) is
characterised by high speeds, high turnover rates, and high order-to-trade ratios with very
short-term investment horizons, aiming to capture sometimes a fraction of a cent in profit
on every trade. At the turn of the 21st century, HFT trades had an execution time of several
seconds, whereas by 2010 this had decreased to milli- and even microseconds[6].
This recent growth in HFT requires high-frequency sentiment analysis, among other things.
Traditionally sentiment analysis is performed on formal media such as newspapers and online
articles but the rate of publication of such media is not high-frequency and thus can not
contribute to high-frequency sentiment analysis. However, the widespread adoption of social
media sites and abundance of user-generated content published through such sites allows for
automated high-frequency information monitoring[7]. Recent estimates indicate one in five
tweets discuss products or brands[8], which makes Twitter an incredibly effective and
abundant source of high-frequency sentiment.
21.3 Twitter
Twitter is one of the most popular micro-blogging services which allows users to publish
short messages with up to 280 characters (previously 140 characters before November
2017). Such messages are called tweets. Tweets are visible on a public message board, via
twitter.com, Twitter’s mobile applications and various other third-party applications. Twitter
allows users to follow (subscribe to) a selection of their favourite authors/friends or search
for tweets containing a specific keyword or hashtag. A hashtag, (e.g., ‘#earnings’) is a
token, included in many tweets, that allows users to associate that tweet with a relevant
topic or category. This allows such tweets to be more easily discovered. Similarly, traders
have adopted the convention of tagging stock-related messages with a dollar sign followed
by the relevant ticker symbol (e.g. ‘$RYAAY’). These are commonly known as cashtags.
Twitter treats cashtags exactly like hashtags in terms of categorising tweets.
When a user publishes a tweet it appears in the timeline’s of all of the users who follow the
user, in reverse chronological order (i.e. most recent first). A given user, UserB can retweet
a particular tweet of UserA which prepends ‘RT’ to the tweet and UserA’s username,
prefixed with the ‘@’ symbol, and publishes the tweet to the followers of UserB. This
(potentially dramatically) increases the visibility of the original tweet and can lead to the
viral spread of content, information and thus sentiment. Finally, a given user can mention
another user by specifying the username of a user (prefixed with a ‘@’ symbol) in the body
of a tweet. This directs the tweet to the mentioned user, but it still appears in the timelines’
of all users who follow the original publisher.
1.4 Research Objectives
The aim of this dissertation is to investigate the relationship between sentiment extracted
from social media data and returns in financial time series at a firm-level for different time
frequencies, in particular examining its effect at high-frequency. It aims to do this leveraging
computational linguistics to automatically generate a domain-specific affect dictionary from
a corpus of tweets for the purpose of domain-specific sentiment analysis. The primary
objective is to determine whether high-frequency sentiment has an effect on asset prices or
vice-versa and to investigate how that effect changes at different frequencies. The research
further aims to determine the relationship between the volume of trades and the volume of
social media data, and whether that correlates to volatility in returns. Finally, this
dissertation aims to investigate the difference in the relationship between sentiment
extracted from social media data and formal media. This work does not attempt to predict
market prices through sentiment, but simply assesses the role of sentiment in explaining
3returns, and/or the role of returns in explaining sentiment at different frequencies.
To achieve these goals, firm-specific Twitter data is collected over a 6 month period, for
analysis. The resulting tweets are aggregated at different frequencies and negative sentiment
values are calculated based on the text in the tweets. Similarly, a financial time series for the
same period is acquired and logarithmic returns are calculated. Vector autoregression is used
to determine the relationship between the financial time series and the sentiment time series,
and that relationship is analysed at different frequencies to meet the research objectives
outlined above.
1.5 Key Findings
The results found that the vector autoregressive models fit better at a daily-frequency than
high-frequency due to the volatile nature of the time series. The changing volatility across
the 6-month analysis period made it difficult to model at high-frequency. However, a
week-by-week analysis shows that high-frequency sentiment extracted from tweets
contributes significantly to modelling the returns in certain situations, in particular during
periods of consistent volatility. Furthermore, the sentiment found in formal media was
insignificant across a 10-year analysis but it was found that previous day article volume could
act as a proxy for investor sentiment instead. Further research will be carried out to examine
the exact conditions for which high-frequency sentiment is significant.
1.6 Dissertation Structure
This thesis begins by outlining the motivation of the research, in the context of existing
work in the field (Chapter 2). It provides an account of previous academic research in the
area, describing and discussing existing solutions. This is followed by a discussion of the
research methods and the approach taken to evaluate the effect of sentiment at different
frequencies (Chapter 3). This discusses the methodology and the rationality for the design
choices made, outlining in detail, both the systems used to collect and analyse the data. It
then presents a case study of Ryanair Holdings PLC (Ryanair) by examining the financial
history of Ryanair, and the effect social media had in forecasting its stock price behaviour
(Chapter 4). This includes the presentation of the findings of the study. Finally, it follows
with a discussion of the results and the strengths, weaknesses and limitations of the
approach before concluding by describing the implications of the research, and outlining
recommendations for further research (Chapter 5).
42 Motivation and Existing Work
Using public data to proxy investor sentiment for the purpose of stock price prediction is not
a new concept and whether stock returns can be predicted has long been a debate. This
chapter presents existing work in the field of sentiment analysis, behavioural finance and
content analysis and outlines the motivation behind the research objectives and the methods
employed to reach those objectives.
Early research based on the Efficient Market Hypothesis (EMH) argues that stock returns
are indeed random and cannot be predicted[9]. However, there is a small, but notable set of
related work that shows that new information, especially news, has a major influence on
stock returns and quickly leads to stock price changes[10, 11]. Behavioural finance shows
that high negative tone expressed in the media in relation to a particular firm causes
investors to rationally revise downwards their estimates of fundamental firm value[11]. This
work extracted sentiment from a corpus of over 5.5 million news articles on 20 large US
firms over a 10 year period to determine the relation between media-expressed firm-specific
sentiment and firm-specific returns. It found that, at times, media-expressed tone had a
significant impact on firm-specific returns, and that in some instances the impact endured,
confirming that media-comment can contain both sentiment and news.
Similar work shows that alternative measures of sentiment such as the US-based Michigan
Consumer Sentiment Index (MSCI) have a strong correlation with the financial markets,
which suggests that consumers anticipate changes in the wider economy through feelings
and emotions[12]. The same research shows that the frequency of negative affect words in
news articles, over a given period, accounts to statistically significant changes in the Danish
Consumer Index and in the value of stocks of individual companies.
2.1 Media Volume
Other research has investigated the relationship between the volume of media-attention on a
firm-specific level and the firm-specific returns of stock’s trading levels. These works aim to
prove the concept that ‘No news is good news’. There are arguments that traffic volume on
5internet message boards is correlated with major changes in stock prices[13] and that stock
prices fluctuate unpredictably just before and after macroeconomic announcements such as
GDP, inflation rates and the release of financial reports. It is argued that a proxy for this
uncertainty could be the volume of firm-specific articles, posts on internet message boards,
newswires or indeed tweets on Twitter. Corea shows that the posting volume on Twitter
about specific firms has a greater forecasting power when augmented into the existing
models[14]. Not only did it have a strong impact on price forecasting but also a directional
prediction, which suggests that it is indeed more valuable to consider how much people talk
about a firm rather than what they think about it. Similarly, Oliveira et al. found a positive
correlation between tweets posting volume and stock market variations[1] and Alanyali et al.
found a positive correlation between the number of mentions of a company in the Financial
Times and its stock’s trading volume[15].
2.2 Sentiment Analysis of Tweets
As mentioned above, recent work has begun using Twitter data to proxy investor sentiment.
Tweets differ from traditional news articles because they are constrained to 280 characters
(previously 140) which encourage users to be brief and get to the point[16]. This makes it a
good platform to foster the sharing of emotion[17]. As Twitter is a social network,
information can spread quickly or slowly depending on the reach of the author, i.e. how
many followers the user has. Sul et al. found that firm-level sentiment that spreads rapidly
through social media is more likely to be quickly incorporated into stock prices while
sentiment that spreads more slowly takes longer to be incorporated and thus is more useful
in predicting stock prices in future days[18]. The research showed that sentiment in tweets
from users with fewer than 171 followers (the median number), and which were not
retweeted, had the greatest impact on future stock returns. This shows that the network
effect has a significant effect on stock returns. Other methods, such as machine
learning[19], have been used to extract sentiment from tweets and again has found it to be
productive of stock returns several days later. Corea also examined the effect a user’s reach
had on tweets by taking the users Klout Score[20] into account[14]. The Klout Score is a
number between 1-100 that represents a user’s influence. The more influential they are, the
higher their Klout Score. Intuitively a user with a high influence (Klout Score) would affect
the opinion of more investors than a user with low-influence. The study found that the
Klout Score was significant when used in the financial model of stock returns which implies
that a user’s reach has an effect on the impact of their sentiment.
To date, almost all of the work which extracts sentiment scores from Twitter data to model
stock returns has examined only certain users or considered only users which are considered
6financially literate. Corea et al. examine the minute-by-minute sentiment of tweets and only
includes tweets which contain the companies stock exchange ticker symbol. The investment
community, when discussing financial news on Twitter, have adopted to tagging
stock-related tweets with a dollar sign followed by the firm’s ticker symbol i.e. $GOOG .
Both [14] and [18] have limited its analysis to tweets which have adopted this convention, as
a way of limiting the user base to financially literate users. Arguably this limitation excludes
a large number of users that may be expressing sentiment, both positive or negative. The
effect of including the larger population into the analysis has not yet been studied in detail.
Future work should examine the impact of the sentiment of ‘financially illiterate’ users in
financial models. Influential people, in the context of social-media, such as Rihanna or Kylie
Jenner, while considered financially illiterate can have a huge effect on the financial markets.
It is claimed that one tweet made by Kylie Jenner, an American reality television personality,
model and social media personality, in which she casually claimed to no longer use Snapchat,
caused the share price of Snap Inc. (SNAP) to fall by almost 8%, a total market loss of
$1.3bn[21]. While Snapchat’s stock-price was falling prior to her tweet, it almost certainly
caused the remaining landslide. The tweet was published to her 24.5 million followers, liked
over 375,000 times and retweeted over 75,000 times. Similarly, singer/songwriter Rihanna
published a story on her Instagram account criticizing an offensive advertisement that was
published on Snapchat in which she was personally mentioned. Her remark sent SNAP stock
down nearly 4%, decreasing its market value by nearly $800 million[22]. These examples
show that even ‘financially illiterate’ users, can have a massive effect on stock prices due to
their social impact. Further research can be done in this field, as the impact of social media
personalities grows, starting with the inclusion of ‘financially illiterate’ users.
2.3 Large-scale Sentiment Analysis
Behavioural finance literature argues that there is a need to create a system that can mine
sentiment in large volumes of multi-modal (and perhaps multi-lingual) data and aggregate it
with financial and economic data. It argues that traditional prediction methods have failed
in recent years. If you examine some of the elections of the last 5 years in the USA and the
UK, the results returned have not always been anticipated, sometimes by very wide margins.
Traditionally, opinion pollsters have told us what the public thinks about a political party, or
leader and its policies. These pollsters have suffered significant criticism as of late due to
their inaccurate predictions. This suggests that it is more important in how a leader or party
is perceived than their specific policies or intentions. This same argument can be applied to
stock markets as of recent. Due to the increased accessibility of the stock market to the
general public and the increase in availability of news sources, the opinion of investors is
perhaps more significant in modelling the return of an asset than before. Arguably, this
7sentiment is only calculable through mining large volumes of spontaneous high-frequency
sentiment perhaps in combination with traditional news sources.
2.4 Sentiment Analysis Methods
As previously mentioned, sentiment analysis of text is typically performed on news articles,
which often consists of several (mostly) grammatically correct paragraphs of text providing
plenty of context. Performing sentiment analysis on shorter texts, such as single sentences,
as found in reviews or tweets is challenging because of the limited contextual
information[23], the presence of emoticons, slang words and often intentional
misspellings[24]. Preethi et al. explore the use of Recursive Neural Networks (RNN) within a
deep learning system for the sentiment analysis of short online reviews. The resulting system
increased the accuracy of the sentiment analysis compared to previous methods, such as
knowledge base techniques. Sentiment analysis can be performed using two strategies, a
Knowledge Base approach or a Machine Learning approach. A knowledge base approach
requires a dataset of predefined emotions for terms and an efficient knowledge
representation for identifying sentiments. A machine learning approach develops a sentiment
classifier that classifies sentiments using a training set[24]. This approach does not require a
predefined database of emotions and is thus simpler than knowledge base techniques.
There are several different approaches to knowledge base techniques. Turney used a
bag-of-words approach for sentiment analysis in which the relationships between individual
words are not considered[25]. The sentiment of every word is calculated and the document’s
sentiment score is an aggregation of the value for each word. The lexical database,
WordNet[26], was used by Kamps et al. to determine the emotional content of a word along
different dimensions[27]. WordNet is a lexical database of English words, where nouns,
verbs, adjectives and adverbs are grouped into sets of cognitive synonyms. Kampes et al.
developed a distance metric based on WordNet and determined the semantic orientation
(positive or negative) of adjectives. It becomes clear that the knowledge base approach is
difficult due to the requirement of a huge lexical database. As twitter consists of a huge
amount of data, with content spanning many domains sentiment analysis using knowledge
base techniques becomes tedious and erroneous[24].
In contrast, machine learning techniques don’t depend on such a database. Techniques such
as Naive Bayes (NB), Maximum Entropy (ME) and Support Vector Machines (SVM) are
used to classify the input feature vectors into corresponding classes of sentiment. Many
features exist, including Term Presence, Term Frequency, negation, n-grams and
Part-of-Speech[28]. It is argued that Naive Bayes works well for certain problems when used
with highly dependent features[29]. A new model was introduced by Niu et al. in which
8efficient approaches are used for feature selection, weight computation and classification[30].
Using the Bayesian algorithm, classifier weights are adjusted by making use of a
representative feature and a unique feature. A ‘Representative feature’ is one which the
information represents a class, whereas a ‘Unique feature’ is one which the information helps
distinguish the class. The probability of each classification is calculated using those weights,
improving the Bayesian algorithm.
Another system, developed by Barbosa et al. consists of a 2-stage automatic sentiment
analysis method for classifying tweets as subjective or objective, after which they are further
classified as positive or negative[31]. A probability model based on the user’s influence to
determine sentiment analysis in tweets was proposed by Wu et al.[32]. For each tweet that
contains an @username in the body, it is considered to have an influencing action and it
contributes to influencing probability. Similarly, any tweet that begins with @username is
considered a retweet, representing an influenced action, contributing to the influenced
probability. The study found a strong correlation between these probabilities.
The Rocksteady system, used in this project, depends on a lexical database or set of
dictionaries with accompanying sentiment scores. As described above, this might not be
accurate in calculating the sentiment in short bodies of text such as tweets. Further research
might be necessary using a machine learning technique, or after developing a dictionary of
frequently used Twitter words.
2.5 Twitter-Specific Text Analysis
Work by Neethu et al. proposes the preprocessing of tweets before performing sentiment
analysis, particularly when using a feature vector with a machine learning approach[24]. The
preprocessing steps included removing any URLs and avoiding misspellings and slang words.
All misspellings are avoided by replacing the repeated characters with the correct spelling.
Slang words are not removed, as they contribute heavily to the emotion and sentiment of a
tweet. They propose maintaining a slang word dictionary to replace slang words with their
associated meaning. Domain information would need to be learnt to form such a dictionary.
Furthermore, Twitter-specific features are extracted from the tweet’s body and included in
the feature vector. Emoticons are both positive and negative and thus are given different
weights. Existing work by Hogenboom et al. could be exploited to calculate the sentiment
of emoticons in text[7]. Hashtags are further extracted and sentiment analysis is performed
separately, as they too can be both positive or negative. However, without spaces, hashtags
can be difficult to decipher. After preprocessing the tweets and extracting the features they
are left with simple plain text, which is much easier to process and leads to more accurate
results.
9One approach to analysing text is Part-of-Speech tagging. Part-of-speech tagging (POS
tagging) is the process of automatically marking up a token in a text as corresponding to a
particular part of speech based on both its definition and its context[33]. The different POS
tags include nouns, verbs, participles, articles, pronouns, prepositions, adverbs and
conjunctions. Most POS taggers are trained from treebanks in the formal media/newswire
domain, thus standard POS taggers perform poorly on out-of-domain data such as tweets.
Tweets published on twitter pose additional challenges due to their conversational nature,
lack of conventional orthography and strict 280 character limit[34]. For this reason, Gimpel
et al. developed a POS tagger for Twitter that handles twitter specific language structures
such as emoticons, URLs, twitter specific tags, at-mentions, hashtags, as well as slang,
abbreviations and multi-word abbreviations that would not be found in formal media and can
not be mapped to a single traditional POS tag. To do this additional POS tags were included
in their system in addition to the traditional tags described above. This allows for a better
understanding of individual tweets and the word distribution in a collection of tweets.
As mentioned above, emoticons and emoji are crucial in calculating sentiment in short
bodies of informal text such as tweets. Emoticons are a pictorial representation of a facial
expression using characters, usually punctuation marks, numbers and letters, to express a
person’s feelings or mood. For example, the emoticon for a smiley face is : −) or simply
:) , similarly, a sad face is represented by : −( or : ( . Studies have found that whenever
emoticons are used their associated sentiment dominates the sentiment conveyed by the
textual cues, and forms a very good proxy for intended sentiment. Research has
demonstrated that humans are strongly influenced by non-verbal cues in face-to-face
communication[7], and non-verbal cues such as facial gestures, body language have been
shown to dominate verbal cues in face-to-face communication in the case when both types
of cues are equally strong. Hogenboom et al. found that emoticons are used in three
different ways.
• Emoticons can be used to express sentiment when sentiment is not conveyed by with
positive or negative words in a text segment
• Emoticons can further stress sentiment by intensifying the sentiment that is conveyed
by sentiment-carrying words
• Emoticons can disambiguate sentiment in cases where sentiment associated with
sentiment-carrying words needs to be negated
This emphasises the importance of understanding the effects of emoticons and emoji in
social media. Until recently most lexicon-based sentiment analysers discarded all non-text
characters. In short casual texts such as tweets this could entirely change the sentiment of
the text and thus work such as that by Hogenboom et al. will need to be exploited.
103 Method
This chapter describes the implementation and development of a system for generating a
sentiment time series from social media and traditional news articles and the incorporation
of those time series into an autoregressive statistical model with financial data. The system
consists of four main phases, Data Retrieval, Data Processing, Content Analysis and
Statistical Analysis. Each phase and component is discussed in detail and the rationale for
the design choices made are provided. An overview of the system can be seen in Figure 3.1
below.
3.1 Data Retrieval
The first phase of the system deals with collecting, structuring and aggregating text
documents and financial data from online sources. Collecting structured and unstructured
digital text using a computational process means a large volume of text can be collected
relatively easily[35]. Collecting and storing any accompanying metadata and structuring the
text in a consistent manner such as through a JSON schema allows a corpus of text to be
built and processed more efficiently than when left unstructured. For the purpose of this
research, it was necessary to collect three forms of data; social media data, formal media
data and financial data. The process of collecting and aggregating each is discussed in the
following sub-sections.
3.1.1 Social Media Data Retrieval
Social media data in the form of tweets from Twitter were collected and aggregated using
the Twitter Search and Streaming API. Twitter provides a free Search API that searches
against a sampling of recent Tweets published in the past 7 days. A Python client was
developed to retrieve tweets based on different keyword searches. The client retrieves as
many tweets as the API returns, while respecting the API limits of 180 queries every 15
minutes, after which it uses the Streaming API. The Streaming API returns tweets published
11Figure 3.1: An overview of the system implementation consisting of the three main compo-
nents; data retrieval and preprocessing, content analysis and statistical analysis
in real-time based on certain filters/keywords in a low-latency manner. Using a combination
of the Search API and the Streaming API ensures the system is as exhaustive as possible
given the constraints. Each tweet retrieved is processed and saved alongside its relevant
metadata in a MongoDB database. MongoDB is a free and open-source document-oriented
database program which uses JSON-like documents. This allows the tweets to be queried
and aggregated by date, text, user, length, number of retweets and more.
3.1.2 Formal media Data Retrieval
News articles and web publications were collected and downloaded in bulk from LexisNexis
for the specified query. In this case, all English language publications were queried where the
specified keywords appeared in the title and duplicate publications were removed. Access to
this database was covered under an academic license obtained by Trinity College Dublin
12{
" text " : " Ryanair grows in the Middle East with new Jordan
flights https : // t . co / WicJlswzfZ " ,
" created_at " : ISODate (" 2 0 1 8 -0 2 -0 4 T 1 7 : 4 5 : 0 4 . 0 0 0 Z ") ,
" id " : NumberLong ( 9 6 0 2 0 7 5 9 4 1 9 0 2 6 2 2 7 3 ) ,
" favorite_count " : 1 1 6 ,
" user " : {
" users_statuses_count " : 1 6 8 4 3 8 ,
" user_id " : 7 5 9 2 5 1 ,
" user_followers_count " : 3 9 3 0 7 0 9 3 ,
" user_screen_name " : " CNN " ,
" user_name " : " CNN " ,
" user_verified " : true ,
}
}
Listing 3.1: Example of a tweet by CNN that has been retrieved and structured in JSON and
accompanying metadata
(TCD). Access to LexisNexis is available via an API but only with a special licence, not
covered under the academic licence held by TCD, thus this collection and aggregation was
performed manually. The publications are downloaded in chunks of 500 documents in
unstructured text files, a requirement of the sentiment analysis system that is used and
discussed in Section 3.3. To simplify the task of processing and aggregation, a LexisNexis
parser was developed such that the contents of each article could be saved into a MongoDB
database in JSON format. As before, this allows the articles to be easily queried or grouped
by date, author, publisher and text.
3.1.3 Financial Data Retrieval
Firm-specific financial stock data was required for different time periods and at different
frequencies. For daily-frequency data, the historical stock prices could be downloaded from
Yahoo Finance. For convenience, all daily historical data was downloaded for the given firm
such that it could be analysed over different periods if necessary. This included the open and
closing prices for each trading day as well as the daily highs, low s and trading volume. To
allow for high-frequency analysis, 5-minute frequency and 1-minute frequency data was
downloaded from TradeStation. This data included the same values per time period.
133.2 Data Preprocessing
Before performing sentiment analysis or statistical analysis on either corpus of text some
pre-processing was required to aggregate the data and filter out any off-topic data
points.
3.2.1 Language Detection
The metadata that arrived with each tweet from the Twitter APIs included the language of
the user who published the tweet, but after a quick analysis of the data, it was discovered
that this was not always consistent with the language of their tweets. Given that this
research is only interested in English language text, each tweet needed to be reclassified into
its respective language before being stored. The language was determined using the langid
library developed at the University of Melbourne by Lui & Baldwin[36]. The library identifies
the most probable language for a given tweet and accompanies it with a confidence score in
the range of 0 to 1. The system accepted all tweets determined to be English with a
confidence score above 0.9. This was found to be highly effective in determining the
language of individual tweets and the number of valid tweets discarded was negligible.
3.2.2 Tweet Corpus Export
The corpus of tweets needed to be exported in a format that could be processed by the
sentiment analysis system described in Section 3.3. This required the development of a
script that would process the database of tweets and print them to text files, with the
relevant meta-data in the same unstructured format as LexisNexis. Tweets were exported in
chronological order (oldest first) in blocks of up to 150,000 tweets so that the system wasn’t
overloaded with too much data. Before writing the tweet’s contents to the file the body of
the tweet was cleaned to remove any URLs, mentions, and newline characters as suggested
by Neethu et al[24]. Hashtags and emoticons/emojis were left as is.
3.3 Content Analysis
Content analysis is used in the text analysis component of the system to extract and
measure information from both text corpora. An existing sentiment analysis solution, named
Rocksteady, developed by the Trinity College Dublin is used for sentiment analysis.
Rocksteady is a lexicon based, affect analysis system that uses a combination of general
purpose affect dictionaries, like Stone’s General Inquirer (GI) Dictionary, and an optional
14domain-specific dictionary[37]. It is based on the work done by computational linguists in
the past half-century, whereby it identifies grammatical categories of words within text to a
high degree of accuracy. The system understands that rose, rise, risen and rising are the
morphological variants of the same root rise. Similarly, Rocksteady can identify that the
word share, when used in financial texts, is a noun rather than a verb. This process is known
as automatic syntactic analysis[11]. It is necessary to also include a domain-specific
dictionary because, in some cases, the meaning of a term changes depending on the context.
A term that is typically negative in a general language context may have another meaning in
a domain text[35]. For example, the word crude is categorised as negative by the GI
dictionary, but when used in the context of oil, the term crude oil is neither negative or
positive. Thus, the inclusion of a domain-specific affect dictionary overwrites the sentiment
value of the standard GI dictionary. Rocksteady is predominately used to evaluate the
frequency of words categorized as negative in the GI dictionary. This category is the main
sentiment or affect category studied in the domain of finance, primarily due to theories of
overreaction from investors to negative news, the so-called asymmetric response to news[38].
The GI dictionary contains a unique list of 2,005 single word terms. The list of financial
negative and positive words by Loughran and McDonald[39] is included as a domain glossary
to reduce the interpretation of financial terms.
Figure 3.2: System diagram of the text analysis component that outputs a sentiment time
series from a corpus of structured text
3.3.1 Automatic Affect Dictionary Creation
To develop an affect dictionary for the airline industry, and in particular, Ryanair - the focus
of the case study in Chapter 4, the corpus of collected tweets is analysed. Each tweet is
parsed with the part-of-speech tagger developed by Gimpel et al. described in Section 2.4.
This splits each tweet into words/tokens and identifies the part-of-speech (POS) of each
token. Then the frequency of each token for a given POS is calculated. A sample tweet is
presented in Table 3.1 illustrating how a tweet is tokenised (split into words, emojis,
punctuation, URLs etc) and tagged with a POS tag and the confidence of the tag. To gauge
15the specificness of a certain word to the domain in question the weirdness ratio of each
token is calculated. The weirdness ratio of a word, a concept developed by Ahmad, is a
comparison of the relative frequency of a word in a given corpus to the relative frequency of
the word in a general corpus, such as the British National Corpus (BNC).
Ft,c
Nc
Wt = (1)
Ft,BNC
NBNC
The formula for weirdness is defined above in Equation 1 where Ft,c is the absolute
frequency of token t in the corpus c, Nc is the number of tokens in c. Ft,BNC and NBNC are
the absolute frequency of the token and the total number of tokens in the BNC. A weirdness
value equal to one suggests that the relative frequency of the token is equal in both corpora.
A weirdness value much greater than one suggests the token is used much more frequently
(relatively) in corpus c and thus that token could be a domain-specific token and a carrier
term. Tokens with a weirdness ratio of infinity do not appear in the BNC and are considered
new words, slang words or misspellings.
The common nouns, identified by the POS-tagger, are then extracted from the distribution
of words. High-frequency common nouns with high weirdness values are considered the
domain-specific carrier terms. To identify these carrier terms the z-scores of both frequency
(zf ) and weirdness (zw ) are calculated for each term and terms with zf > 0 and zw > 0 are
extracted and included in the domain-specific affect dictionary. This allows for the
automatic creation of an affect dictionary allowing Rocksteady to analyse domain specific
affect words and overwrite negative terms which are neutral in the domain context.
3.3.2 Sentiment Analysis
Rocksteady takes, as input, a corpus of text in the format supplied by LexisNexis downloads
and aggregates the ‘articles’ by date at a chosen frequency. It produces a time series of the
percentage of negative terms (or any other affect category) for each given time period. Thus
a sentiment time series of the twitter corpus was constructed from the twitter corpus export
described in Section 3.2.2 for both a daily frequency, a 5-minute frequency and a 1-minute
frequency. Similarly, a sentiment time series of the news corpus was constructed at a daily
frequency. A sample of Rocksteady’s input/output can be seen in Figure 3.2 below, where
three tweets were preprocessed and analysed for negative sentiment.
16Table 3.1: Sample tweet by BALPApilots tagged by part-of-speech
Token POS-Tag Description Confidence
RT ∼ Discourse marker 0.9979
@eu_cockpit @ At-mention 0.9983
: ∼ Discourse marker 0.9800
#Ryanairpilots # Hashtag 0.6261
ask V Verb 0.9817
for P Pre/postposition 0.9966
something N Common noun 0.9843
eminently R Adverb 0.9998
reasonable A Adjective 0.9987
& & Coordinating conjunction 0.9950
simple A Adjective 0.8252
: , Punctuation 0.9757
social A Adjective 0.9698
dialogue N Common noun 0.9985
+ & Coordinating conjunction 0.6648
permanent A Adjective 0.8784
, , Punctuation 0.9983
direct A Adjective 0.9277
local A Adjective 0.6886
contracts N Common noun 0.9995
https://t.co/WicJlswzfZ U URL or e-mail address 0.9920
3.4 Statistical Analysis
The pricing data obtained through Yahoo Finance and TradeStation is used to calculate the
returns for each time period (daily, 5-minute, 1-minute). Logarithmic returns are used
instead of comparing closing prices for normalisation purposes as it allows assets of unequal
value to be transformed into a metric that is comparable[35] and logarithmic returns are
symmetric. This means positive and negative percent logarithmic returns of equal magnitude
cancel each other out and result in no net change, whereas ordinary returns of equal
magnitude but opposite signs will not cancel each other out. The logarithmic return at time
t is calculated as follows:
ct
rt = ln (2)
ct−1
where ct is the closing price of a financial asset at time t. The pricing time series was then
aggregated and aligned with the sentiment time series produced by Rocksteady at the
relevant frequencies by the statistical modelling system developed in R, adjusting for time
zone differences. The z-score of the sentiment variable is calculated, to make it easier to
17Table 3.2: Example output after prepossessing and performing sentiment analysis on 3 sample
tweets using Rocksteady, where terms identified as negative are highlighted in red
Text Terms %Negative
Belgian Minister of Mobility confirms Ryanair strategy to avoid
paying Brussels Region noise fines https://t.co/qRl9Gn7sV3
https://t.co/WcL8h0u1hE
belgian minister of mobility confirms ryanair strategy to avoid 14 21.43%
paying brussels region noise fines
40 min delay. No communication #ryanair #fail #worstairli-
neever
40 min delay . no communication ryanair fail worstairlineever 8 25.00%
flying @tapairportugal is an expensive @Ryanair experience | the
most inefficient boarding system I’ve experienced, they need
@Peguha to fix that | in the meantime avoid avoid avoid #fre-
quentflyer
flying is an expensive experience the most inefficient boarding 25 24.00%
system i ve experienced they need to fix that in the meantime
avoid avoid avoid frequentflyer
interpret any relationships with the financial variables. Calculating the z-score standardises
the series to have zero mean and unit variance, with a distribution centred on zero. The
z-score for a time series is calculated as so:
x −µ
z= (3)
σ
where x is the time series or vector of data, µ is the average of x, σ is the standard
deviation of x. The statistical analysis system starts by exploring the individual data series
by calculating the correlation coefficients between different variables in the time series,
including returns, the percentage of negative tokens (sentiment), trade volume and tweet
volume. This uses Pearson’s Correlation Coefficient method to measure the linear
correlation between two variables X and Y. It produces a correlation coefficient between -1
and +1, where +1 is a total positive linear correlation, 0 is no linear correlation, and -1 is a
total negative linear correlation. The equation used to calculate the coefficients is given
18below in Equation 4.
− x̂)(y − ˆ(x))
Pn
i=1 (xi
r = pPn pPn (4)
2 2
i=1 (xi − x̂) i=1 (yi − ŷ )
Furthermore, the system calculates the autocorrelation of returns for 5 lags using Pearson’s
method. Autocorrelation measures the linear dependence of a variable with lagged values of
itself. The autocorrelation function (ACF) is important in identifying and characterising
linear effects that may be present in a time series.
The 5-minute time series is divided into days such that the volatility for a given day can be
calculated. In finance, volatility, σ, can be calculated in many ways. Basic volatility, in
finance, is defined as the degree of variation of a trading price series over time as measured
by the standard deviation of logarithmic returns. According to Rogers and Satchell, in
certain situations, such as intraday trading, volatility methods based on high/low,
open/close prices are preferred[40]. Thus, Rogers’ and Satchell’s volatility estimator
(Equation 5 below) is calculated for each trading day. Similarly, the 1-minute data is divided
into hours and the volatility of each hour is calculated. This volatility time series is a proxy
for investor uncertainty, and thus a spike in volatility should represent a period of large
investor uncertainty. The respective time series are used to compare volatility against the
volume of tweets and trades at different frequencies.
v
u
u1 X N
hi hi li li
σ=t (ln )(ln ) + (ln )(ln ) (5)
N i=1 li oi ci oi
Finally, a multivariate analysis of the financial time series is performed. Vector
autoregression (VAR) is chosen as the method for multivariate analysis, to determine any
inter-relationships between financial variables and sentiment variables. The advantage of
VAR modelling is that it does not require as much knowledge about the forces influencing a
variable as with structural models such as simultaneous equations. The only prior knowledge
required is a list of variables which can be hypothesized to affect each other intertemporally.
However, before calculating the VAR model, the univariate model, defined in Equation 6
below, is analysed.
rt = α0 + α1 rt−1 + t (6)
where rt is the return at time t, α is a coefficient, is the residual term assumed to have
constant mean and variance.
Typically autoregressive financial models consider 5-time lags of variables, thus the first
19You can also read